



Abstract
Laws that regulate the conduct of professional lobbyists in statehouses across the nation are one attempt to ensure that citizens’ opinions receive more equal consideration when elected officials make policy decisions. Do states with stricter lobbying regulations actually display more egalitarian patterns of political representation? Using public opinion measures from the National Annenberg Election Surveys and data on state policies, this article first demonstrates that state policy decisions are consistently more proximate to the opinions of affluent citizens. I then evaluate the relationship between the stringency of state lobbying regulations and representational equality across the states and find evidence that states with stricter regulations weigh citizens’ opinions more equally in the policymaking process. These findings suggest that lobbying regulations can play an important role in promoting greater political equality.
There is growing concern among social scientists, policymakers, and the general public about unequal political influence and its consequences for economic inequality in the United States (Bartels, 2008; Flavin, 2012; Gilens, 2012; Gilens & Page, 2014; Jacobs & Skocpol, 2005; Kelly, 2009; Kelly & Witko, 2012). One common explanation for why affluent citizens tend to be more successful at getting their preferences translated into policy is that industries that tend to share their opinions (finance, real estate, etc.) are well represented among professional lobbyists in Washington and statehouses across the nation (Hacker & Pierson, 2010). In contrast, disadvantaged citizens do not enjoy the same level of representation among professional lobbyists, and correspondingly exert less influence over the policy decisions made by elected officials. In response to these perceived inequities, laws that regulate the registration and conduct of professional lobbyists are one attempt to lessen the influence of wealthy interests and ensure that citizens’ opinions receive more equal consideration when elected officials make important policy decisions. 1
Are lobbying regulations actually effective at enhancing the equality of political representation? This question is difficult to answer at the federal level because one uniform set of laws regulates professional lobbyists in Washington and changes in those laws that occur over time are contemporaneously correlated with many other changes in the political system. In comparison, the 50 states vary dramatically in terms of how much, or little, they regulate the registration and conduct of professional lobbyists (Brinig, Holcombe, & Schwartzstein, 1993; Newmark, 2005; Opheim, 1991; Ozymy, 2013). For example, some states have few regulations on lobbying activities whereas other states have enacted strict requirements for lobbying disclosure, rules governing when lobbyists can meet with legislators, and limits or outright bans on the gifts lobbyists can give to elected officials.
Despite the important implications for the quality of American democracy, no study to date has evaluated whether stricter lobbying regulations correspond to more egalitarian patterns of political representation. This article uses the variation across the 50 American states to examine the relationship between lobbying regulations and the equality of political representation and uncovers evidence that stricter regulations are associated with greater political equality. Specifically, states with more stringent lobbying regulations tend to exhibit a weaker relationship between income and political influence. These findings contribute to our understanding about the potential effects of lobbying regulations and ultimately underscore the important role that laws and institutional design can play in promoting greater political equality in the United States.
Background and Theoretical Expectations
Professional lobbyists are increasingly active in statehouses across the nation (Newmark, 2005; Ozymy, 2010; Rosenthal, 2001). Regardless of the interests they represent, among the most valuable assets a lobbyist can provide to state legislators and their staffs is rigorously researched information about a particular policy area. Given the resource-constrained environment many state legislators operate within (Squire, 2007), this information can be of great value in helping them to decide which issues to prioritize and, ultimately, how to cast their vote on pending legislation. In an ideal world where all interests in society received equal representation and attention from professional lobbyists, they would play an indispensable role in ensuring that public opinion gets accurately translated into public policy outputs. However, a series of studies over several decades have documented the high proportion of business and other for-profit interests among lobbyists, interest organizations, and political action committees (Gray & Lowery, 1996; Schattschneider, 1960; Schlozman & Tierney, 1986; Thomas & Hrebenar, 1990). As Gray, Lowery, Fellowes, and McAtee (2004) assert, “It is clear that the distribution of interests represented before government is not isomorphic with the distribution of interests in society” (p. 412). 2
Perhaps because of the perceived inequities in political influence, there is a deep mistrust of lobbyists among the general public in the United States (Cigler & Loomis, 2007) and many citizens feel that organized interests exert too much special influence over the policy decisions made by elected representatives (Nownes, 2001). To combat this concern among the general public and to attenuate the political influence of organized interests, states have (to various degrees) attempted to regulate the conduct of lobbyists by mandating lobbyist registration, enacting financial disclosure laws and limits on honoraria and gifts (Newmark, 2005; Rosenthal, 2001), and by creating independent ethics commissions to scrutinize the conduct of lobbyists and the legislators they attempt to influence (Rosenson, 2003, 2005).
Despite the recent proliferation of these lobbying regulations in the states, there have been surprisingly few attempts to evaluate their substantive effects on state politics and policymaking in general and on the equality (or lack thereof) of political influence in particular. The small set of studies to date that examine the consequences of lobbying regulations in the states have tended to focus on their effects on the size (Hamm, Weber, & Anderson, 1994; Lowery & Gray, 1997) and composition/diversity (Gray & Lowery, 1998; Lowery & Gray, 1993) of a state’s interest group community as well as on the passage rate of bills in a state’s legislature (Brinig et al., 1993). One notable exception is Ozymy’s (2010) analysis of the effect of lobbying regulations on the perceptions of state legislators. Using data on the number of lobbying regulations a state has enacted and a 1995 opinion survey of state legislators, he finds evidence that legislators perceive interest groups exert less influence over legislative outcomes in states with stricter regulations on lobbyists. In addition, legislators are more likely to report that the influence of organized interests has lessened in the past 2 or 3 years in states that recently increased the scope of their regulations on lobbying. In short, Ozymy provides compelling evidence that stricter regulations on lobbyists generate an environment where state legislators perceive greater equality in political influence.
To extend the logic above to the actual policy decisions made by state elected officials, this article asks, “Do states with stricter lobbying regulations display more egalitarian patterns of political representation?” From a theoretical perspective, tighter restrictions on registration, disclosure, and gift giving should lessen the extent to which lobbyists have access to state policymakers and, by extension, attenuate the political influence of organized interests who tend to over-represent the opinions of wealthier citizens. Therefore, it is expected that states with stricter lobbying regulations will have more egalitarian patterns of political representation. In what follows, I empirically evaluate the relationship between the strictness of regulations and the degree to which the political opinions of the wealthy and poor are equally reflected in the policy decisions made by state elected officials. Specifically, I investigate whether states that more strictly regulate the conduct of professional lobbyists tend to exhibit a weaker relationship between higher incomes and greater opinion–policy congruence. This analysis contributes to our understanding about the potential effects of state lobbying regulations and, more generally, the role that laws and institutional design can play in promoting greater political equality.
Evaluating the Equality of Political Representation in the States
Although political representation is central for American democracy, there is little consensus on how best to measure the concept. For years, political scientists have experimented with different ways of evaluating the link between the people and their government (Achen, 1978). One crucial distinction has been whether public opinion is compared with the behavior of individual elected officials (Achen, 1978; Bartels, 1991; Clinton, 2006; Erikson, 1978; Miller & Stokes, 1963; L. W. Powell, 1982) or with the content of public policies (Erikson, Mackuen, & Stimson, 2002; Erikson, Wright, & McIver, 1993; Page & Shapiro, 1983; Wlezien, 2004). This article focuses on the latter, policy representation, because government policy is the final link of the chain that begins with citizens’ inputs (their political opinions and behaviors) into the political system. More importantly, regardless of how a citizen’s particular state house member or senator votes on any given bill in the state legislature, citizens are ultimately affected by the decisions of the legislature as a whole and the actual policies that are implemented.
Policy representation is measured using a proximity technique that places public opinion and policy on the same linear scale and compares the distance between the two (Achen, 1978). 3 Using this method, as the ideological distance between a citizen’s opinion and policy grows (i.e., policy is ideologically “further” from a citizen’s preferences), that citizen is not well represented. A substantively similar measurement technique has been used in several recent studies to evaluate the ideological distance between citizens and Member of Congress (Ellis, 2012, 2013; Griffin & Flavin, 2007; Griffin & Newman, 2007, 2008), Senators (Gershtenson & Plane, 2007), and presidential candidates (Burden, 2004; Jessee, 2009) in the United States as well as the ideological distance between citizens and political parties in Europe (Blais & Bodet, 2006; Giger, Rosset, & Bernauer, 2012; Golder & Stramski, 2010; G. B. Powell, 2009). As an illustration, Figure 1 compares two hypothetical citizens, Citizen A and Citizen B, who both live in the same state. When the two citizens’ political ideologies are placed on the same metric as state policy, there is less ideological distance between Citizen A and state policy as compared with Citizen B and state policy. Under the proximity conceptualization of policy representation, Citizen A is better represented than Citizen B.

Computing ideological distance between opinion and policy.
To measure ideological proximity, two pieces of data are required: (a) a measure of citizens’ opinions and (b) a measure of state policy. To measure public opinion, I combine data from the 2000, 2004, and 2008 National Annenberg Election Surveys (NAES), three random digit dialing rolling cross-sectional surveys conducted in the months leading up to that year’s presidential election. For years, scholars of public opinion in the states have wrestled with the problem of not having enough respondents in public opinion polls to make reliable state-level estimates and inferences. One way to address this problem is to pool surveys over a long period of time (Erikson et al., 1993). Another way is to simulate state opinion by using national polls and multi-level modeling to derive estimates for the states based on demographic characteristics (Lax & Phillips, 2009a, 2009b; Park, Gelman, & Bafumi, 2006). The major advantage of pooling these three NAES surveys is their sheer sample size that allows a large enough sample without having to aggregate across a long time period or simulate state opinion (Carsey & Harden, 2010). 4 This large sample size is especially important because this article later assesses the relationship between income and ideological proximity within individual states. 5
Citizens’ general political ideology is measured using the following item from the NAES: “Generally speaking, would you describe your political views as very conservative, conservative, moderate, liberal, or very liberal?” The 5-point measure is coded such that it runs from −2 (very conservative) to +2 (very liberal). Data on citizens’ self-reported political ideology have been commonly used to measure public opinion in previous studies of political representation (e.g., Bartels, 2008; Erikson et al., 1993; Flavin, 2012; Griffin & Flavin, 2007) and there is reason to be confident that self-reported ideology is an accurate measure of citizens’ aggregated policy-specific opinions. For example, Table 1 displays the percentage of respondents from the 2000 and 2004 NAES who report a particular opinion categorized by their self-reported political ideology. 6 Looking across the columns, it is clear that respondents who identify themselves as liberal are more likely to report liberal policy opinions. For example, only 38% of respondents who place themselves in the “very conservative” category believe that “Government should reduce income differences between rich and poor.” In contrast, fully 77% of respondents who place themselves in the “very liberal” category support that policy proposal. These differences across ideological classifications suggest that self-reported ideology is a reasonably accurate measure of citizens’ operational policy opinions.
Political Ideology and Specific Policy Opinions.

Source. 2000 and 2004 National Annenberg Election Surveys.
Next, assessing public policy requires a general measure of the “liberalism” (Klingman & Lammers, 1984) of state policy outputs that comports with the survey item that asks citizens to report their general political ideology. In their seminal book on state opinion and policy, Erikson et al. (1993) developed a composite index of state policy liberalism using eight policy areas for which liberals and conservatives typically disagree. Gray et al. (2004) updated this policy liberalism measure for 2000 using the following five policy items: (a) state regulation of firearms as measured by state gun laws, (b) scorecard of state abortion laws in 2000, (c) an index of welfare stringency that accounts for Temporary Assistance to Needy Families (TANF) rules of eligibility and work requirements for 1997-1999, (d) a dummy measure of state right-to-work laws in 2001, and (e) a measure of tax progressivity calculated as a ratio of the average tax burden of the highest 5% of a state’s earners to the average tax burden of the lowest 40% of a state’s earners. 7 These five components are then standardized and summed in an additive index such that more liberal state policies are coded higher. This index is used as the first measure of the general ideological tone of state policy.
Second, a recent article by Sorens, Muedini, and Ruger (2008) provides a rich source of data on state policies in 20 different areas ranging from public assistance spending to gun control to health insurance regulations. 8 In addition to specific statutes and spending data, the authors provide a summary index of policy liberalism for each state that they derive by factor analyzing their entire range of policies. This composite score is used as a second measure of general policy liberalism. 9 Together, the two policy liberalism measures represent the uni-dimensional liberal/conservative ideology of state policy decisions that correspond well to the measure of citizens’ general political ideologies described above.
Evaluating ideological proximity requires a method of placing citizens’ opinions and state policy on a common scale for comparison (see Figure 1). Drawing on previous studies that also used the same proximity technique to measure political representation (Achen, 1978; Blais & Bodet, 2006; Burden, 2004; Ellis, 2012, 2013; Gershtenson & Plane, 2007; Giger et al., 2012; Golder & Stramski, 2010; Griffin & Flavin, 2007; Griffin & Newman, 2008; Jessee, 2009; G. B. Powell, 2009), this article approaches the task in three different ways. If all three measurement techniques point to the same conclusion, then we can be more confident in the robustness of the results. 10
First, all ideological opinions are standardized to a mean of 0 and a standard deviation of 1, and the two recent measures of general state policy liberalism described above (Gray et al., 2004; Sorens et al., 2008) are then standardized as well. After standardizing both opinion and policy, they are now on a common (standardized) metric, similar to the strategy used by Wright (1978). Proximity is measured as the absolute value of the difference between a respondent’s ideology score and the policy liberalism score for his or her state using both of the measures of policy. This creates the first measure of ideological distance for each respondent in the NAES sample that is labeled the Standardized measure.
Second, the two measures of state policy are rescaled to the same scale (−2 to +2) as citizens’ self-reported ideology. This technique is similar to that used in early studies of congressional representation (Achen, 1978; Miller, 1964) and one that is still advocated by representation scholars today (Burden, 2004; Griffin & Newman, 2008). The absolute value of the distance between a respondent’s ideology score and the policy liberalism score for his or her state is again computed and labeled the Same Scale measure.
Third, policy is rescaled to a tighter range (−1 to +1) than citizens’ ideologies. This procedure is used because we can expect citizens’ ideological opinions to have a wider range and take on more extreme values compared with actual state policy outputs. This transformation to a tighter scale is suggested and implemented by L. W. Powell (1982, 1989) in her studies of congressional representation. Again, the absolute value of the distance between a respondent’s ideology score and the state policy liberalism score for his or her state is computed and labeled the Restricted Scale measure.
Together, there are three different measurement techniques and two different measurements of state policy liberalism, for a total of six different measures of ideological proximity between citizens’ opinions and state policy. I am then interested in whether there are systematic differences in proximity between opinion and policy across citizens, specifically, whether there is a link between a citizen’s income and the ideological distance between opinion and policy. Because I am interested in unequal political representation within each state and state populations can vary widely in terms of their income distribution, it would be unwise to simply compare the incomes of citizens in one state with the incomes of citizens in another state. Simply put, we might expect someone making $100,000 per year living in West Virginia to exert comparatively greater political influence than someone making $100,000 per year living in Connecticut. To account for differences in the income distribution across states, I generate a measure of state relative income that compares a respondent’s income with the average income for a resident in his or her state. A positive score for state relative income indicates that a respondent is above the mean whereas a negative score indicates that a respondent is below the mean.
Armed with this measure of state relative income, I then assess whether there is a systematic relationship between citizens’ incomes and the ideological distance between their opinion and state policy. To evaluate this relationship, I regress the measure of ideological distance on income for every respondent in the sample using the six different measures of ideological proximity described above. 11 The results of these six regression estimations are reported in Table 2. Reading across the six columns reveals strong evidence of unequal political representation. Specifically, all six coefficients for income are negative and bounded below zero which indicates that as a respondent’s income increases, the distance between their ideology and state policy decreases and they are better represented. Put another away, the lower a respondent’s income, the greater the distance between opinion and policy and the worse that respondent’s general political ideology is represented in the general liberalism of his or her state’s public policies. Substantively, the larger opinion–policy distance for a respondent at the 10th percentile for income compared with a respondent at the 90th percentile is about the same as the difference between a respondent at the 10th percentile for (state relative) level of education compared with the 90th percentile (Gilens, 2005) and larger than the difference between an African American respondent compared with a White respondent (Griffin & Newman, 2008). These findings comport with the small but growing set of studies (Flavin, 2012; Rigby & Wright, 2011, 2013) that have found that citizens with low incomes are systematically underrepresented in the policymaking process in the American states.
Income and Ideological Distance Between Opinion and Policy.

Note. Dependent variable: linear distance between a citizen’s ideology and state policy (smaller distance indicates a citizen is better represented). Cell entries are ordinary least squares regression coefficients with standard errors adjusted for clustering by state reported beneath in brackets. GLFM = Gray, Lowery, Fellowes, and McAtee (2004); SMR = Sorens, Muedini, and Ruger (2008).
p < .10. **p < .05. ***p < .01, using a two-tailed test.
As discussed above, the primary rationale for examining unequal political representation at the state level is to understand and explain variation in political equality across the states. To assess in which states political influence is strongly tied to income compared with those states that weigh opinions more equally, I run a separate regression for each state and compare the coefficient for (state relative) income. Similar to the nationwide regression reported in Table 2, a more steeply negative slope coefficient indicates a stronger relationship between income and ideological distance and, accordingly, less political equality. For example, consider the two hypothetical states presented in Figure 2. For each state, the line represents the slope of the relationship between income and ideological distance. As the figure illustrates, the relationship between income and distance is rather weak in State C, indicating that citizens’ opinions are weighted roughly equally regardless of their income. In contrast, the slope of the relationship between income and ideological distance is quite steeply negative for State D, indicating that there is a strong degree of political inequality in state policymaking.
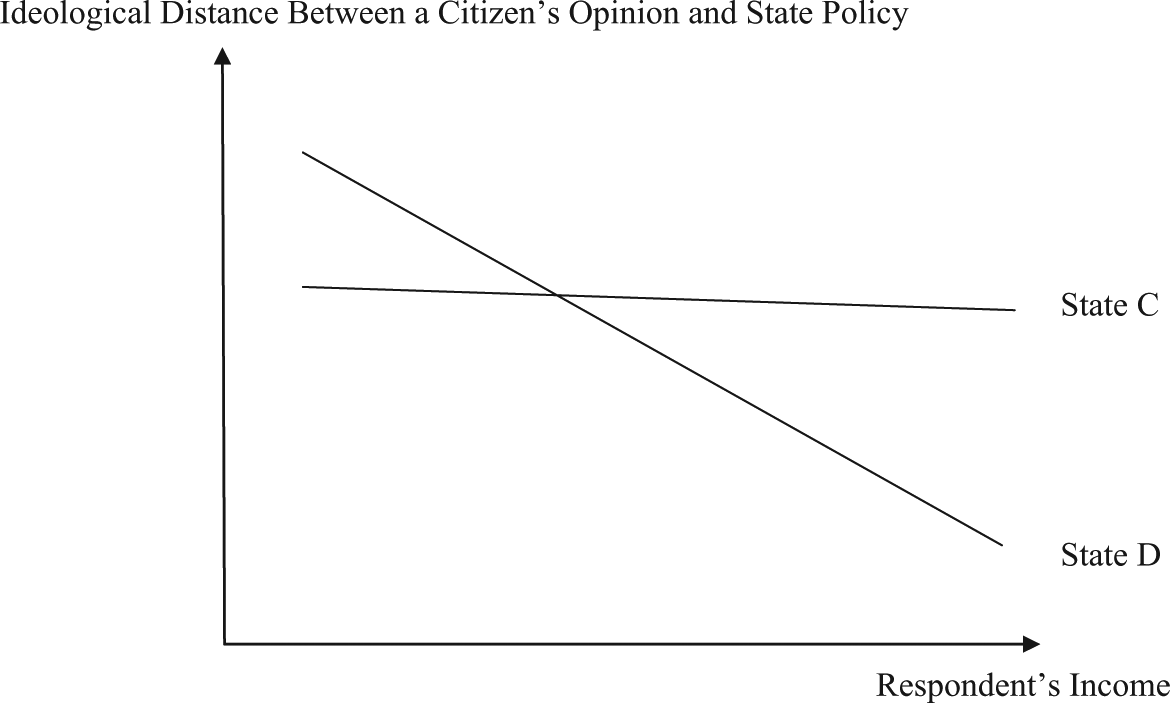
Computing the effect of income on ideological distance, by state.
A separate regression is run for each state using each of the six different measures of ideological proximity described above (three measurement techniques × two measures of state policy liberalism). 12 The six regression coefficients (for state relative income) have a Cronbach’s alpha of .96, indicating that all six measures appear to be measuring the same concept. To create a single summary score of political equality that is directly comparable across states, I conduct a principal components analysis on the six slope coefficients and generate a single factor score for each state. 13 Because a more steeply negative slope coefficient indicates more unequal representation (i.e., a stronger relationship between income and ideological distance), a more positive factor score indicates greater political equality (i.e., a more equal weighting of citizens’ opinions). This new measure is labeled the “Political Equality Index.”
The factor scores generated using this procedure are reported in Table 3 where the states are ranked from the most to least equal in terms of political representation. It is important to note that the index is not simply an alternative measure of the liberalism of state policy (with the expectation that lower income citizens support more liberal policies). The Political Equality Index correlates with the Gray et al. (2004) policy liberalism measure at .47 and with the Sorens et al. (2008) policy liberalism measure at only .37. Most important, however, is the fact that there is significant variation in political equality across the states. In the following section, I use this variation to evaluate whether states with stricter lobbying regulations tend to display more egalitarian patterns of political representation.
Ranking the States by the Equality of Political Representation.
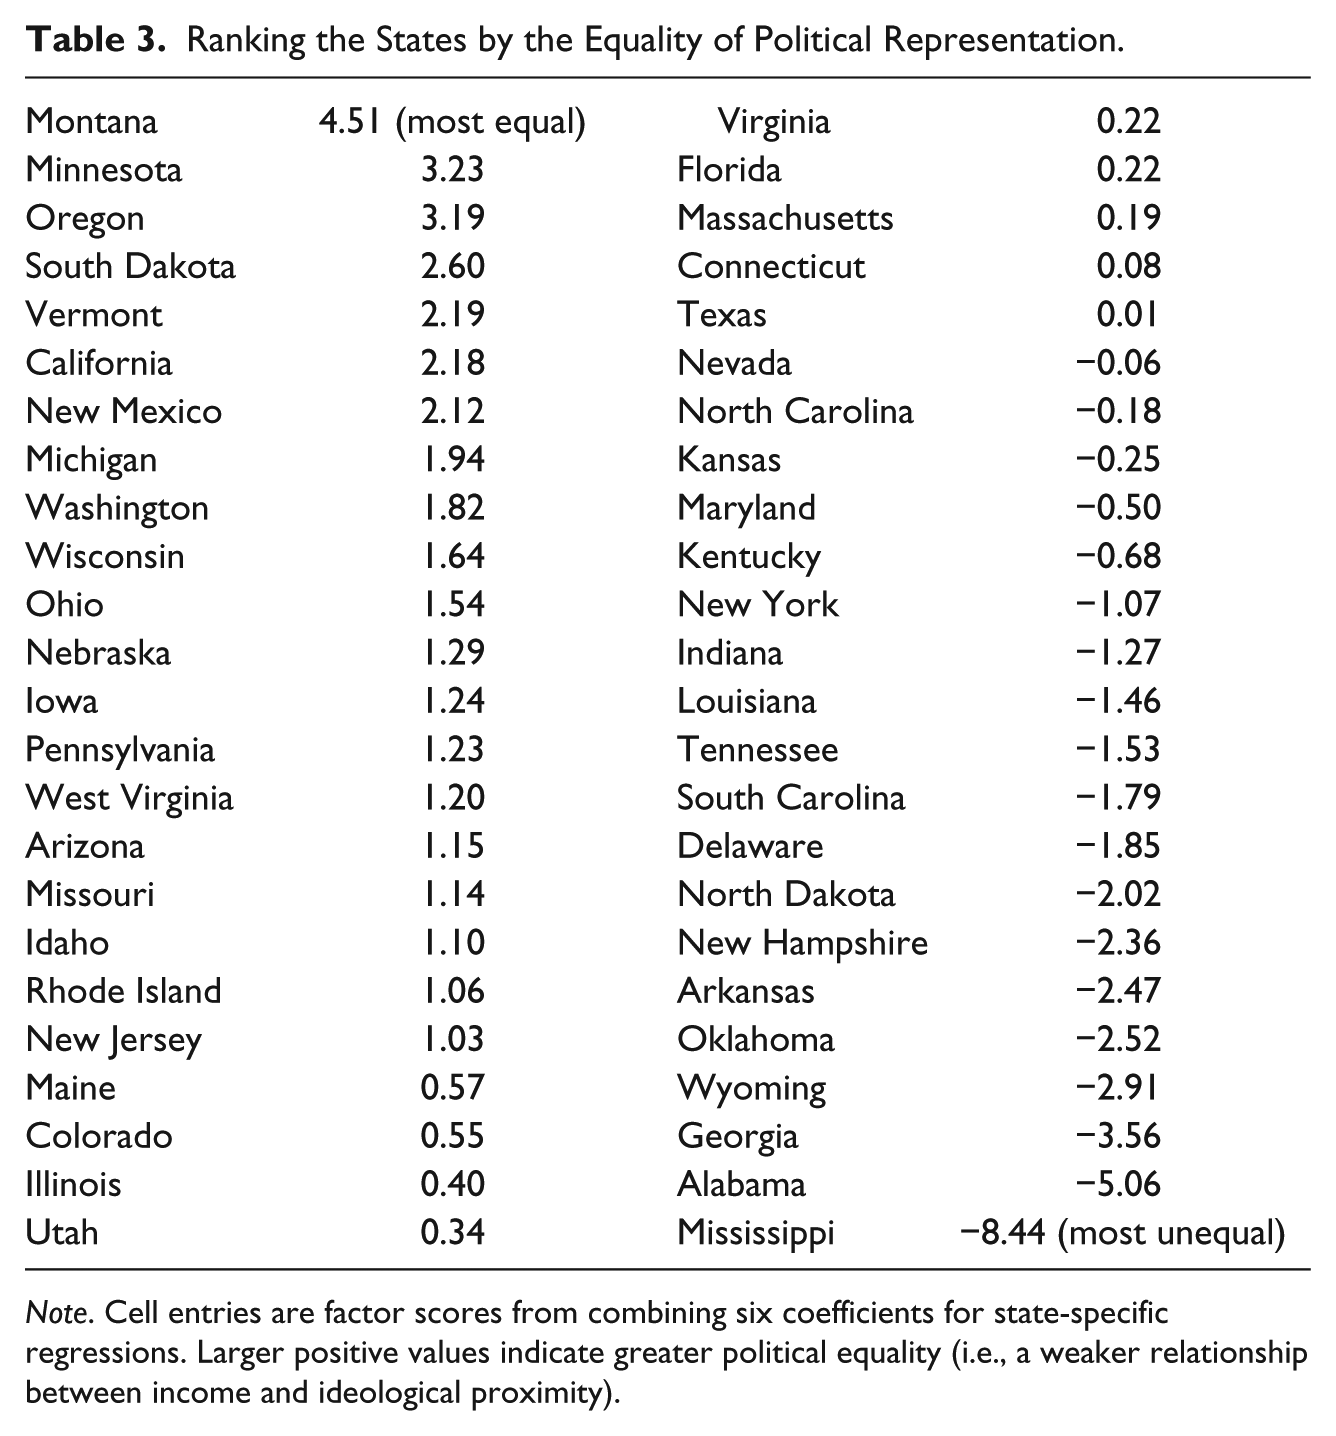
Note. Cell entries are factor scores from combining six coefficients for state-specific regressions. Larger positive values indicate greater political equality (i.e., a weaker relationship between income and ideological proximity).
State Lobbying Regulations and the Equality of Political Representation
State efforts to regulate the activities of lobbyists take several forms. As Ozymy (2010) summarizes, “Legislative lobbying regulations structure the relationship between lobbyists and state legislators by defining lobbyists for purposes of registration, mandating reporting requirements, and creating prohibitions or limitations on gifts, rules for campaign contributions, and statutory definitions for conflicts of interest” (p. 398). Unfortunately for state politics researchers, there have been few efforts to systematically catalog the scope and intensity of regulations across the states to allow for rigorous comparative analysis. The one important exception is Newmark’s (2005) study that uses information on “statutory definition, prohibited activities, and disclosure requirements (including the frequency of registration and reporting)” (p. 184) to measure the strictness of state lobbying regulations. Specifically, Newmark creates an additive index for each state ranging from 0 to 18 (with higher numbers indicating more regulations) that catalogs the number of different groups required to register as lobbyists, the frequency of reporting requirements, the types of activities that are prohibited, and disclosure requirements. Data are collected on a biennial basis from the Book of States for 1990-2003. Because the data on the equality of opinion–policy representation in the states are from the 2000-2008 timeframe, I use Newmark’s additive measure of lobbying regulations for 2000-2001 that has a mean of 10.34, a standard deviation of 3.17, and ranges from 1 (North Dakota) to 17 (South Carolina) across the states. 14
In the analysis presented below, the Political Equality Index (described above) is regressed on the number of state lobbying regulations to evaluate if states with stricter regulations on lobbyists have more egalitarian patterns of political representation. Along with the strictness of state lobbying regulations, I also include in the model a measure of income inequality in a state, the degree of electoral competitiveness, the composition of a state’s interest group community, and the partisan composition of state government. A state’s level of income inequality is measured using the Gini coefficient for 1999 (data from the U.S. Census Bureau 15 ) and is included because previous research on unequal political influence at the state level suggests that political representation is the least egalitarian in states with higher levels of income inequality (Rigby & Wright, 2011, 2013). 16 State electoral competition is measured using Holbrook and Van Dunk’s (1993) index that uses district-level state legislative election results to account for the average margin of victory along with the presence of uncontested and “safe” seats. It is included in the model because previous research suggests that disadvantaged citizens receive more favorable policy representation when there is greater competition between candidates/parties for elected office in a state (Barrilleaux, Holbrook, & Langer, 2002; Brace & Jewett, 1995; Key, 1949; Soss, Schram, Vartanian, & O’Brien, 2001). The composition of a state’s interest group environment is measured as the percentage of organized groups in 1997 that represent for-profit interests (measure devised by Gray & Lowery, 1996; updated for 1997 by Gray et al., 2004) and is included because previous research indicates that a greater proportion of for-profit groups attenuates the link between public opinion and state policy outputs (Gray et al., 2004). Finally, the partisan composition of state government is measured as the average percentage of Democrats in the state legislature for 2000 to 2006 and is included because previous research suggests that the opinions of low-income citizens receive comparatively greater attention from Democratic politicians (Bartels, 2008). 17
Column 1 of Table 4 reports the coefficient estimates from regressing the Political Equality Index on the independent variables described above. The coefficient for number of lobbying regulations is positive and statistically different from zero, indicating that lobbying regulations are an important predictor of political equality. Specifically, states with stricter regulations on lobbyists tend to weigh citizens’ opinions more equally in the policymaking process. In addition, the other covariates in the model reveal that states with more competitive elections tend to be more politically equal whereas states with a greater proportion of for-profit interest groups tend to be less politically equal. Interestingly, the coefficient for the percentage of Democrats in the state legislature is not statistically different from zero, indicating that there is little evidence that the partisan composition of state government is associated with the equality of political representation.
State Lobbying Regulations and the Equality of Political Representation.
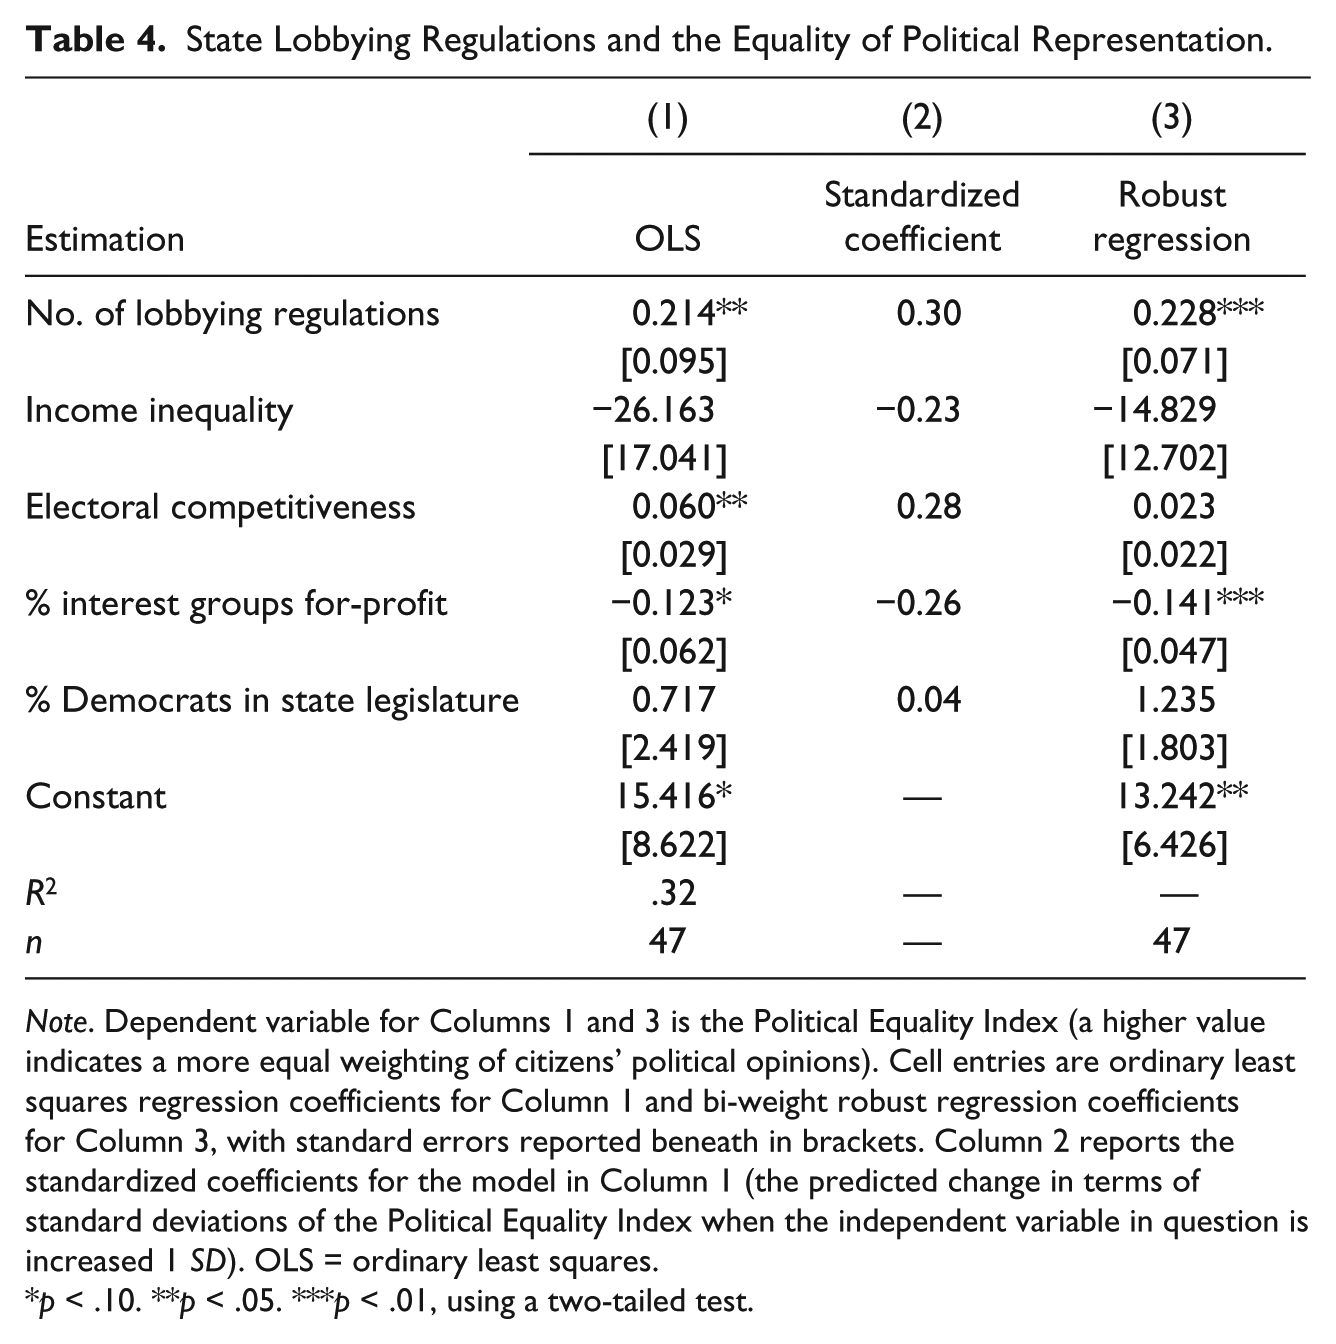
Note. Dependent variable for Columns 1 and 3 is the Political Equality Index (a higher value indicates a more equal weighting of citizens’ political opinions). Cell entries are ordinary least squares regression coefficients for Column 1 and bi-weight robust regression coefficients for Column 3, with standard errors reported beneath in brackets. Column 2 reports the standardized coefficients for the model in Column 1 (the predicted change in terms of standard deviations of the Political Equality Index when the independent variable in question is increased 1 SD). OLS = ordinary least squares.
p < .10. **p < .05. ***p < .01, using a two-tailed test.
Substantively, the effect of lobbying regulations is quite large. Column 2 of Table 4 reports the standardized coefficients (the predicted change in terms of standard deviations of the Political Equality Index when the independent variable in question is increased 1 standard deviation) from the model estimated in Column 1. As illustrated in the table, lobbying regulations have the largest substantive effect on the equality of political representation of any predictor in the model. Specifically, moving 1 standard deviation in the number of state lobbying regulations corresponds to a .30 standard deviation increase in the Political Equality Index. In summary, the data indicate that the strictness of lobbying regulations is an important predictor of representational equality in the American states.
With 47 cases in the analysis, it is possible that one or two data points may exert undue influence on the regression coefficients and obscure the actual relationship between the strictness of lobbying regulations and political equality. To investigate this possibility and to ensure the robustness of the findings discussed above, I use the same model specification and instead run a bi-weight robust regression. 18 The results of this additional estimation are reported in Column 3 of Table 4 and reveal that the coefficient for lobbying regulations remains positive and statistically different from zero. Using an alternative estimation technique, the result is the same: States with stricter lobbying regulations display more egalitarian patterns of political representation.
Conclusion
Congruence between citizens’ opinions and public policy outputs is the “bottom line” for American democracy. Recent studies at the national level (Bartels, 2008; Ellis, 2013; Gilens, 2012) report that the opinions of disadvantaged citizens are especially underrepresented in the policymaking process compared with the affluent across a wide array of policy domains. This article extends this line of inquiry to the American states and uncovers similar findings (also see Flavin, 2012; Rigby & Wright, 2011, 2013). Assessing the relationship between citizens’ general political ideology and state policy liberalism, citizens with higher incomes are better represented compared with citizens with lower incomes (see Table 2). The analysis also reveals that there is considerable variation in the equality of political representation across the states (see Table 3). Taking advantage of this variation and differences in laws that regulate lobbying across the states, I then find evidence that states with stricter lobbying regulations tend to have more egalitarian patterns of political representation (see Table 4).
Although several prominent studies to date have documented wide disparities in political influence between the rich and the poor (e.g., Bartels, 2008; Gilens, 2012), only recently have scholars begun investigating what concrete steps might be taken to lessen these inequities. As one example, Carnes (2013) documents that citizens from working class and low-income backgrounds are strikingly underrepresented in state legislatures across the nation and then recommends specific programs that recruit blue-collar workers to run for office as one possible solution for political inequality. Using the variation afforded by the 50 states, the results presented in this article indicate that, net of other factors we would expect to predict political equality, states that implement more comprehensive lobbying regulations tend to weigh citizens’ political opinions more equally in government policy decisions. Therefore, those seeking to promote greater political equality in the United States should consider strict laws that regulate the conduct of professional lobbyists as one important tool for ensuring that citizens’ opinions receive more equal consideration when elected officials make policy decisions.
Footnotes
Appendix
Income and Ideological Distance Between Opinion and Policy, by Survey Wave.
| 2000 | (1) | (2) | (3) | (4) | (5) | (6) |
|---|---|---|---|---|---|---|
| Proximity measure: | Standardized | Standardized | Same scale | Same scale | Restricted scale | Restricted scale |
| Policy data: | GLFM | SMR | GLFM | SMR | GLFM | SMR |
| Respondent’s income | −0.015*** | −0.013*** | −0.018*** | −0.017*** | −0.015*** | −0.016*** |
| [0.003] | [0.003] | [0.004] | [0.003] | [0.003] | [0.002] | |
| Constant | 1.141*** | 1.161*** | 1.189*** | 1.208*** | 0.859*** | 0.857*** |
| [0.131] | [0.132] | [0.117] | [0.084] | [0.038] | [0.030] | |
| N | 57,482 | 57,482 | 57,482 | 57,482 | 57,482 | 57,482 |
| 2004 | (1) | (2) | (3) | (4) | (5) | (6) |
| Proximity measure: | Standardized | Standardized | Same scale | Same scale | Restricted scale | Restricted scale |
| Policy data: | GLFM | SMR | GLFM | SMR | GLFM | SMR |
| Respondent’s income | −0.010*** | −0.012*** | −0.012*** | −0.015*** | −0.013*** | −0.015*** |
| [0.003] | [0.003] | [0.003] | [0.003] | [0.002] | [0.002] | |
| Constant | 1.116*** | 1.127*** | 1.162*** | 1.185*** | 0.878*** | 0.876*** |
| [0.112] | [0.117] | [0.102] | [0.075] | [0.033] | [0.026] | |
| N | 70,946 | 70,946 | 70,946 | 70,946 | 70,946 | 70,946 |
| 2008 | (1) | (2) | (3) | (4) | (5) | (6) |
| Proximity measure: | Standardized | Standardized | Same scale | Same scale | Restricted scale | Restricted scale |
| Policy data: | GLFM | SMR | GLFM | SMR | GLFM | SMR |
| Respondent’s income | −0.009** | −0.011*** | −0.009*** | −0.013*** | −0.011*** | −0.012*** |
| [0.004] | [0.003] | [0.003] | [0.003] | [0.002] | [0.002] | |
| Constant | 1.202*** | 1.219*** | 1.242*** | 1.258*** | 1.001*** | 1.002*** |
| [0.099] | [0.100] | [0.089] | [0.064] | [0.027] | [0.021] | |
| N | 48,615 | 48,615 | 48,615 | 48,615 | 48,615 | 48,615 |
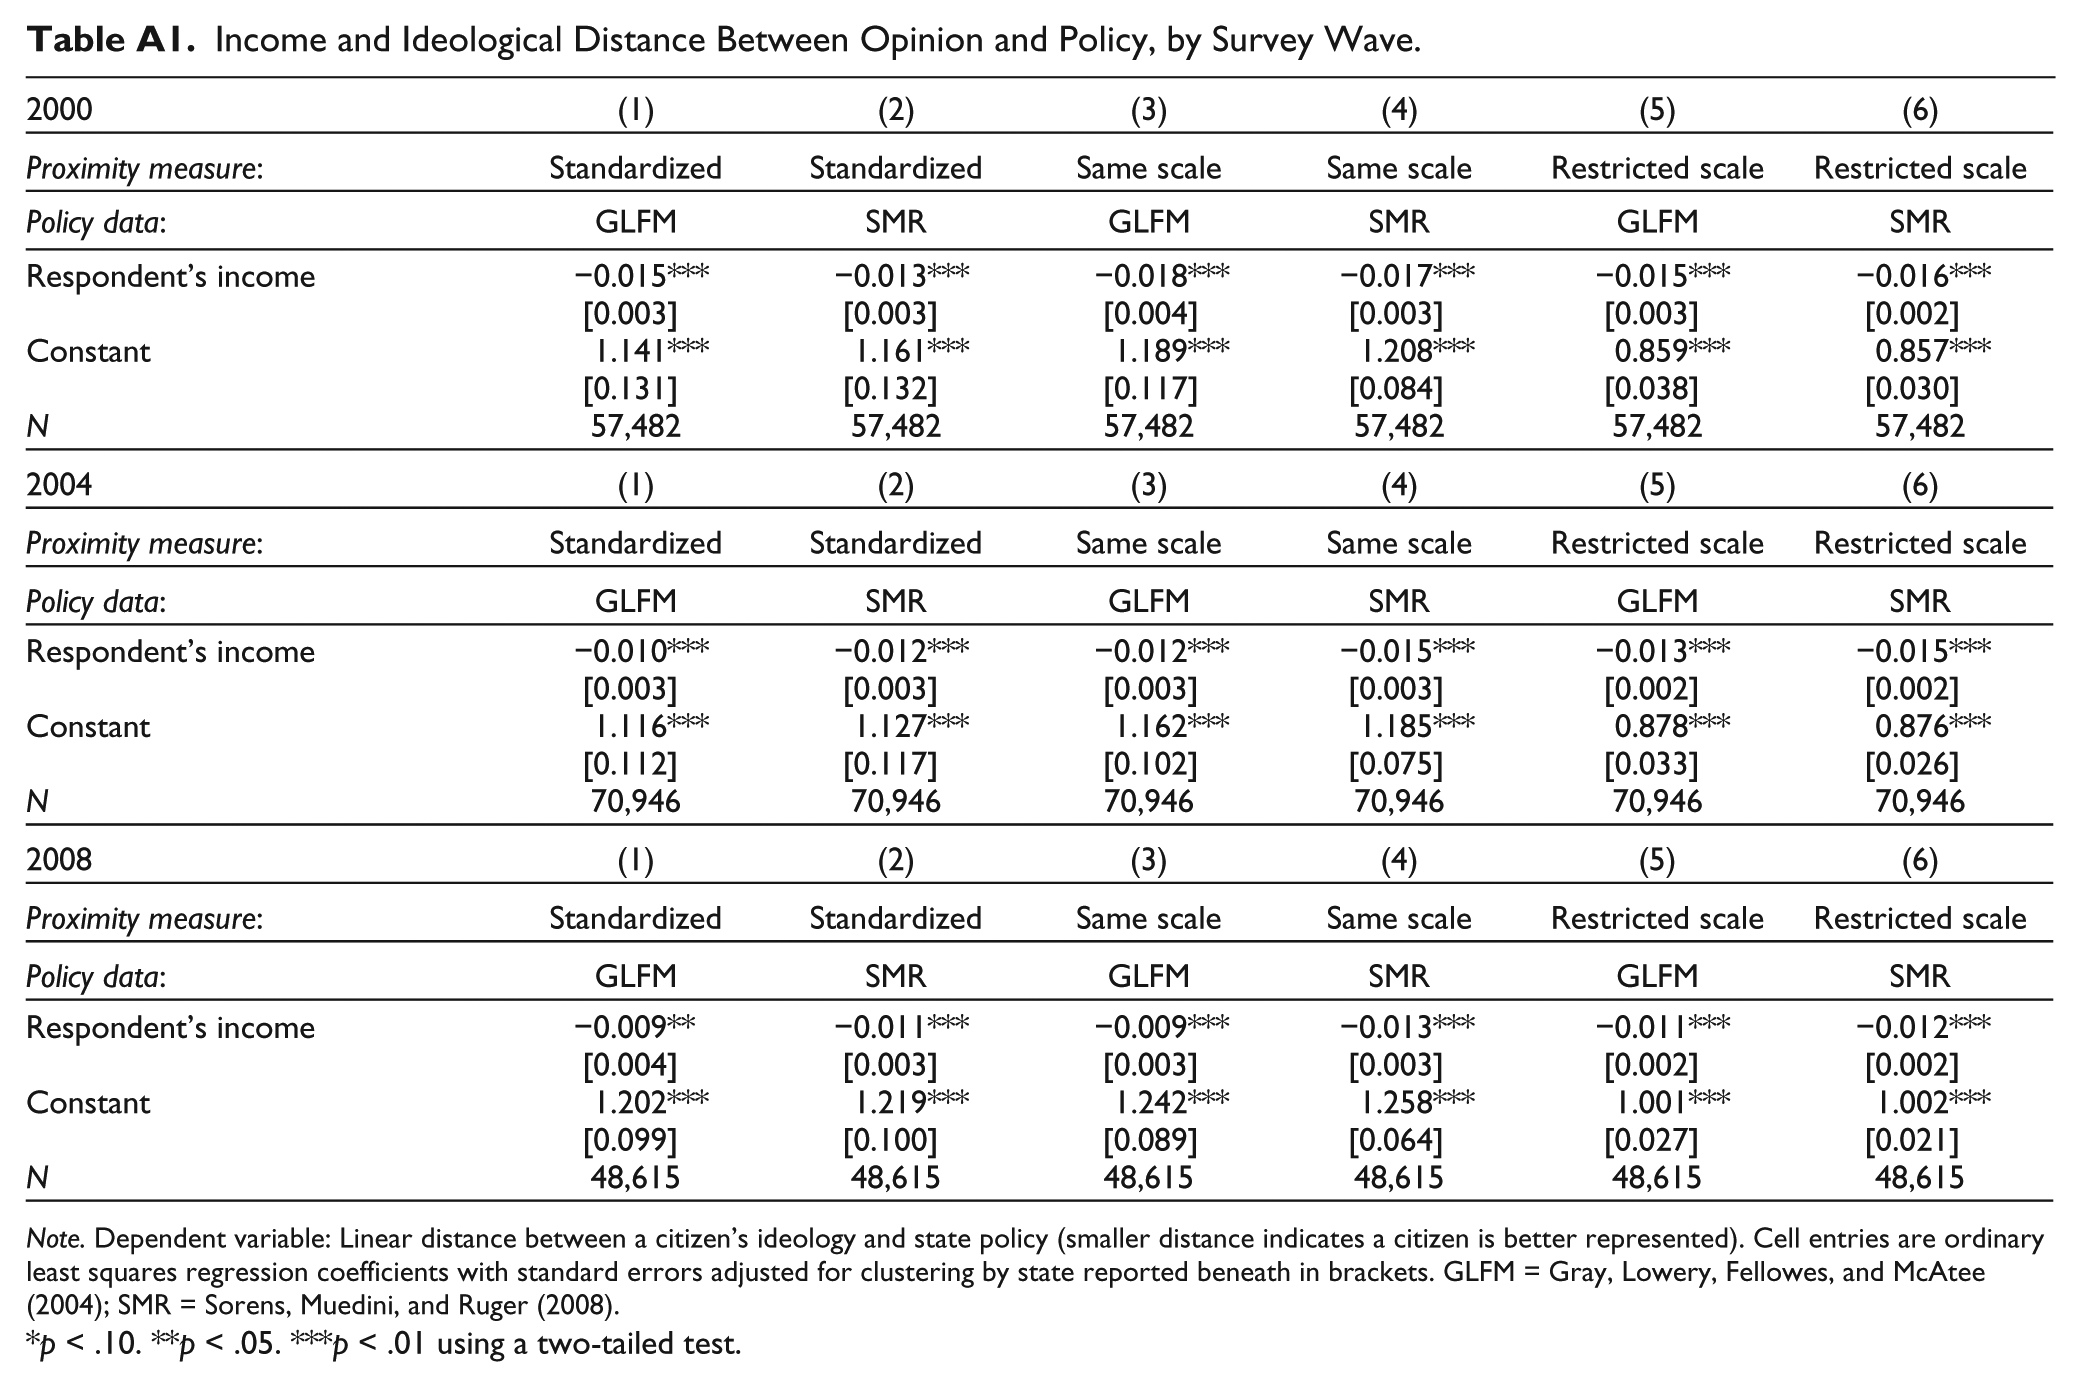
Note. Dependent variable: Linear distance between a citizen’s ideology and state policy (smaller distance indicates a citizen is better represented). Cell entries are ordinary least squares regression coefficients with standard errors adjusted for clustering by state reported beneath in brackets. GLFM = Gray, Lowery, Fellowes, and McAtee (2004); SMR = Sorens, Muedini, and Ruger (2008).
p < .10. **p < .05. ***p < .01 using a two-tailed test.
Declaration of Conflicting Interests
The author(s) declared no potential conflicts of interest with respect to the research, authorship, and/or publication of this article.
Funding
The author(s) received no financial support for the research, authorship, and/or publication of this article.