
Abstract
Conventional wisdom holds that public campaign financing can diversify the socioeconomic makeup of candidate pools and, therefore, of U.S. elected officials, which could make U.S. public policy more responsive to lower socioeconomic status (SES) citizens. I argue that in addition to the absence of a positive relationship between public financing and candidate socioeconomic diversity, public financing, depending on the program design, may, in fact, reduce candidate socioeconomic diversity. Using occupational data on state legislative candidates in public financing state Connecticut and two paired control states to execute a difference in difference analysis, I demonstrate that when public financing is available, fewer low SES candidates run for state legislative office, and those who do run are not more likely to win and are less likely to utilize public financing.
Keywords
Introduction
Representational inequality, the idea that government is disproportionately responsive to the opinions of wealthier citizens, appears to be an integral characteristic of American democracy in the twenty-first century. A number of researchers have uncovered patterns of representational inequality at both the national (Bartels 2008; Gilens 2012) and at the state level (Rigby and Wright 2011). Their findings have consistently indicated that the political opinions of individuals outside of the top percentiles of income have minimal impact on policy outcomes.
One likely source of this representational inequality is the lack of socioeconomic diversity among America’s public servants. As Carnes (2013, 5) points out, U.S. elected officials are disproportionately drawn from the ranks of the well-off, both at the national and state level. Combined with the well-documented impact of life experience and social class on legislator decision-making (Burden 2007; Carnes 2013), the dominance of American legislative bodies by high socioeconomic status (SES) individuals is a factor tilting American government policy toward the preferences of the wealthy.
A logical remedy to this source of representational inequality is to increase the socioeconomic diversity of America’s state and national legislative bodies, and policy suggestions have been made to this end. One such policy is the public financing of election campaigns, whereby candidates for public office can qualify to receive grants to run their campaign instead of relying on private fundraising. Among a number of structural variants, full public campaign has been touted as a means of facilitating political participation for citizens who cannot afford to self-finance increasingly costly campaigns, or who do not move in wealthy social circles where large donations are more easily solicited. Advocates of successful ballot initiatives on full public financing in Maine and Arizona in the 1990s and of full public financing legislation in Connecticut passed in 2006 made exactly this claim. For example, a 2009 report from Connecticut’s State Elections Enforcement Commission on the inaugural run of its “Citizens’ Election Program” described one of the program’s key goals as to “give candidates without access to sources of wealth a meaningful opportunity to seek elective office in the State of Connecticut” (State Enforcement Commission 2009, 52). Nonetheless, in the absence of empirical evaluation, the jury is still out.
The examination of this question is especially important in light of the renewed and building interest in public financing. For example, public financing received significant discussion during the 2016 Democratic Presidential Primary campaign. Public financing is also enjoying a renaissance at the city and state level. In November 2015, Seattle passed a ballot initiative creating a small donor public financing system wherein citizens are given a $100 “Democracy Voucher” to give to the candidate of their choice. On the same day, Maine passed a ballot initiative strengthening its own full public financing program.
This article takes advantage of increasingly available state legislative candidate biographical information and the rare implementation of a full public campaign financing program in Connecticut in 2008 to empirically evaluate the impact of public campaign financing on candidate socioeconomic diversity. In comparing the occupational background of candidates for Connecticut’s State House of Representatives before and after the implementation of full public campaign financing, along with candidates from Rhode Island and Massachusetts as matched control states, I find that full public financing, in fact, negatively affects candidate emergence for lower SES individuals. Based on anecdotal and statistical evidence, qualification requirements may disproportionately discourage lower SES individuals from participating in public financing, without which their likelihood of victory decreases vis-à-vis a potentially public funded opponent. Also contrary to expectations, lower SES candidates are no more electorally successful when public campaign financing is available. I first describe the expected relationships between public campaign financing and candidate emergence and the derived hypotheses in the section below before presenting the results and a concluding discussion.
Public Financing and Candidate Emergence
Although the barriers to participation may still be such that the absolute increase in lower SES candidates/victors is small or nonexistent, the literature on candidate emergence suggests that public financing could eliminate commonly cited obstacles to lower SES candidacy and victory. I take the view of Maisel et al. (1990, 153), who model individual candidate decision-making occurring on a continuum between “traditional group based candidate recruitment” and “candidate self-selection.” In externally motivated candidates, transformations in the dynamics of traditional candidate recruitment caused by the introduction of full public financing could favor lower SES candidates. The connection between electoral gatekeeping and the underrepresentation of women and minorities in public office is well-documented (Lawless and Fox 2005, 2010; Niven 1998; Sanbonmatsu 2006), but is less well-explored with respect to lower SES individuals. The existing literature on this relationship (Carnes and Lupu 2016) suggests that, in contrast to gatekeeper concerns about the electability of minorities and women, the primary factor discouraging recruitment of lower SES individuals is concern about their ability to fundraise (Carnes 2016). As a result, full public financing may reduce gatekeeping of lower SES candidates by assuaging local party leader doubts about their fundraising ability. Still, public campaign financing may leave traditional party recruitment networks untouched and fail to budge the number of lower SES candidates.
By enhancing their relative electoral competitiveness, the availability of public financing should also impact an individual’s probability of positively responding to external recruitment, or an internal impetus to enter a race in the case of candidate self-selection. Candidate ambition theory posits that a candidate will decide to enter a race when the prospective benefits of holding office are greater than the costs of obtaining that office and any associated opportunity costs (Black 1972; Jacobson and Kernell 1981). Public financing should increase a lower SES candidate’s probability of victory relative to the traditional funding environment by transforming the timing and amount of money they have access to, thereby enhancing the appeal of a run for office. For lower SES candidates mulling a challenge to a seated incumbent, the most likely scenario given high rates of incumbent reelection and the underrepresentation of lower SES individuals, public financing nullifies the fundraising advantages protecting incumbents (Abramowitz 1991; Abramowitz, Alexander, and Gunning 2006; E. Campbell 2002; Levitt and Wolfram 1997). Indeed, challenger candidates running with full public grants generally raise more than their traditionally funded counterparts (Miller 2011) and are comparable in terms of funds raised with incumbents (U.S. Government Accountability Office [GAO] 2010, 55, 61). Increased campaign funds are a boon to challengers and candidates for open seats alike at the state level as the literature points to a positive relationship between campaign funds and vote share (Caldeira and Patterson 1982; Gierzynski and Breaux 1991; Giles and Pritchard 1985; Tucker and Weber 1987), benefiting candidates for open seats and challengers in that order (Gierzynski and Breaux 1996). A public financing grant should disproportionately help lower SES individuals who, not being tapped into professional networks abetting political fundraising in the same way as middle and higher SES individuals (Lawless 2012, 117), would be unlikely to raise comparable funds. In this way, public financing might enhance the relative competitiveness of lower SES candidates by closing fundraising inequalities rather than helping all candidates equally.
In addition to increasing the size of a potential lower SES candidate’s war chest, public financing also removes the inability to self-finance and the related strategic benefits as a potential hindrance to victory, which further enhances their prospects vis-à-vis wealthier opponents. At the state legislative level, self-financing is out of reach for most Americans. Races for State Senates in 2014 on average cost $150,043, while races for State Houses/Assemblies averaged $60,770 (Stapleton 2015). Even in states with less professionalized legislatures, the average cost of a run for the State House of Representatives can top $5,000, as it did in Maine in 2016 (Maine Election Overview, n.d.). Self-financing also confers an important strategic advantage. In traditional fundraising environments, self-financing can support early campaign efforts requisite for longer term viability, while the candidate can pay themselves back with later contributions because “early money makes the dough rise,” and potential donors are more likely to support a financially viable campaign (Biersack, Herrnson, and Wilcox 1993; Steen 2009; Wilcox 1988). Although full public financing candidates must usually raise small-dollar “qualifying contributions” to be eligible, the reduced importance of campaign start-up costs should favor lower SES individuals’ probability of victory and, thus, likelihood of running for office, especially to the degree that challenger candidates are more likely to rely on self-financing (Alexander 1986; Jacobson 1980) and that money spent early in an election is disproportionately valuable (Steen 2009, 52). Overall, empirical evaluations largely support public financing’s association with positive electoral competitiveness (Mayer, Werner, and Williams 2006; Malhotra 2008; Miller 2011; Thompson and Moncrief 1998; Werner and Mayer 2007), though it remains to be seen whether the benefits of this relationship are significant enough to alter the decision-making of potential lower SES candidates.
Besides improving a lower SES candidate’s probability of victory, public financing reduces time costs associated with campaigning. The time required to mount a legitimate political challenge discourages lower SES candidate emergence (Brady, Verba and Schlozman 1994), whose occupations may not give them the flexibility to extensively campaign. The place of under-resourced individuals is especially difficult to find in the dual campaign framework (Herrnson 2011), where candidate fundraising time outstrips voter mobilization efforts. Fundraising without access to crucial networks can be prohibitively time-consuming, but full public financing dramatically reduces the amount of time candidates spend fundraising (Francia and Herrnson 2003). Public financing may mitigate time constraints as an impediment to campaigning for lower SES individuals, although qualifying for such programs is a challenge in itself, as will be discussed below. Adding to the existing literature and theory, informant survey evidence is suggestive as well, as likely state legislative candidates making less than $50,000 (in 2007 USD) per year reported that public financing increased their chances of running for office (La Raja 2008).
While there is a plausible case to be made that public campaign financing may reduce barriers to entry, there are perhaps stronger arguments to the contrary. The low remuneration and time costs of holding office might still limit its impact on candidate socioeconomic diversity by dissuading many potential lower SES candidates from initially throwing their hat in the ring. Because pay increases for state legislators are electorally unpopular, state legislator salaries are often incommensurate with time served. State legislators in part-time state legislatures such as Connecticut must, therefore, have another significant source of income, possibly putting office out of reach for many lower SES individuals. For example, part-time state legislators are paid $28,000 in Connecticut while working what many legislators estimated to be more than two thirds of a full-time job (National Conference of State Legislatures [NCSL] 2014) during the legislative session, leaving little time for another full-time job for several months out of the year. Indeed, Carnes (2015) finds that working-class individuals make up a greater proportion of state legislators in states where working-class individuals have higher average incomes, suggesting that financial concerns play a primary role in determining lower SES candidate emergence. The pool of lower SES individuals for whom public financing tips the balance for participation may, therefore, be small and limit the impact of the changed campaign financing context.
Of course, public financing can only change a lower SES individual’s political calculus if they are aware of and are able to qualify for the program, and both of these conditions may be unlikely to hold. Americans, broadly, are unaware of the specifics of campaign finance regulation (Primo 2002), and public campaign financing is no exception. Indeed, a 2007 survey of New Jersey residents found that nearly 80% of respondents had heard little or nothing of New Jersey’s pilot public financing program, which was in its second cycle of operation in a number of state legislative districts (Woolley and Vercellotti 2007). More generally, rates of political participation and political knowledge among lower SES individuals may decrease the likelihood that they are aware of public campaign financing’s availability (Delli Carpini 1996).
In addition to, or instead of, a lack of awareness, qualification requirements may also impede lower SES participation in public campaign financing. Full public campaign financing programs in Arizona, Connecticut, and Maine require potential participants to raise a certain amount of “qualifying contributions,” generally consisting of several hundred small-dollar donations, to demonstrate the viability of their candidacy. In this model, having ample time to knock on many doors replaces personal wealth or access to wealthy donor networks as the determinant of candidate fundraising success. For time-constrained individuals, small-dollar fundraising may be as large an impediment to political participation as traditional fundraising. Anecdotal evidence attests to the time-intensive nature of the qualifying contribution model. Miller (2014, 34) reports one first-time candidate participating in Arizona’s public-financing program, saying, “[Raising] 250 five-dollar contributions, if you think that’s easy, you ought to try it. It’s tough, it’s really tough.” Another candidate more colorfully stated, “You really have to work your butt off to get those five dollars” (Miller 2014, 34). Program qualification requirements, though intended to prevent the waste of taxpayer money on inauspicious campaigns, may also reduce lower SES candidate participation in public financing.
Although distinguishing between the relative importance of these various strategic and economic reasons for and against lower SES candidacies is challenging for candidates who decide not to run, the overall success of public financing in economically diversifying candidate pools and the relative barrier qualification requirements pose for lower SES individuals can be evaluated by looking at the socioeconomic background of candidates who actually run and qualify for public financing. As the vast majority of state legislative primary elections are uncontested, or candidates appearing on the primary ballot may drop out before the general election and be replaced, it is appropriate to look at general as well as primary election ballots as sites of candidate emergence. For example, there was a Democrat on the ballot in Connecticut for 524 out of 604 possible House of Representative seat races between 2004 and 2010, but only 8% of these races featured a contested Democratic primary. Republicans had contested primaries in just 3.4% of the 435 races with a Republican on the general election ballot over the same period. Because the analysis aims to tease out the effect of public financing on individuals who otherwise would not have campaigned, only first-time candidacies will be counted as observations. Accordingly, the four hypotheses in need of evaluation are as follows:
Data and Method
Public Financing in Connecticut
The implementation of full public campaign financing in Connecticut creates an opportunity to study public financing’s relationship to rates of lower SES candidate emergence (H1 and H2), victory (H3), and program qualification (H4). Connecticut’s Citizens’ Election Program was created by its General Assembly in 2005 in response to a succession of state official corruption scandals and was first available to candidates for the 2008 election cycle (GAO 2010, 119). Participating candidates must agree to forgo private donor or large self-financing throughout the course of their campaign, though they are allowed to collect a limited amount of “seed money” to facilitate the earliest stages of their campaign. To qualify for a public grant, candidates for statewide and general assembly offices must collect a specified number of donations, ranging from $5 to $100 from district residents and clear a threshold of total funds raised from these donations. For example, a candidate for Connecticut’s House of Representatives must collect 150 or more donations adding up to $5,000 to qualify (GAO 2010, 120). Qualifying candidates receive funds at the beginning of the primary and general election periods.
I focus my analysis on the 2004–10 election cycles, where the independent variable is the availability of full public financing (2008 and 2010). This time frame provides two electoral cycles of data before and after the implementation of public financing. Moreover, state legislative districts in the years under observation were unaffected by Connecticut’s decennial redistricting, which created different district boundaries for 2002–10 and 2012–20. This allows the historical electoral characteristics and demographics of state legislative districts to be included as control variables in the quantitative analysis below.
Dependent Variables
State legislature lower chambers are commonly perceived to provide a stepping stone to future office (Squire 1988), making them an arena where newcomer entrance into politics is most responsive to policy change. Thus, a change in candidate socioeconomic diversity should be most visible in races for Connecticut’s General Assembly’s lower chamber, the House of Representatives. The dependent variable for H1 is the number of first-time lower SES primary candidates for Connecticut’s House of Representatives before and after the implementation of full public financing, while the dependent variable for H2 is the number of first-time lower SES candidates on the general election ballot. The probability of a lower SES candidate winning their general election race and qualifying for public financing are the dependent variables for H3 and H4, respectively.
In an attempt to rule out state-specific effects and strengthen the associative claim to be made about any results, I employ a difference in difference research design and include Rhode Island and Massachusetts as control states (Angrist and Pischke 2009). Rhode Island and Massachusetts are the best available control states for Connecticut given their geographic proximity, similar district constituency sizes, rural population percentage, occupational demographics, National Conference of State Legislatures’ categorization, and legislative professionalism (Squire 2007). Moreover, previous studies of public financing in Connecticut have also used Rhode Island to acquire counterfactual leverage (Miller 2014). Relevant comparison characteristics for Rhode Island, Massachusetts, and Connecticut are included in Tables 1 and 2 below.
2000 Census Connecticut, Massachusetts, and Rhode Island Occupational Percentages.

Source. Adapted from U.S. Census Bureau (2000a).
Legislative Characteristics: Connecticut, Massachusetts, and Rhode Island.
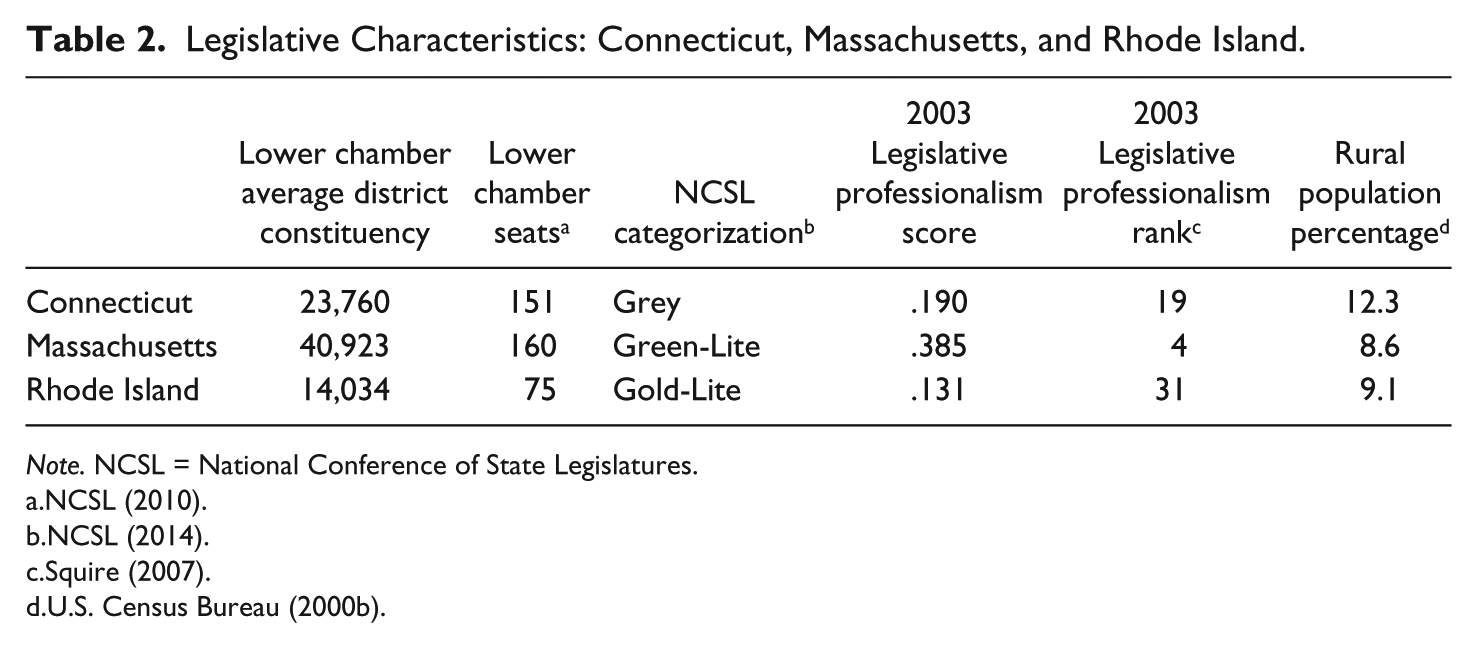
Note. NCSL = National Conference of State Legislatures.
NCSL (2010).
NCSL (2014).
To operationalize candidate SES, I collected occupational information on all candidates listed on Connecticut, Massachusetts, and Rhode Island’s lower chamber primary and general election returns for the years 2004–10, yielding nearly 2,000 unique candidates.1,2 The primary source of this information was candidate profiles in local newspapers, individually searched for and accessed through the NewsBank (Access World News) database. If a NewsBank search did not uncover occupational data, I turned to other sources of occupational data, including LinkedIn pages, State Legislature online archives, and state Bluebooks. 3
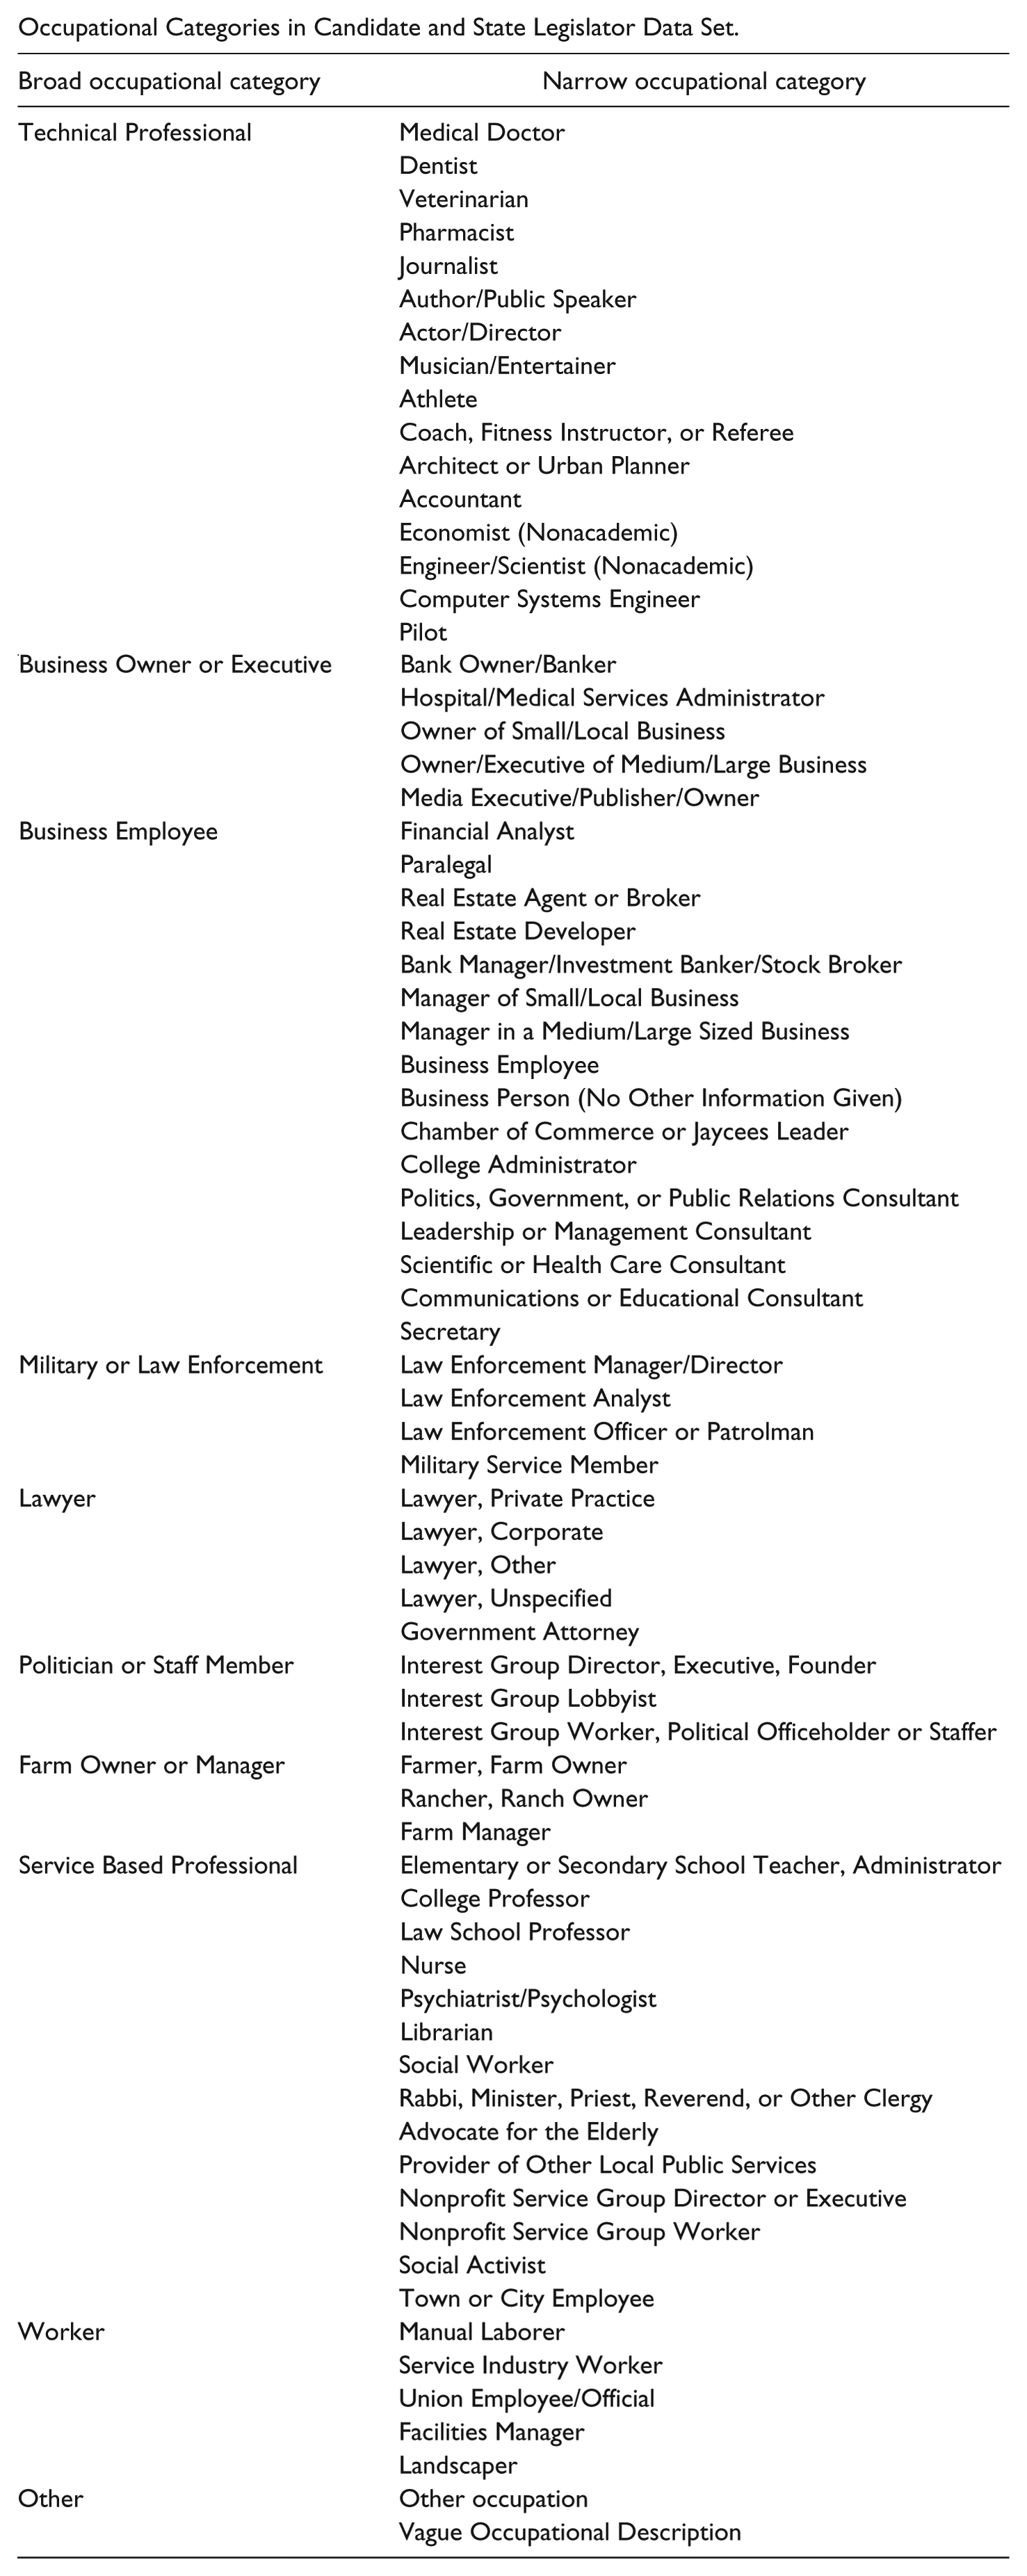
I follow Carnes’s (2013) examination of U.S. congressperson SES in classifying candidate occupational history into nine categories. The methodological and topical similarity of Carnes’s design makes this coding scheme a suitable model. Although other occupational categories in this coding scheme may potentially contain lower SES candidates, the “worker” classification will be used as the dependent variable because it contains professions with lower median incomes, formal educational requirements, societal prestige, and is, thus, the most robust to measurement error of SES possible in other categories. 4 A full list of occupations sorted by Carnes’s (2013) categorization is available in Appendix A, as well as a sample of the raw occupations used to code candidates into the worker category for this analysis (Appendix B). Figure 1 below provides a summary of these data, further evidence in favor of Rhode Island and Massachusetts as control states, and a preliminary evaluation of H1 and H2. The proportions of all lower chamber primary election candidates from each occupational category for Rhode Island, Massachusetts, and Connecticut in the years under observation are displayed.

CT, MA, & RI 2004-2010 Proportions of Lower Chamber Candidates By Occupational Category
The three states are generally well-matched on proportions of the overall candidate pool from each occupational category. The degree of similarity in the proportion of their respective candidate pools from the working class (“worker”) pre-2008 is especially compelling given that these are the dependent variables under examination. Contrary to expectations, the proportion of working-class candidates and electoral winners seems to decline in Connecticut after full public financing became available, while Rhode Island saw an uptick, and Massachusetts stayed level.
Omitted Variable Bias
Admittedly, this study design cannot distinguish between the effect of public financing and other statewide social and political events occurring in Connecticut in 2008 and 2010, but there are several alternative explanations for these results that can be largely ruled out. First, economic insecurity induced by the Great Recession does not seem to have been dramatically different in Connecticut as opposed to Rhode Island and Massachusetts and so is likely not confounded with the Citizens’ Elections Program and working-class candidate emergence. In other words, financial struggles in Connecticut should be no more likely to discourage or encourage political involvement versus those in the control states. For example, while all three states exhibited a spike in the unemployment rate in 2007–08, Connecticut’s spike is not significantly worse than Rhode Island or Massachusetts (Figure 2). A more sensitive measure of statewide financial insecurity, the Economic Security Index (ESI), tells a similar story (Hacker et al. 2013). The ESI is the percentage of individuals in a given year losing more than 25% of their household income after covering medical expenses and debts, and Connecticut’s remains lower and more stable in response to the Great Recession than Massachusetts’ or Rhode Island’s in Figure 2. Second, the above results do not coincide with a dip in working-class political organization in Connecticut vis-à-vis Rhode Island and Massachusetts. As unions are an important site of lower SES political involvement and recruitment, and are positively associated with a state’s share of working-class state legislators (Carnes 2015), a decline in union membership in the 2000s could explain the decline in the number of working-class candidates in 2008 and 2010. However, as Figure 2 shows, statewide union membership levels are reasonably stable in Connecticut between 2004 and 2010 in comparison with Rhode Island and Massachusetts.
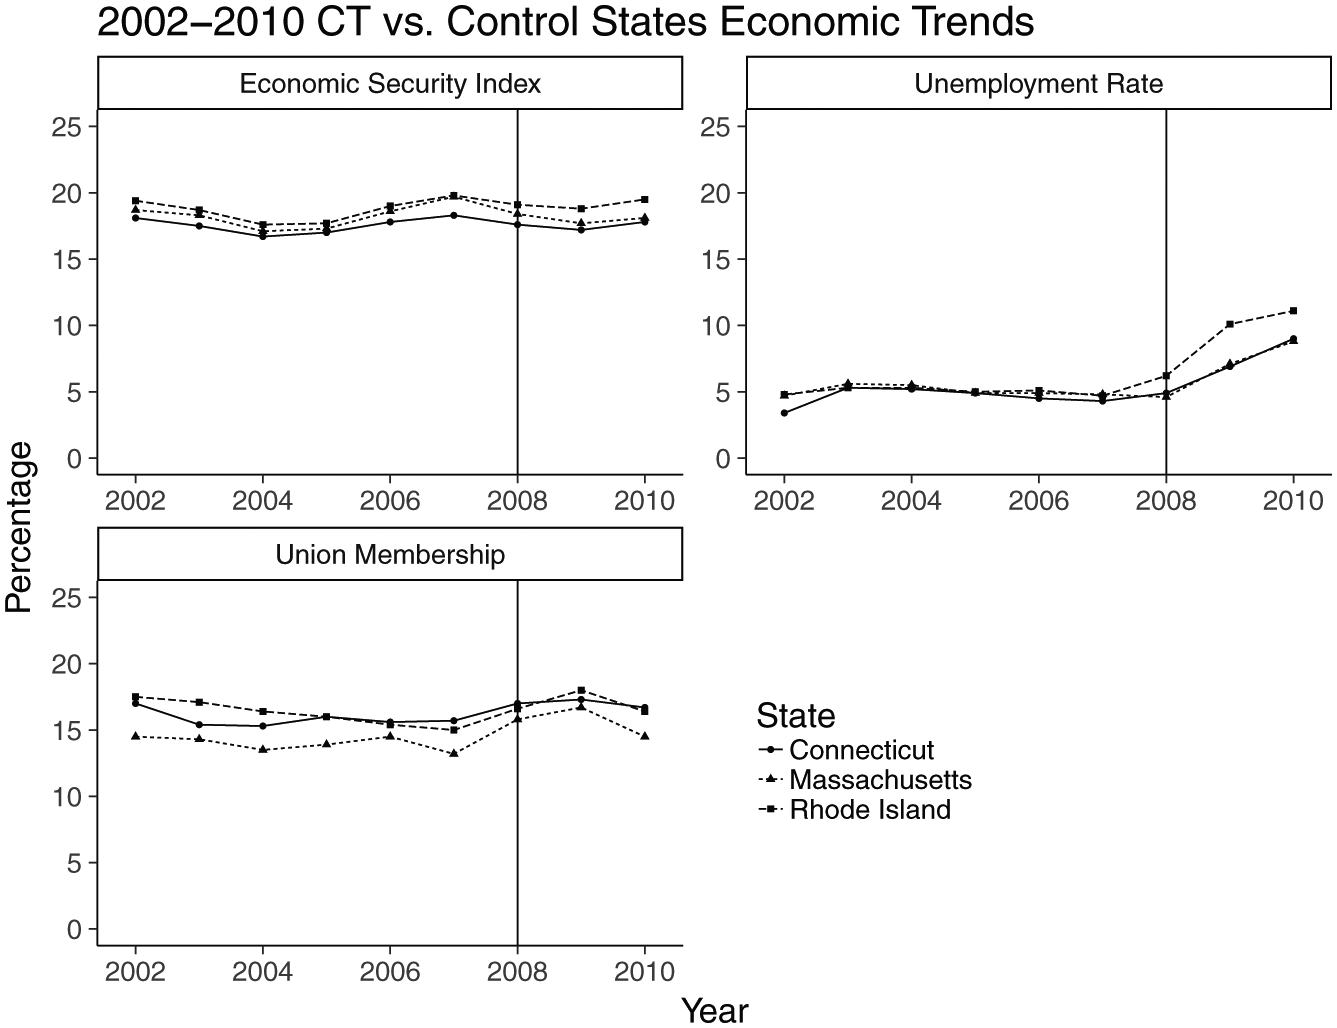
2002-2010 CT vs. Control States Economic Trends
Indeed, qualitative evidence suggests Connecticut working-class political organization increased throughout the 2000s and is, therefore, unlikely to negatively confound the effect of public campaign financing. The Working Families Party of Connecticut (CTWFP), a progressive, union-backed organization, launched in 2002 and steadily expanded through grassroots organization, capturing seats on city councils and school boards, cross-endorsing Democrats, and running candidates on its own ballot line. Its electoral and political apex occurred in 2010, when its cross-endorsement provided Democratic gubernatorial candidate Dannel Malloy some 27,000 key votes in a close election (O’Leary 2010). Malloy then went on to sign a paid sick leave bill in 2011 (Hughes 2011) the CTWFP had been mobilizing around since 2007 (Bulger 2008). Largely due to the challenge faced by a potential third party in states without cross-party endorsements of candidates, Massachusetts does not have an arm of the Working Families Party whereas Rhode Island’s chapter was founded in 2016. As a result, only Connecticut received such a boost to working-class organization over the observation period.
Although other factors might still be confounded with the advent of full public financing in 2008, the timing of the program does not coincide with deviations in Connecticut’s levels of economic insecurity and working-class political organization vis-à-vis Massachusetts and Rhode Island, and the latter may even have worked against the negative correlation between public financing availability and working-class candidate emergence. Of course, the decision to run for the state legislature occurs at the district level, and variation between districts year over year may also impact the number of candidates. The next section’s modeling attempts to control for this source of bias and provide more evidence to isolate the association between Connecticut’s 2008 implementation of full public financing and rates of lower SES candidate emergence, taking advantage of static legislative district boundaries in the electoral cycles under observation.
Design
I take district-years as my unit of analysis, yielding 1,544 total observations with 604 from Connecticut, 300 from Rhode Island, and 640 from Massachusetts. Poisson regression is the most appropriate modeling strategy for evaluating H1 and H2 for two reasons. First, the dependent variable for both hypotheses is a count of working-class candidates. 5 Second, Poisson regression is preferable to a negative binomial regression as the conditional mean of the dependent variable is approximately equal to the conditional variance. 6 Logistic regression is more appropriate to test H3, where the dependent variable is whether the general election victor was working class.
In analyzing state legislative districts over a number of election years, I encounter estimation problems associated with data clustering (Primo, Jacobsmeier, and Milyo 2007). To address this, I fit models for H1, H2, and H3 with robust standard errors clustered by state legislative district. I also include election cycle fixed effects to account for cycle to cycle variation (Year) as well as state fixed effects, which rule out heterogeneity between the treated and control states as an alternative explanation for results. 7
Control Variables
District-level heterogeneity likely moderates the impact of full public financing on lower SES candidate emergence and victory both through factors related to general candidate emergence and factors affecting the probability that candidates are of lower SES. The literature suggests that the presence of an incumbent (Maestas et al. 2006; Maisel and Stone 1997) and perceived vulnerability (Pritchard 1992) both affect the number of candidates entering a race. Accordingly, I include a dummy variable Incumbent on Ballot to denote a competing incumbent in a district-year for all three models, as well as an interaction term to account for the incumbent’s partisanship. Tenure records the incumbent’s previous time in their seat, and Competitive District denotes whether they won their previous general election by less than 20%. Both are interacted with Incumbent on Ballot to measure incumbency strength. I capture the electoral context of the district with District Partisanship, denoting the party of the previous winner of the district, and Previous Field Size, the number of candidates on the general election ballot for the previous cycle, to account for districts that typically see more active elections.
While the presence of an incumbent and their relative strength impacts general candidate emergence, the state legislative district’s socioeconomic demographics likely also affect the probability that candidates running for office are lower SES. To account for this possibility, I control for each state legislative district’s average household income (District Avg. Income) and the percentage of residents employed in working-class professions 8 (District WorkingClass Pct.).
Results
The results of models testing working-class candidate emergence (H1 and H2), and general election victory (H3), are presented below in Table 3. The models testing H1 and H2 demonstrate that, contrary to expectations, the availability of full public financing is associated with a decrease in the number of working-class candidates competing in state legislative primary and general elections (p < .05). However, the availability of public financing seems unrelated to a working-class candidate’s electoral success as the coefficient Public Financing is nonsignificant in the models testing H3. There seem to be fewer working-class candidates running for Connecticut’s State House of Representatives after the implementation of public financing, and they are no more likely to win the the general election when they do.
Regression Analysis of Working Class.
Candidate Emergence and Success: Connecticut, Massachusetts, and Rhode Island 2004–10.
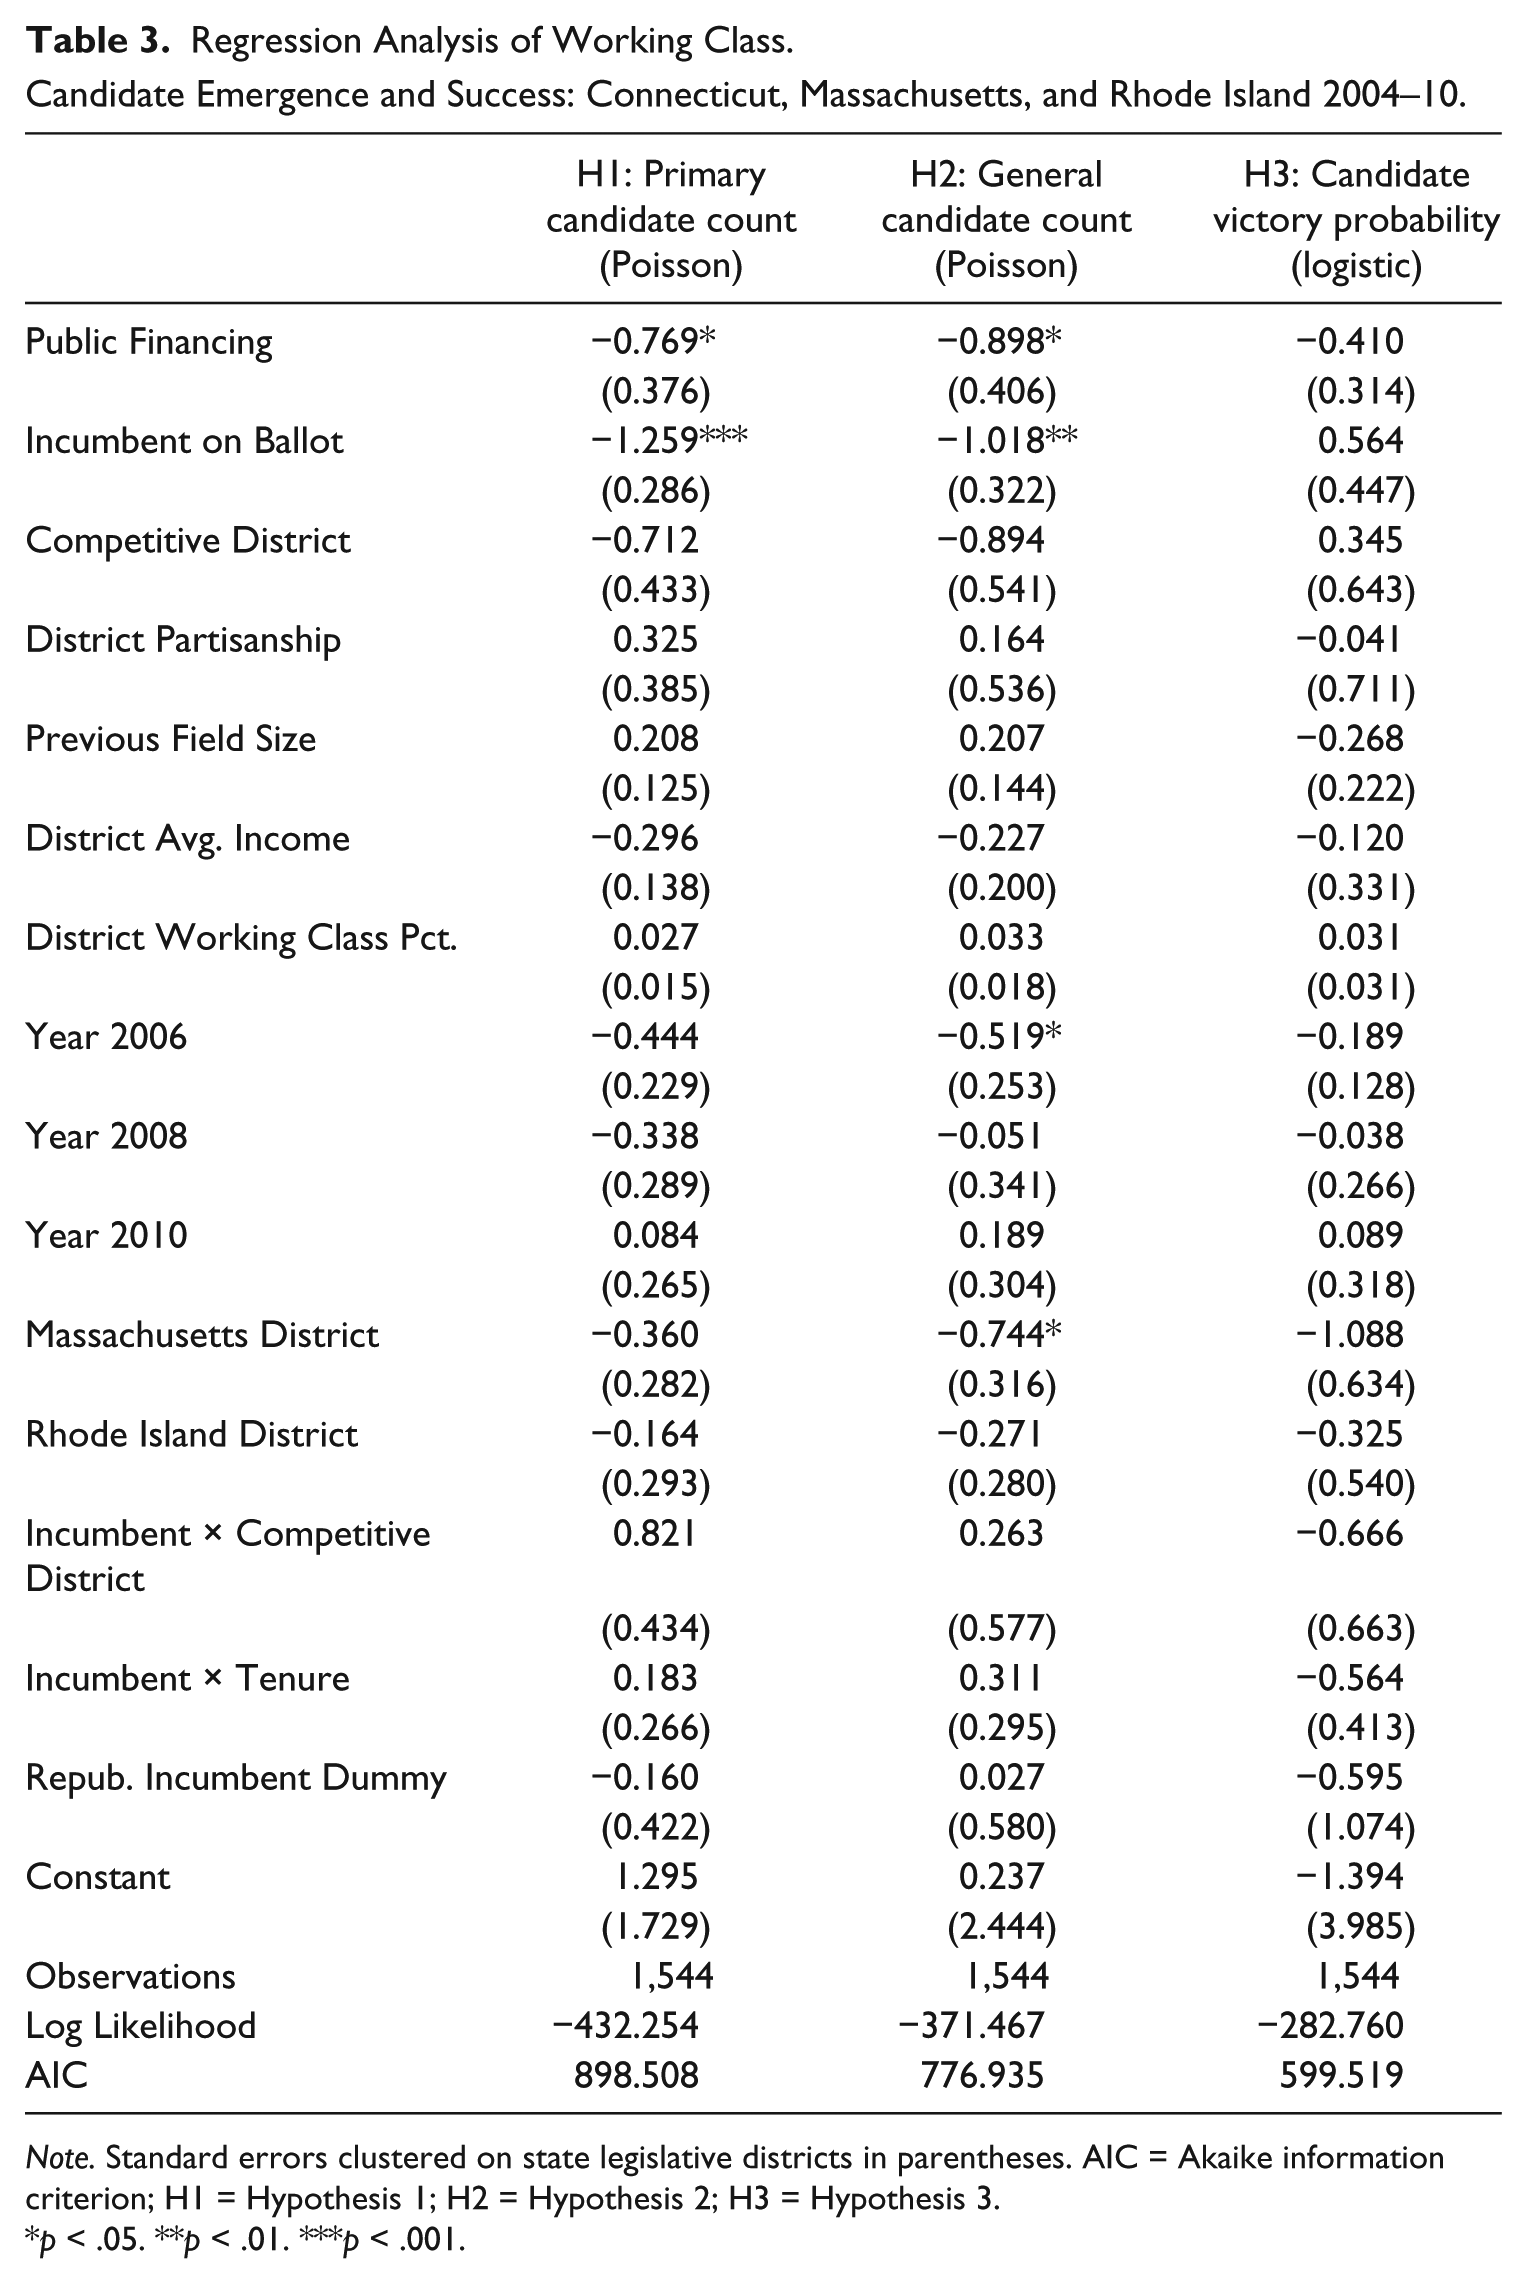
Note. Standard errors clustered on state legislative districts in parentheses. AIC = Akaike information criterion; H1 = Hypothesis 1; H2 = Hypothesis 2; H3 = Hypothesis 3.
p < .05. **p < .01. ***p < .001.
Of course, these results only cover two election cycles, and it is possible that the observed negative relationship between public campaign financing and working-class candidate emergence may change over time. Unfortunately, the redrawing of state legislative districts in Connecticut, Rhode Island, and Massachusetts in 2012 makes the political characteristics of individual state legislative districts difficult to compare across redistricting cycles, complicating an extension of the above district-level analysis to more cycles.
To get a picture of the longer term impact of Connecticut’s public campaign financing program on SES diversity among candidates and state legislators, I collected occupational data on Connecticut and the two control states’ lower chamber legislators for the legislative sessions between 2004 and 2016. While the results above suggest that working-class candidates are no more nor less electorally successful with the availability of public campaign financing, a decrease in the number of candidacies due to public financing should reduce the proportion of Connecticut’s House of Representatives coded as worker over time. To test this hypothesis, I use Abadie, Diamond, and Hainmueller’s (2011) synthetic control method to construct the occupational demographics of a counterfactual state legislature for Connecticut. This strategy creates a weighted average of control observations to optimally match pretreatment trends between control and treated units according to the dependent variable and selected control variables. Thus, I weight the proportion of working-class legislators from Massachusetts and Rhode Island after 2008 according to factors likely impacting state legislature occupational demographics: pre-2008 population, income per capita, lower chamber legislator salary, lower chamber average constituency size, unemployment rate, and Bowen and Greene’s (2014) two-dimensional legislative professionalism components. 9 Figure 3 displays the proportion of worker-coded state legislators in Connecticut from 2004 to 2016 relative to a synthetic control before and after the implementation of public campaign financing.
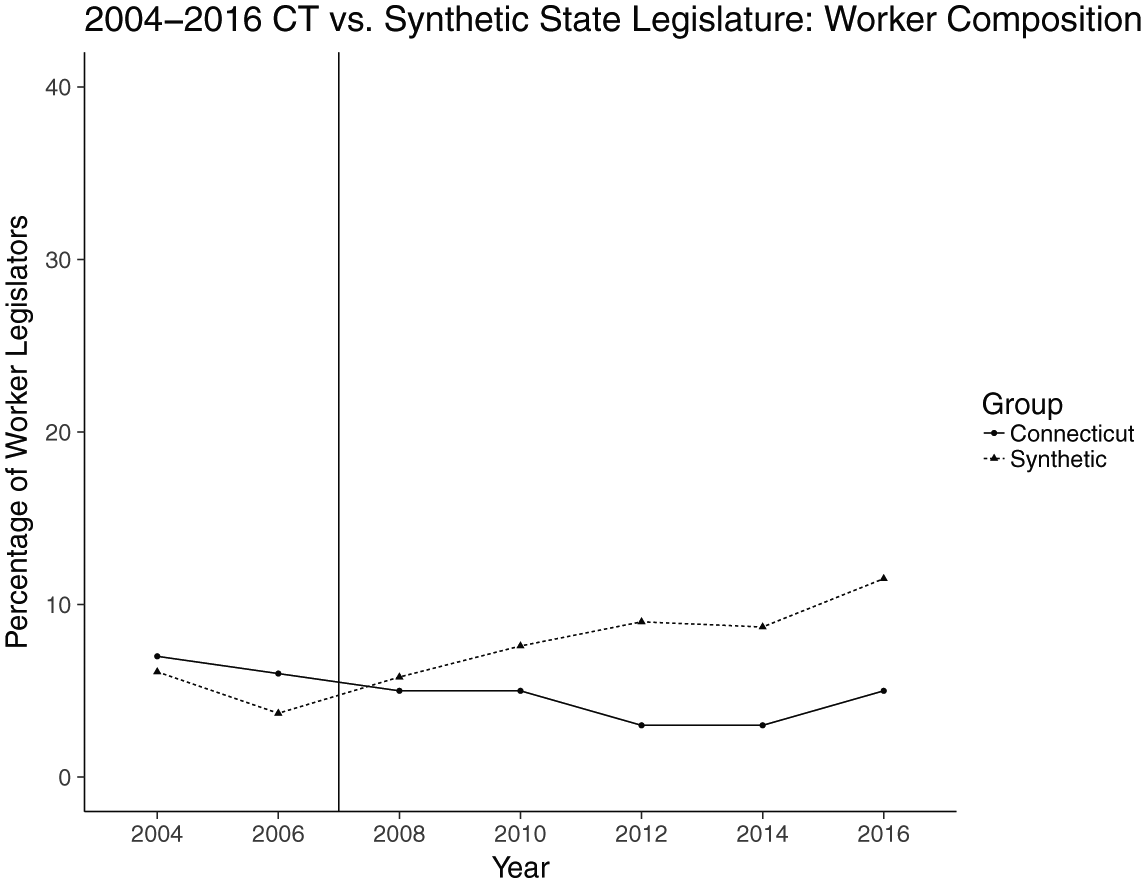
2004-2016 CT vs. Synthetic State Legislature: Worker Composition
Although the number of preintervention units and control units used is small, this figure suggests that Connecticut would have more working-class state legislators without public campaign financing and that the negative association observed above may have lasted past 2008 and 2010. Before the elections held in 2008, Connecticut’s State House of Representatives and a synthetic counterfactual were relatively well-matched in the proportion of working-class state legislators. However, starting with the legislators entering for the 2009–10 session, Connecticut’s slight decline contrasts with a slight increase in the synthetic control. Given the low number of working-class state legislators in Connecticut, this decline only represents a handful of legislators but nevertheless suggests that the negative relationship between public campaign financing and working-class candidate emergence has not dramatically reversed since the inaugural election cycles studied above. Future work taking a different approach than the district-level analysis above may be possible and could shed light on whether the negative association between public campaign financing and working-class candidate emergence still holds in Connecticut.
Possible Mechanisms
One possible explanation for the unexpected negative relationship between public campaign financing and candidate socioeconomic diversity is that qualifying for Connecticut’s public financing program is disproportionately challenging for low-income individuals (H4). Besides collecting a certain number of qualifying contributions, public financing candidates for Connecticut’s State House of Representatives must also surpass an aggregate dollar value of contributions collected. It is possible that collecting the requisite 150 contributions or more, which add up to $5,000, is less manageable for persons of lower SES status than those with greater time/financial resources to facilitate the gathering of these contributions, or who are able to personally contribute up to the personal limit in Connecticut of $1,000.
Anecdotal and preliminary statistical evidence support this proposition. Collecting the $5 contributions, while perhaps easier than traditional fundraising for low-income individuals, is not without its own challenges, as discussed above. What is more, a potential public financing candidate in Connecticut must secure many donations larger than $5 to reach the total of $5,000 to receive funding, which might be a considerable obstacle for working-class candidates. A working-class candidate in Miller (2014, 33) claimed, I had never run for office before, and I certainly would not have run for office if I had had to go to my blue-collar friends as someone who had never run for office, saying, “Give me fifty bucks.” I would not have made that step.
But it is precisely this step that is required to qualify for public financing in Connecticut. Although the public financing grant in Connecticut, $40,000 total for the general and primary elections, is purposefully close to the average prepublic financing campaign cost of $41,000, the high rates of candidate participation in the Connecticut program—73% in 2008 and 70% in 2010 (Citizens’ Election Program 2010, 4)—make it very likely that working-class candidates might feel themselves to be less competitive financially with a publicly funded competitor if they are unable to qualify for public financing. This is especially the case as compared with the calculus before public financing was available, where it was not as assured that an opponent would be so well-funded. Moncrief, Squire, and Jewell (2001, 80) report that the perception of an opponent’s war chest generally can keep less well-funded candidates from entering a race for the state legislature. Therefore, candidates struggling to meet the number of qualifying contributions and dollar threshold due to time constraints, limited financial resources, or limited access to wealthy social networks might be dissuaded from entering the race if it is well-known that most candidates will be using public funding.
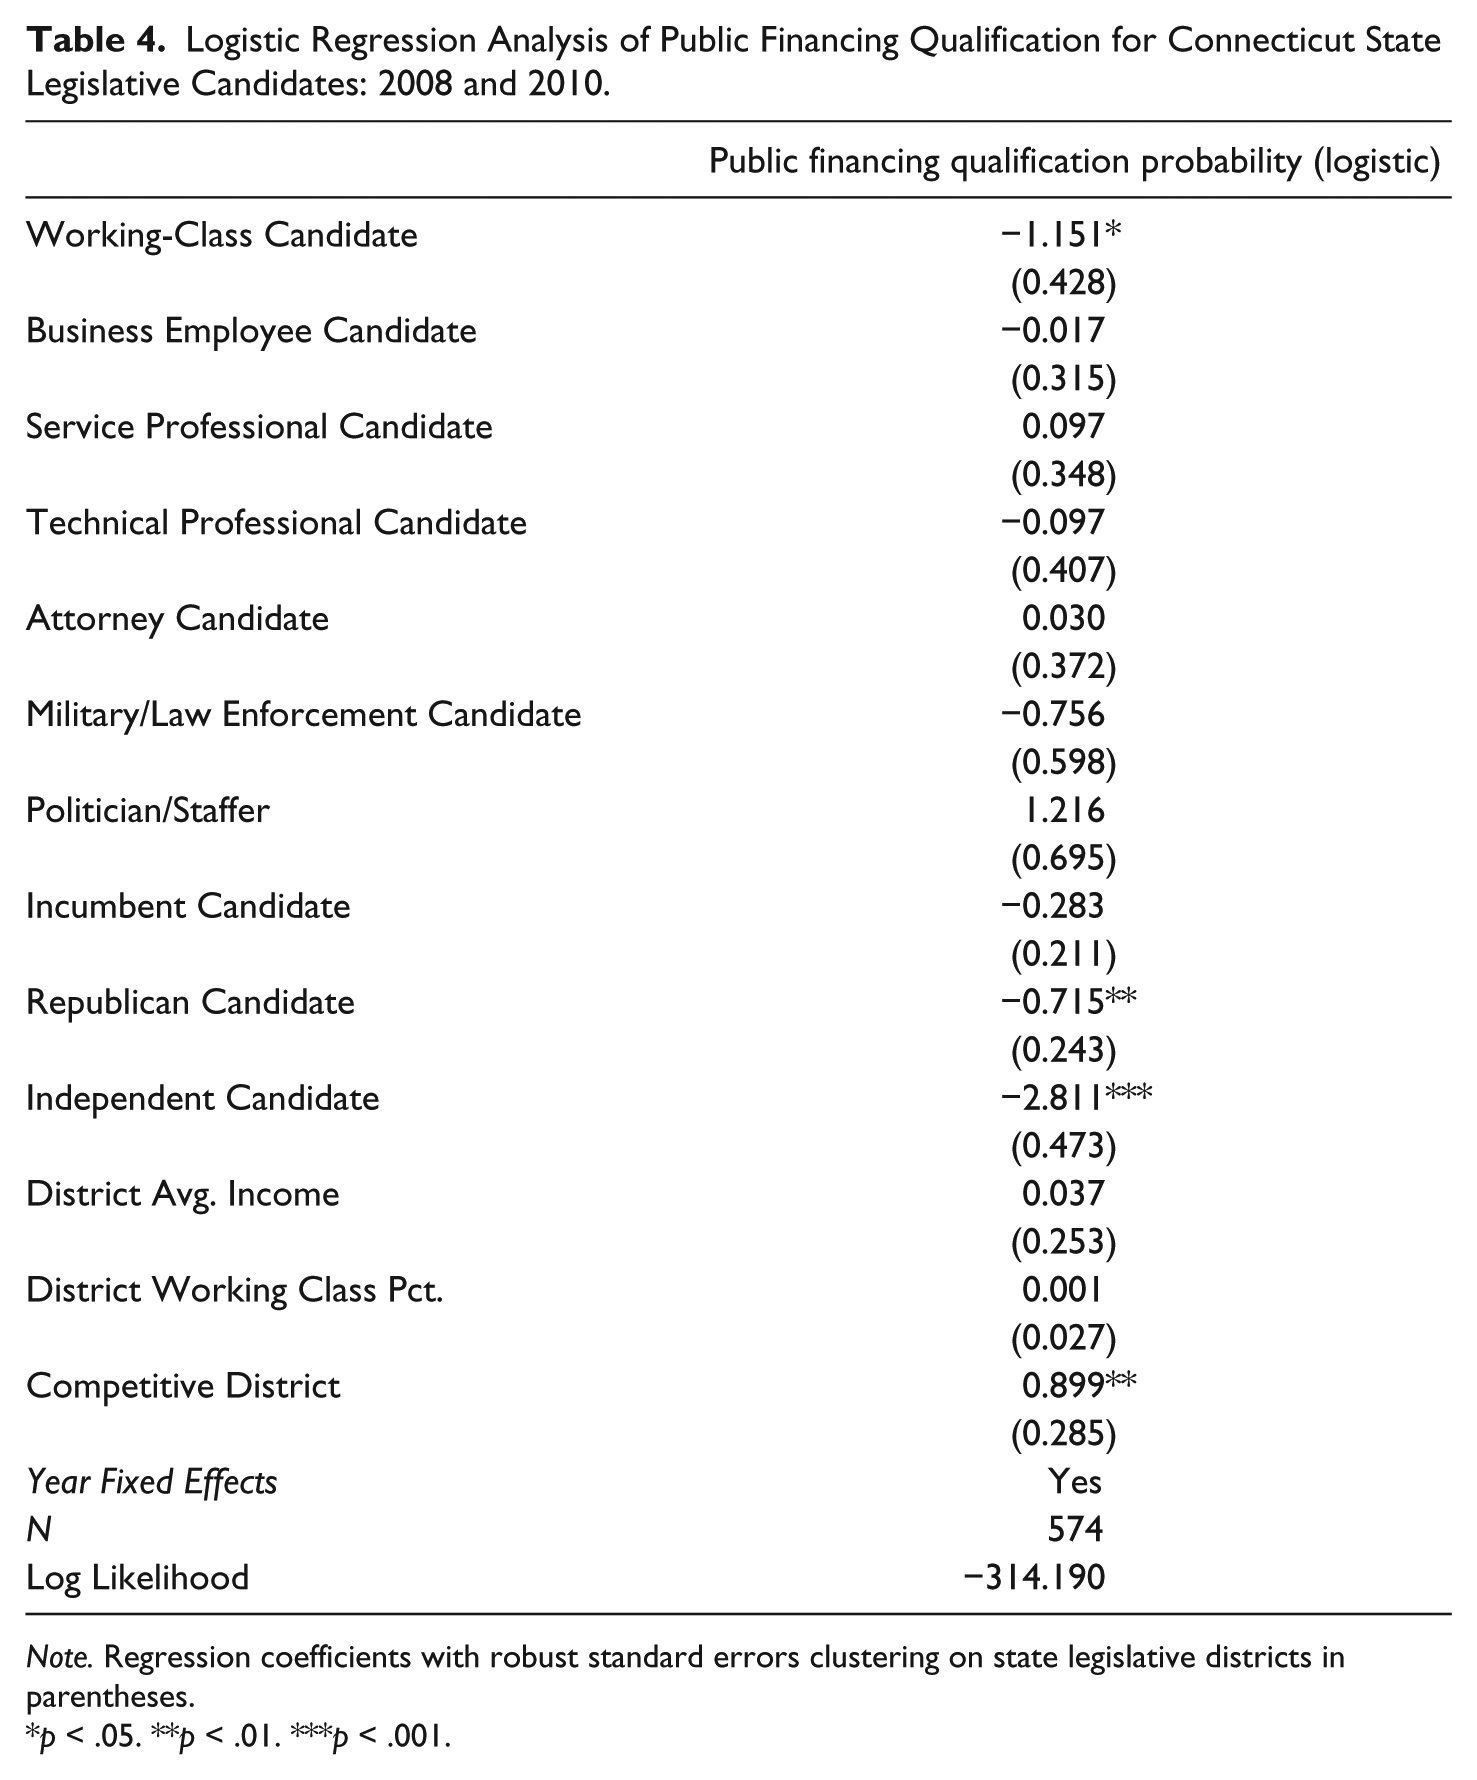
Preliminary statistical confirmation for the hypothesis that potential working-class candidates may find difficulty qualifying is evident when examining the factors behind candidate usage of public financing during the 2008 and 2010 Connecticut House of Representatives primary and general elections. Table 4 below presents a logistic regression analysis of the probability that a candidate qualified for full public financing, with standard errors clustered on Connecticut’s state legislative districts. I include control variables for candidate partisanship, 10 incumbency, district competitiveness in the previous election, district average household income, district working-class percentage, and fixed effects for the 2008 and 2010 election cycles. 11 I examine whether working-class candidates exhibit uniquely lower probabilities of utilizing public financing relative to other occupational categories by including dummy variables for working class, business employee, technical professional, attorney, politician/staffer, military/law enforcement, and service professional candidates. I exclude a business executive candidate dummy variable to establish candidates who should have the most economic and employment flexibility to qualify for public financing as the reference level. 12 If unique time and monetary constraints are keeping working-class individuals from qualifying for public financing and running for office, only working-class candidates should be less likely than the wealthiest occupational category to utilize public financing. Other occupational categories, assumed to be between working class and business executive in financial and time flexibility, should not be less likely to utilize public financing if this hypothesis were true. Finally, I add fixed effects for the 2008 and 2010 election cycles.
Logistic Regression Analysis of Public Financing Qualification for Connecticut State Legislative Candidates: 2008 and 2010.
Note. Regression coefficients with robust standard errors clustering on state legislative districts in parentheses.
p < .05. **p < .01. ***p < .001.
Working Class Candidate, a dummy variable for low candidate SES, indicates that a candidate is roughly a third (eβ= .316) as likely to utilize public financing when they are from a working-class profession (p = .01) as opposed to an executive business occupation. This finding is consistent with the idea that raising the necessary qualifying contributions may be especially challenging for working-class candidates, leading them to forgo public campaign financing. The plausibility of this claim is enhanced by the absence of significant relationships between the other occupational categories and public financing qualification. If economic factors are discouraging lower SES individuals from using public financing, individuals from other occupational backgrounds with more financial means to overcome such hurdles should be as likely to qualify as business executives. Finally, given that more than two thirds of candidates running in 2008 and 2010 were using public financing, it seems unlikely, though still possible, that unfamiliarity with the program rather than ability to qualify explains low program participation among lower SES candidates in the race. While the combination of anecdotal and statistical evidence is compelling, more investigation into whether public financing qualification barriers are dissuading potential working-class candidates is essential. The challenge, endemic to most candidate emergence research, is observing the decision-making of candidates who ultimately do not campaign. Indeed, the above analysis may understate economic differences behind public financing qualification rates, as it only examines candidates who cleared the hurdle of getting their name on the primary or general election ballot.
Conclusion
This article has sought to make a number of contributions to the literature on public financing and candidate emergence in the United States. As far as I am aware, it is the first study to examine the relationship between public campaign financing and the socioeconomic background of who runs for state legislative office. This study has also produced a data set comprehensively examining the change in occupational demographics of candidate pools and legislative bodies for three states over a period of four election cycles. My findings indicate that the number of working-class candidates competing in primary and general elections is negatively associated with the availability of full public financing (H1 and H2). Also contrary to expectations, working-class candidates were not more electorally successful in general elections when full public financing was available (H3). Anecdotal and statistical evidence suggests that the decline in working-class candidacies for Connecticut’s State House of Representatives may be related to the initial fundraising requirements of the state’s public financing program (H4). Lower SES individuals unable to raise the initial $5,000 and qualify for public financing could see their chances of victory diminished as compared with a publicly funded opponent and be, therefore, less likely to run.
Although the generalizability of these results should be discounted by the limited sample size, they are, no doubt, unexpected for advocates of public financing, who, as previously noted, argued that full public financing would reduce barriers to entry for lower SES candidates. These findings are especially surprising to the extent that they demonstrate how public financing seems to not only fail to produce the desired socioeconomic diversity in candidate pools, but can, in fact, reduce it. Public campaign financing programs, particularly those as generous as Connecticut’s, must have qualification requirements to address concerns about potential fraudulent uses of public funds, but this study draws attention to the balance to be struck between access and accountability, even for those who support public financing primarily as a means to decrease the influence of moneyed special interests in American politics. This unexpected result warrants further investigation into the relationship between public campaign financing program design and candidate socioeconomic diversity, especially as the aging of programs generates more observational data.
It is also certainly possible that other factors determining candidate emergence, such as the time commitment and salary of an elected office or one’s proximity to political networks, may be so insurmountable for lower SES candidates that their political involvement is unlikely independent of qualification requirements. Nonetheless, it is also conceivable that other structures of public financing, such as donation matching programs or “democracy voucher” programs, like the one recently instituted in Seattle, may impact the socioeconomic diversity of candidate pools in ways that full public financing cannot. Perhaps convincing friends and neighbors to donate their democracy voucher to one’s campaign poses smaller barriers to entry for lower SES candidates than the qualifying contributions model. Opportunities for replicating the foregoing study design with such programs will become more available due to the upswing of interest in these programs, and such evidence would expand our understanding of public financing’s potential to ameliorate representational inequality in the United States.
Footnotes
Appendix A
Occupational Categories in Candidate and State Legislator Data Set.
| Broad occupational category | Narrow occupational category |
|---|---|
| Technical Professional | Medical Doctor |
| Dentist | |
| Veterinarian | |
| Pharmacist | |
| Journalist | |
| Author/Public Speaker | |
| Actor/Director | |
| Musician/Entertainer | |
| Athlete | |
| Coach, Fitness Instructor, or Referee | |
| Architect or Urban Planner | |
| Accountant | |
| Economist (Nonacademic) | |
| Engineer/Scientist (Nonacademic) | |
| Computer Systems Engineer | |
| Pilot | |
| Business Owner or Executive | Bank Owner/Banker |
| Hospital/Medical Services Administrator | |
| Owner of Small/Local Business | |
| Owner/Executive of Medium/Large Business | |
| Media Executive/Publisher/Owner | |
| Business Employee | Financial Analyst |
| Paralegal | |
| Real Estate Agent or Broker | |
| Real Estate Developer | |
| Bank Manager/Investment Banker/Stock Broker | |
| Manager of Small/Local Business | |
| Manager in a Medium/Large Sized Business | |
| Business Employee | |
| Business Person (No Other Information Given) | |
| Chamber of Commerce or Jaycees Leader | |
| College Administrator | |
| Politics, Government, or Public Relations Consultant | |
| Leadership or Management Consultant | |
| Scientific or Health Care Consultant | |
| Communications or Educational Consultant | |
| Secretary | |
| Military or Law Enforcement | Law Enforcement Manager/Director |
| Law Enforcement Analyst | |
| Law Enforcement Officer or Patrolman | |
| Military Service Member | |
| Lawyer | Lawyer, Private Practice |
| Lawyer, Corporate | |
| Lawyer, Other | |
| Lawyer, Unspecified | |
| Government Attorney | |
| Politician or Staff Member | Interest Group Director, Executive, Founder |
| Interest Group Lobbyist | |
| Interest Group Worker, Political Officeholder or Staffer | |
| Farm Owner or Manager | Farmer, Farm Owner |
| Rancher, Ranch Owner | |
| Farm Manager | |
| Service Based Professional | Elementary or Secondary School Teacher, Administrator |
| College Professor | |
| Law School Professor | |
| Nurse | |
| Psychiatrist/Psychologist | |
| Librarian | |
| Social Worker | |
| Rabbi, Minister, Priest, Reverend, or Other Clergy | |
| Advocate for the Elderly | |
| Provider of Other Local Public Services | |
| Nonprofit Service Group Director or Executive | |
| Nonprofit Service Group Worker | |
| Social Activist | |
| Town or City Employee | |
| Worker | Manual Laborer |
| Service Industry Worker | |
| Union Employee/Official | |
| Facilities Manager | |
| Landscaper | |
| Other | Other occupation |
| Vague Occupational Description |
Appendix B
Appendix C

| Legislator Salary | Bowen and Greene (2014) |
| Statewide Union Membership | Hirsch and Macpherson (2003) |
Declaration of Conflicting Interests
The author(s) declared no potential conflicts of interest with respect to the research, authorship, and/or publication of this article.
Funding
The author(s) received no financial support for the research, authorship, and/or publication of this article.