
Abstract
Progress monitoring has been adopted as an integral part of multi-tiered support systems. Oral reading fluency (ORF) is the most established assessment for progress-monitoring purposes. To generate valid trend lines or slopes, ORF passages must be of equivalent difficulty. Recently, however, evidence indicates that ORF passages are not equivalent, potentially hindering our ability to generate valid student trend lines for decision making. This study examines passage and order effects on the estimation of ORF scores using a set of second-grade passages. A single group with counterbalancing design was employed to randomly assign 156 second-grade students to three different orders of passages. Scores from the passages were examined using growth curve modeling and empirical Bayes estimates. Results indicate that passage effects were substantial, but order effects were small but significant. The impact of passage and order effects on research design, equating methods, and measure development is considered.
Brief, standardized, formative assessments have become a widely used progress-monitoring tool embedded within tiered frameworks such as multi-tiered systems of support (MTSS; Baker, Fien, & Baker, 2010; National Association of State Directors of Special Education, 2006). Student data generated from formative assessment tools are used for both relatively low-stakes decisions (e.g., determining the effectiveness of an intervention; Fuchs, Fuchs, Hamlett, & Ferguson, 1992) and high-stakes decisions (e.g., part of a comprehensive evaluation for learning disability eligibility determination; Lembke, McMaster, & Stecker, 2010). The validity of using data for these purposes has recently been subject to debate, as questions about passage equivalency have been investigated (Albano & Rodriguez, 2012; Ardoin & Christ, 2009; Ardoin, Williams, Christ, Klubnik, & Wellborn, 2010; Baker et al., 2008; Bolt, Ysseldyke, & Patterson, 2010; Christ & Silberglitt, 2007; Cummings, Park, & Schaper, 2013; Francis et al., 2008; Petscher, Cummings, Biancarosa, & Fien, 2013; Stoolmiller, Biancarosa, & Fien, 2013). Educators use trend lines or slopes generated from frequent administrations over time to evaluate student growth, and without valid estimates, the trustworthiness of the data-based decision-making process is jeopardized. In other words, when school personnel make inferences about student growth, it should be informed by true student learning over a specific period of time and not be influenced by varying levels of difficulty or scaling across alternate forms (AFs; Griffiths, VanDerHeyden, Skokut, & Lilles, 2009). Form effects may undermine the ability to reliably and validly chart student growth for use in low- and high-stakes decision making.
Order effects are also a common threat to valid inferences about student proficiency and growth. Order effects are a result of the AF presentation during one testing period (e.g., student is administered forms A, B, C vs. C, B, A). The assumption is that student scores should be the same when AFs have the same difficulty level and they are administered at the same point in time, regardless of presentation order. For example, a common order effect of concern to teachers is the practice effect, which occurs when student scores are enhanced by repeated exposure to the same form or the same task on an AF. Students with different levels of reading skills may be impacted differentially by varying presentation orders. In one potential scenario, student scores could improve due to a warm-up effect. In this example, if a teacher were to plot the scores on a graph connecting three scores, there would be a positive slope. In an alternate scenario, student scores could deteriorate due to a fatigue effect leading to a negatively sloped line. In this study, we focus on simple order effects that could alter the true means on the AFs, depending on the administration order of AFs.
The purpose of this study is twofold: (a) to partially replicate the study from Francis et al. (2008) in an attempt to confirm the findings that form and order effects do exist within one set of progress-monitoring forms, and (b) to extend the findings from that same study to determine the magnitude of form and order effects. This study expands on the work of the Francis et al.’s (2008) study in three ways: using (a) a different research design specifically suited to examine form and order effects, (b) a wider sample of passages, and (c) a sample of students that more closely represents the students typically targeted for progress-monitoring activities. We evaluate one set of second-grade ORF progress-monitoring passages and pose the following research questions:
Developing Progress-Monitoring Measures: Past and Present
Over the past 30 years, special education and school psychology researchers have been developing formative assessments often referred to as curriculum-based measures (CBM; Deno, 1985). Although the label CBM remains common in today’s education measurement vernacular, widely used CBM-style assessments are no longer based on any particular curriculum. CBM-style assessments are also called formative assessments, general outcome measures (Fuchs & Deno, 1992), or progress-monitoring measures (Silberglitt & Hintze, 2005). The measure used in this study is a CBM-style assessment, which we will refer to as a progress-monitoring measure. The measures were developed to quantify student performance in reading and other core content areas to aid teachers in making informed data-based instructional adjustments (Deno, 1985; Hosp, Hosp, & Howell, 2007; Shinn, 1989).
When the CBM assessments were originally developed over three decades ago, researchers (Deno, 1985; Fuchs & Deno, 1992; Shinn, 1989) first used sections of text directly from the grade-level curriculum used in the classroom. Over time, researchers moved to methods that included the use of readability formulae to attempt to constrain variability in passage difficulty and to group sets of passages together based on the similarity of their readability levels (Ardoin et al., 2010; Christ & Ardoin, 2009; Powell-Smith & Bradley-Klug, 2001; Zakaluk & Samuels, 1988). Using readability formulae is a practice that has endured despite evidence that it may not be sufficient to create adequate passage equivalence (Albano & Rodriguez, 2012; Betts, Pickart, & Heistad, 2009; Cummings et al., 2013; Francis et al., 2008; Stoolmiller et al., 2013).
The DIBELS 6th Edition (Good & Kaminski, 2002c) oral reading fluency (ORF) passages used in this study were generated as a set of 29 passages of “approximate equivalence” and at a second-grade reading level (e.g., target Spache readabilities for second grade were 2.4, 2.5, 2.6, or 2.7; Good & Kaminski, 2002b). The researchers rank ordered the reading passages according to readability scores and identified passage difficulty level as relatively easy for the first third in the distribution, medium for the middle third, or difficult for the final third in the distribution (see Good & Kaminski, 2002a, for a detailed explanation). Nine passages were selected to create three sets of benchmark passage sets, each comprised of one easy, medium, and difficult passage used for screening at the beginning, middle, and end of school year for all students. The remaining 20 passages became progress-monitoring passages intended to be administered more frequently with students at risk of reading failure. Of these progress-monitoring passages, six were designated as easy, eight as medium, and six as difficult within a set range that represented a specific reading level appropriate for each grade level. The passages were then systematically arranged with two medium passages randomly assigned to come first, followed by six triads of randomly chosen easy, medium, and difficult passages. Within each triad, the passages were arranged in order of increasing difficulty. The administration manual recommends that the passages be administered to students in that order, one at a time over the course of the school year. For students at some risk or high risk of reading failure, best practice suggests that progress-monitoring passages be administered more frequently than 3 times per year (Deno et al., 2009).
A review of the technical adequacy information available for other widely used ORF measures, such as those included in the easyCBM and AIMSweb systems, revealed that the use of readability formulae continues to be a common practice in the development of ORF passage-monitoring measures (Howe & Shinn, 2002). Other techniques, such as item response theory (IRT), have been implemented in recent years sometimes in conjunction with the use of readability formulae (Alonzo & Tindal, 2007). Linguists and educational researchers alike have noted general challenges associated with readability formulae (Anderson & Davison, 1988; Bailin & Grafstein, 2001; Bruce & Rubin, 1988; Zakaluk & Samuels, 1988) and for the development of equivalent passage sets in particular (Ardoin & Christ, 2009; Ardoin, Suldo, Witt, Aldrich, & McDonald, 2005; Ardoin et al., 2010; Cummings et al., 2013; Francis et al., 2008; Fuchs, Fuchs, & Deno, 1982; Poncy, Skinner, & Axtell, 2005). For example, formulae are not standardized, and each formula measures different aspects of word difficulty (e.g., number of syllables) and syntactic complexity (e.g., number of sentences; Bruce & Rubin, 1988). Despite efforts from a variety of researchers, it appears that there are not standard methods of developing equivalent progress-monitoring measures. Although another statistical method, equating, has been suggested by some researchers, test developers do not appear to follow commonly accepted methods for reliably developing and equating progress-monitoring passages (Albano & Rodriguez, 2012; Ardoin & Christ, 2009; Betts et al., 2009; Christ & Silberglitt, 2007; Cummings et al., 2013; Petscher et al., 2013). In this study, we will examine the magnitude and impact of form and order effects in the creation of standardized measure development for equivalent AFs.
Analyzing Passage and Order Effects
From a statistical perspective, there is no question as to whether equating methods can ameliorate differences in raw scores from progress-monitoring passages of varying difficulty levels (Dorans, 1990). Questions remain about which research designs are optimal for progress-monitoring probes such as ORF passages and whether the passage and order effects are significant enough to warrant future equating studies. A handful of published studies have addressed score equivalency across ORF AFs (Albano & Rodriguez, 2012; Betts et al., 2009; Cummings et al., 2013; Francis et al., 2008; Stoolmiller et al., 2013). Francis et al. (2008) examined progress-monitoring scores from a subset of six of the 20 second-grade DIBELS 6th Edition ORF passages (Good & Kaminski, 2002a) for passage effects. The passages were administered to a sample of 134 students from two schools in one Texas school district. Although progress-monitoring passages were evaluated, the students sampled were average readers performing on grade level, and the mean score was within grade-level performance criteria. The research design employed was a single-group design with partial counterbalancing, whereby students were administered all the same passages but the passage order was varied in an effort to control for order effects. In this case, there were six administration orders tested to which six groups of students were randomly assigned. Students read one of the six passages in each wave across 7 weeks in the middle of the school year.
Using raw scores in a mixed-model ANOVA and controlling for initial fluency differences, the researchers determined that the passages were significantly different in terms of their means and variances, indicating that varying degrees of difficulty existed within the set of passages. Prior to equating the scores, there were significant differences across the groups, and order effects were not statistically significant. After equating methods were used, the magnitude of the order effect was reported as an average of three correct words per minute (CWPM), but whether the order effect was statistically significant was not reported. We interpret this to mean that if a student was administered three passages at one time point, we would expect their score to increase by three CWPM in between the first and second passages and another three CWPM from the second to the third passages. Francis et al. (2008) suggested that future studies use larger samples with counterbalancing to more precisely examine the magnitude of order effects. In addition, including student samples that are more representative of the targeted population (i.e., readers at risk of reading failure) could increase the generalizability of this and similar studies.
Albano and Rodriguez (2012) used the group means and standard deviations (SDs) from the first three passages of the Francis et al. (2008) study to demonstrate different statistical equating methods. The researchers sampled the dataset in a way that resulted in an unequal number of students in each group. Albano and Rodriguez (2012) noted that in their analysis not all students read all passages, which can be described as a partially random-groups design (Kolen & Brennan, 2014), a research design that is not ideal when order effects are suspected. The authors demonstrated how different types of equating methods result in score conversions that vary for students at different skill levels. Equating methods demonstrated the ability to control for passage effects. However, similar to Francis et al. (2008), order effects were not addressed.
Stoolmiller et al. (2013) also examined DIBELS 6th Edition second-grade ORF with a focus on the three passages administered as part of spring benchmark testing. The study, which could be characterized as a single-group design without counterbalancing, used an extant dataset involving a sample of 600 students in which all students were administered the same three passages in the same order. The mean ORF score indicated that the students were in the some-risk to high-risk categories, indicating that the group was representative of the targeted student population for progress-monitoring passages and not representative of all skill levels. Similar to the Francis et al.’s (2008) study, form effects were significant, but order effects were not addressed. The single-group design without counterbalancing is usually discouraged in the traditional equating literature because order effects cannot be detected (Kolen & Brennan, 2014). Stoolmiller et al. (2013) are unable to shed light on the area of order effects; although similar to other studies, it contributes to the idea that equating methods are needed because raw scores vary as a result of passage difficulty.
Cummings et al. (2013) examined the passage equivalency of DIBELS 7th Edition, also referred to as DIBELS Next, three winter benchmarks and four progress-monitoring passages with 144 second graders. Their primary aim was to attempt different approaches to equating for both effectiveness and efficiency somewhat similar to Albano and Rodriguez (2012). The students sampled demonstrated average grade-level reading skills. Similar to the Francis et al. (2008) and Stoolmiller et al. (2013) studies described previously, significant form effects (p < .001) were found across passages from second grade. This study contributes evidence that more recently developed sets of progress-monitoring passages continue to suffer from passage effects. Similarly, the researchers provided evidence for concern regarding order effects. Small but significant order effects (p = .028) were detected. Within-student passage effects explained 23.1% and order effects explained less than 1% of the variance among repeated measurements. This study reported that the size of these effects on raw scores was influenced by the students’ level of risk of reading failure (i.e., high risk, some risk, or low risk). First, the passage effect was moderated by student risk status, whereby students at greater risk demonstrated more variability than students who were low risk across passages. Second, students at low risk of reading failure benefitted from an order (i.e., practice) effect and demonstrated slightly higher scores on the final passage read, regardless of counterbalancing. In other words, this study reported that initial status was positively correlated with the order slope. For second-grade students, they found that winter benchmark ORF predicted order slope when students read four passages at a single occasion. Cummings et al. (2013) made the unique contribution that order effects are detectable and significant for students who were reading on grade level and that order effects had a smaller impact with learners at risk of reading failure.
In summary, there is mounting evidence of passage and order effects within sets of progress-monitoring passages; however, questions remain in regard to the magnitude of these effects and the potential impact on progress-monitoring measure development. The study presented here uniquely contributes to the fields’ developing knowledge in three ways. One, to our knowledge, no studies have been conducted with a sample of students who are representative of the target population, a recommended practice (Kolen & Brennan, 2014). Two, this study examines passage and order effects with a significantly larger number of passages (18 of 20 DIBELS 6th Edition passages) than has been used in prior studies. Three, we purposefully employed a research design (single-group design with counterbalancing) that would allow us to examine the magnitude of order effects in addition to passage effects.
Purpose of The Study
Evidence to date suggests that (a) a priori readability statistics alone may not be sufficient or adequate indices of passage equivalency and (b) passage effects do exist within various sets of currently used ORF passages. In regard to order effects, we have conflicting and limited information. In one study, order effects were small and inconsistent, nonsignificant before equating, and significant after equating (Francis et al., 2008); in another study, order effects are small and statistically significant and varied by student skill (Cummings et al., 2013). The research designs of the reviewed studies varied and may influence our ability to isolate the impact and magnitude of passage and order effects. This study expands on the findings from Francis et al. (2008), which is the only other study to examine DIBELS 6th Edition progress-monitoring passages, a set of measures that remain in wide use. Although DIBELS Next is also on the market, many schools continue to use the 6th Edition. The manager of an international data warehouse reports that over 150,000 students across the United States have DIBELS 6th Edition data entered into their data management system for the 2015-2016 school year (M. Warman, personal communication, October 13, 2016).
One strength of this study is that the sample includes students who more closely model the targeted student population for progress monitoring from a larger number of schools. ORF scores of students at varying levels of risk are differentially influenced by form and order effects (Cummings et al., 2013), so it is important that the sample include students who are similar to those most likely to be administered the passages in schools, thus improving generalizability of findings. Another strength of this study is the particular passages used, which includes the six passages used in the Francis et al. (2008) study plus an additional 12 passages, thus more fully representing the complete set of 20 progress-monitoring passages. The final unique contribution of this study is the research design, which allows us to examine order effects more precisely than the previously reviewed studies. In this single-group design with counterbalancing study, all students read the same passages but were assigned to different presentation order conditions (i.e., heterogeneous, homogeneous, and random), allowing for the examination of the magnitude of order effects.
In this study, we evaluated one set of second-grade ORF progress-monitoring passages and posed the following research questions:
Method
Participants and Setting
Participants in this study were second-grade students enrolled in six Pacific Northwest elementary schools participating in a federally funded early literacy initiative. Two of these schools were located in large urban areas and four were located in smaller rural areas. At the school level, the percentage of students eligible for Free and Reduced Price Lunch services ranged from 55.6% to 92.5% and the percentage of students participating in English as a second language (ESL) programs ranged from 0.3% to 46.6%.
A total of 156 students from these six schools participated in the study, 47, 44, 20, 19, 15, and 11 from each school, respectively. Of these 156 students, 96 were male, 58 were female, and gender was not provided for two students. The ethnic composition of this sample was 30.3% White, non-Hispanic, 41.2% Hispanic, 7.8% African American, and 2% Asian; information about race/ethnicity was not available for 18% of students in the sample. Although participation in ESL programs was not provided for all students, based on the data provided approximately 18.1% of students participated in ESL programs. The majority of student participants had previously been identified as being at high risk or some risk of later reading failure on DIBELS ORF. Based on benchmark data from the winter universal screening data collection prior to the administration of the progress-monitoring measures, 79 students (50.9%) were considered to be at high risk, 59 (37.6%) were considered to be at some risk, and 18 (11.5%) were considered to be at low risk or performing at grade level.
Measure
DIBELS ORF is a 1-min, standardized measure designed to assess how fluently students can read narrative and expository passages of connected text. The number of words read correctly in 1 min is the student’s raw score. Research on DIBELS ORF passages has provided evidence of strong reliability, with AF reliability from .89 to .94 and test–retest reliabilities for elementary students from .92 to .97 (Good & Kaminski, 2002a). Baker et al. (2008) reported concurrent validity of .80 with Grade 2 SAT-10. DIBELS has been shown to have good construct/convergent validity (r = .70; Buck & Torgesen, 2003).
Procedures
Passage selection
In the second grade, DIBELS 6th Edition includes 20 passages identified for progress monitoring. For this study, students read 18 of the 20 DIBELS ORF passages over the course of 11 weeks, from February through April. Students were randomly assigned to three different conditions labeled heterogeneous, homogeneous, and random, which standardized passage order; conditions are described below. Students read three passages every other week (i.e., alternating weeks). A wave here is defined as each group of three passages. In all, there were six testing waves (modeled after Francis et al., 2008) of three passages each across 11 weeks.
Of the 20 possible passages, 18 are included in the study. Although considered by the test developers to be equivalent, they used readability indices to identify six easy, six medium, and six difficult passages that were determined to be of the same readability level. The two medium passages found at the beginning of the progress-monitoring set of passages (i.e., “Riding the Bus to School” and “Riding the Elevator”) were excluded because their readability difficulty level is the most common and is represented by other passages in the sample. The six passages included in Francis et al. (2008) were also included in this study. Within each condition and wave, the passages were counterbalanced into six random orders. Students were randomly assigned first to condition and then to the order of passages within condition and waves. The purpose of the research design and associated conditions was to be able to examine order effects in a systematic manner. In Table 1, all passages are numbered and broken up by condition, wave, and difficulty level on the Spache readability index within wave.
Descriptive Statistics of Oral Reading Fluency Scores for Conditions, Waves, and Passages.
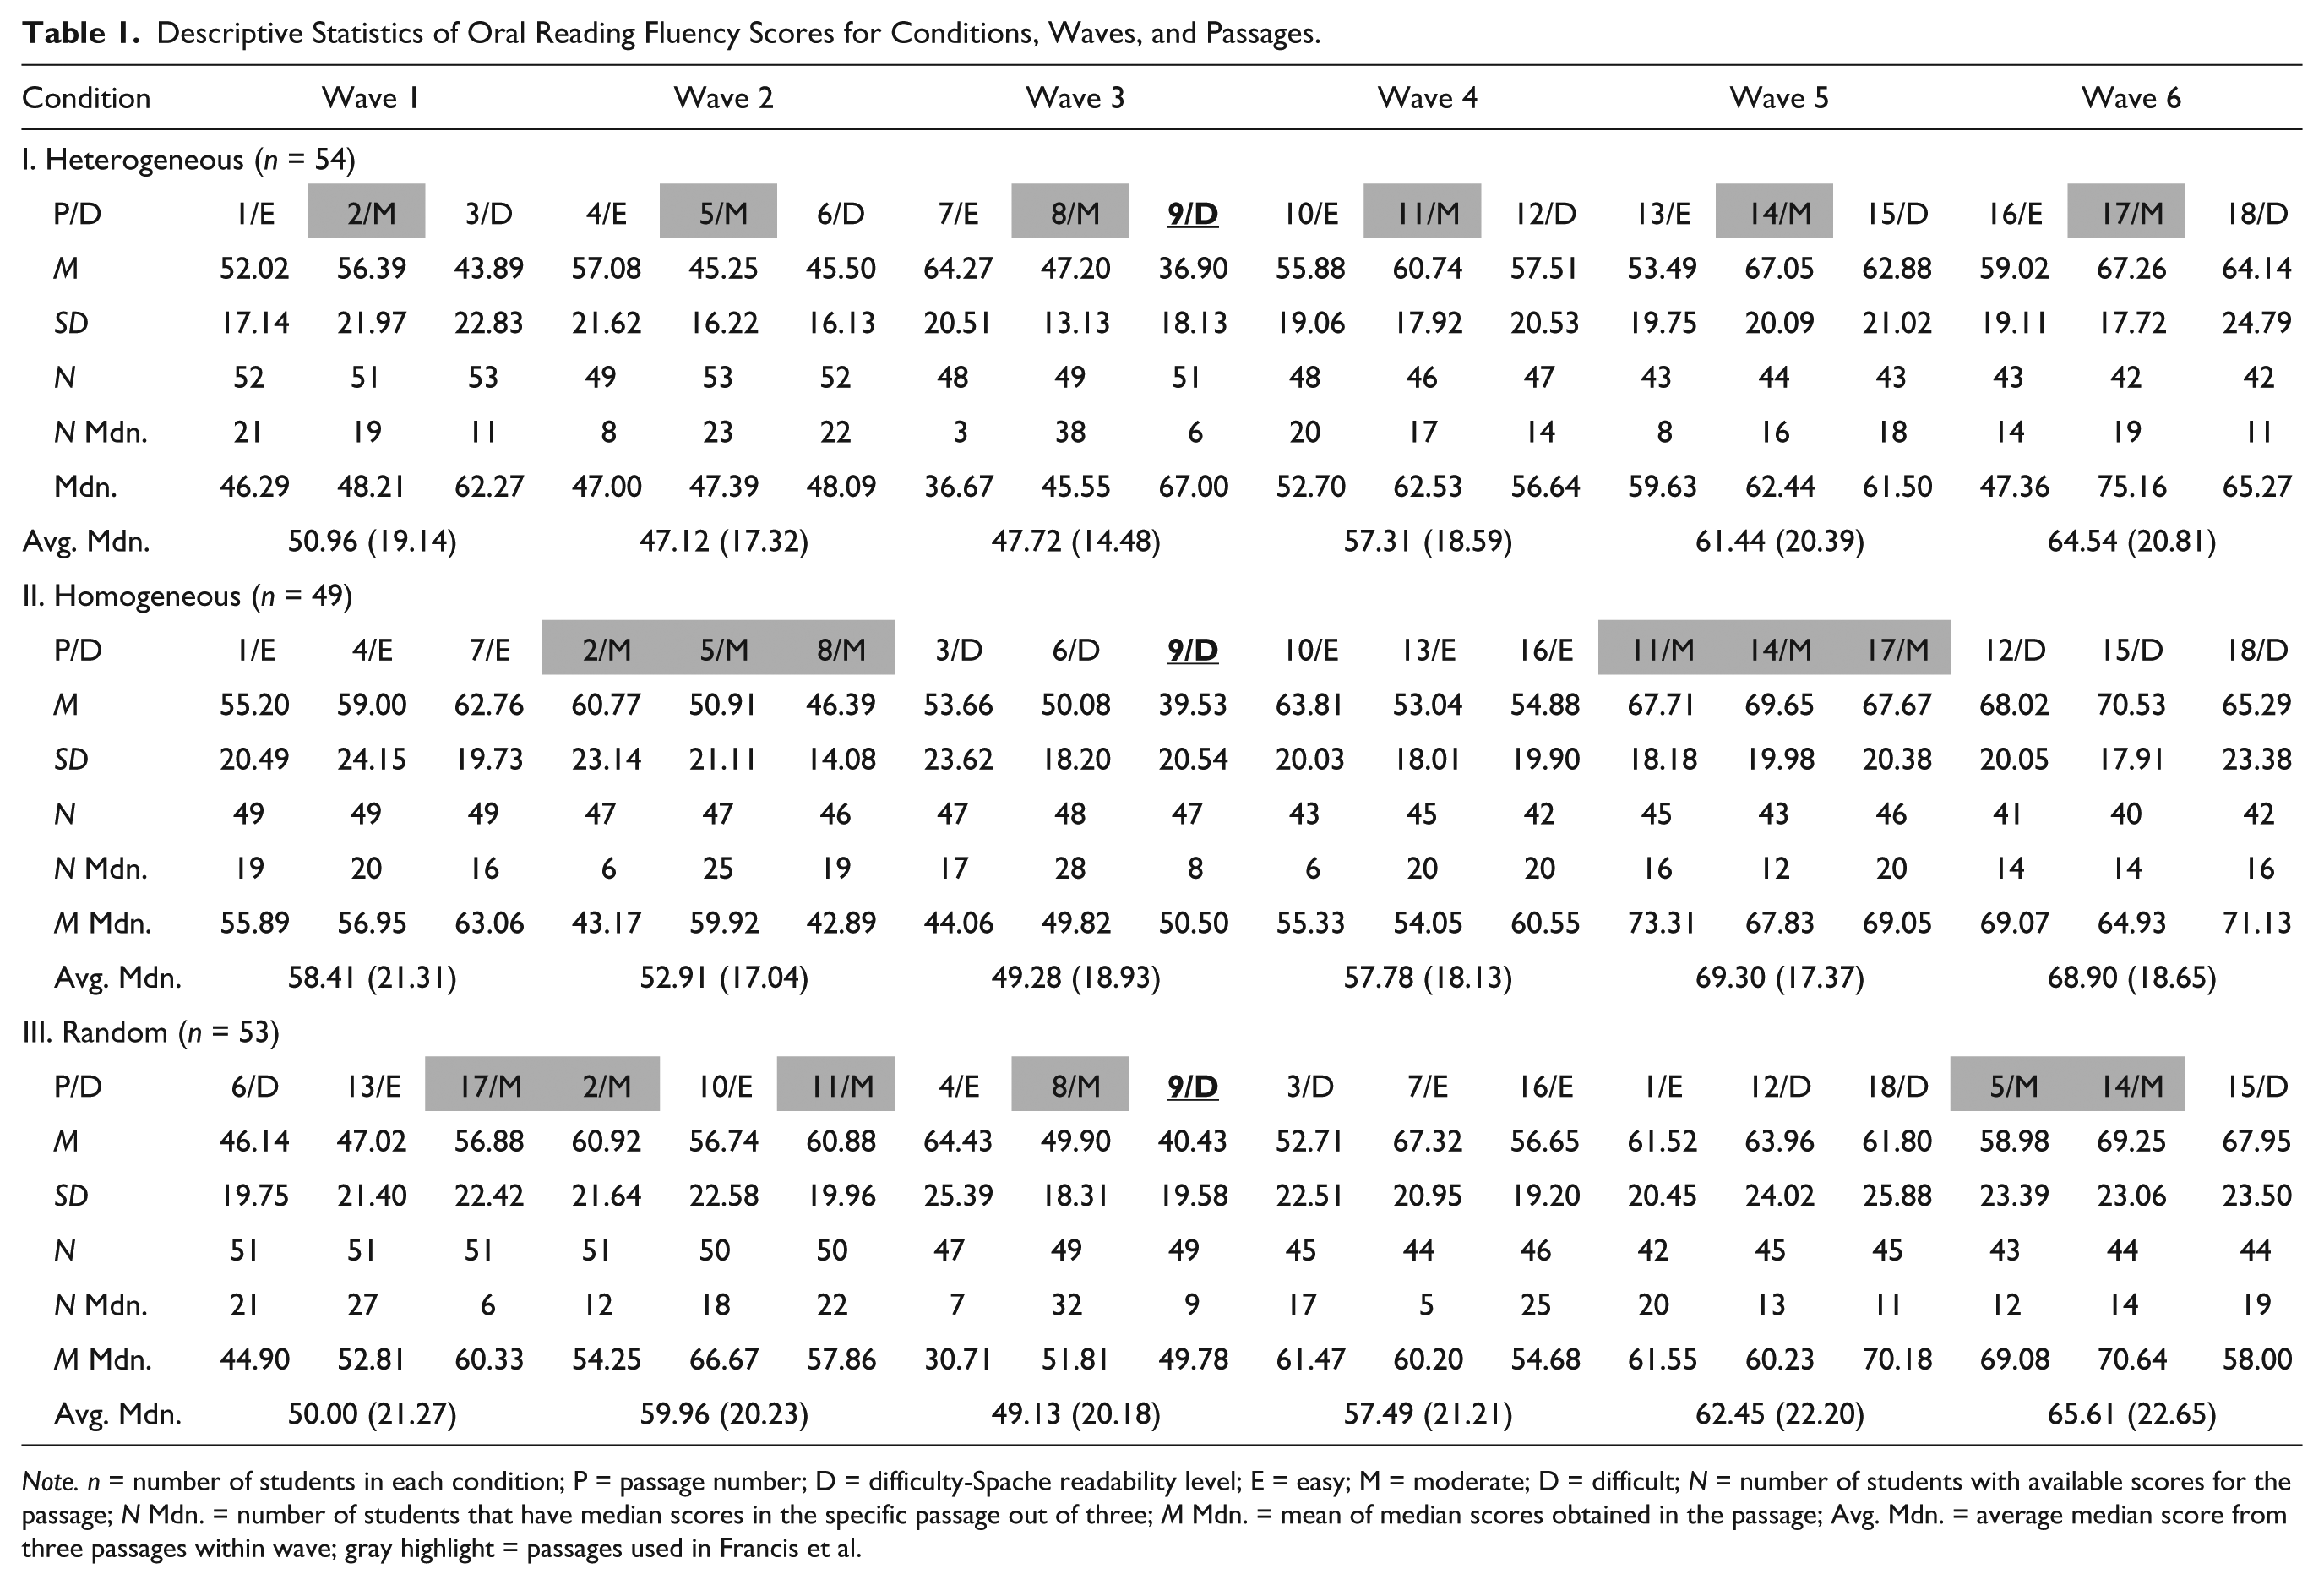
Note. n = number of students in each condition; P = passage number; D = difficulty-Spache readability level; E = easy; M = moderate; D = difficult; N = number of students with available scores for the passage; N Mdn. = number of students that have median scores in the specific passage out of three; M Mdn. = mean of median scores obtained in the passage; Avg. Mdn. = average median score from three passages within wave; gray highlight = passages used in Francis et al.
Condition 1: Heterogeneous
This condition included easy, medium, and difficult passages within each wave as identified in the DIBELS Administration and Scoring Guide (Good & Kaminski, 2002b). The order of passages across waves was the same as the order of the passages used by schools when administering the DIBELS 6th Edition progress-monitoring passages. In other words, each DIBELS progress-monitoring passage was ordered from 1 to 18 (excluding the two passages noted earlier). Passages 1, 2, and 3 were administered in Wave 1; passages 4, 5, and 6 were administered in Wave 2, and so on.
Condition 2: Homogeneous
This condition included passages of the same difficulty within wave, rotating in succession from easy to difficult and repeating across the waves. Across the six waves, passages were grouped by easy (Waves 1 and 4), medium (Waves 2 and 5), and difficult (Waves 3 and 6).
Condition 3: Random
This condition included the random order of easy, medium, and difficult passages across waves. Each wave may have included more than one easy, medium, or difficult passage. Table 1 groups all the passages by condition and displays the wave in which each passage was administered, as well as their difficulty level as determined by the authors’ use of readability indices.
Data collection
The selected DIBELS ORF passages were administered to students by school-based assessment teams. Each assessment team received a day of training on DIBELS administration and scoring. Testers followed standard DIBELS administration and scoring directions for the ORF measures and used the paper-and-pencil version of the measure. To maintain consistency across testers, school reading coaches conducted individual reliability checks with each assessment team member before data collection using the standardized DIBELS Assessment Integrity Checklist (Good & Kaminski, 2002a). In addition, test–retest reliability data were collected in a random sample of the participating schools. In the spring, four of the six schools were randomly selected and 20% of the students in the second grade were retested on ORF by university staff within 2 weeks of the school’s spring benchmark data collection; mean test–retest reliability was .97 for ORF.
Analysis
Analyses of the data generated from the progress-monitoring passages focused on passage, student growth, and order effects using a nonhierarchical mixed model. Although assignment to condition was used to manipulate the order of presentation of passage difficulty as determined by readability indices, we strongly suspected that this would make no difference, beyond that of other effects. We hypothesized conditions 1 (heterogeneous) and 2 (homogeneous) to be equivalent to condition 3 (random) and to each other after controlling for passage, order, and school effects. Passage, student, and wave within student were specified as random effects, and condition, wave, order, and school were specified as fixed effects. Conceptually, we suggest school is a random effect, but because school effects are not our focus and there are only six schools in our sample, we treated school as a fixed effect. A simplified heuristic path diagram is shown in Figure 1.

P1 to P3 stands for position in the order of testing. Initial ORF, Wave Slope, and Order Slope are correlated. AF indicates alternative form number. Because the model is nonhierarchical, the actual alternative form varies across students at any given wave position. The AF effect is not correlated with any student-level effects. Residual influences at the repeated-measure level are not shown to simplify the diagram. School effects are also not shown.
To anchor the model to the existing growth curve literature, Figure 1 shows the student-level model on the left as if the repeated measures within waves within students were strung out in wide format, similar to a second-order latent growth curve model (Preacher, Wichman, MacCallum, & Briggs, 2008, p. 63). Indeed, if the AFs were psychometrically equivalent and the sample size was sufficient, the student-level model could be estimated as shown in the diagram. To keep the diagram simple and compact, three ellipses indicate a repeating model structure; the correlations among the student growth factors (initial ORF, wave, and order slope) are not shown; school effects are omitted, and the within-cell residual influences are not shown. The model for the alternative forms is shown on the right side of the diagram and is a simple random intercept model. The latent factors for the student growth and alternative forms are uncorrelated. Because students and alternative forms are partially crossed and nonhierarchical, actual estimation was carried out using data in a tall format in LMER (Linear Mixed Effects models in R, where R is the stat package where LMER lives), a mixed-effects program optimized for nonhierarchical designs (Bates, Maechler, Bolker, & Walker, 2015; R Core Team, 2017).
A student-level correlated intercept and wave slope were specified to capture variation in ORF at the initial wave and variation in linear change in ORF across waves (1–6). To test key hypotheses about student-level variation in order effects, an order slope was specified, but to keep the model simple, we assumed a single student-level slope for order that remained constant across waves. Thus, each student had an intercept, a wave slope, and an order slope. These three random effects were initially allowed to correlate, but the correlations were removed if they were not significant to keep the model simple.
To test hypotheses about form effects, a passage-level random intercept was specified to model variation in ORF across passages that was uncorrelated with all other random effects for students. If equivalence of passages holds, the variance estimate of the random intercept for passages will be close to zero and nonsignificant, net of other effects in the model. A significant passage effect variance estimate indicates nonequivalence (i.e., passage effects). The larger the passage effect variance, the more severe the nonequivalence. In a preliminary model, readability indices were included as a fixed predictor of the passage-level random intercept.
To analyze the magnitude of the form and order effects, we determined the upper and lower values that mark the middle 95% of the estimated distributions to give an indication of the “worst case” effect size on the raw CWPM scale. A visual display of the empirical Bayes estimates of the passage mean estimates is presented in Figure 2 to give an indication of the size of the passage effects in our particular sample.
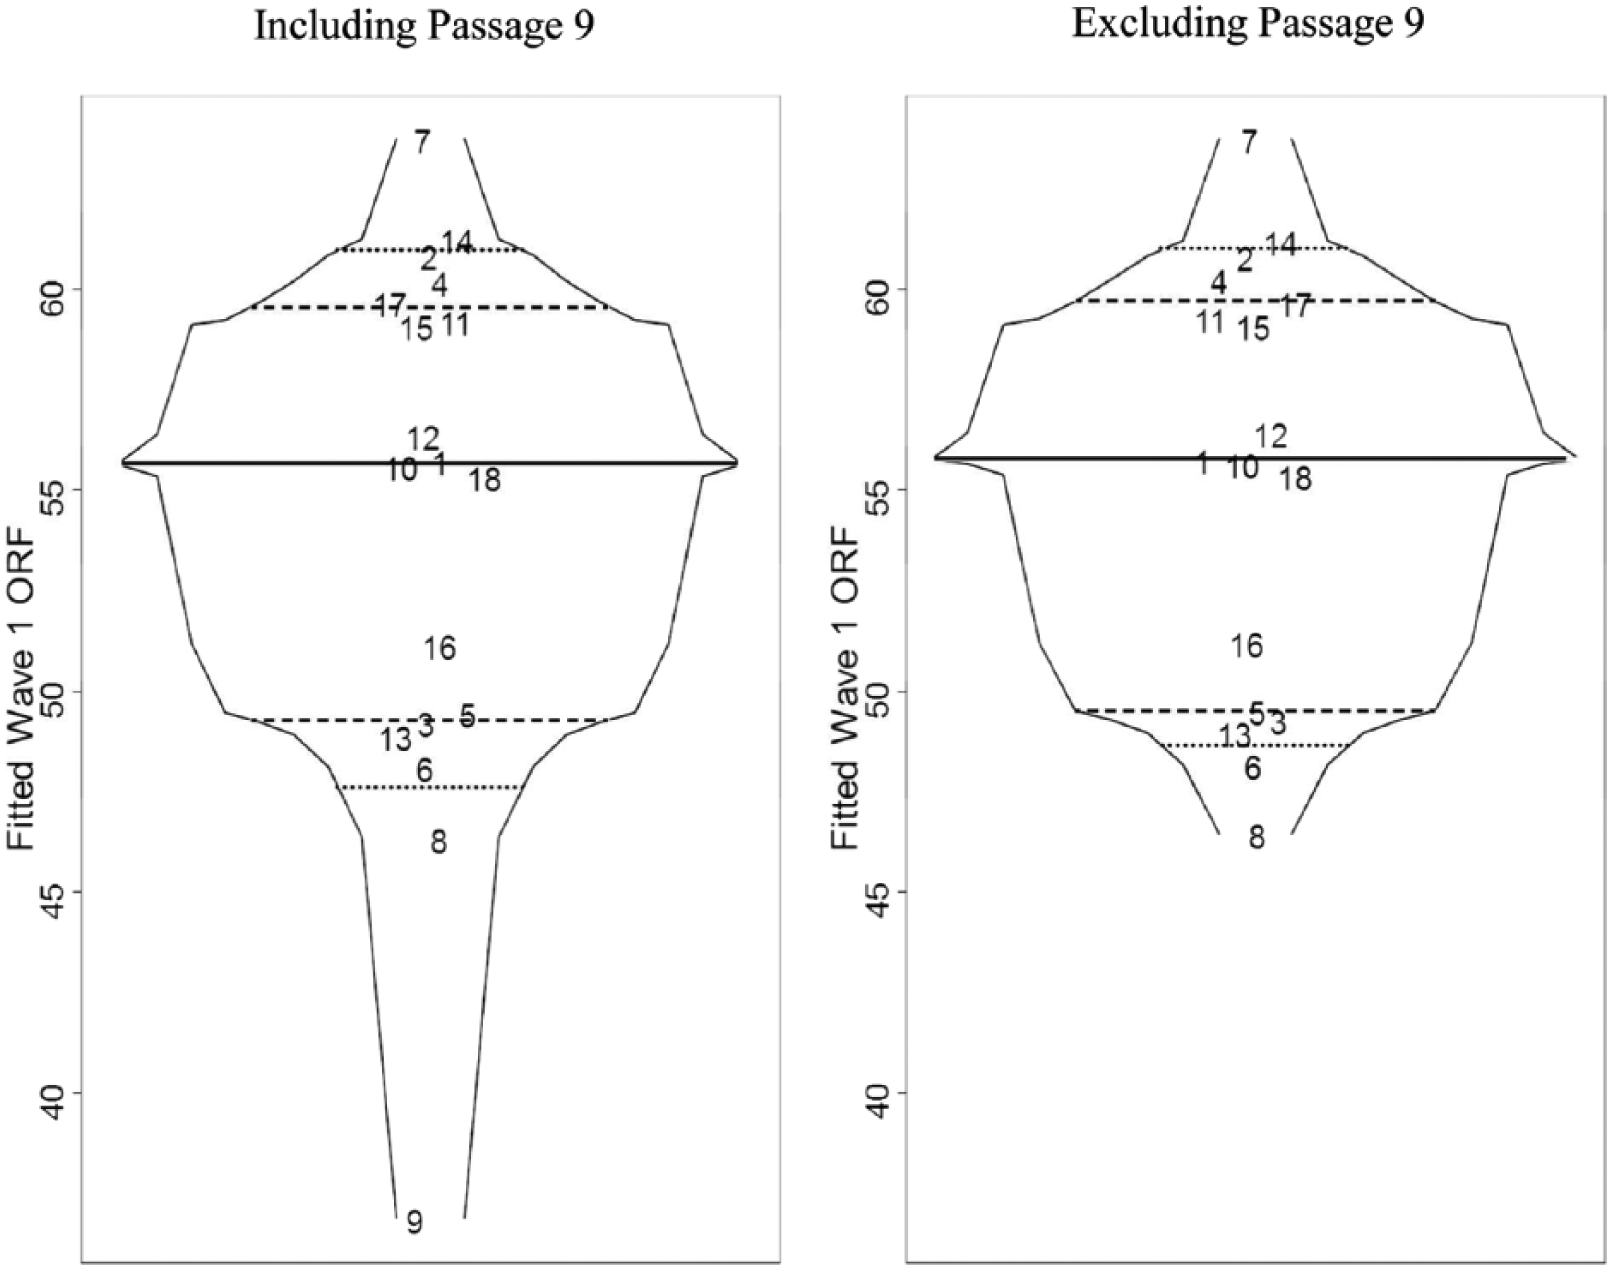
Box percentile plots of empirical Bayes estimates of passage effects (passage number is plotted) with and without including Passage 9.
Results
Descriptive statistics of students’ ORF scores by condition, wave, and passage are reported in Table 1. Table 1 also includes information about the Spache readability difficulty level (easy, medium, and difficult; see Good & Kaminski, 2002a) of each passage included in this study. The passages used in Francis et al. (2008) are highlighted in gray.
Research Question 1: Do the Differences Between Testing Conditions Impact Form or Order Effects?
Preliminary mixed models (results not shown) revealed that there were no significant differences for the fixed effects involving condition, neither main effects (Wald χ2 = .95, df = 2, p = .6231) nor for interaction effects with wave (Wald χ2 = 1.07, df = 2, p = .5864) and order (Wald χ2 = .35, df = 2, p = .8385) net of all other predictors. None of the six single-degree-of-freedom contrasts involved in the three 2-degree-of-freedom tests for condition were significant at p < .05, either. In addition, including separate variance components for wave within student, student, and AF random effects across conditions did not significantly improve the fit of the model when a likelihood ratio test (LRT) was ran (LRT χ2 = 30.89, df = 25, p = .5969), meaning condition did not impact the model. Thus, condition was dropped from further consideration.
Research Question 2: Do Readability Indices Predict Form Effects?
The fixed effect of the Spache readability index on the random AF intercept was very small and nonsignificant, so it too was dropped from further consideration. School effects were significant (Wald χ2 = 22.90, df = 5, p = .0004) and thus were retained in subsequent models.
Research Question 3: What Is the Magnitude of Form and Order Effects for DIBELS 6th Edition Progress-Monitoring Passages?
After eliminating condition, LRTs on the model in Figure 1 revealed that variance components for the student-level wave and order slopes and the AF intercept were all significant (p < .0001, p = .0046, and p < .0001, respectively, see Table 3). The three correlations among the student-level random effects were small in magnitude (intercept–wave slope = .03, intercept–order slope = −.15, wave slope–order slope = .39) and not significant (LRT = 3.66, df = 3, p = .3006, results not shown) and so were subsequently dropped from the model. Thus, the model indicates that passage invariance did not hold, and AF effects were statistically significant; order effects varied significantly across students and despite the order and passage effects, variance in growth across students was significant.
Parameter estimates for our final preferred model are shown in Tables 2 and 3, which is the same model presented in Figure 1, except correlations among the three student-level random effects are constrained to zero. Diagnostic plots (not shown) of the within-cell residuals appeared reasonable and did not suggest any serious problems with the final model. The student growth parameters in Table 2 pertain to a student from the particular school in our sample, School A, that served as the reference school when schools were dummy-coded (among the schools in our sample, this school’s sample had intermediate or “some-risk” levels of ORF). Wave 1 level of ORF was about 54 CWPM (SD of about 17.5) and growth was about 2 CWPM per wave (SD about 1.4) over the next five waves for a total gain by Wave 6 of 10 CWPM, on average. The means for Wave 1 level and growth rate are typical for students likely to be progress monitored. Note that these starting levels and growth rates are adjusted for order and passage effects.
Final Model Fixed Effects.
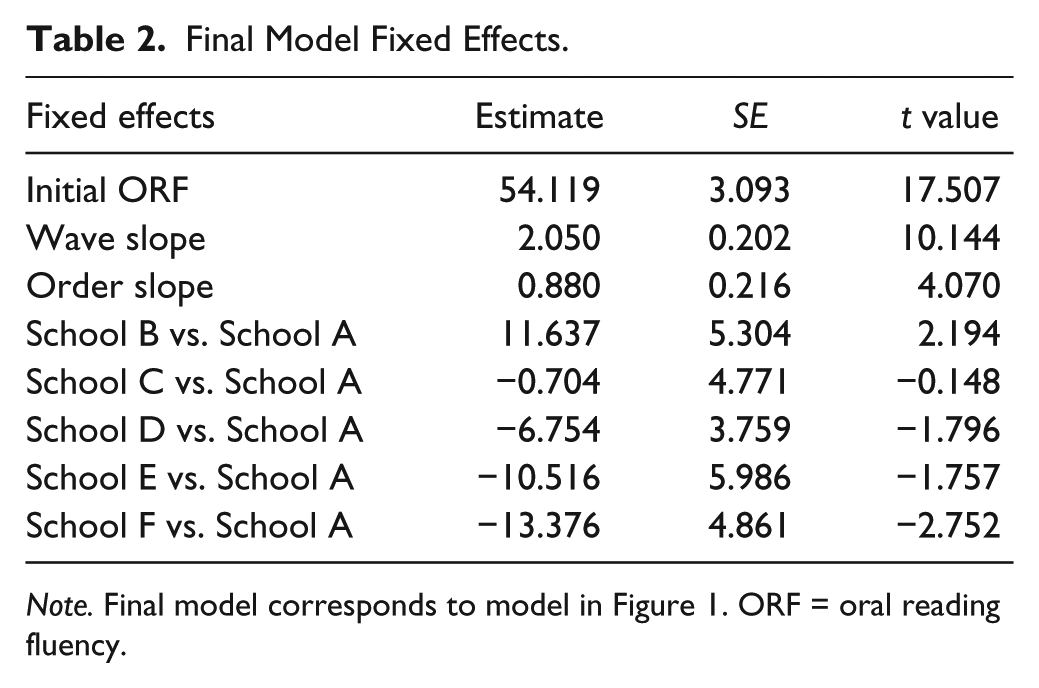
Note. Final model corresponds to model in Figure 1. ORF = oral reading fluency.
Final Model Random Effects.

Note. Final model corresponds to model in Figure 1. ORF = oral reading fluency.
The estimated variance component in Table 3 for passages was 47.22, which corresponds to an intraclass correlation (ICC) at Wave 1 of .111. In other words, about 11.1% of the ORF variance at Wave 1 can be attributed to passage effects. The ICC for passages changed slightly due to student-level growth across order and waves but was still 9.7% at Wave 6, position 3.
Another way to understand the effect size for passages is to consider the scenario with two students of equal ORF ability where the first student is given a very easy passage (95th percentile passage score) and the second student is given a very difficult passage (5th percentile passage score). The estimated SD for passages was 6.9, and using the presumed normality of the passage random effects, the scores will be about 22.6 CWPM apart due solely to form effects. Wave 1 estimated SD for ORF from the preferred model was 20.8, so the worst-case form effect scenario has a standardized effect size of about 1.1, which by most conventions is a very large effect.
The empirical Bayes estimates of the passage means are shown on the left half of Figure 2 superimposed on a box percentile plot, which is similar to a box plot, but the bends in the outline show more percentiles of the distribution than a box plot. The largest difference in passage means is between Passage 9, which was the most difficult, and Passage 7, which was the least difficult, and is 26.9 CWPM. Note, however, that Passage 9 appears to be potentially an outlier compared to the other 17 passages. If Passage 9 is dropped and the mixed model is reestimated, the variance due to passages is still highly significant (LRT χ2 = 717.2,df = 1, p < .0001) but shrinks from 47.2 to 29.7, Wave 1 ICC drops from 11.1% to 7.2%, the worst-case scenario effect size drops from 22.6 to 17.9 CWPM (or a standardized effect of 0.9), and the biggest difference between empirical Bayes means for the remaining passages, shown on the right side of Figure 1, drops from 26.9 to 17.3. Thus, one passage in particular contributes disproportionately to the overall passage effects.
As mentioned previously, the estimated variance component for the order effect was significant and the fixed effect for the order slope was about .88 CWPM per passage and significant (z = 4.0, p < .0001), indicating that, on average, ORF scores increased by about 1.8 CWPM from the first to the third passages at a given wave of assessment. Unlike Cummings et al. (2013), however, we did not find that individual differences among students on order effects were related to initial ORF ability. The standardized effect size for the average increase from first to third passages was 1.8/20.8 or about 0.09, which by most conventions is a very small effect size. The worst-case order effect scenario computed as described above for the AF effects resulted in an order slope of 4.6 CWPM per passage, which across three AFs lead to a difference of 9.2 CWPM. As a standardized effect, the worst case is 9.2/20.8, which is 0.44 or a medium effect. The order slope did not contribute variance to the ORF score in the first position but for the second and third positions, the ICCs are 0.5% and 1.8% at Wave 1, and these percentages decreased slightly across waves due to student growth to 0.4% and 1.6% at Wave 6.
Our design permits a limited amount of testing of more complicated order and sequence effects. For example, we used triads of passages at each wave, and with 18 passages to choose from, there were 816 unique possible triads. This study included 18 of the 816 possible triads or about 2.2%. It is possible that the order effect may vary depending on the unique passage triad. Extending the final model to include a random slope for passage triad groups failed to improve the fit of the model. Similarly, it is possible that the order effect may vary depending on the unique sequence within a passage triad. Our design included 108 of the 4,896 possible sequences for the 18 triads or about 2.2%. Extending the final model to include a random intercept and slope for passage triad sequence groups failed to improve the fit of the model.
In summary, for students likely to be progress-monitored results indicated that form effects accounted for about 10% to 11% of the total variation in ORF and can occasionally be very large, as much as 1.1 ORF SDs (22 CWPM). However, order effects accounted for about 1% to 2% of the total variation in ORF and, on average, were very small, about .05 ORF SDs (0.9 CWPM) per passage but occasionally can attain a small effect size level of 0.2 ORF SDs per passage.
Discussion
In this study, we examined ORF passage score equivalency related to form and order effects in the assessment of ORF with DIBELS second-grade progress-monitoring passages. As previous studies have documented (e.g., Cummings et al., 2013; Francis et al., 2008), significant and substantial passage effects were observed on the estimation of student ORF performance. In this study, three groups of students were administered 18 passages with three passages per assessment point (or wave). Students were first randomly assigned to conditions that manipulated the order of readability level of the passages presented and were then randomly assigned to a specific sequence of passages to counterbalance order within each condition. Condition proved to be insignificant, and data across conditions were aggregated. Form effects demonstrated that two different students of equal skill level could read two different passages within the same grade-level set and have significantly different scores depending on the passage read. Form effects accounted for 11% of the total variation in Wave 1 ORF and could be as large as 22 CWPM (standardized effect size of 1.1). Two students reading at grade level may read different passages within their grade-level set at the same time point, and the difference in their scores would be 22 CWPM. Their teacher, based on these data over time, may place one student in an intervention group, unnecessarily allocating valuable instructional resources to a student who may not receive the benefit. These results support the idea that ORF progress-monitoring passage raw scores can be problematic when instructional decisions are based on passages thought to be equivalent but instead are of varying difficulty levels.
In this study, we replicated previous findings that order effects in addition to passage effects do impact raw scores (Cummings et al., 2013; Francis et al., 2008). In contrast to Cummings et al. (2013), findings from this study indicated that order effects were largely minimal and did not vary for students demonstrating different levels of risk of later reading failure. Order effects were statistically significant but small, about 0.9 CWPM per passage read. The order effect impacted all students’ raw scores in that they received a small benefit from the consecutive reading of three passages within one testing period. Students’ scores increased almost 1 CWPM in between each passage read at one sitting. It is unlikely, however, that this warm-up effect based on passage order will result in an inappropriate categorization of student skill. Therefore, passage effects should warrant greater concern to test developers than order effects.
There is a range of statistical solutions to the passage effect problem. In this study, an examination of the empirical Bayes means with all passages and without an outlier passage demonstrated that removal of outlier passages from a set of AFs can reduce passage set variance. Christ and Ardoin (2009) demonstrated that the Euclidean Distance Method could decrease passage set variance. Other studies have used different types of statistical equating to control for undesirable passage effects in measuring ORF. Between passage and order effects, we demonstrated that passage effects should be of greater concern to practitioners and test developers.
Limitations
The reported findings should be tempered by the demographics of our sample. Generalizability is a concern with the sample size (n = 156) and with a focus on only one grade level (i.e., second grade). Second grade was chosen as the targeted grade level of this study in an effort to contribute to an ongoing discussion in the literature about ORF (Francis et al., 2008). Although our sample included primarily students who were struggling readers, this can also be considered a strength of the study because it is generally these students who are progress monitored throughout the year often on a biweekly basis (Deno et al., 2009). Also, experts in the field recommend using the target population when developing and testing AFs of any assessment (Kolen & Brennan, 2014). For this reason, it is critical to examine passage and order effects as they apply to at-risk learners specifically. An added benefit of working with the targeted population is that through the research design and analysis, the evidence presented here is a more direct response to one previous study (Cummings et al., 2013) that identified order effects positively correlated with initial skill level.
Another limitation of the study is that only one of the conditions in the administration of the passages followed the recommended administration procedures by developers of the assessment (Good & Kaminski, 2002c) in that the passages were administered in the recommended order. Despite developers’ best efforts to standardize administration procedures, anecdotally teachers have reported skipping specific passages within the progress-monitoring booklet because students’ scores have been noticeably much higher or lower on that passage. Users should not be encouraged to independently make changes in administration. Although the assigned orders for conditions may be considered as a limitation, the evidence presented suggested that the different conditions did not change the impact of the passage and order effects. The evidence here should be applied to the test development process and not directly to practitioner use.
Considerations for Test Developers and Publishers
How can publishers and test developers respond to these findings? Some suggest that an equated scores table be included with each set of passages, similar to those provided by Francis et al. (2008). However, it is important to remember that equating should be used only to adjust for the differences among AFs that are developed to be as similar as possible in content, statistical characteristics, and difficulty (Kolen & Brennan, 2014). The findings presented here also support the idea that test developers should attempt to discover outlier passages (Ardoin & Christ, 2009) through tests such as empirical Bayes mean estimates. To some extent, however, the type of equating method to use depends on a number of considerations beyond just the statistical properties of the data, such as the amount of time, energy, and money available to mount an equating study.
The application of equating methods for the development of ORF and other progress-monitoring measures can potentially be more challenging for both practical and technical reasons than traditional development studies dependent on readability formulae have been. A large sample is required for more representative and reliable equating results. Because progress-monitoring measures have many different forms in each grade, this requires larger samples for each grade level. The sample size issue is directly relevant to the standard error of equating, an index of equating error; the larger the sample size, the smaller the amount of equating error is introduced (Stoolmiller et al., 2013). Because ORF is administered to one student at a time, this process may be expensive. With the use of counterbalancing in this study and the lack of order effects observed, however, this study contributes evidence that counterbalancing may not be a required characteristic of future equating studies, thus requiring fewer students. The use of a single-group design without counterbalancing will make equating studies more economical (than studies with counterbalancing) and, therefore, more feasible for test developers who should continue to strive toward improved methods for controlling for passage and score equivalency.
Assumptions of Progress Monitoring in the Context of MTSS
Schools implementing MTSS have been encouraged by researchers to collect frequent progress-monitoring data on students who are struggling to learn to read. Teachers are encouraged to use these data to make either instructional (low-stakes) decisions or intervention and special education (high-stakes) decisions. Of interest to practitioners is that when looking at the raw mean scores in Table 1, students in all three groups began as students at some risk of later reading difficulties or students who are suggested to receive supplemental reading instruction, and at the end of the 11-week period, all remained at some risk. This will likely raise questions about the impact of instruction and intervention for the students in this study and the ability of the ORF progress-monitoring passages to detect meaningful instructional gains. In the context of this study, we want to highlight that the general student instructional recommendation (i.e., some risk) for teachers remained the same from Week 1 to Week 11. With form effects explaining 11.1%, residual error explaining 16.5%, and individual student differences explaining 72.4% of the variance in student scores, our concern is focused on increasing the utility of raw scores. If test developers and researchers can eliminate form effects through measurement development procedures that incorporate both examination of the empirical Bayes mean and the use of equating methods with the remaining AFs, then we can increase our confidence in the use of these measures for high-stakes decisions. This two-pronged approached to creating AFs and equivalent scores is critical because although all students at some risk may read all progress-monitoring passages, not all students will be able to access the entire passage.
Psychometric problems exist within the examined passage set. Integral to the success of data-based decision making in schools within the context of MTSS is the use of progress-monitoring measures that are of high quality which includes consistent difficulty levels and standardized procedures (Christ, Zopluoglu, Long, & Monaghen, 2012). The knowledge that there are passage and order effects reinforces the fact that educators must continue to use multiple data points and multiple measures across time to make instructional and educational placement decisions (Christ et al., 2012). When test developers begin to use more rigorous methods to ameliorate form effects, it may be that the future of progress monitoring can be more efficient and reliable, thereby allowing teachers to make placement changes after shorter intervention intervals.
Future Research
Equating methods may be, in fact, the most economical solution to the improvement of measures that are already publically available. There are, however, several technical issues that remain regarding the use of equating procedures with ORF measures. Guidance for identifying the anchor form to which the other forms will be equated would be a helpful next step when designing equating studies. Francis et al. (2008) used the easiest passage among their six passages as the anchor form. Albano and Rodriguez (2012) suggested using a passage of moderate difficulty, which was the approach adopted by Cummings et al. (2013). Equated scores using the most difficult ORF passage as an anchor form may indicate the minimum number of words that students can read per minute, whereas equated scores using the easiest passage as the anchor may indicate a maximum number of words read correctly per minute. Teachers and other users of the progress-monitoring measures may have negative perceptions of lowering as opposed to raising a student’s raw score, although these perceptions have yet to be explored.
Another important issue regarding the use of anchor forms is the time of year when the equating of the progress-monitoring measures should be conducted. Should equating occur with anchor passages that are administered in the beginning, middle, or end of the school year? According to previous research (Christ, Silberglitt, Yeo, & Cormier, 2010; Nese et al., 2013), the distribution of student ORF scores may be influenced by the timing of testing during the school year and grade level. It is known that the fluency distribution tends to be positively skewed at the beginning of school year, especially in early grades (Nese et al., 2013; Paris, 2005). If equating results are used longitudinally, they may distort the estimation of actual fluency level and growth. Researchers may also consider vertical equating or equating across grade levels; vertical equating could lead to one continuous progress-monitoring graph used over all years of a student’s literacy development. Additional research with different skills for progress-monitoring measures (i.e., word reading) and different grade levels is necessary to help developers determine the best time of year to equate passages, a standard method for choosing the anchor passage, and if there is a benefit to vertical equating.
The study reported here has contributed to the depth of the field’s knowledge about the psychometric properties of widely used ORF passages. Developers and educators alike should be aware of psychometric issues so that as a field, we can improve progress-monitoring measures. Educators are being encouraged to engage in data-based decision making (Hamilton et al., 2009; Kekahio & Baker, 2013). The use of psychometrically sound measures can increase the level of confidence surrounding instructional decisions informed by progress-monitoring data.
Footnotes
Declaration of Conflicting Interests
The authors declared no potential conflicts of interest with respect to the research, authorship, and/or publication of this article.
Funding
The authors disclosed receipt of the following financial support for the research, authorship, and/or publication of this article: This work was supported by an Oregon Reading First subcontract from the Oregon Department of Education to the University of Oregon (8948). The original Oregon Reading First grant was made from the U.S. Department of Education to the Oregon Department of Education (S357A0020038).