
Abstract
Reading screening assessments help educators identify students who are at risk of reading and determine the need for intervention and supports. However, some schools screen and assess students more often than needed, and the additional information does not improve the accuracy of decisions. This may be especially true for students at the upper elementary grades who have already taken high-stakes tests. This exploratory study evaluated how accurately a variety of screening measures predicted performance on a high-stakes end of year test for fourth- and fifth-grade students. Results of this study indicated that previous scores on the statewide assessment and computer-adaptive assessment best predicted student performance on a high-stakes reading test (Minnesota Comprehensive Assessment—Third Edition). When comparing screening models, a two-gate approach appeared to be the best method for identifying student risk.
Keywords
Despite increased federal focus, the United States ranks 19th in the world on reading assessments with only one third of fourth- and eighth-grade students achieving proficiency in reading (Institute of Educational Sciences, 2018). To improve the student reading abilities, schools have implemented multitier systems of support (MTSS) to integrate assessment and interventions (Kettler, Glover, Albers, & Feeney-Kettler, 2014). Screening is a critical feature of MTSS (Berkeley, Bender, Peaster, & Saunders, 2009; Brown-Chidsey, & Steege, 2010). When students are identified at risk of reading problems, they receive targeted and intensive supports and instruction (Kilgus, Methe, Maggin, & Tomasula, 2014). School systems may use different strategies to screen (Mellard, McKnight, & Woods, 2009) involving a combination of computer-adaptive testing (CAT), curriculum-based measures (CBMs), and preexisting data, including previous year test scores, absences, grades, and teacher reports. Many schools screen all students at the start of the school year and make intervention decisions based upon the performance on a single CAT or CBM test without using data that are already available. However, there appears to be little empirical guidance on the best approaches for identifying student reading risk levels. The current study investigated the relative effectiveness of different screening measures for identifying students at risk of reading problems.
Screening Assessments in Reading
There are a number of approaches school personnel can use to identify risk. These include preexisting data sources (e.g., previous year test scores), or additional assessments such, as CAT or CBM.
Reading CBM
Reading CBM, specifically oral reading fluency (ORF) CBM, is a widely used method for evaluating overall reading achievement. To succeed on ORF, students need to be able to decode and identify words. ORF has been widely researched and studies have indicated that ORF scores are moderately to highly related to high-stakes assessments (Crawford, Tindal, & Stieber, 2001; McGlinchey & Hixon, 2004; Merino, Beckman, & Ohmstede, 2010; Silberglitt & Hintze, 2005; Stage & Jacobson, 2001; Wiley & Deno, 2005). More recent research has shifted to focus on consequential validity (e.g., Kilgus et al., 2014) suggesting that student performance on CBM can help predict risk and identify which students are most likely to pass or fail a high-stakes test.
CAT
Many schools use CAT to determine student risk (Ball & Christ, 2012; McBride, Ysseldyke, Milone, & Stickney, 2010; Shapiro & Gebhardt, 2012). CAT uses item response theory to administer items at each student’s ability level (McFadden, Marsh, & Price, 2001; Shapiro & Gebhardt, 2012). Students are then administered easier or harder items based on their performance, which allows a “floor” and “ceiling” to be established faster than traditional assessments (McFadden et al., 2001). CATs measure skills that are progressive and gradually leveled based upon their difficulties. CAT can be administered to a group of students and scored by computer, reducing scoring and administration errors, and may provide information on a variety of skills, such as vocabulary and comprehension (Ball & Christ, 2012).
Growth Estimates
Although CBM and CAT provide a measure of students’ performance at a given time, a student’s ability to read cannot fully be captured by one point in time. Instead, measures of student growth may be a better method to identify student risk (Byrne, Fielding-Barnsley, & Ashley, 2002; Deno, Fuchs, Marston, & Shin, 2001; O’Connor & Jenkins, 1999; Speece & Case, 2001; Speece & Cooper, 1990). Growth estimates for ORF CBM can be calculated by subtracting the score gains between two test scores given at different times, and then dividing the difference by the number of weeks between the two observations. Students considered to be at risk are those who display a dual discrepancy whereby their reading levels and rates are below their peers (Fuchs & Fuchs, 2006). However, it is unclear whether measures of growth are effective predictors of performance on end of year tests (Schatschneider, Wagner, & Crawford, 2008; Yeo, Fearrington, & Christ, 2012). Many schools may use too few data points when evaluating growth (Van Norman & Parker, 2018).
Direct-Route Versus Multigate Screening Approaches
Schools also decide whether one screening tool or multiple tools should be given to make screening decisions. A direct route involves the use of one screening assessment. After the screener is scored, a team reviews scores and cut points to identify risk (Johnson, Jenkins, & Petscher, 2010). Those students identified as at risk immediately begin receiving intervention. The direct route to screening saves time and is often more cost-effective.
However, some schools may choose to use multiple pieces of data out of concern that one screening measure may result in too many incorrect decisions. When using multiple assessments to evaluate risk, students progress through a series of screening measures that increase in intensity and accuracy (Walker, Small, Severson, Seeley, & Feil, 2014). Typically, the first assessment is a short or readily available screening tool with high sensitivity to ensure that no at-risk students are missed (Glover & Albers, 2007). Those students identified as high risk receive additional screening assessments to determine whether or not they are truly at risk, or whether the first assessment was incorrect. Although multiple-gating screening can improve the accuracy of screening, the costs of assessments is not negligible. The amount of money and time that assessments take means that additional screeners must provide and improvement of predictive value (Johnson et al., 2010).
Diagnostic Accuracy
Regardless of the types of screening tools or approaches that schools use, it is critical to have validity evidence that supports the decisions practitioners make. Many of the studies investigating the technical adequacy of CBM have utilized correlational analyses between screening tools and high-stakes tests (Ardoin et al., 2004; Crawford et al., 2001; Hintze & Silberglitt, 2005; McGlinchey & Hixon, 2004; Merino et al., 2010; Stage & Jacobson, 2001; Wiley & Deno, 2005). However, practitioners are likely to find screening tools most useful if they differentiate between students who are at-risk from those who are not (Johnson et al., 2010). Correlations between two given assessments may be high, but the diagnostic accuracy can still be poor (e.g., Parker et al., 2015). Diagnostic accuracy is a component of consequential validity designed to identify and evaluate cut scores that maximize the number of students correctly identified as high risk and low risk (Kilgus et al., 2014). Diagnostic accuracy uses conditional probability statistics including (a) sensitivity, (b) specificity, (c) positive predictive power, and (d) negative predictive power. Sensitivity refers to the degree to which a criterion assessment identifies students who are at risk of failure for another test (Fawcett, 2006). A screener with 63% sensitivity accurately identifies 63% of individuals who have a reading problem. Specificity describes the ability of the assessment to correctly identify students without a condition (Fawcett, 2006).
Sensitivity and specificity are complementary and used to evaluate and compare different assessments on the same criterion. Ideally, a test would have 100% sensitivity and 100% specificity. In practice this is not possible due to measurement error and the difficulty measuring complicated constructs such as reading (Jenkins, Hudson, & Johnson, 2007). In the school setting, educators need to balance between the two probabilities, but both sensitivity and specificity need be high for screening tools. Finding a balance between the probabilities is crucial if screening measures are used to allocate resources and minimize errors within an MTSS framework whether schools utilize a direct- or multiple-gate approach.
Screening errors have a variety of negative consequences. Some students are identified at risk on a screener, but do not have a reading problem. These false positives result in overidentification of students and force schools to utilize more time and materials by providing services to students who do not require them (Jenkins et al., 2007). Overidentification can hinder systems that are seeking to target supports (Compton et al., 2010) and false negatives in which a student passes a reading screener, but fails the end of the year test. These are especially deleterious for students who may miss opportunities to remediate the problem (Jenkins et al., 2007; Torgesen, 2002). The accumulation of missed opportunities could compound problems and place children further behind their peers.
Although sensitivity and specificity provide valuable information regarding assessments, they do not take into consideration false positives and false negatives. For this reason, positive and negative predictive powers are also used. Positive and negative predictive power describe how likely a student is to have a condition given the results of a screener. Positive predictive power describes the conditional probability that a student identified as at risk on a screener is also identified by the criterion measure as at risk. Conversely, negative predictive power reflects the probability that a student identified as proficient on the screener is also identified as proficient on the criterion measure.
Purpose
With the increasing importance of school accountability, universal screening may provide an invaluable method for school professionals to identify at-risk students (Jenkins et al., 2007). To implement universal screenings within MTSS, schools must have psychometrically adequate screening tools. By comparing the validity evidence of different screening tools, including ORF, CAT, estimates of growth, and existing data, educators and school-based practitioners can make informed decisions about which tool will accurately identify students in need of assistance, allocate intervention resources, and inform school policies about universal screening and tools. Thus, there is a need to identify which tools that schools commonly use may best predict risk.
However, schools also need to consider efficiency to make sure that they are not overscreening or screening unnecessarily. Added screening measures may not contribute to the diagnostic accuracy of the screening (Van Der Heyden, 2013). Without evidence of improved diagnostic accuracy of additional screening assessments, schools may waste financial and educational resources without gaining additional information about the students’ abilities (Van Der Heyden, 2011). There are limited research studies that analyzed multiassessments to identify approaches (Compton, Fuchs, Fuchs, & Bryant, 2006; O’Connor & Jenkins, 1999), but they tended to focus on screening of early elementary school–aged students. Several studies were found that examined the screening accuracy of tools for upper elementary school students on a high-stakes assessment (Baker et al., 2015; Decker, Hixon, Shaw, & Johnson, 2014; Denton et al., 2011; McGlinchey & Hixon, 2004; Nese, Park, Alonzo, & Tindal, 2011; Shapiro, Solari, & Petscher, 2008; Stevenson, Reed, & Tighe, 2016). Only one study was found that explored a multigate approach (Klingbeil, Nelson, Van Norman, & Birr, 2017). In their article, Klingbeil and colleagues utilized CBM, running records, and measures of academic progress (MAP) testing as screeners, but did not utilize previous year’s high-stakes testing. For this reason, we evaluated the diagnostic accuracy of screening tools on an end-of-year state assessment in which both a direct route and the extent to which accuracy can be improved by simulating a multiple-gated screening approaches for fourth- and fifth-grade students. The purpose of this exploratory study was to evaluate universal screening measures within MTSS by addressing the following questions:
How are screening measures (i.e., ORF CBM, CAT, student growth, or previous year’s scores) related to the Minnesota Comprehensive Assessment—Third Edition (MCA-III) performance and which of those screeners has the highest correlation with performance on the high-stakes test?
What is the optimal cut point for each screener for predicting performance on the MCA-III?
What is the diagnostic accuracy for these screeners at each cut point?
Does using a multigate approach to screening improve the diagnostic accuracy compared with a single measure approach?
Method
Participants
The archival data for the study was gathered from five suburban school districts from the 2014-2015 school year. Students in the fourth- and fifth grade were selected because they had previously taken high-stakes tests. Participants consisted of 776 students in the fourth- (n = 394) and fifth grade (n = 382). There were 418 (53.9%) males and 358 (46.1%) females in the sample. Ethnic proportions of students in the districts were Caucasian (86.7%), Native (6.7%), Asian/Pacific Islander (1.2%), Hispanic (3.7%), and Black (1.7%). Multilingual learners accounted for 1% of the sample, and 56% were eligible for free and reduced lunch. Students with special education plans made up 13.1% of the sample. The sample was representative of the state in terms of MCA-III reading proficiency with 61.5% of the sample showing proficiency on high-stakes tests compared with 61.2% statewide.
Measures
CBM
ORF passages for fourth- and fifth grade were administered from AIMSweb. According to AIMSweb (2002), ORF passages have an alternate-form reliability of .94 during each period for each grade and split-half reliability of .94 for students in the second-, fourth-, sixth-, and eighth grade. Criterion-related validity was established by correlating scores on the probes to scores on the North Carolina and Illinois reading tests. Results indicate that ORF were strongly correlated with the North Carolina and Illinois reading tests for students in the third- (r = .69–.72), fourth- (r = .70–.72), and fifth grade (r = .67–.69). Later studies indicated that AIMSweb ORF had a correlation of .70 if the criterion was administered within 1 year, and .50 to .60 if the criterion was administered within 2 years (Keller-Margulis, Shapiro, & Hintze, 2008; Merino et al., 2010; Silberglitt & Hintze, 2005).
The technical manual provides evidence of the classification accuracy of ORF with the North Carolina and Illinois reading assessments. For students in the fourth- and fifth grade, the area under the curve (AUC) ranged from .83 to .86. Furthermore, specificity for ORF ranged from .73 to .77 and sensitivity ranged from .75 to .79 (AIMSweb, 2002). ORF scores were used to evaluate growth. Growth was measured by subtracting the winter benchmark score from the fall benchmark score on ORF and dividing by the average number of weeks between the two assessments.
CAT
Measures of academic progress (MAP) is a CAT designed to measure achievement in five broad areas: language, mathematics, reading, science concepts, and general science for second- through 12th graders. MAP tests are frequently utilized to inform summative decisions that schools have to make including program and instructional evaluations as well as formative decisions involved with informing instruction. The present study investigated the use of the MAP reading assessment as a screening tool to predict future risk. Thus, for the purposes of this study, only MAP overall reading scores were examined. On the MAP reading assessments, three components of reading are assessed including informational text (comprehension), foundational skills/vocabulary, and literature (identifying story elements), which yield one overall score. MAP reading takes approximately 40 to 50 min to complete and a student’s performance is reported in a Rasch units (RIT), which ranges from 100 to 300.
MAP was normed over 3 years (2001–2004) on 2.3 million students from 5,616 schools over 32 states (NWEA, 2003). Students in the sample were comparable to the national population for most ethnic groups (Northwest Evaluation Association [NWEA], 2003). For students in the third-, fourth-, and fifth grade, marginal reliability for the MAP reading assessment ranged from .94 to .95 (NWEA, 2003). Test–retest reliability coefficients for MAP reading ranged from .80 in second grade to .91 in fifth grade. Concurrent validity indicated a strong, positive relationship with the Sanford Achievement Test—Ninth Edition (r = .87) and Colorado State Assessment Program (r = .87; NWEA, 2003).
High-stakes reading test: MCA-III
The MCA-III is an assessment that measures proficiency in core academic areas (i.e., reading, mathematics, and science) and is based on the Minnesota K-12 Academic Starts—English Language Arts (Minnesota Department of Education, 2013). Students in the third- through eighth grade take this assessment in the spring. In the area of reading, questions on the MCA-III focus on applying reading standards to different types of literature and informational texts (Minnesota Department of Education, 2013).
Scores on the MCA-III vary by each grade level. For example, students in the fourth grade can receive scores ranging from 411 to 490. Students in the fifth grade can receive scores ranging from 517 to 591 (Minnesota Department of Education, 2013). The MCA-III utilizes cut scores to determine four levels of achievement: (a) does not meet the standards, (b) partially meets the standards, (c) meets the standards, and (d) exceeds the standards. These levels of achievement are also called achievement-level descriptors (ALDs) and provide a description of expected grade-level performance for each level. An analysis by the Human Resources Research Organization found that the items of the MCA-III aligned to the benchmarking standards (Deatz et al., 2013).
Data Analysis
Of the participants enrolled in the districts during the 2014-2015 school year, there were cases with missing data on the predictor variables. Of the total participants, 776 (89.82%) had complete data for each of the variables, which left 88 (11.49%) with incomplete data on one or more of the variables. To examine the pattern of missing data, Little’s Missing Completely at Random Test was conducted on each of the variables and was significant (χ2 = 156.175, p < .001; Little & Rubin, 2002). This indicated that the missing data may not be missing completely at random. An examination of the missing values was conducted by examining the pattern of missing data, which indicated that the data may be missing at random (MAR); the majority of missing values (n = 70) came from the MCA-III from the previous year.
To estimate the missing cases, multiple imputation was used. Twenty imputations were used to avoid losing statistical power for small effect sizes (Graham, 2009). Frequency and descriptive statistics were also examined to scan for errors and identify outliers for both fourth- and fifth grade. When examining the minimum and maximum values on each of the variables, four data points in fourth grade and 20 data points in fifth grade were outside the range of possible values on the variable of previous MCA-III total reading score. As it was not possible to check the original value of these data points, these cases were removed from future analyses, which left a sample of 390 fourth graders and 362 fifth graders.
Procedures
To conduct this exploratory study, an existing data set was used. In the districts included in the study, MAP reading and ORF screening assessments were administered 3 times per year (September, January, and April) to align with the AIMSweb-recommended administrations. Assessments were administered within 1 month for each of the benchmarking periods; districts were able to select when assessments would be given within the testing window. The MCA-III reading assessment was administered in April. No information was available regarding the fidelity of administration for these tests.
Question 1
A Pearson product-moment correlation was used to measure the relationship between the screening measures (ORF, CAT, student growth, or previous year’s MCA-III scores) and scores on the MCA-III total reading score for both fourth- and fifth-grade students. These correlations provided opportunities to better understand the magnitude of the relationships between the variables, and also served as the basis for additional analyses.
Question 2
To determine which screening measure best predicted MCA-III performance, binary logistic regressions were conducted using each of the screening measures as a predictor variable. MCA-III achievement levels categories were collapsed into two groups. Student performance that fell within the meets the standards and exceeds the standards were considered “Proficient” and performance that fell within the does not meet the standards and partially meets the standards were considered “Not Proficient” (see Tables 2 and 3). Frequency and descriptive statistics examined for both fourth- and fifth grade indicated variable outliers that were not extreme and could be included in the analyses. Each screening measure was entered into its own model and the best predictors were used to guide the future analysis.
Question 3
To determine the optimal cut point to predict MCA-III performance for each screener, receiver operating curves analyses were conducted to identify potential cut scores. Cut scores that maximized the Youden index were selected for each screening tool (Youden, 1950).
Question 4
To determine if a multiple-gate approach is better at identifying students potentially at risk on the MCA-III, diagnostic efficiency statistics were compared using cut points derived from Research Question 3 to create a simulated multigate approach. This was completed for screening assessments that would be available to school districts in the fall (Stage & Jacobson, 2001). Screening assessments included scores on the previous MCA-III reading, fall MAP reading scores, and fall ORF scores.
As districts would have access to previous scores on the MCA-III reading for fourth- and fifth grade, previous MCA-III reading scores served as the first gate because the data are easily accessible. Those students who failed this gate were considered at risk and were not included in further screeners. The second gate consisted of MAP reading because districts frequently give this tool to evaluate program effectiveness and instruction. Furthermore, we chose to use the MAP reading scores because the specificity was higher than the ORF. Students who passed the previous year MAP were included in this analysis. ORF was added as the third gate as it is often administered to identify risk in students, and may not directly inform instruction. Diagnostic accuracy statistics were analyzed after each gate for those students who did not reach the optimal cut points on the screener.
Results
Question 1
The results from the Pearson product-moment correlations are depicted in Table 1. MAP reading scores had a medium-to-large strength of association with performance on the MCA-III for both fourth- and fifth-grade students (Cohen, 1988). However, the relationship changed depending on the time of year. For fourth-grade students, fall ORF scores had the strongest relationship, r(392) = .77, p < .01, whereas spring MAP reading scores had the strongest relationship for fifth-grade students with scores on the MCA-III, r(365) = .75, p < .01. Winter and spring ORF scores also had a medium-to-large strength of association with performance on the MCA-III for both fourth- and fifth-grade students (Cohen, 1988). However, growth scores had the lowest correlations with MCA-III scores and were thus excluded from further analysis.
Correlation Matrix of Fourth-Grade Screening Measures.
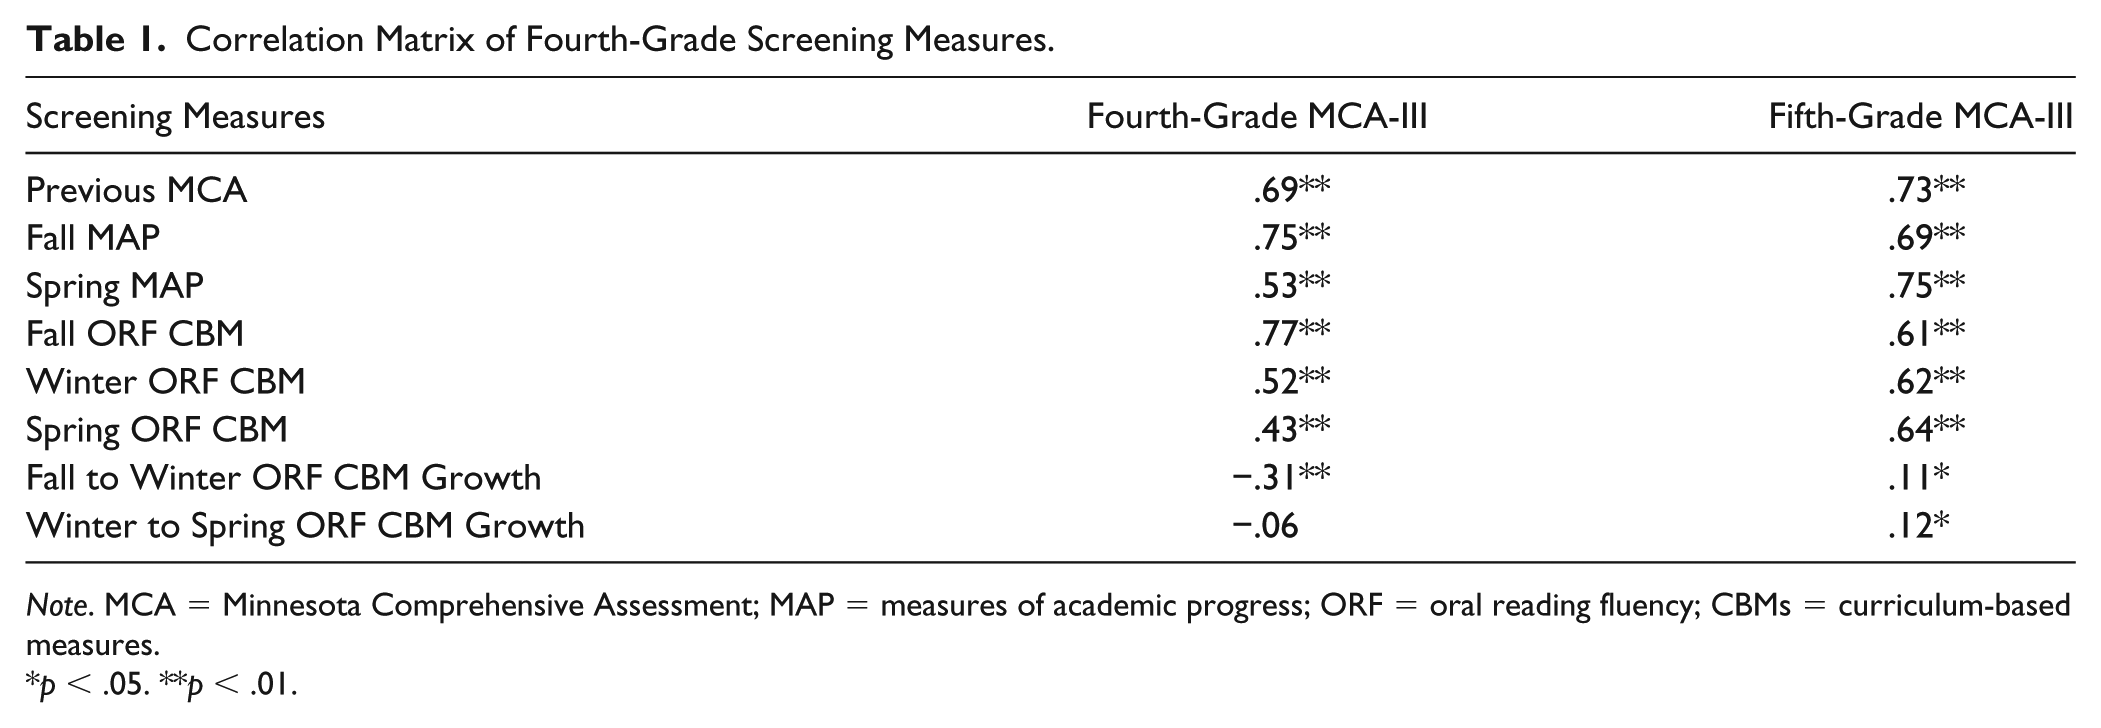
Note. MCA = Minnesota Comprehensive Assessment; MAP = measures of academic progress; ORF = oral reading fluency; CBMs = curriculum-based measures.
p < .05. **p < .01.
Question 2
For fourth-grade students, each of the models, with the exception of ORF, CBM growth from the fall to winter benchmarking period, were significant. Of the screening measures, spring MAP scores had the best fitting model for fourth-grade students, χ2(1, n = 392) = 96.17, p < .01, Nagelkerke R2 = .631. The odds ratio indicates that for every point higher a student scores on the Spring MAP assessment, he or she is 1.24 times more likely to achieve proficiency on the MCA-III. When looking at only fall measures, the fall MAP was the best fitting model for fourth-grade students. The results from the binary logistic regressions conducted for fourth grade are displayed in Table 2.
Logistic Regression Analysis of Fourth-Grade Screening Measures as a Function of MCA-III ALD.
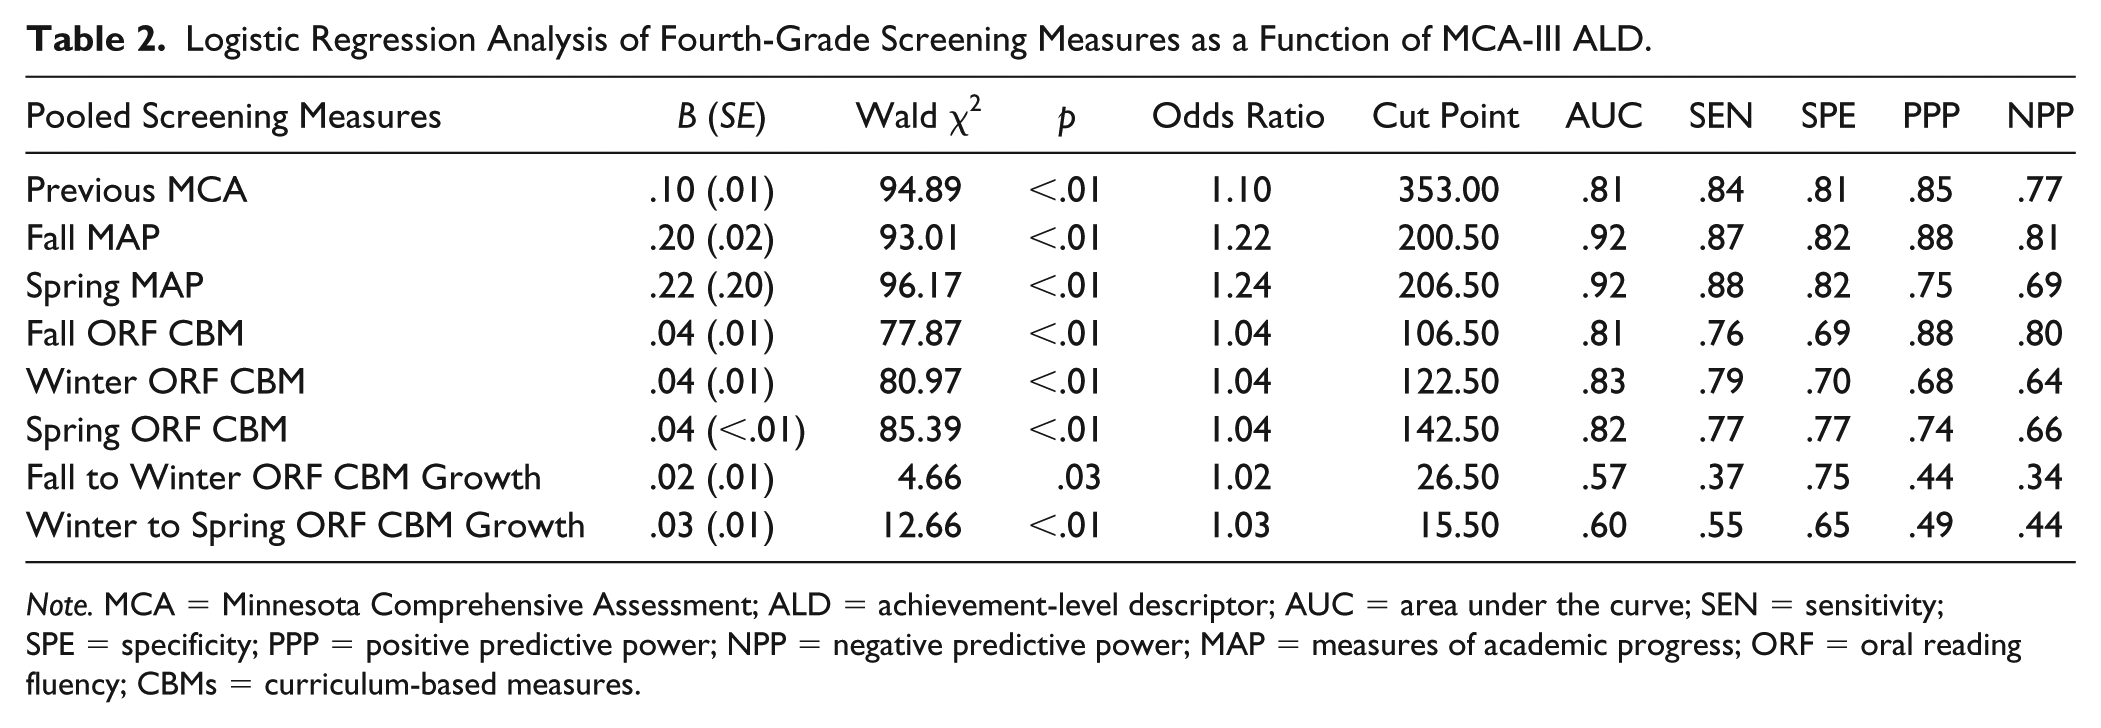
Note. MCA = Minnesota Comprehensive Assessment; ALD = achievement-level descriptor; AUC = area under the curve; SEN = sensitivity; SPE = specificity; PPP = positive predictive power; NPP = negative predictive power; MAP = measures of academic progress; ORF = oral reading fluency; CBMs = curriculum-based measures.
Fifth-grade screening measures yielded similar results; each of the models, with the exception of ORF growth from the fall to winter benchmarking period, were significant. Spring MAP scores also had the best fitting model, χ2(1, n = 365) = 85.78, p < .01, Nagelkerke R2 = .636. The corresponding odds ratio indicates that for every point higher a student scores on the Spring MAP assessment, he or she is 1.26 times more likely to achieve proficiency on the MCA-III. For those assessments available to a school in the fall, the previous year’s MCA-III scores showed the strongest relationship scores on the MCA-III the following year. The results from the binary logistic regressions conducted for fifth grade are displayed in Table 3.
Logistic Regression Analysis of Fifth-Grade Screening Measures as a Function of MCA-III ALD.
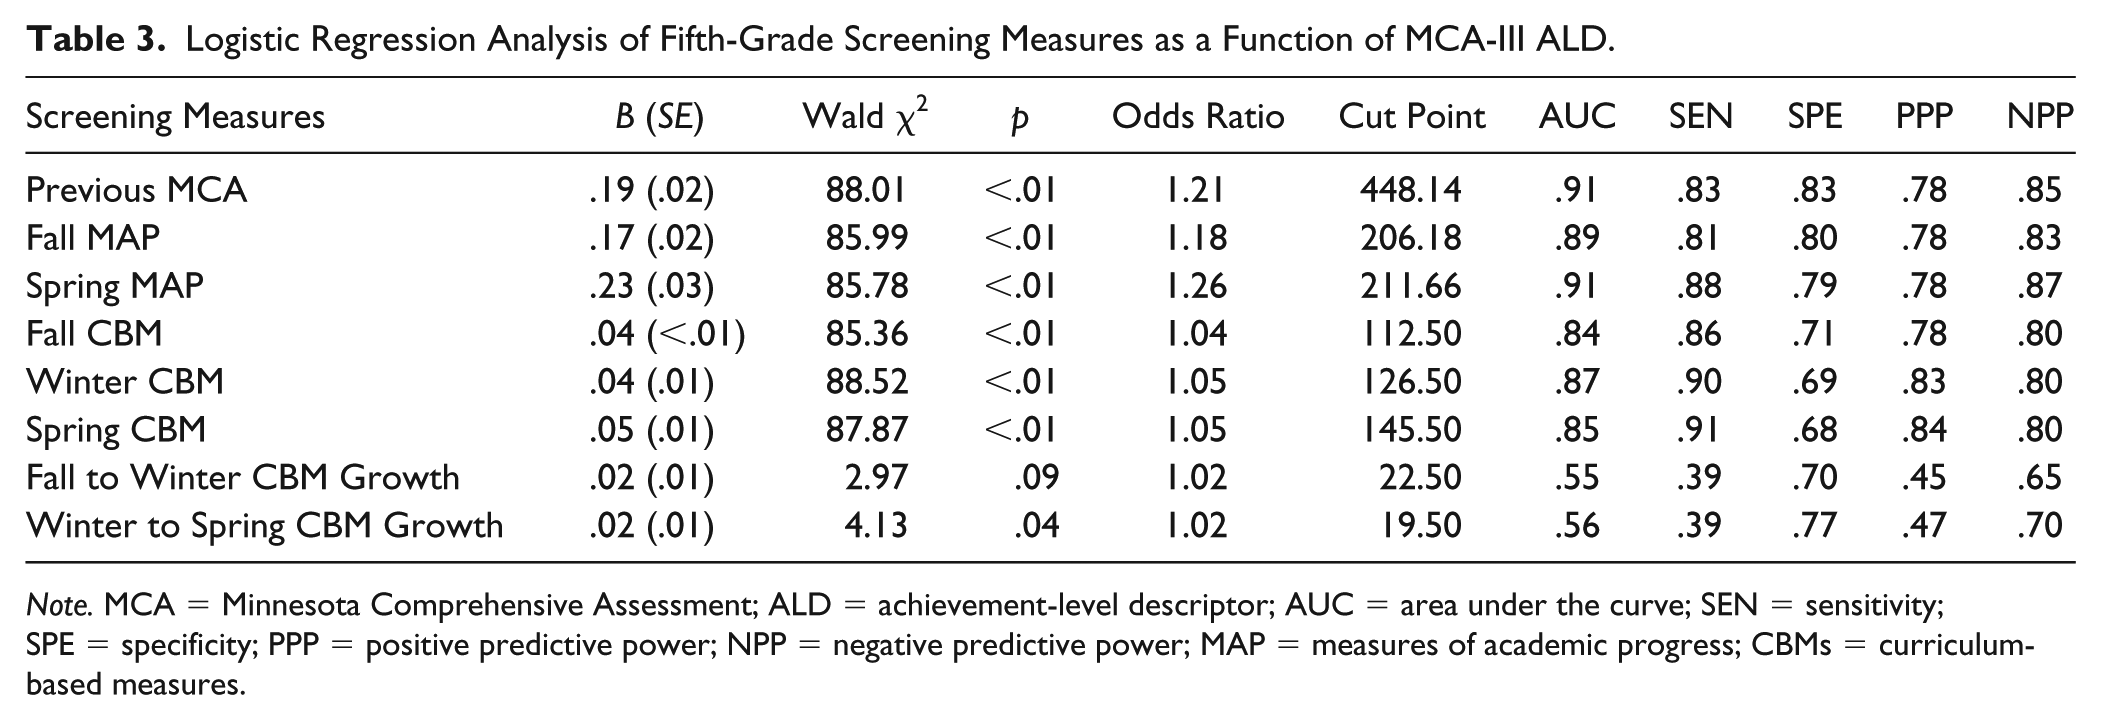
Note. MCA = Minnesota Comprehensive Assessment; ALD = achievement-level descriptor; AUC = area under the curve; SEN = sensitivity; SPE = specificity; PPP = positive predictive power; NPP = negative predictive power; MAP = measures of academic progress; CBMs = curriculum-based measures.
Question 3
The resulting cut points with corresponding sensitivity and specificity values are presented in Tables 2 and 3. These cut points maximized both sensitivity and specificity for each screening tool using the Youden index (Youden, 1950).
Question 4
Table 4 displays the sensitivity and specificity statistics for a direct route using the previous year’s MCA-III scores, as well as statistics for a two- and three-gated screening approach. Overall, the two-gate approach maximized both sensitivity and specificity for fifth-grade students, and identified more fourth-grade students as being at risk while increasing the overall number of false negatives. As expected, the addition of a third gate improves sensitivity, but decreases specificity by a similar magnitude.
Diagnostic Accuracy Statistics for Students Failing Screening Assessments.
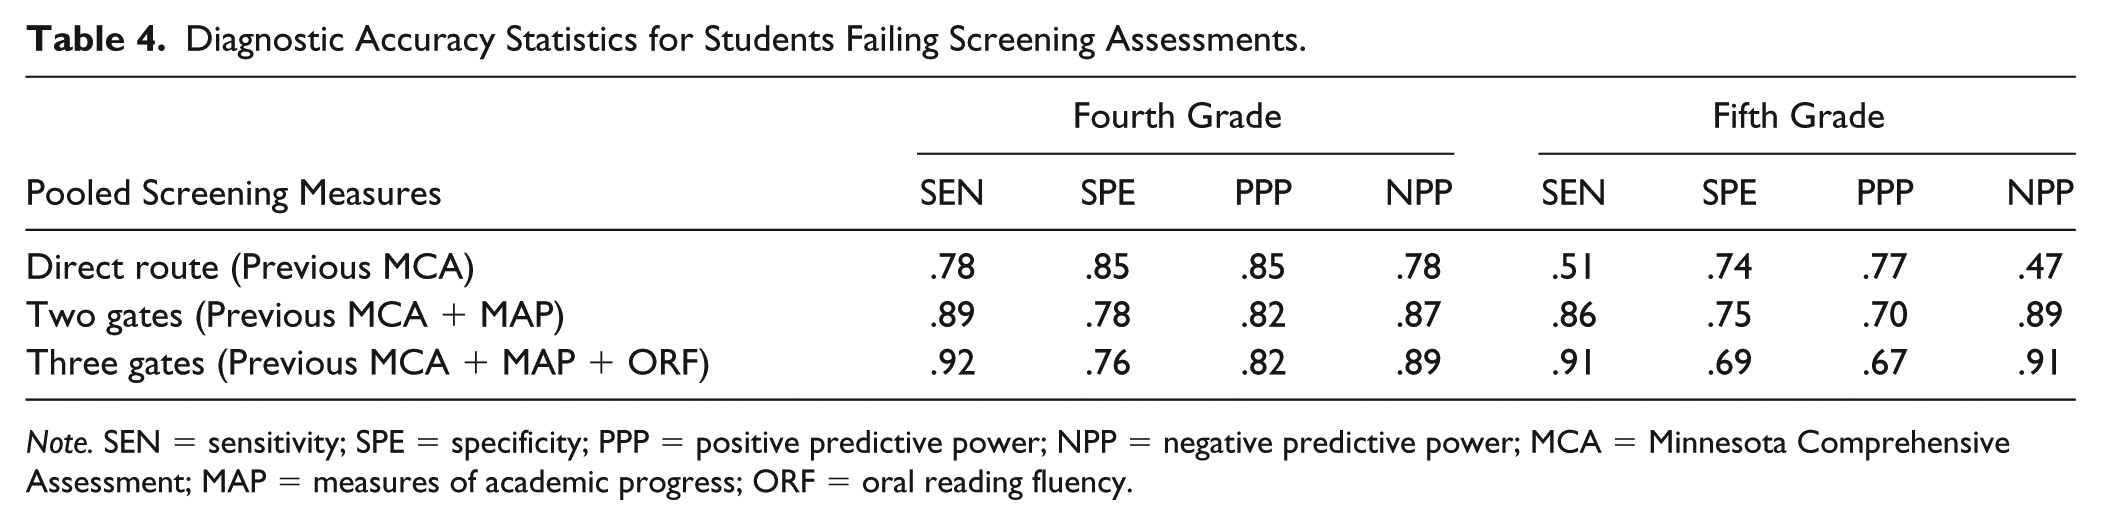
Note. SEN = sensitivity; SPE = specificity; PPP = positive predictive power; NPP = negative predictive power; MCA = Minnesota Comprehensive Assessment; MAP = measures of academic progress; ORF = oral reading fluency.
A direct route to screening using previous MCA-III reading scores, specificity and positive predictive power were higher as compared with sensitivity and negative predictive power for both fourth- and fifth-grade students. With each additional screener that was administered, sensitivity and positive predictive power increased as specificity and negative predictive power decreased (Table 4). Table 5 illustrates the number of students who were considered true positives, false positives, false negatives, and true negatives in this study.
Students Identified by Diagnostic Accuracy Statistic for Students Failing Screening Assessments.
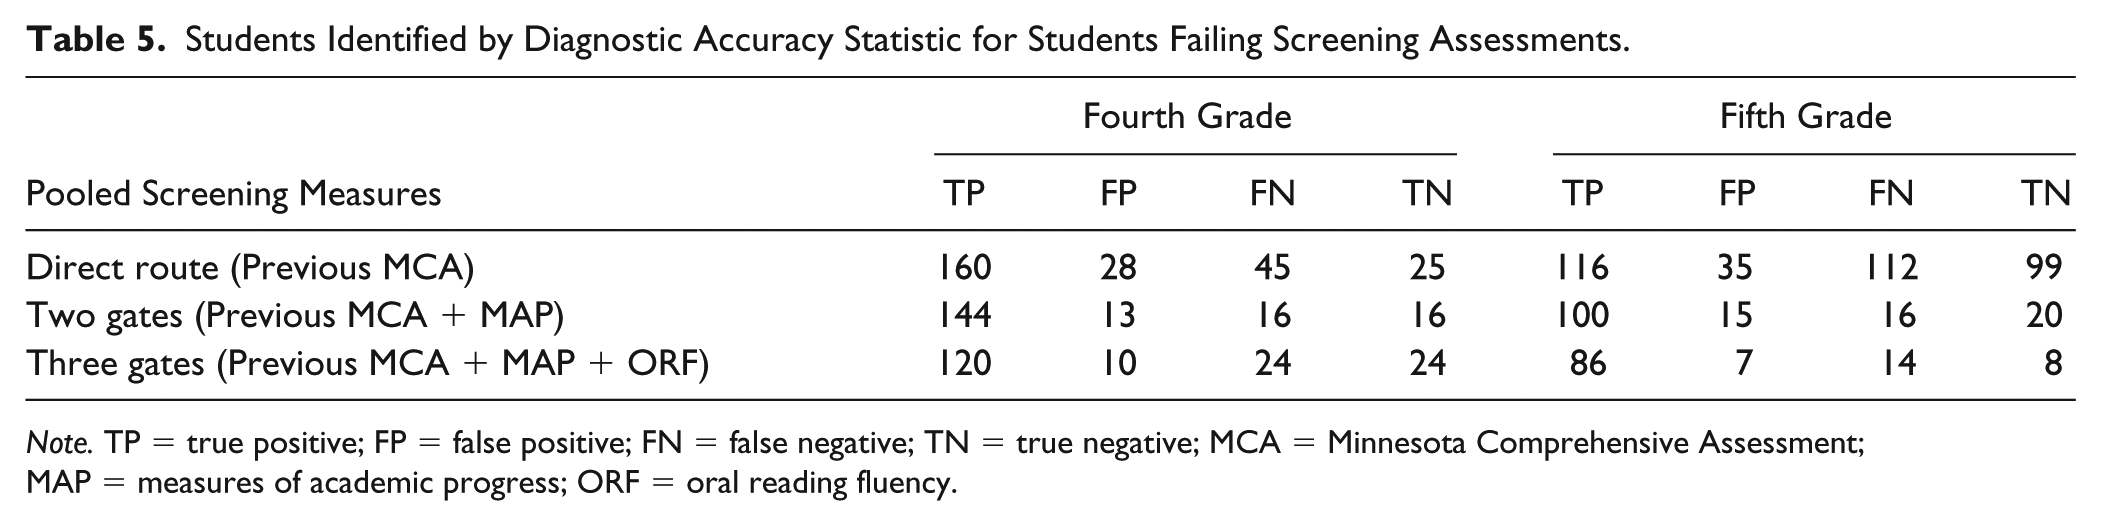
Note. TP = true positive; FP = false positive; FN = false negative; TN = true negative; MCA = Minnesota Comprehensive Assessment; MAP = measures of academic progress; ORF = oral reading fluency.
Discussion
The purpose of this exploratory study was to examine universal screening tools in reading to determine which were the most effective at identifying students at risk in the fourth- and fifth grade. When examining fourth-grade students, both fall and spring MAP scores resulted in the largest AUC when compared with other screeners (.92). Taken together, the high AUC values found in this study indicate that MAP can be one of the most useful screening assessments for schools to predict MCA-III performance. Specifically, as the AUC was the same for both fall and spring benchmark period, schools could use information gathered from the fall benchmark to identify students at risk. If schools utilized a direct-route approach to screening using the fall MAP and recommended cut score of 201, scores on this screener identified MCA-III performance accurately in 84% of students.
For fifth grade, previous MCA-III scores and MAP scores during the spring benchmarking period had the highest AUC values (.91). Although the resulting AUC values exceeded the recommendations of Metz (1978), if the AUC values were the same for both screening tools, schools would benefit by using previous administration of the MCA-III as the primary screening tool. This would allow schools to have information about potential at-risk students before the school year starts.
ORF and Diagnostic Accuracy
For ORF, across both fourth- and fifth grade and all benchmarking periods, the resulting AUC values exceed the recommended AUC value of .80 (Metz, 1978) for screening tools. This is consistent with research conducted by Roehrig, Petscher, Nettles, Hudson, and Torgesen (2008), Keller-Margulis and colleagues (2008), and Petscher and Kim (2011). The results of this study also found that sensitivity, positive predictive power, and negative predictive power were higher for fifth-grade students. This is similar to the results found by Petscher and Kim (2011) as sensitivity for ORF increased over time. However, in the current study, ORF did not appear to be as strong of a predictor of risk as compared with CAT for fourth grade and previous year’s high-stakes test for fifth grade.
Direct-Route Versus Multigate Screening Approaches
Despite a strong AUC, schools using previous MCA-III scores alone may misidentify a high number of students. However, sensitivity and specificity appear to be maximized when using a multigate approach that includes a CAT. In results that were consistent with those found by Klingbeil et al. (2017), with additional screening measures/gates, sensitivity and positive predictive power increased and specificity and negative predictive power decreased. With the current sample in this study, using a two-gated approach to screening decreased false positives from 28-35 to 13-15 students for fourth- and fifth grade, respectively. When ORF was also administered to students who did not pass previous MCA-III and MAP reading, this decreased to 7-10 false positives. However, there was no substantial improvement in sensitivity, and increases in sensitivity were offset by decrements in specificity.
Implications for Practice
The current study provides an analog to a common dilemma that many schools face when working with their fourth- and fifth-grade students. If several screening assessments are administered, a team may not know which assessment to weigh more heavily. Furthermore, screening measures have both time and fiscal costs. Time spent in assessment is time that a student is not receiving instruction or intervention. Assuming that schools want to evaluate whether a student was at-risk for failing the end of the year assessment, the present study suggests that ORF data and ORF growth data do not provide the best way to identify risk. Rather, fall and spring MAP scores and previous year’s scores on the MCA-III had the strongest relationship with performance on the statewide assessment. This finding is similar to that of a study regarding the relationship between CAT and statewide assessments conducted by January and Ardoin (2015) who found that CAT predicted performance better on statewide assessments as compared with traditional CBM. This is consistent with other research as well. For example, CAT may be able to predict performance better than other screening measures because a student’s achievement level can be identified quicker with a smaller standard error (January & Ardoin, 2015; McFadden et al., 2001; van der Linden & Glas, 2000).
The findings of this study have several implications for schools using MTSS. Ultimately, schools need to carefully select which tool will be used if using a direct-route to screening. Diagnostic accuracy statistics can help schools make informed decisions regarding which tool to use that match their needs and resources. In this study, using previous MCA-III scores were good indicators of MCA-III proficiency for students who were not at risk. By administering a single screening assessment, schools could save financial and time. Adding a CAT such as the MAP test, teams may more accurately identify students who are at risk. However, CATs tend to be expensive, and if used only as a screener, may not provide substantially better results than the less expensive ORF tests.
If schools decide to administer additional screening tools through a multiple-gate approach, a two-gate approach dramatically increased the sensitivity and positive predictive power. In the current study, of the students who do not reach the optimal cut points on both previous MCA-III and fall MAP, 91% of fourth graders and 83% of fifth graders did not achieve proficiency on the end of year high-stakes assessment. This indicates that students who were still at risk after the second assessment would benefit from additional intervention. Schools could elect to give a third-screening measure, ORF, to increase the sensitivity even further. However, the staff time and costs associated with a multiple-gate approach can quickly accumulate. Schools need to balance these resources with the risk estimates associated with each gate.
The current study also provides additional evidence for the validity of screening cut scores, as the optimal cut points derived in this study are similar to those recommended by test publishers and local norms of the sample. By using the recommended cut scores published by the test developers, schools can save additional time and resources that would be needed to develop norms and run subsequent analyses.
Limitations
There are several limitations to the present analysis. First, the current study is restricted to a sample from one state, which may not generalize to other part of the United States. Because multiple school districts collected the data, it was not possible to evaluate the fidelity of test administration. It was not possible to evaluate the effect of interventions the students may have received on the predictive validity of the screening tools. More studies should examine the validity of screening tools and models with school districts that do not provide interventions in addition to core instruction. It is also important to note that this study only focused on screening tools and identification of students at risk of not passing a specific high-stakes state assessment. However, tests such as the MAP and ORF may be used for many reasons such as program evaluation, informing instruction, evaluating intervention effectiveness, or monitoring student growth. Furthermore, other assessments, such as ORF CBM, may be a better predictor of reading outcomes in students in first, second, or third grade when ORF skills are developing more. For the current study, it was not possible to evaluate all possible screening assessments and gates that districts may have available. Finally, the current analysis focused only on fourth- and fifth-grade students. As the fourth- and fifth-grade curriculum typically shifts from learning reading skills to using reading skills to learn new materials, we might speculate that the findings would generalize to later grades. However, in Grades K–3, there is less evidence of performance on high stakes tests. Other reading screeners may be necessary to identify risk.
Future Research
Future studies should explore the relationship and predictive validity of other screening measures and evaluate the diagnostic accuracy within a direct- and multiple-gate approach. Specifically, studies should examine other forms of CAT. Second, the results of this study indicated weak relationship between CBM growth and a high-stakes state test. However, more research is needed to examine other growth estimates or methods of measuring reading growth such as standard error of slope (Christ, 2006), regression (Kim, Petscher, Schatschneider, & Foorman, 2010), or ordinary least squares regression (Clarfield & Stoner, 2005).
Studies could also examine the predictive validity and diagnostic accuracy of screening measures using the cut points that are recommended by technical manuals and publishers. This predictive validity and diagnostic accuracy using recommended cut scores could be compared with local norms thus providing valuable information for schools as populations may differ from the normative sample. If the results indicate that local norms better predict performance, schools may consider employing regular data review times and to developing local norms.
Conclusion
Schools must use great care in selecting which screening tools to use to identify those students at risk of reading failure. Overscreening results in inefficient use of time and cost whereas underscreening may cause those students who need intervention to miss out on supplemental intervention and supports. In evaluating a variety of screening tools for reading problems, the present study suggests that if school teams want to identify students who are at risk, schools may be best implementing a two-gated approach using previous scores on the assessment and MAP reading. Should these exploratory findings hold in future replications, this approach would likely result in fewer screening errors and more accurately identify students in need of intensive intervention.
Footnotes
Declaration of Conflicting Interests
The authors declared no potential conflicts of interest with respect to the research, authorship, and/or publication of this article.
Funding
The authors received no financial support for the research, authorship, and/or publication of this article.