
Abstract
Universal screening is the first mechanism by which students are identified as at risk of failure in the context of multitiered systems of supports. This study examined the validity and diagnostic accuracy of a reading computer-adaptive test as a screener to identify state achievement test performance for third through fifth graders (N = 1,696). Single time points and slopes within year and longitudinally were examined. Validity results for single points were moderate (.60–.79, p < .002). Validity for slopes and the state test were weak or not significant. Diagnostic accuracy cut scores that maximized sensitivity and specificity yielded high accuracy for single points whereas sensitivity was inadequate for slopes. Practical implications and future directions are presented.
Universal screening is a critical component of multitiered systems of supports because it is the primary way students are identified as being at risk of failure. Screening measures and procedures must offer sufficient technical adequacy for identifying students at risk; however, many measures result in moderate accuracy, indicating the presence of false negatives and false positives (e.g., Hintze & Silberglitt, 2005; Stage & Jacobsen, 2001). These errors may affect the allocation of resources in schools, sometimes causing resources to be utilized unnecessarily and other times withholding services when they are needed. As a result, measures and processes for screening that increase the likelihood of accurate identification of those students at risk are needed. Computer-adaptive tests (CATs), increasingly used in education, may offer improved accuracy and direction for intervention (e.g., Shapiro & Gebhardt, 2012); however, there is limited research on their use to identify risk over multiple years.
CATs As Universal Screeners
Traditional screening measures are typically based on classical test theory, and are generally appropriate for average students within a group but often fail to capture variability in examinee ability achievers (Lee, Lembke, Moore, Ginsburg, & Pappas, 2012; Merrell & Tymms, 2006). Traditional measures include questions that are appropriately challenging for the average student, but too difficult for low achievers and too easy for higher. In contrast, CATs utilize item response theory (IRT), which includes item-level examination and uses probability to predict an examinee’s likelihood of answering a given item correctly (Meijer & Nering, 1999). As each question is answered, the item difficulty is reestimated based on correct or incorrect responses. Therefore, it is possible for each student in a class to receive a unique administration.
There is a need for highly accurate screening tools due to the importance of screening results in educational decision making. Diagnostic, or classification accuracy describes whether or not screening scores accurately predict risk, given a student’s actual performance (e.g., National Center on Response to Intervention, 2013). Screening can be broken down into four possible scenarios. A student may (a) screen positive for risk of failure and fail (true positive), (b) screen negative for risk and pass (true negative), (c) screen positive for failure and pass (false positive), or (d) screen negative for failure and fail (false negative). These four outcomes are used to calculate diagnostic accuracy statistics: sensitivity, specificity, positive predictive power (PPP), and negative predictive power (NPP). Sensitivity describes how accurately a screener identifies individuals who later fail, whereas specificity describes how accurately a screener identifies individuals who later pass. The more accurate a screener, the easier it is for educators to identify those students at risk of poor performance and in need of intervention. In addition, area under the curve (AUC) is an overall measure of accuracy of the predictor where an AUC of .50 represents a probability of chance and AUC of 1 represents a perfect screener. One method for calculating the aforementioned statistics is graphing a receiver operating characteristic (ROC) curve. ROC curves plot true positives against false positives across different cut points, and yield sensitivity and specificity values for each cut point.
Early Literacy CATs
The use of CATs as universal screeners of academic skills is a relatively new area of research, with only a few studies examining the use of these measures. Research on the use of CATs includes three academic areas: early literacy, math, and reading. STAR Early Literacy (SEL) (Renaissance Learning, 2008) is a computer-adaptive measure of early literacy skills for students in prekindergarten through third grade. Initial research regarding SEL did not explicitly examine the utility of the CAT as a universal screener but did examine validity of the measure compared with three commonly used early literacy tools: the Dynamic Indicators Basic Early Literacy Skills (DIBELS), the Group Reading Assessment and Diagnostic Evaluation (GRADE), and the Texas Primary Reading Inventory (TPRI; McBride, Ysseldyke, Milone, & Stickney, 2010). Researchers examined convergent validity, the degree to which the SEL measures are related to existing early literacy measures, given that each instrument measures similar constructs, that is, the five components of reading. In kindergarten, SEL was weakly correlated to all the reading components except for phonics, where the relationship reached moderate levels (r = .42). SEL was more strongly related to each of the reading areas in first and second grades, with the strongest correlation found at first grade with fluency (r = .69), though additional research is needed on the accuracy of these measures (McBride et al., 2010).
Expanding on this work, a second study examined the degree to which fall, winter, and spring kindergarten SEL scores predict end of kindergarten and end of first-grade reading skills compared with paper-based measures of early literacy (Clemens et al., 2015). A total of 98 kindergarten students participated, with 71 participants remaining at end of first grade, 1 year later. Students completed SEL during fall, winter, and spring of kindergarten, and traditional, paper-based measures including letter-naming fluency (LNF), letter-sound fluency (LSF), word identification (WID), word attack (WAT), and word reading fluency (WRF) in May of kindergarten and WID, WAT, and reading–curriculum-based measurement (R-CBM) in May of their first grade. SEL scores were statistically significant predictors of kindergarten, end-of-year word-reading skills, with fall SEL scores accounting for 35% of the variance and winter and spring accounting for 38%. When SEL was combined with paper-based measures (LNF and LSF), the proportion of explained variance increased to 58%. Kindergarten spring SEL was a statistically significant predictor of both first-grade factors, accounting for 37% of variance in reading accuracy and 33% of the variance in reading fluency. The accuracy of SEL in predicting later reading performance on WID, WAT, and WRF in kindergarten and on WID, WAT, and R-CBM in first grade was also examined (Clemens et al., 2015). For the kindergarten analysis, AUC ranged from .81 to .94. Sensitivity levels were generally low when using the SEL cut score alone (.54 for fall, .62 for winter, and .46 for spring) compared with the paper-based measures (.92 for LNF and LSF alone). Combining all three measures (LNF, LSF, and SEL) as the predictor resulted in the same level of sensitivity as the paper-based measures alone (.92). When examining the accuracy of SEL scores from spring of kindergarten predicting word-reading skills at the end of first grade, sensitivity levels were poor, ranging from .18 when the 40th percentile was used as the criterion to .00 with the 15th percentile. Sensitivity levels of the paper-based measures were higher for both criteria ranging from .90 to 1.0. This study supports the practice of combining measures to increase the strength of prediction over a single test alone.
Math CATs
The use of CATs as universal screeners has also been explored in the academic area of math. Shapiro and Gebhardt (2012) examined the concurrent and predictive validity, as well as the diagnostic accuracy of a CAT and traditional, paper-and-pencil CBMs in math. The measures examined included STAR–Math (STAR-M), which is a CAT, and AIMSweb computation (MCBM), and concepts and application measures (MCAP). Correlations were mostly significant across grades and administration time points for STAR-M and MCBM, and for all STAR-M and MCAP relationships, ranging from weak to moderate. STAR-M was more highly correlated to the statewide test than either MCBM or MCAP.
The proficiency cut point for the statewide test in Pennsylvania (Pennsylvania System of School Assessment [PSSA]; the 16th percentile) was used to examine diagnostic accuracy. The findings indicated consistently high levels of specificity across measures and times for all grades (.86–.97). Sensitivity levels varied considerably. MCBM sensitivity ranged from .28 to .54, and MCAP sensitivity ranged from .28 to .48. Sensitivity of STAR-M across fall and winter ranged from .68 to .72, suggesting STAR-M may more accurately identify students who later fail the statewide test. Shapiro and Gebhardt (2012) used a cut point selection method that may work well with PSSA but not with other criterion measures, as is the case with many studies of diagnostic accuracy that are limited in generalizability due to the different criterion measures used (VanDerHeyden, 2011).
Reading CATs
A recent study expanded on the work of Shapiro and Gebhardt by examining the validity and diagnostic accuracy of a reading CAT (i.e., STAR–Reading [STAR-R]) with state test performance (Ochs, Keller-Margulis, McQuillin, & Jones, 2016). Performance on the CAT screener at fall, winter, and spring time points in relation to spring state test performance for students in third through fifth grades (N = 1,218–1,298) was examined. Results indicated moderate to strong relationships between STAR-R and the state test across grades and screening time points. Diagnostic accuracy statistics for fall and winter screening were examined using ROC curves. Cut points associated with a sensitivity of .90 and those that maximized sensitivity and specificity were examined. AUC values were significant and exceeded .80 across grades. When sensitivity and specificity values were balanced, results were consistent with those reported for traditional screening measures (.74–.79). Existing research regarding CATs (i.e., Ochs et al., 2016; McBride et al., 2010; Shapiro & Gebhardt, 2012) provide evidence that, in some cases, CATs are closely related to performance on statewide assessments. CATs also demonstrate marginally higher levels of sensitivity, while maintaining levels of specificity consistent with other measures (Shapiro & Gebhardt, 2012). Although the current studies represent an emerging body of literature, research regarding the use of CATs as screening tools is limited and many unanswered questions about their use remain.
Although a flexible method for selecting cut scores, ROC curves may not be a practical option for use in schools given the analytic steps and interpretation required. The majority of studies examine diagnostic accuracy of single time points collected during the same year that criterion is administered (e.g., Ochs et al., 2016). Longitudinal studies, however, would indicate how early students could be identified as at risk, perhaps even before the year when the criterion is administered. If a screener can predict student performance several years before a criterion, it increases opportunities for intervention provision as well as contributes to the validity evidence for CATs. In addition, initial student performance is only one variable for understanding and predicting later performance. One possible expansion of current diagnostic accuracy studies is to examine the diagnostic accuracy of a growth metric. Growth can be relatively easy for practitioners to calculate and may provide additional data about predicting student performance on state tests in subsequent years. Although studies are emerging that examine growth estimates on CATs used for progress monitoring (e.g., Van Norman, Nelson, & Parker, 2017), no known studies examine growth on reading CATs as universal screeners and none compares the diagnostic accuracy of both single-point assessments and growth for STAR-R.
Purpose of the Present Study
The purpose of this study was to examine the validity and diagnostic accuracy of a reading CAT, the STAR-R, used as a screener and a statewide test, including examination of both single screening time points and growth within and across years. Specifically, the following research questions were addressed:
We expected that each relationship would be significant and positive across time points, with higher correlations expected, the more proximal the STAR-R score is to the administration of the state test.
We expected inconsistent relationships between growth on STAR-R and state test scores, with the strongest relationship present between rate of growth and the state test 1 year later.
We expected that diagnostic accuracy levels, specifically sensitivity will be higher for single time points than for slope. No other specific predictions were made.
Method
Participants
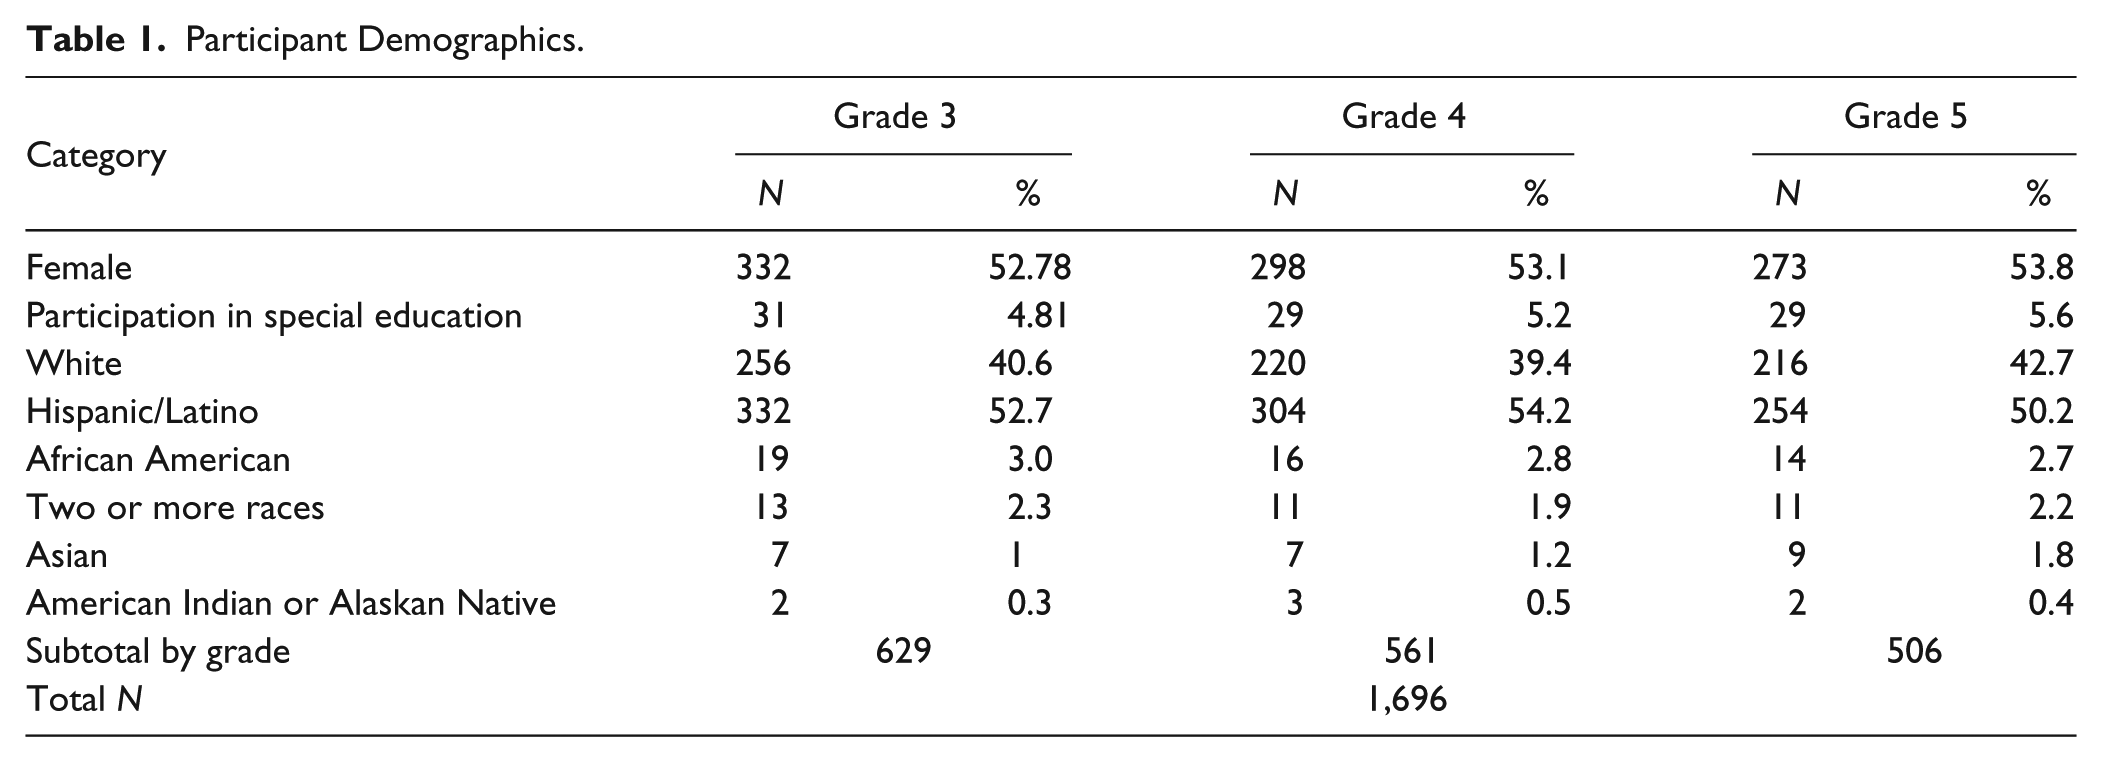
Participants in this study included 1,696 students in third through fifth grades for whom both STAR-R and state test data were available. Data are from a large, suburban school district in southeast Texas from fall 2012 through spring 2015 (i.e., three full school years). In this district, nonnative English speakers receive some or all their instruction in their native language until they demonstrate adequate English proficiency. Although we did not have language proficiency scores, we included only students from English-only instructional settings in our sample. Table 1 contains participant demographics.
Participant Demographics.
Measures
STAR-R
STAR-R is a computer-adaptive measure of reading comprehension for students in first through 12th grades, with scaled scores ranging from 0 to 1,400 (Renaissance Learning, 2015). The measure captures 46 reading skills within five domains: word knowledge and skills, analyzing literary text, understanding author’s craft, comprehension strategies and constructing meaning, and analyzing argument and evaluating text. Students answer 25 multiple-choice questions representing all five domains in every test administration, which is presented on a computer. Because each administration is based on previous performance and items presented, no duplicate test questions are presented within a 90-day window. All participants in the 2008 norming study completed the test within 15 min (Renaissance Learning, 2015). Each item also has a time limit, which varies by grade and item type but ranges from 60 s for kindergarten through second graders to 45 (vocabulary-in-context item) or 90 s (text passage item) for third through 12th graders. STAR-R was designed as a progress-monitoring tool and to provide an estimate of reading comprehension relative to national norms.
Generic reliability estimates ranged from .89 for third and fourth grades to .90 for fifth grade, with split-half reliability estimates at .89 across grades (Renaissance Learning, 2015). Average concurrent and predictive validity estimates were .70 or greater (Renaissance Learning, 2015). Validity results for STAR-R scores predicting later performance on state tests (including California, Delaware, Florida, Iowa, Michigan, and Mississippi) range between .39 and .78 for third through fifth grades (Renaissance Learning, 2015). An analysis of classification accuracy from STAR-R data collected across seven states (including Arkansas, Delaware, Illinois, Kansas, Michigan, Mississippi, and South Dakota) 3 to 11 months prior to state test administration yielded an average sensitivity level of .78 and specificity of .82 (Renaissance Learning, 2015). Across those seven states, STAR-R scores were used to accurately predict actual failure on the state test 78% of the time. Based on results from a review conducted by the National Center on Response to Intervention in 2011, STAR-R is rated as demonstrating convincing evidence for reliability and validity of slope, suggesting an ability for scores to detect individual differences in growth and predict future performance (National Center on Response to Intervention, 2011; Renaissance Learning, 2015). Split-half reliabilities were in the .70 range and median predictive validities for slope on the STAR-R and Mississippi, North Carolina, and Oregon state tests were in the .40 range for third through fifth grades.
State of Texas Assessments of Academic Readiness (STAAR)
The statewide achievement test that serves as the criterion measure in this study is the STAAR in reading for third, fourth, and fifth grades. This test is the recently revised, high-stakes test used in Texas, first administered in spring 2012. It is a norm-referenced, standardized test used to measure whether students meet state-determined academic standards.
Since the first administration in spring 2012, passing standards have been phased in each year across three levels. Level 1 was considered unsatisfactory academic performance, Level 2 was considered satisfactory academic performance, and Level 3 described advanced academic performance. Final performance standards were changed in 2017 to reflect four performance classifications: does not meet grade level, approaches grade level, meets grade level, and masters grade level. The cut scores for each category remained relatively stable despite the name change. The range of scores previously labeled as satisfactory is now distributed into two categories, approaches and meets grade level. For instance, for both the 2015 and 2017 cut score for advanced/masters grade level was 1,555 (83rd and 81st percentile, respectively) and above, and unsatisfactory/did not meet grade level was below 1,331 (26th percentile) for 2015 and below 1,345 (30th percentile) for 2017 for third graders. In spring 2015, 78% of fifth-grade students performed at or above the satisfactory criteria across the state, 74% of fourth, and 77% of third graders. Internal consistency values range from .88 for third grade to .91 for fourth and fifth grades for the 2015 administration (Texas Education Agency [TEA], 2015). Additional information about performance of our sample can be found in Table 3.
Procedures
This study examined extant screening data collected from fall 2012 through spring 2015 and the spring 2015 administration of the statewide standardized test. STAR-R was used throughout the year to assist in identifying students at risk. The relationship between screening scores and the state test was examined within year, and across 1 and 2 years. Specifically, students who completed the state test in fifth grade (2015) have screening data from third (2012–2013), fourth (2013–2014), and fifth (2014–2015) grades. Students who completed the state test in fourth grade (2015) have screening data from second (2012–2013), third (2013–2014), and fourth (2014–2015) grades. Students who completed the state test in third grade (2015) have screening data only from second (2013–2014) and third (2014–2015) grades. Table 2 depicts the data collected across years.
Data Collected Across Years.
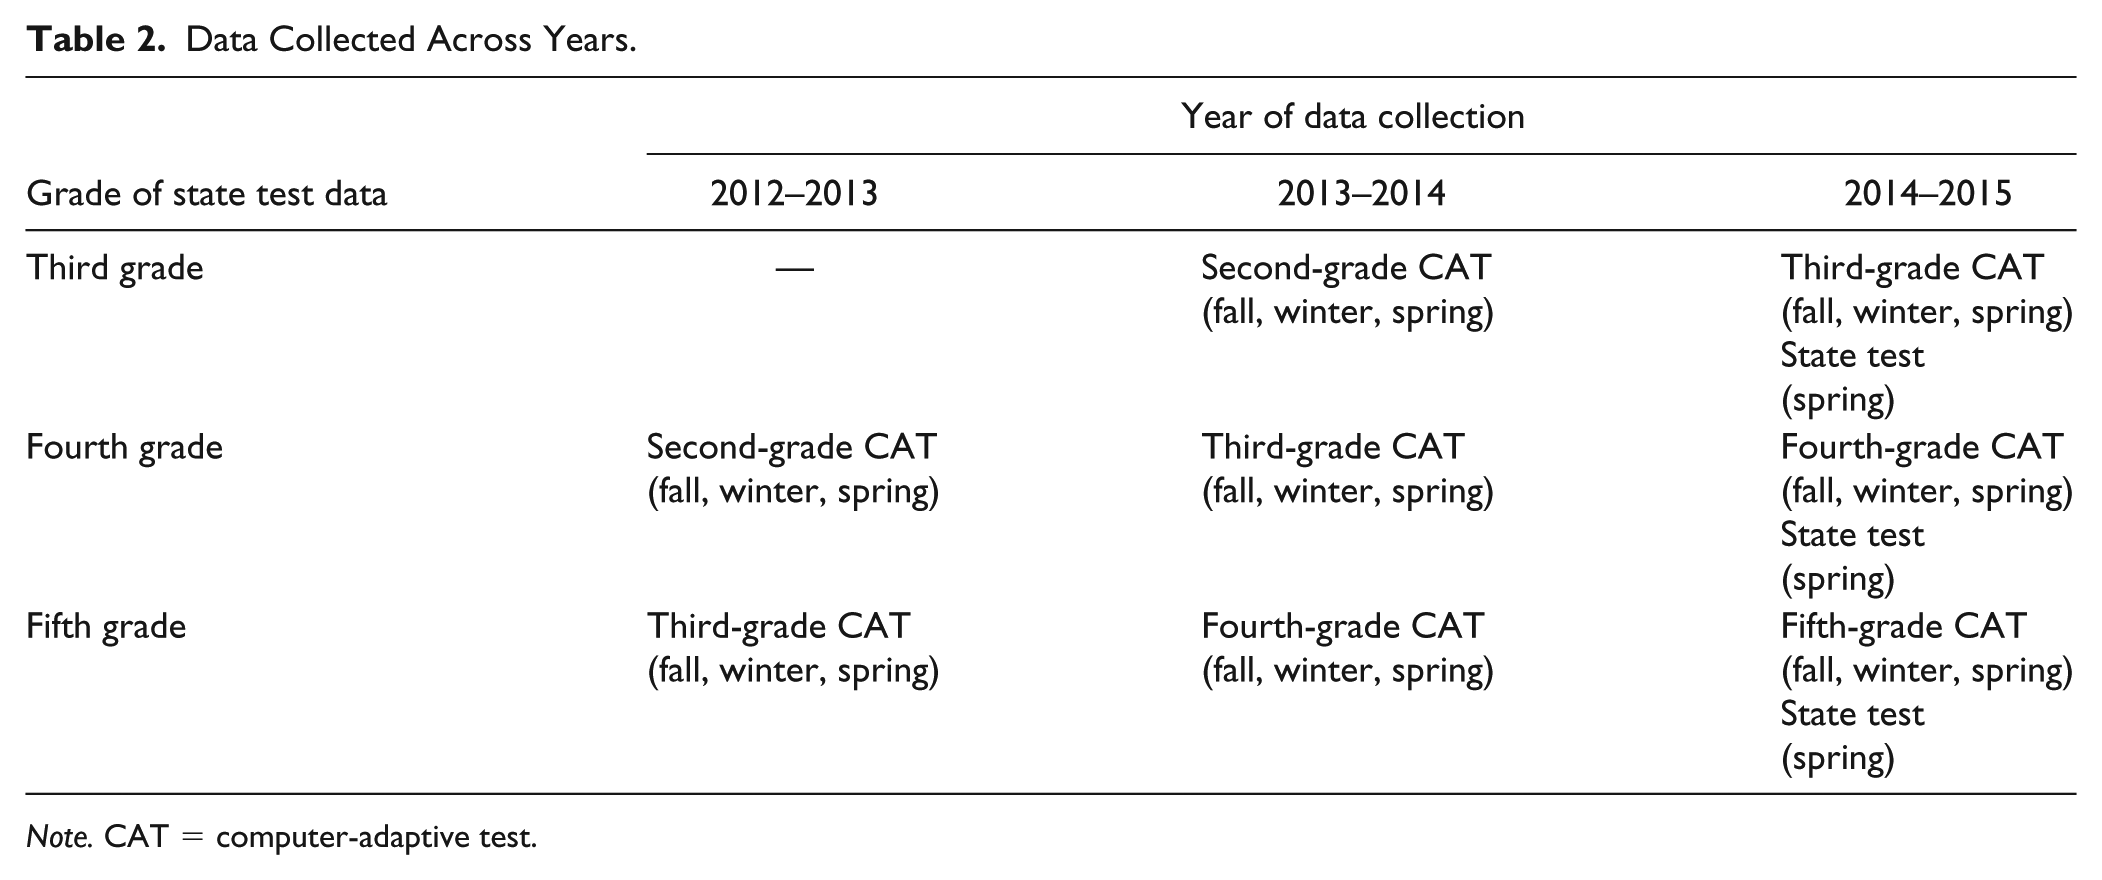
Note. CAT = computer-adaptive test.
In this sample, STAR-R was administered to all students during September, January, and April, and sometimes more often. To examine predictive validity and diagnostic accuracy of single time points, fall, winter, and spring scores were identified as the first screening score within the windows of September 1 to October 31, January 1 to February 28, and April 1 to May 31. Total screening administrations for each student, within an academic year, ranged from three to 14, with most students having only three screening data points (i.e., fall, winter, spring). The majority of screening data points (97.20%) occurred within a 10-day window, within the larger designated screening window. Within the designated district screening time period of September 1 to October 31, most students completed STAR-R between September 15 and 24. STAR-R can be administered as often as weekly; however, no student in our sample completed testing that frequently. Testing occurred in whole classes in computer labs, small groups, or individually on classroom computers.
For the spring 2015 statewide test administrations, all testing professionals held valid education credentials, received training in administration procedures, and signed a security oath, outlined by the TEA. Given recent changes by the state affecting previous and future passing standards and the timeline for implementation, the passing standard and phase (i.e., Phase 1) in place for the 2015 test was used in all analyses. We made this decision due to the uncertainty of the ultimate passing standards. Given the most recent change had little effect on the score ranges, but rather distributes the middle category (satisfactory) into two (approaches and meets standards) categories, we do not anticipate a significant impact on our findings.
Data Analysis
We conducted all analyses in the statistical program SPSS, version 23.0. Preliminary analyses included descriptive statistics (sample size, M, standard deviation, range, skewness, and kurtosis). Slope (i.e., rate of growth or change in scaled score across time) was calculated for each individual using ordinary least squares (OLS). We decided that OLS was the most parsimonious analysis to address the scope of these research questions, and it is currently the method used to generate growth rates by the test publisher (Renaissance Learning, 2018). The relationship between STAR-R and the statewide achievement test was examined using Pearson’s product–moment correlation with unadjusted alpha levels set to α = .05 for single time points and slopes. However, given the number of comparisons made, we used the more conservative Bonferroni correction to achieve an adjusted alpha of α = .002 (.05/29) to assess significance (Curtin & Schulz, 1998).
This study used two different procedures to select cut scores. First, we used ROC curves to calculate diagnostic accuracy of single time point scores and slopes. This nonparametric statistical procedure is a flexible way to set cut scores and commonly used in psychoeducational research. When dichotomizing state test scores into passing/failing, we used the passing standard in place during the 2015 administration (i.e., satisfactory and advanced categories, scaled score of 1,331 or higher was passing). Although various guidelines exist for acceptable levels of diagnostic accuracy (.70 to .90; Compton, Fuchs, Fuchs, & Bryant, 2006; Jenkins, Hudson, & Johnson, 2007; Johnson, Jenkins, & Petscher, 2010), a recent meta-analysis suggests .80 for sensitivity and .70 for specificity, when used in screening decisions (Kilgus, Methe, Maggin, & Tomasula, 2014). For this study, ROC curves were used to identify the cut score that maximized sensitivity and specificity, with a minimum specificity of .70. Second, we calculated diagnostic accuracy statistics using the cut score associated with the 25th and 40th percentiles. In practice, scores below the 25th or 10th percentile are sometimes used to categorize risk, but recent support from test publishers and researchers suggests that it may be valuable to examine the 40th percentile as a possible benchmark for screening, as it casts a wider net and allows for a higher false positive rate to maximize sensitivity (e.g., Clemens et al., 2015; Pearson, 2014; Renaissance Learning, 2015). Therefore, this study included examination of both the 25th and 40th percentiles.
The diagnostic accuracy statistics of interest included sensitivity, specificity, PPP, NPP, hit rate (i.e., classification accuracy), and AUC for ROC curve analyses. Sensitivity is the true positive rate or the proportion of students who failed the criterion and were identified as such on the STAR-R. Specificity is the true negative rate of the proportion of individuals who passed the criterion and were expected to pass based on STAR-R screening performance. PPP is the proportion of individuals expected to fail on the screening measure (STAR-R) who went on to fail the criterion, whereas NPP is the proportion of students who passed the screening measure and went on to perform successfully on the criterion. Hit rate is calculated and differs for each cut score. It represents, as a percentage, the number of correctly identified outcomes out of all outcomes in the sample for a particular cut score. The AUC statistic represents the screener as a continuous variable where true positives (i.e., sensitivity) are plotted against false positives (i.e., one specificity). Relative differences in diagnostic accuracy were examined by comparing AUC for independent samples within, and across 1 and 2 years.
Results
Descriptive Statistics
Data were screened for missing values and outliers, and participants were included only if they had data across all years and time points. Outliers were determined through visual inspection of a histogram and boxplot (Field, 2013). Four mild outliers existed for the state test, and on review of each score, were found to be accurate and appropriate (i.e., perfect test scores); therefore, all data were retained. Preliminary analyses consisted of descriptive statistics including sample size, mean, standard deviation, range, skewness, and kurtosis. Descriptive statistics are presented in Table 3. The values of skewness and kurtosis were within normal range (±1.96; Madansky, 1988), with the exception of third-grade STAR-R from 2012 to 2013, which demonstrated an abnormally sharp peak. Three groups of data were examined across 3 years. Sample size varied across grades from N = 629 in third grade, N = 561 in fourth grade, and N = 506 in fifth grade (total N = 1,696). In fifth grade, 80.2% of students passed the state test, 81.9% passed in fourth grade, and 77.9% passed in third grade, demonstrating rates similar to statewide performance (78%, 74%, and 77%, respectively). Although we did not test for statistical differences between groups, we did explore the demographic characteristics of students who were misidentified by the screener by combining grades across each cut point procedure (i.e., cut score associated with maximized sensitivity and specificity, the 25th and 40th percentiles). Distribution of demographic characteristics was relatively stable across each of the three diagnostic accuracy analyses. Of those misidentified, 54% to 55% were female, 56% to 58% were Hispanic, 33% to 37% White, 6% African American, and 3% received special education services.
Descriptive Statistics for State Test and STAR–Reading.
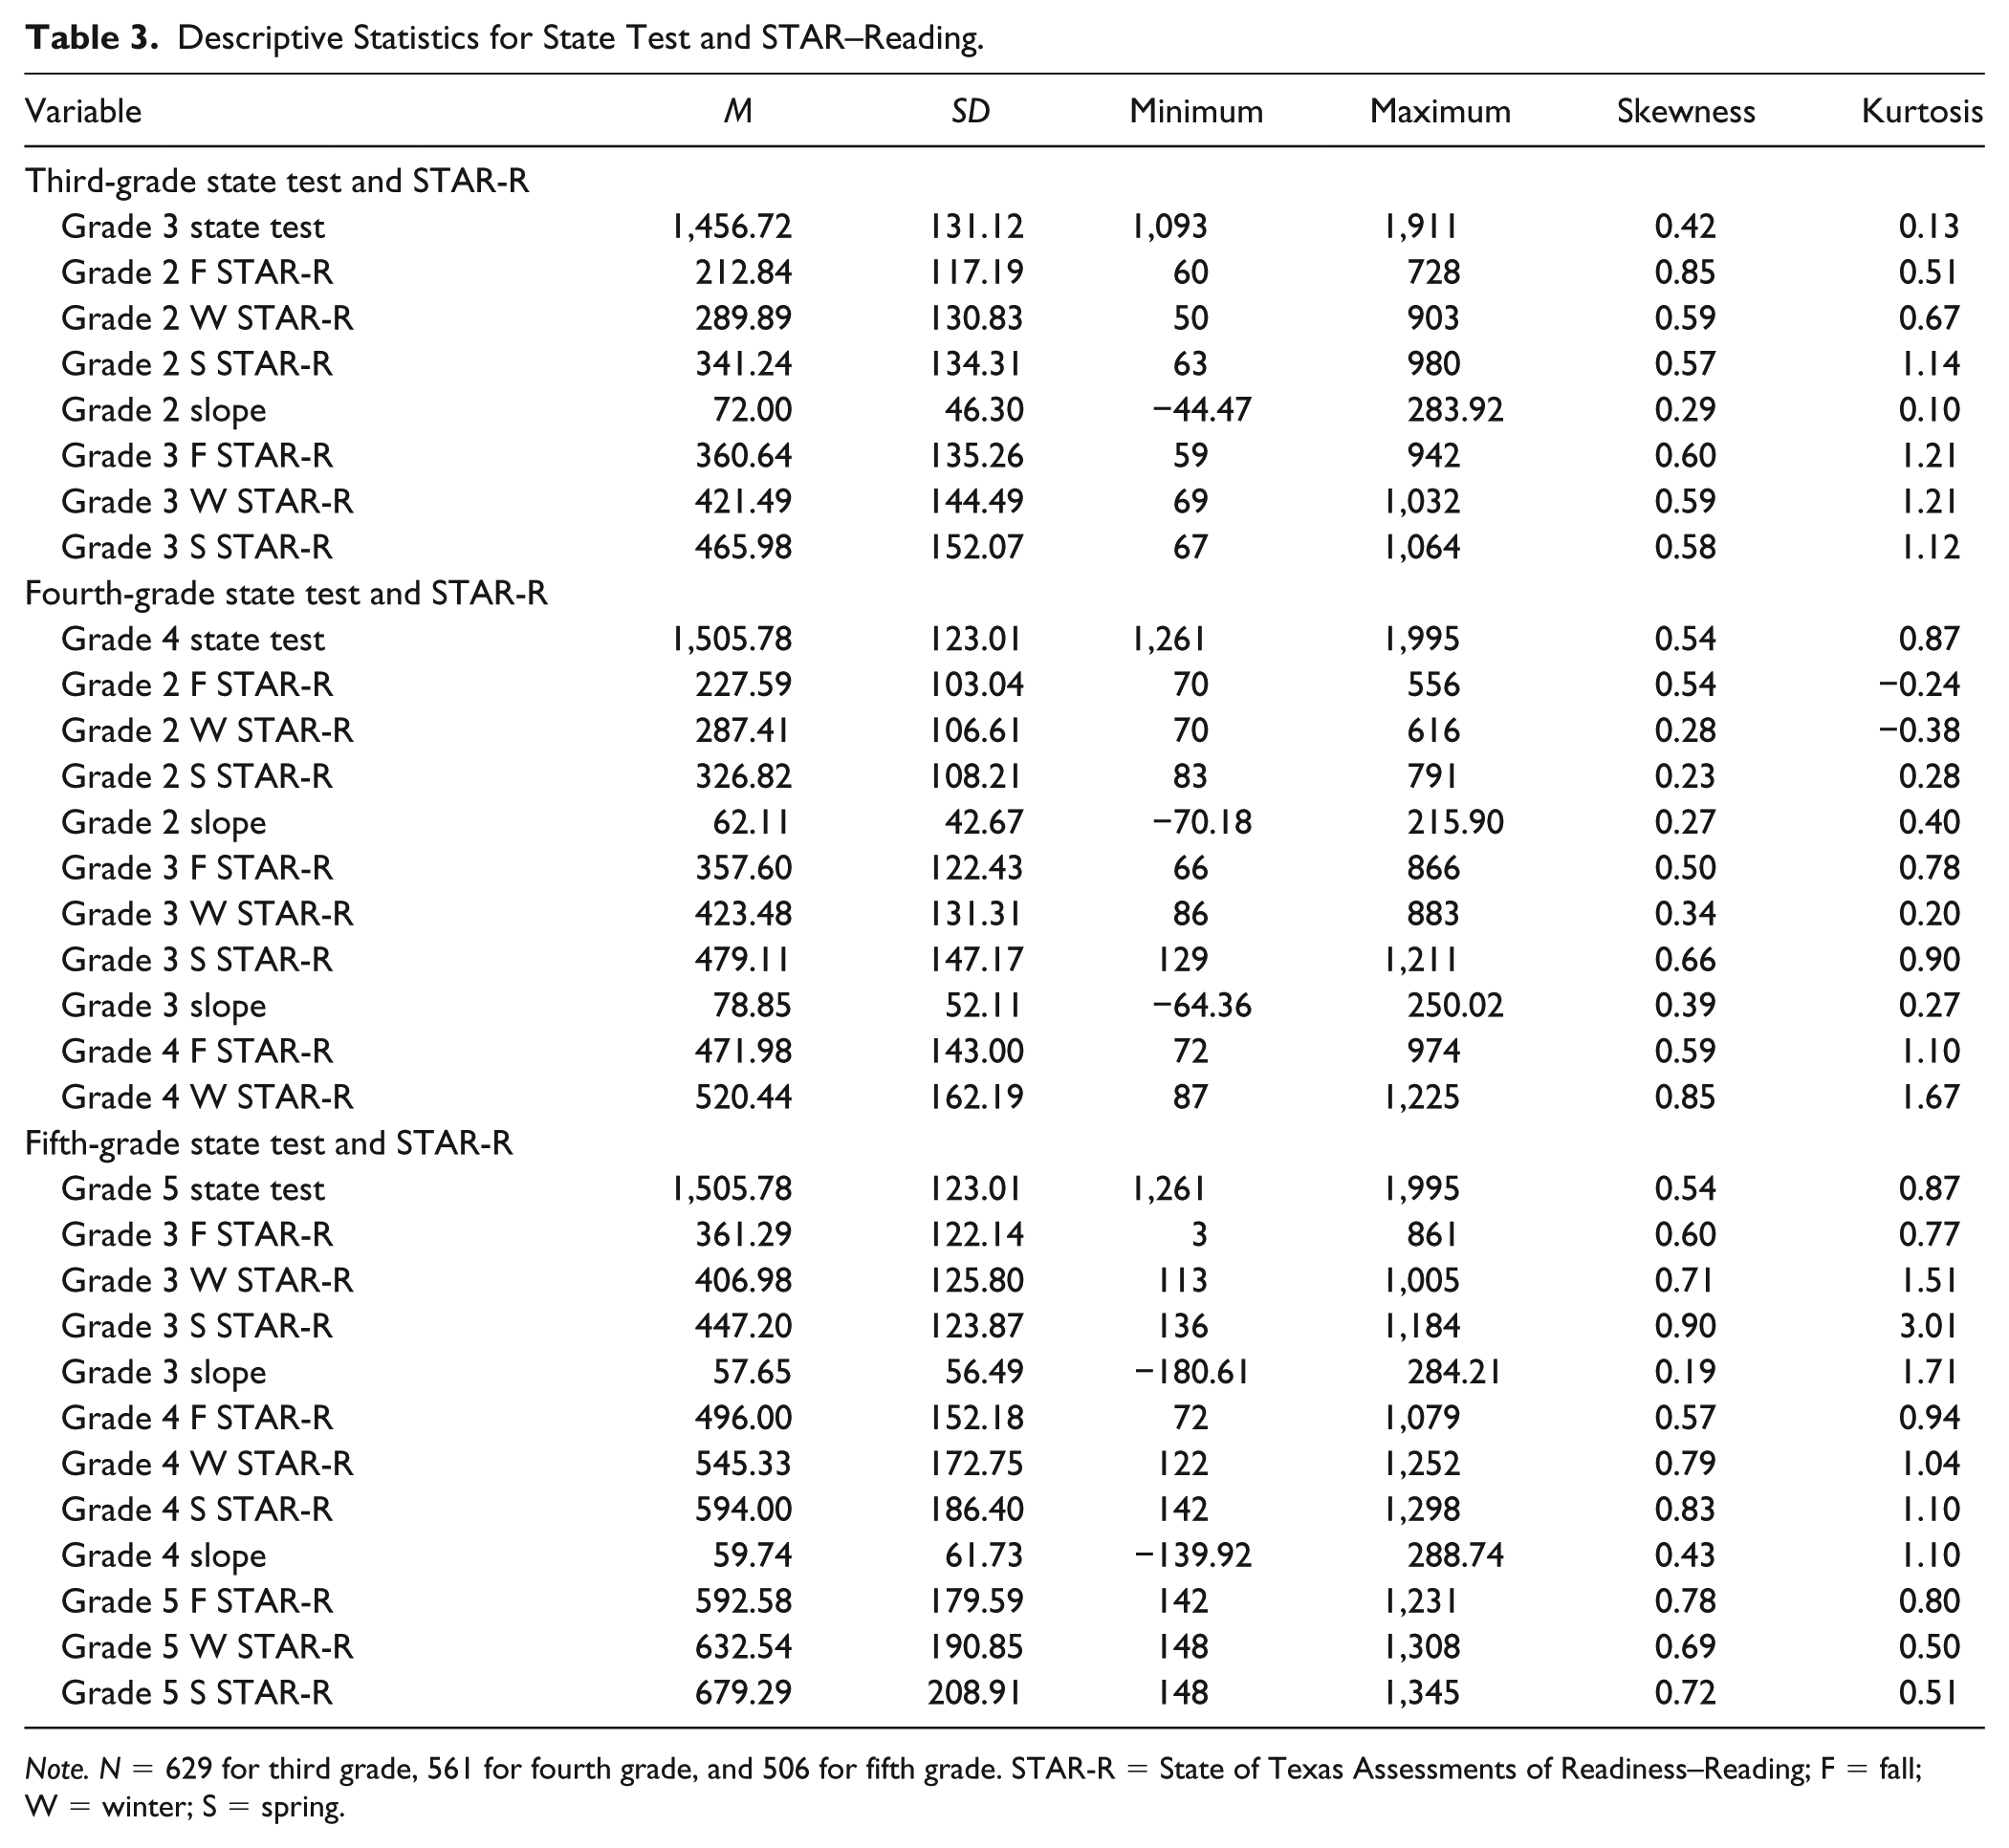
Note. N = 629 for third grade, 561 for fourth grade, and 506 for fifth grade. STAR-R = State of Texas Assessments of Readiness–Reading; F = fall; W = winter; S = spring.
Predictive Validity
To answer the first and second research questions, we examined predictive validity relationships for single STAR-R scores and the growth on STAR-R within and across years. Table 4 displays correlation results for STAR-R and the statewide achievement test. Given the number of comparisons made, a Bonferroni correction was used for cross-sectional and longitudinal analyses, resulting in a significance value of .002 (.05/29). All significant relationships were maintained after applying the new p value. STAR-R single-point scores were significantly related to the state test across all time points (.60–.79). Although all single-point relationships were strong, the correlations decreased over time with the within-year relationship (e.g., third-grade STAR-R and third-grade STAAR performance), demonstrating the highest correlations. Correlation statistics for slope of STAR-R varied. Across 1 and 2 years, slope in second grade was significant but weakly and significantly correlated with fourth-grade statewide test performance and the relationship between third-grade slope and fifth-grade state test performance was strong but insignificant.
Correlations Between Fall, Winter, and Spring STAR-R and Slope With State Reading Test 1 and 2 Years Later.

Note. For all significant results, significance persisted following p = .002. STAR-R = State of Texas Assessments of Readiness–Reading.
Value not significant, all other values were significant at p < .002.
Diagnostic Accuracy
To answer the third and fourth research questions, we calculated diagnostic accuracy statistics for single time points (i.e., fall, winter, and spring) and slopes both within the year and longitudinally (i.e., across 1 and 2 years). Spring time points were omitted for within-year analyses because state test administration occurred prior to spring screening. The results are grouped by type of STAR-R cut score selection process (i.e., maximized sensitivity and specificity, 25th percentile, and 40th percentile) and then presented by grade level within each section.
Maximized sensitivity and specificity
First, ROC curve analyses were conducted to identify the cut score associated with maximum (⩾.70) sensitivity and specificity for both single time points and slope. These results are presented in Table 5. Diagnostic accuracy statistics were calculated for all STAR-R single points, but it was not possible to identify a cut score that maximized sensitivity and specificity for any slopes. The AUC statistic was generally poor (.52–.67, p <.002), reflecting levels not much better than chance, and was significant for all but fifth grade across 2 years.
Diagnostic Accuracy—Maximized Sensitivity and Specificity.

Note. Only F and W scores were included for within-year relationships because the state test occurred before the spring screening administration. PPP = positive predictive power; NPP = negative predictive power; AUC = area under the curve; F = fall; W = winter; S = spring.
It was not possible to identify a cut score that maximized sensitivity and specificity.
Value not significant, all other AUC values were significant at p < .001.
Third grade
The hit rate statistics suggest that the STAR-R cut score that maximized both sensitivity and specificity resulted in 72% to 78% accurate prediction within and across 1 year, with 2% false negatives within year, and less than 3% across 1 year. Based on a single STAR-R score, 2% to 3% of the sample were expected to pass but failed the state test. AUC was consistently high across STAR-R single points, ranging from .86 to .90, and decreased to .64 for slope across 1 year (p < .002). When cut score selection maximized sensitivity and specificity, values were consistently high, with sensitivity reaching .92 for the fall STAR-R score within year. Similar to results from the correlational analyses, sensitivity was higher for more proximal relationships (i.e., within year).
Fourth grade
Hit rate statistics show that the STAR-R cut score that maximized both sensitivity and specificity resulted in a 73% to 78% accurate prediction, with 2% false negatives within year, less than 3% across 1 year, and less than 4% across 2 years. The percentage of false negatives (i.e., students expected to pass based on the screener who failed) increased across years. AUC was significant and consistently high across single points, but decreased to .62 for slope across 1 year, and .60 for slope across 2 years (p < .002). Sensitivity and specificity levels were consistently high across STAR-R single points, and sensitivity levels were .90 or higher for fall of third-grade and all fourth-grade points. Sensitivity levels generally decreased with time. Resulting levels of PPP were lower (.39–.45) than NPP (.95–.98).
Fifth grade
Similar to the earlier grades, fifth-grade hit rate statistics resulted in 70% to 79% accurate classification, with increased false negatives across years. Specifically, results indicated less than 1% of false negatives within year, less than 2% of false negatives across 1 year, and less than 3% across 2 years. AUC was significant and consistently high across STAR-R single points, with several time points exceeding .90 (p < .002). AUC for slope predicting the state test score 1 year later was significant but lower (.67, p < .002), and not significant across 2 years. Sensitivity and specificity levels were consistently high across single points, with sensitivity reaching or exceeding .90 within year, and across 1 year. As with the earlier grades, sensitivity levels increased the more proximal the time point to the state test. Resulting levels of PPP were much lower (.24–.35) than levels of NPP (.96–.99).
For each sample (i.e., third, fourth, and fifth grade), a direct comparison of AUC was conducted. No statistically significant difference was found within year (z = .65–.67, p = .50–.52), or across 1 year (z = .33–.35, p = .74–.76) or 2 years (z = −.92, p = .36).
The 25th percentile
Second, to mirror a more applied approach to decision making, diagnostic accuracy analyses were conducted by identifying the cut score associated with the 25th percentile of performance on the STAR-R single time points and slope. These results are reported in Table 6.
Diagnostic Accuracy—Cut Score Associated With the 25th Percentile on the STAR-R.

Note. Only F and W scores were included for within-year relationships because the state test occurred before the spring screening administration. STAR-R = State of Texas Assessments of Readiness–Reading; PPP = positive predictive power; NPP = negative predictive power; F = fall; W = winter; S = spring.
Third grade
Hit rate statistics resulted in 81% to 85% accurate classification when using the cut score at the 25th percentile for single points, and decreased to 73% for the slope across 1 year. False negatives increased marginally from the previous cut score selection procedure for single points, with 4% within year and across 1 year. When slope was used to predict performance on the state test, diagnostic accuracy statistics yielded 11% false negatives. All but one time point yielded sensitivity and specificity levels above .71. Although the hit rate was moderate for slope (.73), resulting sensitivity levels were low (.34). Higher specificity (.81) suggests that slope more accurately identified those likely to pass the state test than those who were likely to fail. Sensitivity levels did not decrease with time, as was previously found.
Fourth grade
Hit rate statistics resulted in 90% to 94% accurate classification for single points and decreased to 83% and 86% accurate predictions for slope cut points across 1 and 2 years, respectively. When slope was used to predict performance on the state test, the false negative rate was 11% for 1 year, and 13% across 2 years. Sensitivity levels were variable, ranging from .61 to .76, generally decreasing with an increase in time between screening and the state test for single points. Specificity levels were consistently higher, with all values reaching or exceeding .84. For slope cut points, specificity remained higher (.80s), but sensitivity levels decreased to .36 across 1 year and .30 across 2 years.
Fifth grade
Hit rate statistics suggest that 77% to 84% of outcomes were accurately classified for single points, and 83% of outcomes were accurately classified across 1 year using the slope cut point, and 78% across 2 years. For single points, false negatives remained low and increased with time, ranging from 2% within year, 3% across 1 year, and 5% across 2 years. For slope, the false negative rate was 8% for 1 year and 10% across 2 years. STAR-R single points yielded variable levels of sensitivity, ranging from .59 to .84, with sensitivity levels again decreasing over time whereas specificity levels remained at .80 or above across all time points. Sensitivity levels using slope scores were inadequate. PPP values remained lower than NPP values across time points and slopes.
The 40th percentile
Applying a practical approach to decision making, diagnostic accuracy analyses were conducted by identifying the cut score associated with the 40th percentile of performance on single STAR-R scores and slope. These results are reported in Table 7.
Diagnostic Accuracy—Cut Score Associated With the 40th Percentile on the STAR-R.

Note. Only F and W scores were included for within-year relationships because the state test occurred before the spring screening administration. STAR-R = State of Texas Assessments of Readiness–Reading; PPP = positive predictive power; NPP = negative predictive power; F = fall; W = winter; S = spring.
Third grade
The cut score at the 40th percentile resulted in 72% to 74% accuracy, with 2% false negatives for within year and across 1 year for single points. The slope associated with the 40th percentile resulted in 63% accuracy, but increased false negatives (8% across 1 year). All time points resulted in sensitivity and specificity levels exceeding .70. Sensitivity ranged from .85 to .90 and the highest values were associated with proximity to the state test. Similar to findings at other grade levels with other cut score procedures, PPP values were much lower than those of NPP. The slope cut point yielded lower and inadequate diagnostic accuracy statistics, with sensitivity of .50 and specificity of .65. Cut scores increased consistently across time points and were similar to those identified when maximizing sensitivity and specificity.
Fourth grade
Hit rate statistics indicated 73% to 79% accurate screening decisions for single points, and 63% accuracy for slope across 1 year and 62% across 2 years. Resulting false negatives were 3% within year, 2% across 1 year, and 3% across 2 years for single time points, and increased to 10% for slope across 1 and 2 years. Sensitivity and specificity levels exceeded .70 across all single points, and decreased for slope. The slope cut score at the 40th percentile resulted in sensitivity of .45 across 1 year and .44 across 2 years, with specificity levels in the .60s with resulting levels of PPP (.22–.49) lower than those of NPP (.84–.97) for both single points and slopes.
Fifth grade
The hit rate ranged from 67% to 72% for single points, 70% for slope across 1 year, and 65% for slope across 2 years. For single points, resulting false negatives were 2% within year, and 6% across 1 and 2 years. False negatives increased to 5% for slope across 1 year, and 8% across 2 years. Although hit rates were lower for fifth grade, sensitivity levels remained high ranging from .78 to .97 across single points. Specificity levels, however, decreased to the .60s. The slope cut score at the 40th percentile resulted in inadequate sensitivity levels (below .50) with slightly higher specificity (.69 and .73, respectively). Levels of PPP (.12–.29) remained much lower than those of NPP (.93–.99) for single points and slopes.
Discussion
Universal screening is an essential component of multi-tiered systems of support (MTSS) as it is often the first mechanism by which students are identified as at risk of future failure. Given the importance of universal screening outcomes, it is necessary for measures to be reliable, valid, and accurate to aid in the proper allocation of finite resources (Glover & Albers, 2007; Jenkins et al., 2007). Despite this importance, the current literature on traditional screening measures (i.e., CBMs) indicates that levels of diagnostic accuracy are often inadequate for use in decision making (e.g., Johnson, Jenkins, Petscher, & Catts, 2009; Petscher & Kim, 2011). Challenges associated with insufficient diagnostic accuracy levels of R-CBM are not necessarily unique to CBMs, but are present across the screening literature due to variability in cut score selection procedure, methodology, base rates of failure, and differences in criterion measures. This study examined the relationship between a CAT (STAR-R) as a screener and a statewide test, including diagnostic accuracy of single screening points and growth, finding that single time point STAR-R scores were strongly related to the state test and may, therefore, be an option for screening in third through fifth grades given adequate diagnostic accuracy results.
Predictive Validity
Results from the correlation analyses between single time point STAR-R scores and the state test demonstrated significant, strong relationships within year, and across 1 and 2 years with correlations decreasing over time. Within-year findings are consistent with previous work examining a CAT in reading (Ochs et al., 2016), and in most cases, are an increase, particularly at fourth and fifth grades. Similarly, correlation results from this study are higher than those of Shapiro and Gebhardt (2012), which were significant and moderate for the CAT in math (i.e., STAR-M). Correlation results for third and fourth grades’ slope suggested that growth on the STAR-R is weakly related to state test performance 1 and 2 years later. Although this study examined a CAT, a similar finding emerged regarding the long-term relationship of R-CBM slope and a state test (Keller-Margulis, Shapiro, & Hintze, 2008). Measures used for screening, such as those encompassing R-CBM (e.g., oral reading fluency, word recognition fluency) often function as an efficient snapshot to indicate overall reading performance (Deno, 1985). In contrast, STAR-R is a more comprehensive, and arguably diagnostic measure that assesses several reading skills (e.g., prediction, cause and effect, vocabulary; Renaissance Learning, 2014) in a single assessment. Therefore, it was expected that there would be a strong relationship with statewide test performance, and indeed, this was the finding. This suggests that STAR-R may be a useful tool for screening and may aid in the early identification of students struggling with reading.
Diagnostic Accuracy
STAR-R generally demonstrated adequate (i.e., ⩾.80; Kilgus et al., 2014), and, at times, high (i.e., ⩾.90) levels of sensitivity, suggesting its value as a screening measure to identify students at risk of failing the state test. Diagnostic accuracy results from this study, particularly for cut scores associated with maximized sensitivity and specificity, were quite high. This study demonstrated consistently high levels of diagnostic accuracy using a CAT in reading, both within and across years. Within-year sensitivity levels are an increase from previous work using the same criterion and similar sample demographics, increasing the generalizability of results (Ochs et al., 2016). Although there are no previous studies of the long-term diagnostic accuracy of reading CATs in screening, studies examining different criterion measures and employing different cut score selection procedures exist. The within-year sensitivity levels found in this study are higher than previous studies of math (.68–.72; Shapiro & Gebhardt, 2012) and early literacy CATs (Clemens et al., 2015).
Information from the test publisher provides recommended benchmark scores representing the minimum level of performance expected at fall, winter, and spring across first through 12th grades to meet end-of-year performance standards and expected weekly growth rates (Renaissance Learning, 2015). Within-year cut scores identified in this study, particularly those at the 25th and 40th percentiles, were not consistent with national norms reported by the test publisher. Cut scores indicating the 25th percentile for this study sample were, in most cases, closer to the 40th percentile, nationally. For instance, in this sample, the winter cut score at the 25th percentile for third grade ranged from 321 to 329. According to national norms reported by Renaissance Learning (2015), 294 is the cut score at the 25th percentile for third grade. Cut scores identified at the 40th percentile in this sample were variable, with most scores closer to the national norms at the 50th percentile, but others were closer to the 25th or 75th percentile, nationally. This finding supports the establishment and use of local norms in educational decision making (e.g., Kilgus et al., 2014).
An important consideration when interpreting diagnostic accuracy statistics is the overall pass rate. For this sample, 80.2% passed the state test in fifth grade, 81.9% passed in fourth grade, and 77.9% passed in third grade. Although the passing rates for the sample were relatively consistent with the state pass rate across years (78%, 74%, 77%, respectively), PPP and NPP are affected by prevalence rates and, therefore, cannot be generalized or compared across samples. A high PPP may reflect a measure with a truly high PPP, a high prevalence of being at risk, or a combination of the two (VanDerHeyden, 2011). Similarly, caution is needed when generalizing diagnostic accuracy statistics to other groups. Sensitivity and specificity levels are comparable with the extent that other variables remain constant or similar (e.g., outcome measure, cut scores and cut score selection procedures, sample characteristics; Meehl & Rosen, 1955; VanDerHeyden, 2011). Although ROC curves allow for flexible selection of cut scores, this approach may not be practical for all schools. These results suggest that by examining the cut score associated with the 25th percentile, a common practice that is easy to execute, STAR-R performance accurately identified students who passed or failed the state test 77% to 87% of the time. When the hit rate is examined in conjunction with sensitivity levels, the 25th percentile appears to be an appropriate option, especially for fourth and fifth grades. For some schools, depending on resources, simply examining the bottom quartile of performance may be a sufficient means for identifying an adequate and manageable percentage of students for intervention.
AUC comparisons yielded no statistically significant differences, suggesting that STAR-R was generally as accurate at predicting performance within year, and across 1 and 2 years for all three grade groups. Although results generally decreased slightly from within year to long-term, consistently high results suggest that practitioners could use screening results, in conjunction with other educational data, to identify students at risk of failure 1 years and even 2 years prior to state test performance. Importantly, the findings of this study suggest that student screening performance at any given single time point may be a better predictor of outcome than growth when using a CAT. This has the potential to affect how educators monitor student progress and make decisions about intervention. For instance, based on these results, if a student performed at an acceptable level at screening, it may be unnecessary to examine growth. Alternatively, students who demonstrate at-risk performance on individual screening time points should not be overlooked for intervention if they have high growth rates.
One previously reported limitation of R-CBM is a decrease in accuracy in upper elementary grades, once students shift from learning to read to reading to learn (Keller-Margulis et al., 2008). Although we did not make a direct comparison with CBM, in the present study, consistently high levels of accuracy were found across grades. In fact, across all cut score selection procedures, sensitivity levels were generally higher for fourth and fifth grades, and sometimes third grade. STAR-R may be a viable screening option, particularly at fourth and fifth grades where R-CBM has demonstrated weaker relationships (e.g., Keller-Margulis et al., 2008). Given the breadth of skills measured by STAR-R, more accurate screening decisions as well as recommendations for intervention may be possible.
Implications
Although results are not generalizable to all CATs, the present study has implications for research and practice. First, results contribute to the literature on the use of CATs for universal screening in reading. CATs remain a relatively new area of study in the screening literature, and there continues to be a need for research on the psychometric properties of CATs when used in multitiered systems of support. This study also contributes to the growing and necessary research suggesting the validity of the STAR-R as related to state test performance. This is of particular importance given that many studies examining the relationship between screeners and state tests are becoming dated and new state tests and standards are increasingly available. In addition, no known studies report the long-term diagnostic accuracy of STAR-R or expected rates of growth across the year. Renaissance Learning (2017) compiles peer-reviewed research, and currently no studies examine STAR-R as a universal screener. Examining these issues strengthens knowledge of validity and provides insight into how early we can identify students at risk of poor performance when using the STAR-R.
One of the most commonly used screening tools, CBM, has demonstrated decreased accuracy in upper elementary grades (e.g., Keller-Margulis et al., 2008). These results suggest that STAR-R may be an adequate and appropriate screening measure, particularly at fourth and fifth grades. Not only can STAR-R potentially identify students at risk of failing the state test, but also, due to the greater breadth of skills measured, may provide data that leads to more targeted intervention. A related area of particular importance is the ability to catch students who fall into the fourth-grade slump (Chall, Jacobs, & Baldwin, 1990) as reading moves from learning the code to learning for meaning. These students may have difficulties that would be better identified by using a measure such as the STAR-R, that more elaborately assesses skills unique to students who are moving from learning to read to reading to learn. Schools have the flexibility to use up to 15% of the Individuals With Disabilities Education Act (IDEA) funds to develop and implement early intervening services (Individuals With Disabilities Education Improvement Act, 2004), to assist students who are identified as at risk of future difficulties, such as those who may need support in the upper elementary grades. In addition, funds from Title I may be used to assist in the universal screening assessment that identify students for Tier 2 services and, consequently, provide supplemental assistance in reading and math to eligible at-risk students (§§ 1114 and 1115 of ESEA, 34 CFR §§ 200.25-200.29). Thus, schools have the potential to reduce the number of referrals to special education through an accurate screening measure that provides data for targeted intervention. This could ultimately reduce the caseload for special education teachers, which will allow them to focus time and effort on the students who need the services offered through the use of an individualized education program.
Results of this project may inform educators about the relative value in examining diagnostic accuracy of slope, which requires more data points and the application of additional analyses, versus setting cut scores based on a single-time point. The examination of multiple cut scores helps to inform local decision makers about how STAR-R functions differently across cut scores and analyze key variables (e.g., how many more students would be identified, and then served, across different cut scores). Because districts have limited time, personnel, and financial resources, identifying the best measures and related process for quantifying risk is critical. These results suggest that fourth- and fifth-grade state test outcomes can be accurately predicted as early as second and third grades. Educators may, therefore, be able to look across years when making educational decisions, facilitating early intervention to improve student trajectories of performance, particularly for those at risk.
Limitations
There are limitations associated with this work that must be noted. First, as is the case with many studies, the results may not be generalizable to other populations because the anticipated sample demographics are not consistent with the national average. Namely, this study includes a relatively low percentage of African American students and a relatively high percentage of Hispanic students. Although this sample does not represent the larger population of the country, it is generally reflective of statewide student demographics (TEA, 2015a), with the exception of a greater percentage of White students, and a lower percentage of African American students. Second, this study used extant data, which reduce internal validity but are more likely to increase external validity because data collection procedures in this school district reflect standard educational practices. Third, generalizability of these results is also limited by the evolving passing standards on the state test. Because of the decision to use the current passing standard, given the ambiguity of future standards, these results may not generalize to future years. This is not unlike other studies, however, where generalizability is limited by the unique characteristics of the sample and the measures studied. A final limitation, or consideration, is the practical nature of the procedures and data. We acknowledge that we were unable to control for extraneous variables. In addition, attrition occurred, particularly when examining longitudinal relationships. Although we were not able to empirically examine differences, we expect those students who remained in the district may be different from those who left (e.g., reading ability, socioeconomic status).
Future Directions
Based on the results of this study, there are some important directions for future research. Replication studies addressing the same research questions in other districts with other student populations will be necessary to further understand the use of STAR-R as a screening tool. Replicating results with students from diverse geographic regions, with different student demographics and outcome measures will further our knowledge base regarding CATs. In addition, exploration of how STAR-R and other CATs function differently for students with existing academic concerns or for whom English is not their first language will add to the literature regarding the utility of these measures across groups. Similar studies of the longitudinal relationship between CATs in math and writing with later statewide achievement test performance will also add to the literature. Finally, this study highlights diagnostic accuracy of a screener as an important consideration in educational decision making. Studies that include additional, local variables of interest such as cost, training required, base rates, or other criterion measures will provide a more comprehensive examination of the utility of CATs.
Accurately identifying students at risk of future failure to provide the appropriate, research-based intervention at the earliest point remains a critical issue that requires further research. The long-term accuracy results of this study are promising. However, because students begin taking the state test in reading in third grade, additional studies are warranted that examine earlier relationships (e.g., first-grade screening scores predicting third-grade state test performance). Additional statistical approaches to quantifying risk may also increase support for using CATs as universal screeners. For instance, future research should include posttest probability statistics as this may better account for prevalence rates in screening decisions. In addition, more sophisticated analyses of growth such as multilevel modeling may provide additional information about the nature and utility of growth. The use of CATs as universal screeners is a relatively new area of study. As such, no guidance exists regarding critical cut points, particularly for making predictions across grade. A body of research is needed to support the use of these measures in educational decision making.
One goal of this study was to inform the use of screening instruments and educational decisions in schools. Other variables often considered in this process include the resources available to provide support (e.g., personnel, intervention resources, time). For instance, a well-resourced school with an extensive intervention budget may seek to provide services to a large percentage of students, and, therefore, may use a screener or cut point offering high sensitivity (i.e., ⩾.90), but increased false positives. A school with limited intervention resources looking to serve fewer students may, therefore, use cut scores that yield fewer students (e.g., those performing below the 10th or 25th percentile), though some students at risk might be missed.
In sum, results suggest that STAR-R may be a viable option for screening with single time points yielding adequate diagnostic accuracy statistics within and across years. CATs, like STAR-R, provide unique benefits above and beyond what may be offered by traditional screening measures. They are easy to administer, often with a reduced number of questions, computer scored automatically, and measure a wide range of skills. These results are promising and have implications for research and practice, but additional studies are required to address the stated limitations and replicate findings. The need to identify students at risk remains a critical issue that requires further research.
Footnotes
Authors’ Note
This research was completed as a partial requirement for Sarah Ochs’s PhD in school psychology at the University of Houston. The project was supported by a dissertation grant in the amount of US$4,101 from the Society for the Study of School Psychology.
Declaration of Conflicting Interests
The authors declared no potential conflicts of interest with respect to the research, authorship, and/or publication of this article.
Funding
The authors received no financial support for the research, authorship, and/or publication of this article.