
Abstract
Measuring and identifying risk for reading difficulties at the kindergarten level is necessary for providing intervention as early as possible. The purpose of this study was to examine concurrent validity evidence of two kindergarten reading screeners, Acadience Reading and Texas Primary Reading Inventory (TPRI), as well as diagnostic accuracy at different performance levels on the Woodcock-Johnson IV (WJ IV) Reading Cluster and across (N = 96) emergent bilingual and monolingual English learners in kindergarten. Findings indicated moderate correlations between Acadience Reading and TPRI with the WJ IV. Diagnostic accuracy results showed screening measures were inadequate when predicting WJ IV performance above 90 SS (standard score), but results improved for almost all measures and student groups when the threshold for performance was lowered to 80 SS. Acadience Reading Below Benchmark (AR BB) offered the lowest overall accuracy for emerging bilingual (EB) students. Implications for efficient and accurate use of reading screeners in schools are discussed.
Screening students for learning difficulties has become more prevalent with legislative changes such as the Individuals with Disabilities Education Improvement Act of 2004 (IDEIA, 2004) and Every Student Succeeds Act (ESSA, 2015). Federal efforts promote early intervention through the use of Multi-Tiered Systems of Support (MTSS) to meet students’ needs. Multi-Tiered Systems of Support frameworks shift the focus of service delivery to prevention with universal screening as a core feature (Glover & DiPerna, 2007). Screening involves using technically adequate tools to assess students and identify those at risk and screening early, in kindergarten, is critical given the benefits of early intervention (e.g., Partanen & Siegel, 2014); however, measures are not always validated on or appropriate for students who are English learners (EL) or emerging bilingual (EB). The purpose of this study was to examine validity and diagnostic accuracy evidence for two screeners for reading in monolingual English speaking and EB kindergarten students.
Universal Screening
Universal screening is the process of data collection and use to determine curricular effectiveness and identify students with or at risk for poor performance and is a cost-effective, efficient way to identify students who need support in academic skills or behavior (Kettler et al., 2014). Screening in schools is not novel, as schools routinely screen students for vision and hearing. Universal screening specifically in kindergarten can facilitate early intervention, mitigating future academic difficulties (Bridges & Catts, 2011). Several factors should be considered when implementing screening (Glover & Albers, 2007), including whether the measure guides identification of students at risk, how risk is defined, whether the measure was designed for the population of students (e.g., EBs), and which skills are evaluated. Empirical examinations can guide screening tool selection while considering these various factors.
Diagnostic Accuracy of Screeners
Universal screening measures should accurately identify students at risk for poor performance and guide delivery of additional supports. Diagnostic accuracy statistics can be used to determine the threshold to make decisions (i.e., identifying individuals who are or are not at risk or do not have the condition of interest) and the utility of measures for various populations of students (Kilgus et al., 2014). This type of analysis is often used to evaluate the accuracy of medical tests but is increasingly applied to educational tools. In medical settings, the goal is to establish a test that accurately identifies the condition of interest or presence of a disease. Translated to education, the condition of interest is the presence of academic risk that predicts future failure in an academic skill area. Several diagnostic accuracy metrics are calculated by comparing student screening performance and scores on a norm-referenced, standardized achievement test or other criterion assessment (e.g., Keller-Margulis et al., 2019). If a student is at risk on a screener and fails the criterion, the screener accurately identified their status (TP; true positive). Students not identified as at risk on the screener who pass the high-stakes measure had adequate performance as characterized by the screener (TN; true negative). Conversely, incorrect classifications occur when a student is at risk on the screener but passes the criterion (FP; false positive) or is not identified as at-risk but fails the criterion (FN; false negative). These four outcomes are used to calculate diagnostic accuracy metrics for a test and probability that the result is correct. Diagnostic accuracy statistics definitions and formulas for calculating them are included in the online supplemental materials (see Table S1).
Briefly, sensitivity is the probability a screener will correctly identify students with the condition of interest (e.g., academic failure) while specificity is the probability a screener will correctly identify students without the condition. Positive predictive power (PPP) and negative predictive power (NPP) are the probability of the condition given a certain screening result. Although informative, these metrics of diagnostic accuracy cannot be generalized beyond the criterion measure used, prevalence of the condition, and specific characteristics of the sample (Vanderheyden, 2011). Increasingly, likelihood ratios and post-test probabilities are used to overcome limitations of traditional metrics of diagnostic accuracy as they are not influenced by sample base rates (Vanderheyden, 2011). Positive likelihood ratio (LR+) is the probability of a student with the condition (e.g., reading difficulties) having a screening score below the cutoff divided by the probability of a student without the condition having a screening score below the cutoff. Positive likelihood ratio greater than 1 indicates positive results will occur with a higher probability for students with the condition. Formulas for LR+ and the other related metrics are included in the supplemental table. Negative likelihood ratio is interpreted in the opposite direction of LR+, with values lower than 1 indicating decreased likelihood that a student performing above the cutoff score on the screener will have the condition. Because likelihood ratios are calculated from sensitivity and specificity, they reflect screener characteristics and are not used for decisions about presence of the condition. To address this, post-test probabilities can be used to provide odds of a condition given the screening result while considering prevalence in the target population.
Role of the Target Population in Selection of Screening Measures
Selecting one screening measure that is most accurate in determining risk status can reduce redundancy and assessment time. Although diagnostic accuracy metrics are often used to select reading screening methods, a common challenge is the condition of interest is often far from homogeneous among students (e.g., learning disabilities or attention-deficit/hyperactivity disorder [ADHD]). Risk is complex to define because it depends on several factors, such as the meaning of success, which can vary within and across settings (Gredler, 2004). Risk can also be determined by performance on a criterion test. For instance, student performance below a standard score (SS) of 90 on the Woodcock-Johnson IV Reading Cluster (i.e., the 25th percentile) might be considered at risk for reading difficulties. However, this is arbitrary and may limit generalization (Jenkins et al., 2007).
Screeners for Early Literacy
The most widely used measure for universal screening in elementary grades is Oral Reading Fluency (ORF), reading aloud with accuracy and speed, which has evidence supporting its use for screening in reading (Burns et al., 2016). There is value, however, in identifying students at risk for difficulty in reading early as early literacy interventions can mitigate difficulties (e.g., Simmons et al., 2011). Skills below the word reading level are called sublexical skills and include letter-naming, letter-sound identification, and phonological awareness and are predictive of later literacy performance (e.g., Good et al., 2001). Rates of growth in these skills demonstrate strong correlations with end of kindergarten reading performance (Clemens et al., 2018). Similarly, research on reading for EBs also highlights the importance of measuring and developing early literacy skills (e. g., Betts et al., 2008; Gersten et al., 2007; Yesil-Dagli, 2010). Several screeners examine these skills, including the Dynamic Indicators of Basic Early Literacy Skills (DIBELS Next; Good et al., 2011) and the Texas Primary Reading Inventory (TPRI; Texas Education Agency [TEA] & University of Texas System [UTS], 2013).
DIBELS Next/Acadience Reading
Acadience reading (formerly DIBELS) early literacy indicators measure foundational skills of reading including alphabetic knowledge, phonological awareness, and decoding (Good et al., 2011) through four brief (i.e., 1 min) subtests. First Sound Fluency (FSF) measures phonemic awareness, or the ability to identify beginning sounds, and Letter Naming Fluency (LNF) measures letter name identification. Phoneme Segmentation Fluency (PSF) measures students’ ability to recognize and break down words to the phoneme level, and Nonsense Word Fluency (NWF) assesses sound blending and application of phonics and alphabetic knowledge. Previous versions of AR Initial Sound Fluency (ISF) and PSF demonstrated sensitivity of 91% to 100%, and specificity of 23% to 39% with the Comprehensive Test of Phonological Processing (Hintze et al., 2003). Phoneme Segmentation Fluency and NWF also had adequate sensitivity (77%–89%) but low specificity (≤50%) for predicting statewide reading test scores (Goffreda et al., 2009).
When considering screening of EBs, using measures that are well established with EB samples is critical given the use of these measures to make intervention decisions and the evidence to suggest distinct differences in language development for EBs (e.g., Hammer et al., 2014). Current research suggests varied performance of the DIBELS/AR early literacy indicators for EBs. For example, end of kindergarten LNF, PSF, and NWF were significantly correlated with mid-year first-grade ORF (.54, .43, 58, p < .01) in a sample of EL students (Oh et al., 2007). First-grade spring NWF scores for ELs had adequate overall diagnostic accuracy with hit rates of 65% to 75% (Vanderwood et al., 2008). However, NWF had higher specificity (79%–89%) than sensitivity (43%–55%) for this sample of EL students, suggesting less accuracy in identifying those students at risk with early reading skills. More recent studies reveal differences in diagnostic accuracy performance for EBs. Scheffel and colleagues (2016) found that first-grade NWF had lower specificity (.82) for EB students than monolingual English students (.93), and higher sensitivity for EBs (.74) than non-EBs (.43), indicating more non-EL students would be identified as at-risk than EB students. Cutoff scores for these early literacy measures were examined for EB and monolingual English students in kindergarten through third grade, with results revealing cutoff score differences ranging from a 10-point lower cutoff score for EBs to a 7-point higher cutoff score for EBs (Cummings et al., 2021). The range of cutoff scores varied more in kindergarten than later grades, and the change in cutoff score for kindergarten LNF led to a sensitivity change from .81 to .89 and specificity change from .65 to .53 for EBs (Cummings et al., 2021). Based on other research, when using the Well Below Benchmark cutoff score from AR, the kindergarten end-of-year Reading Composite Score yielded adequate accuracy for predicting third-grade reading performance on a high-stakes state assessment for both EBs (.80) and monolingual English students (.78) (Landry et al., 2021). Although AR early literacy indicators may be valuable for screening EB students, results indicate different technical adequacy for EB and monolingual English students when screening in English. More validity evidence is needed for AR and determining how AR diagnostic accuracy metrics compare to other available screeners, such as the TPRI when used with students who are EBs.
Texas Primary Reading Inventory
The TPRI is an individually administered screening measure of reading for students in kindergarten to Grade 3 given at the beginning and end of the school year and includes an early literacy screener and inventory. The early literacy screener is teacher-administered and used to identify students not at risk in reading. The inventory is used to further evaluate students who perform poorly. The TPRI is used to assess five critical components of reading development (Gamse et al., 2008) including graphophonemic knowledge (letter recognition and sound-symbol relationships) and phonemic awareness (manipulation of sounds in words), reading accuracy, and reading fluency and comprehension. Screening performance is described as Still Developing or Developed. The cut point was designed to create the lowest number of FPs while keeping FNs below 10% (Children’s Learning Institute & Texas Institute for Measurement, Evaluation, and Statistics [CLI & TIMES], 2014).
The study by Nelson (2009) is the only study to examine TPRI and DIBELS diagnostic accuracy in a sample of 180 kindergarteners using a within-year longitudinal design. Students with an SS below 90 on the WJ III ACH LW subtest were deemed at risk for reading difficulties. Texas Primary Reading Inventory subtests demonstrated sensitivity of .78, indicating identification of 78% of students with reading difficulty on the WJ III ACH LW. The TPRI GK or PA measures offered sensitivity of .89, thus identifying nearly 90% of students at risk for poor end-of-year performance on the WJ III ACH LW. These findings indicate the variation when using different screeners consistent with the design of the TPRI as a tool to determine those students who demonstrate adequate reading performance. Additional research is needed, however, given the somewhat arbitrary selection of performance on the criterion measure as well as the homogeneity of the sample studied.
Current Study
Acadience reading and TPRI are screening tools for identifying kindergarteners who need reading support; however, using both measures is inefficient, and there is limited technical adequacy information on use of these measures with EBs. This project extends prior research by using the most recent versions of measures, including post-test probability analysis for a generalizable picture of diagnostic accuracy, examining the use of different criterion measure thresholds, and disaggregating students based on EB status. The following research questions were examined:
Method
Participants
Ninety-six kindergarten students were recruited from an early childhood campus in the southeastern United States. The sample was evenly divided between male and female students and 43% of students were EBs. Additional demographic information is provided in Table 1.
Characteristics of the Kindergarten Sample.
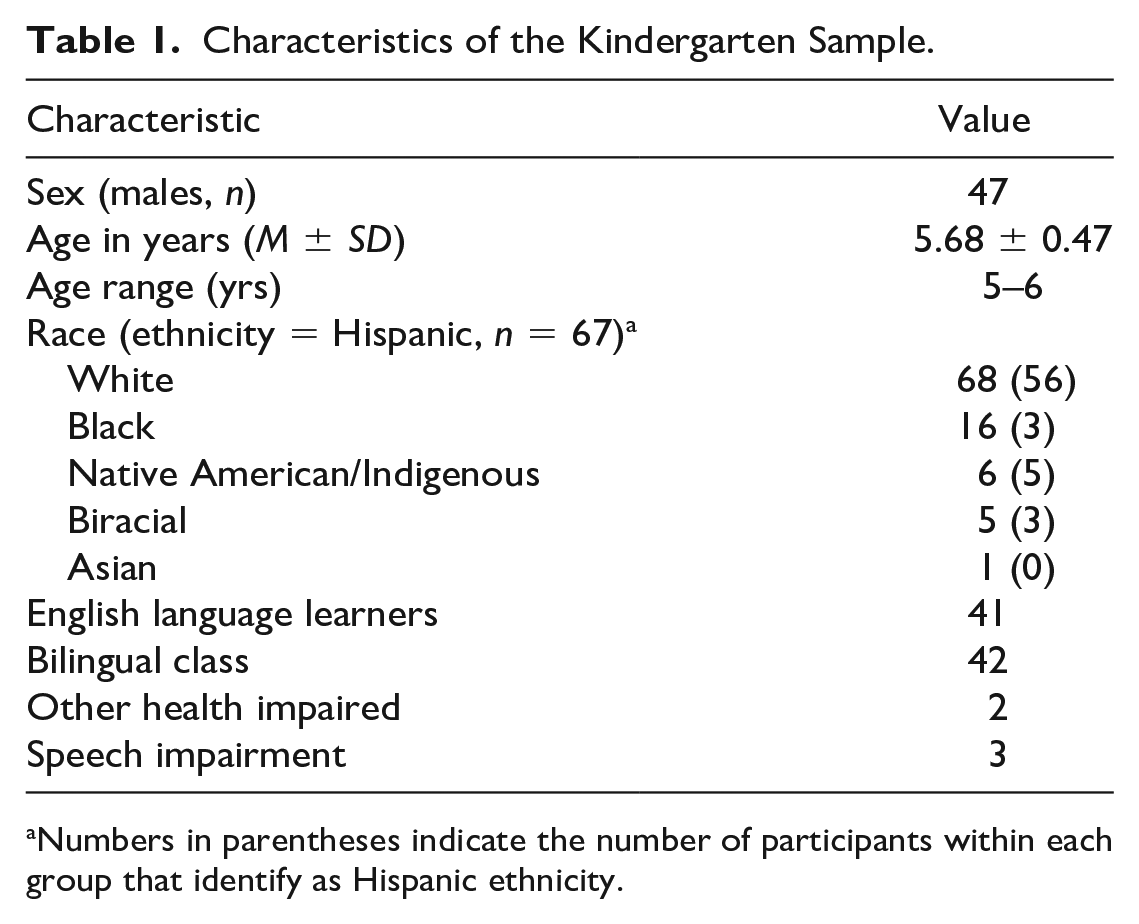
Numbers in parentheses indicate the number of participants within each group that identify as Hispanic ethnicity.
Measures
End of the Year AR
The AR is a nationally normed screening tool for kindergarten through sixth grade (Gray et al., 2018). The kindergarten EOY version of the screening measure used for this study includes three subtests, LNF, PSF, and NWF, each measuring fluency skills by allowing 1 min to complete the task. Although the NWF measure includes two scores, Correct Letter Sounds (CLS) and Whole Words Read (WWR), we only included CLS, which is consistent with kindergarten reading screening recommendations. The sum of the three remaining scores can be calculated to obtain the Reading Composite Score (RCS). Cutoff scores provide student performance on four levels: Above Benchmark (RCS ≥159), At Benchmark (RCS ≥119), Below Benchmark (RCS ≥89), and Well Below Benchmark (RCS <89). Students performing at or above benchmark are likely not at risk for reading difficulties while scores below or well below benchmark indicate increased risk with those well below benchmark most likely to need additional support (Good et al., 2011). Empirical evidence demonstrates excellent alternate form reliability of the scores of the AR subtests (α = .94–.97) (Dewey et al., 2015).
End of the Year Texas Primary Reading Inventory
The kindergarten TPRI (TEA & UTS, 2004–2006) early literacy screener is used to assess general early literacy skills, such as graphophonemic knowledge and phonemic awareness. The measure includes two screeners (i.e., subtests), one on Letter Sounds (TPRI-LS) and the other on Blending Onset-Rimes and Phonemes (TPRI-BORP). Scores on the TPRI-LS range from 0 to 10, while scores on the TPRI BORP range from 0 to 8. Students who obtain a score equal to or greater than 8 and 6, respectively, on the screening tasks are considered Developed and not at risk in this area and those scoring less than 8 on TPRI-LS or less than 6 on TPRI-BORP task are Still Developing indicating risk and a possible need for intervention support. Reliability of the scores of the kindergarten TPRI ranges between good and excellent (α = .76–.93) (CLI & TIMES, 2014). Differential item functioning (DIF) analysis of all TPRI forms indicate no systematic bias according to gender or race/ethnicity (CLI & TIMES, 2014). Predictive validity with the WJ Broad Reading Cluster indicates kindergarten End of the Year Texas Primary Reading Inventory (EOY TPRI) scores can be used to identify students at risk for poor reading outcomes (false-negative rate = 9%, sensitivity = 91%). Although the false-positive rate (39%) and specificity (61%) indicate over-identification of risk, this is preferred compared to under identifying students who need support (CLI & TIMES, 2014).
Woodcock-Johnson IV Achievements Reading Cluster
The Woodcock-Johnson IV Achievements Reading Cluster (WJ IV ACH RC; Schrank et al., 2014) was the reading criterion measure. The Reading Cluster includes Letter-Word Identification and Passage Comprehension subtests. Letter-Word Identification requires students to read aloud letters and individual words presented in print. Passage Comprehension involves the use of syntactic and semantic clues to complete a phrase or sentence. Median reliability for the Reading Cluster for school-age students was high (α = .96), and concurrent validity evidence with the Wechsler Individual Achievement Test–Third Edition (WIAT-III) Total Reading Cluster was excellent (r = .93) (Schrank et al., 2014).
Procedure
The study was approved by the Institutional Review Board of the university and the participating school. Parental informed consent and student assent were obtained. Data were collected in a quiet hallway of the school during two sessions in spring 2015. Graduate students from a graduate program in school psychology were trained (90% accuracy criterion) to administer the AR and WJ IV ACH. Acadience reading and two subtests of the WJ IV ACH Reading Cluster were individually administered in a 3-week period. Simultaneously, TPRI data were collected by classroom teachers as part of regular screening procedures. Scores on the AR and TPRI were dichotomized using levels in the technical manuals to indicate risk and not at-risk performance.
Data Analysis
First, Spearman’s correlation coefficients were calculated to examine the relationship between screening performance (AR and TPRI) and classification of risk (at risk/not at risk) on the WJ IV Reading Cluster. Second, diagnostic accuracy metrics were used to examine whether the screeners identified students with and without reading difficulty. Like Nelson (2009), we used a cutoff score of 90 (i.e., 25th percentile) for identifying students with reading difficulty. Third, we repeated analyses examining additional categories of at-risk students (WJ IV Reading Cluster SS of 80 and 70) because these thresholds indicate low and very low reading performance levels, respectively (Wendling & Schrank, 2015). Diagnostic accuracy measures were interpreted based on criteria in Kilgus et al. (2018), suggesting values greater than .80 for sensitivity and .70 for specificity as adequate. Positive likelihood ratio values greater than 10 are large while 5 to 10 is moderate. By contrast, LR− values less than .1 is large, while between .1 and .2 is moderate (Kilgus et al., 2018).
Results
Table 2 provides descriptive statistics for all measures. Thirty-eight percent of students (n = 37) scored above the below benchmark level on EOY AR, while 69% (n = 66) scored above the well below benchmark level. Mean TPRI total score was 15.71 (SD = 3.95), corresponding to Developed on both tasks. On the TPRI, 78.1% of students (n = 75) scored at the Developed level. The WJ IV ACH Reading Cluster SS mean was in the average range (M = 97.47, SD = 15.34).
Descriptive Statistics of Screener Scores.
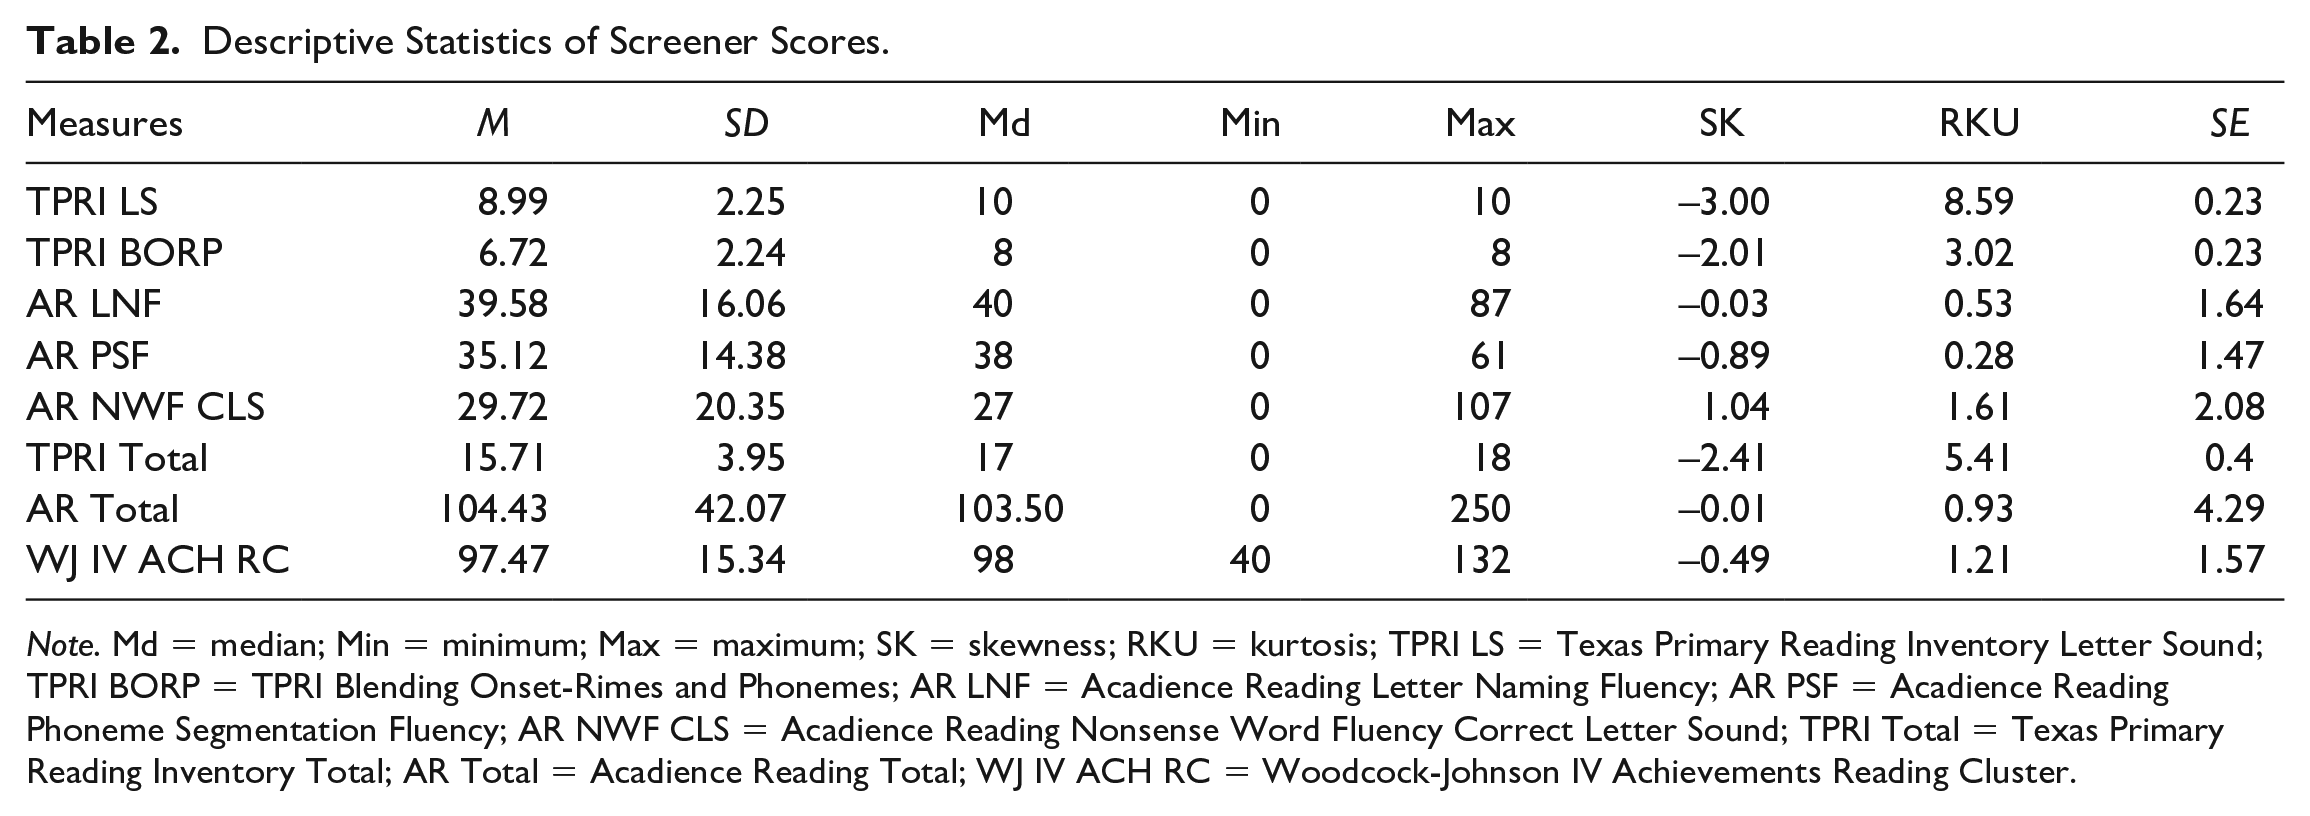
Note. Md = median; Min = minimum; Max = maximum; SK = skewness; RKU = kurtosis; TPRI LS = Texas Primary Reading Inventory Letter Sound; TPRI BORP = TPRI Blending Onset-Rimes and Phonemes; AR LNF = Acadience Reading Letter Naming Fluency; AR PSF = Acadience Reading Phoneme Segmentation Fluency; AR NWF CLS = Acadience Reading Nonsense Word Fluency Correct Letter Sound; TPRI Total = Texas Primary Reading Inventory Total; AR Total = Acadience Reading Total; WJ IV ACH RC = Woodcock-Johnson IV Achievements Reading Cluster.
Spearman Correlation Coefficients Between Subtest and Test Scores.

Note. All correlation coefficients are significant at .05 level. TPRI LS = Texas Primary Reading Inventory Letter Sound; TPRI BORP = TPRI Blending Onset-Rimes and Phonemes; AR LNF = Acadience Reading Letter Naming Fluency; AR PSF = Acadience Reading Phoneme Segmentation Fluency; AR NWF CLS = Acadience Reading Nonsense Word Fluency Correct Letter Sound; TPRI Total = Texas Primary Reading Inventory Total; AR Total = Acadience Reading Total; WJ IV ACH RC = Woodcock-Johnson IV Achievements Reading Cluster.
Concurrent Validity
Spearman’s correlations are shown in supplemental Tables S3. Correlations of TPRI screeners with WJ IV ACH Reading Cluster were small to moderate (ρs from .33 to .41), whereas correlations between AR and WJ IV ACH were moderate (ρs from .41 to .60). Correlations of screener composite scores with WJ IV were moderate (ρ = .40 for TPRI, ρ = .62 for AR).
Diagnostic Accuracy
Diagnostic measures were calculated to examine accuracy of the screeners for identifying risk across three levels of performance on the WJ IV ACH Reading Cluster indicating increasing reading difficulties. We report how many true and false cases the three screeners correctly identified (see Table 4) along with their levels of sensitivity, specificity, predictive power, likelihood ratios, and post-test probabilities for the entire sample (see Table 5) and disaggregated by EL status.
Classification of At-Risk Students Using the WJ IV.
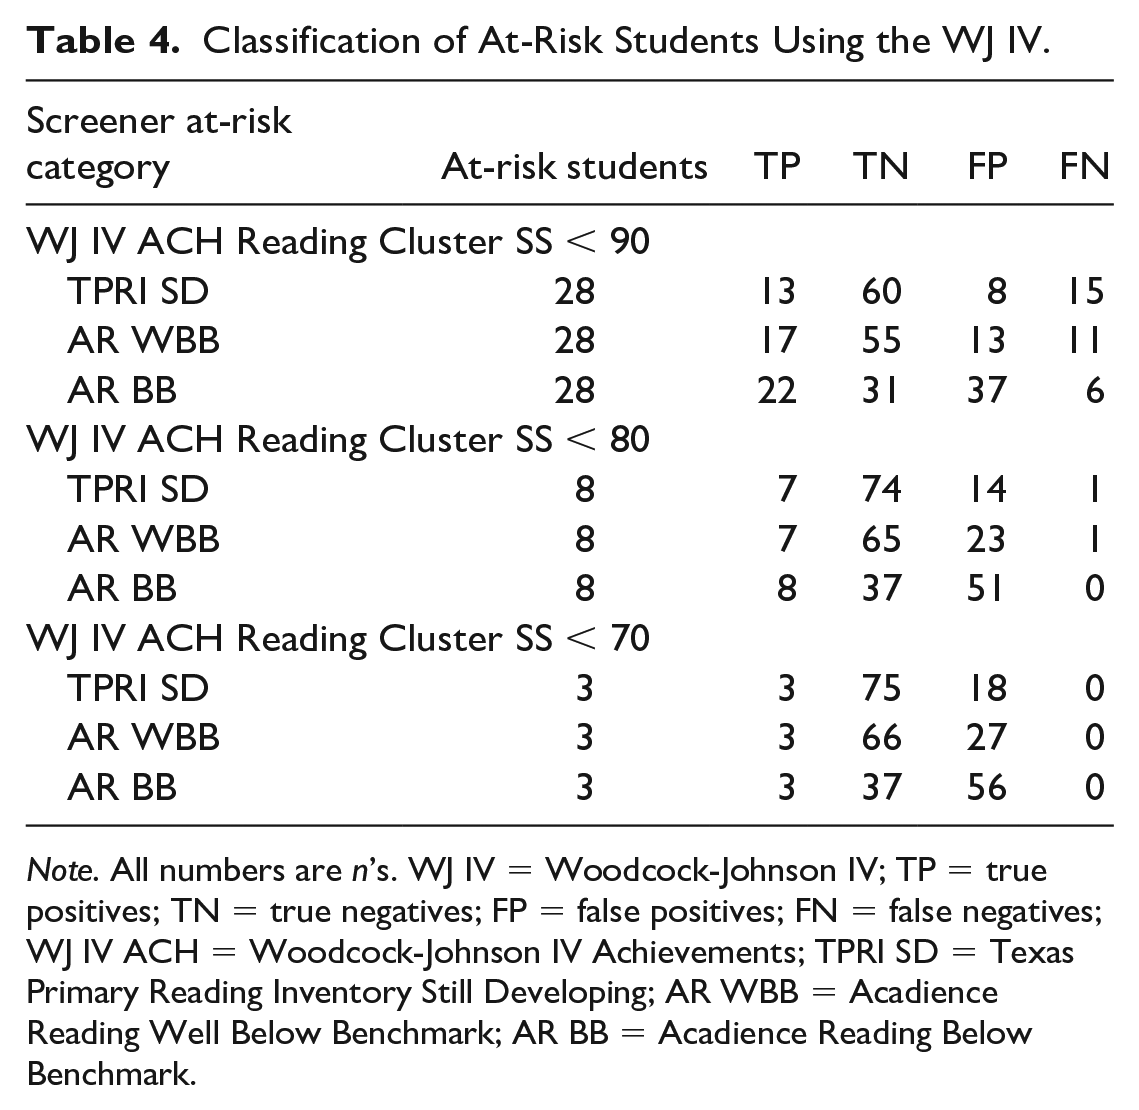
Note. All numbers are n’s. WJ IV = Woodcock-Johnson IV; TP = true positives; TN = true negatives; FP = false positives; FN = false negatives; WJ IV ACH = Woodcock-Johnson IV Achievements; TPRI SD = Texas Primary Reading Inventory Still Developing; AR WBB = Acadience Reading Well Below Benchmark; AR BB = Acadience Reading Below Benchmark.
Diagnostic Accuracy Estimates for Screeners Across Categories of At-Risk Students.

Note. At the cutoff score of 70 on the WJ IV Reading Cluster, we assume a prevalence of 2%. At the cutoff score of 80 on the WJ IV Reading Cluster, we assume a prevalence of 9%. At the cutoff score of 90 on the WJ IV Reading Cluster, we assume a prevalence of 25%. PPP = positive predictive power; NPP = negative predictive power; LR+ = positive likelihood ratio; LR− = negative likelihood ratio; +PP = post-test positive probability; −PP = post-test negative probability; TPRI SD = Texas Primary Reading Inventory Still Developing; WBB = Well Below Benchmark; BB = Below Benchmark; WJ IV = Woodcock-Johnson IV.
WJ IV cutoff at 90 SS
We examined diagnostic accuracy using a threshold of 90 SS, corresponding to the 25th percentile, a typical cut point for identification of weak readers (see Tables 5 and 6). When identifying students below SS of 90, Acadience Reading Below Benchmark (AR BB) yielded the highest rate of TPs (n = 22) and lowest number of FNs (n = 6). Acadience Reading Well Below Benchmark improved cases correctly identified as true negative (n = 55) and FP (n = 13). Texas Primary Reading Inventory identified fewer FP (n = 8) and outperformed the thresholds associated with the AR for identifying TNs (n = 60). Diagnostic accuracy statistics showed that AR BB had lower overall accuracy (.55) than AR WBB (.75) and TPRI (.76). Acadience Reading Below Benchmark yielded borderline acceptable sensitivity levels (.79) but insufficient specificity (.46), while AR WBB showed the opposite pattern (sensitivity = .61 and specificity = .81). Texas Primary Reading Inventory showed poor sensitivity (.46) with adequate specificity (>.80). While the three screeners had low PPP, NPP coefficients were at or above .80. Furthermore, AR WBB outperformed other screeners with small positive likelihood ratio (LR+ = 3.18) and small negative likelihood ratio (LR− = 0.49). According to McGee’s (2017) criteria, AR BB had negligible positive likelihood ratio (LR+ = 1.44) and small negative likelihood ratio (LR− = 0.47), while TPRI had the opposite, with moderate positive likelihood (LR+ = 3.95) and negligible negative likelihood (LR− = 0.61). Using pre-test probability of 25%, post-test probabilities replicated likelihood ratio results, with only AR WBB showing small classification improvements. In contrast, AR BB showed a small change in probability of correct classification for students not at risk given a negative screening, while TPRI offered a small change for correct classification of students at risk given a positive result.
Diagnostic Accuracy Estimates for Screeners by English Learner Status.
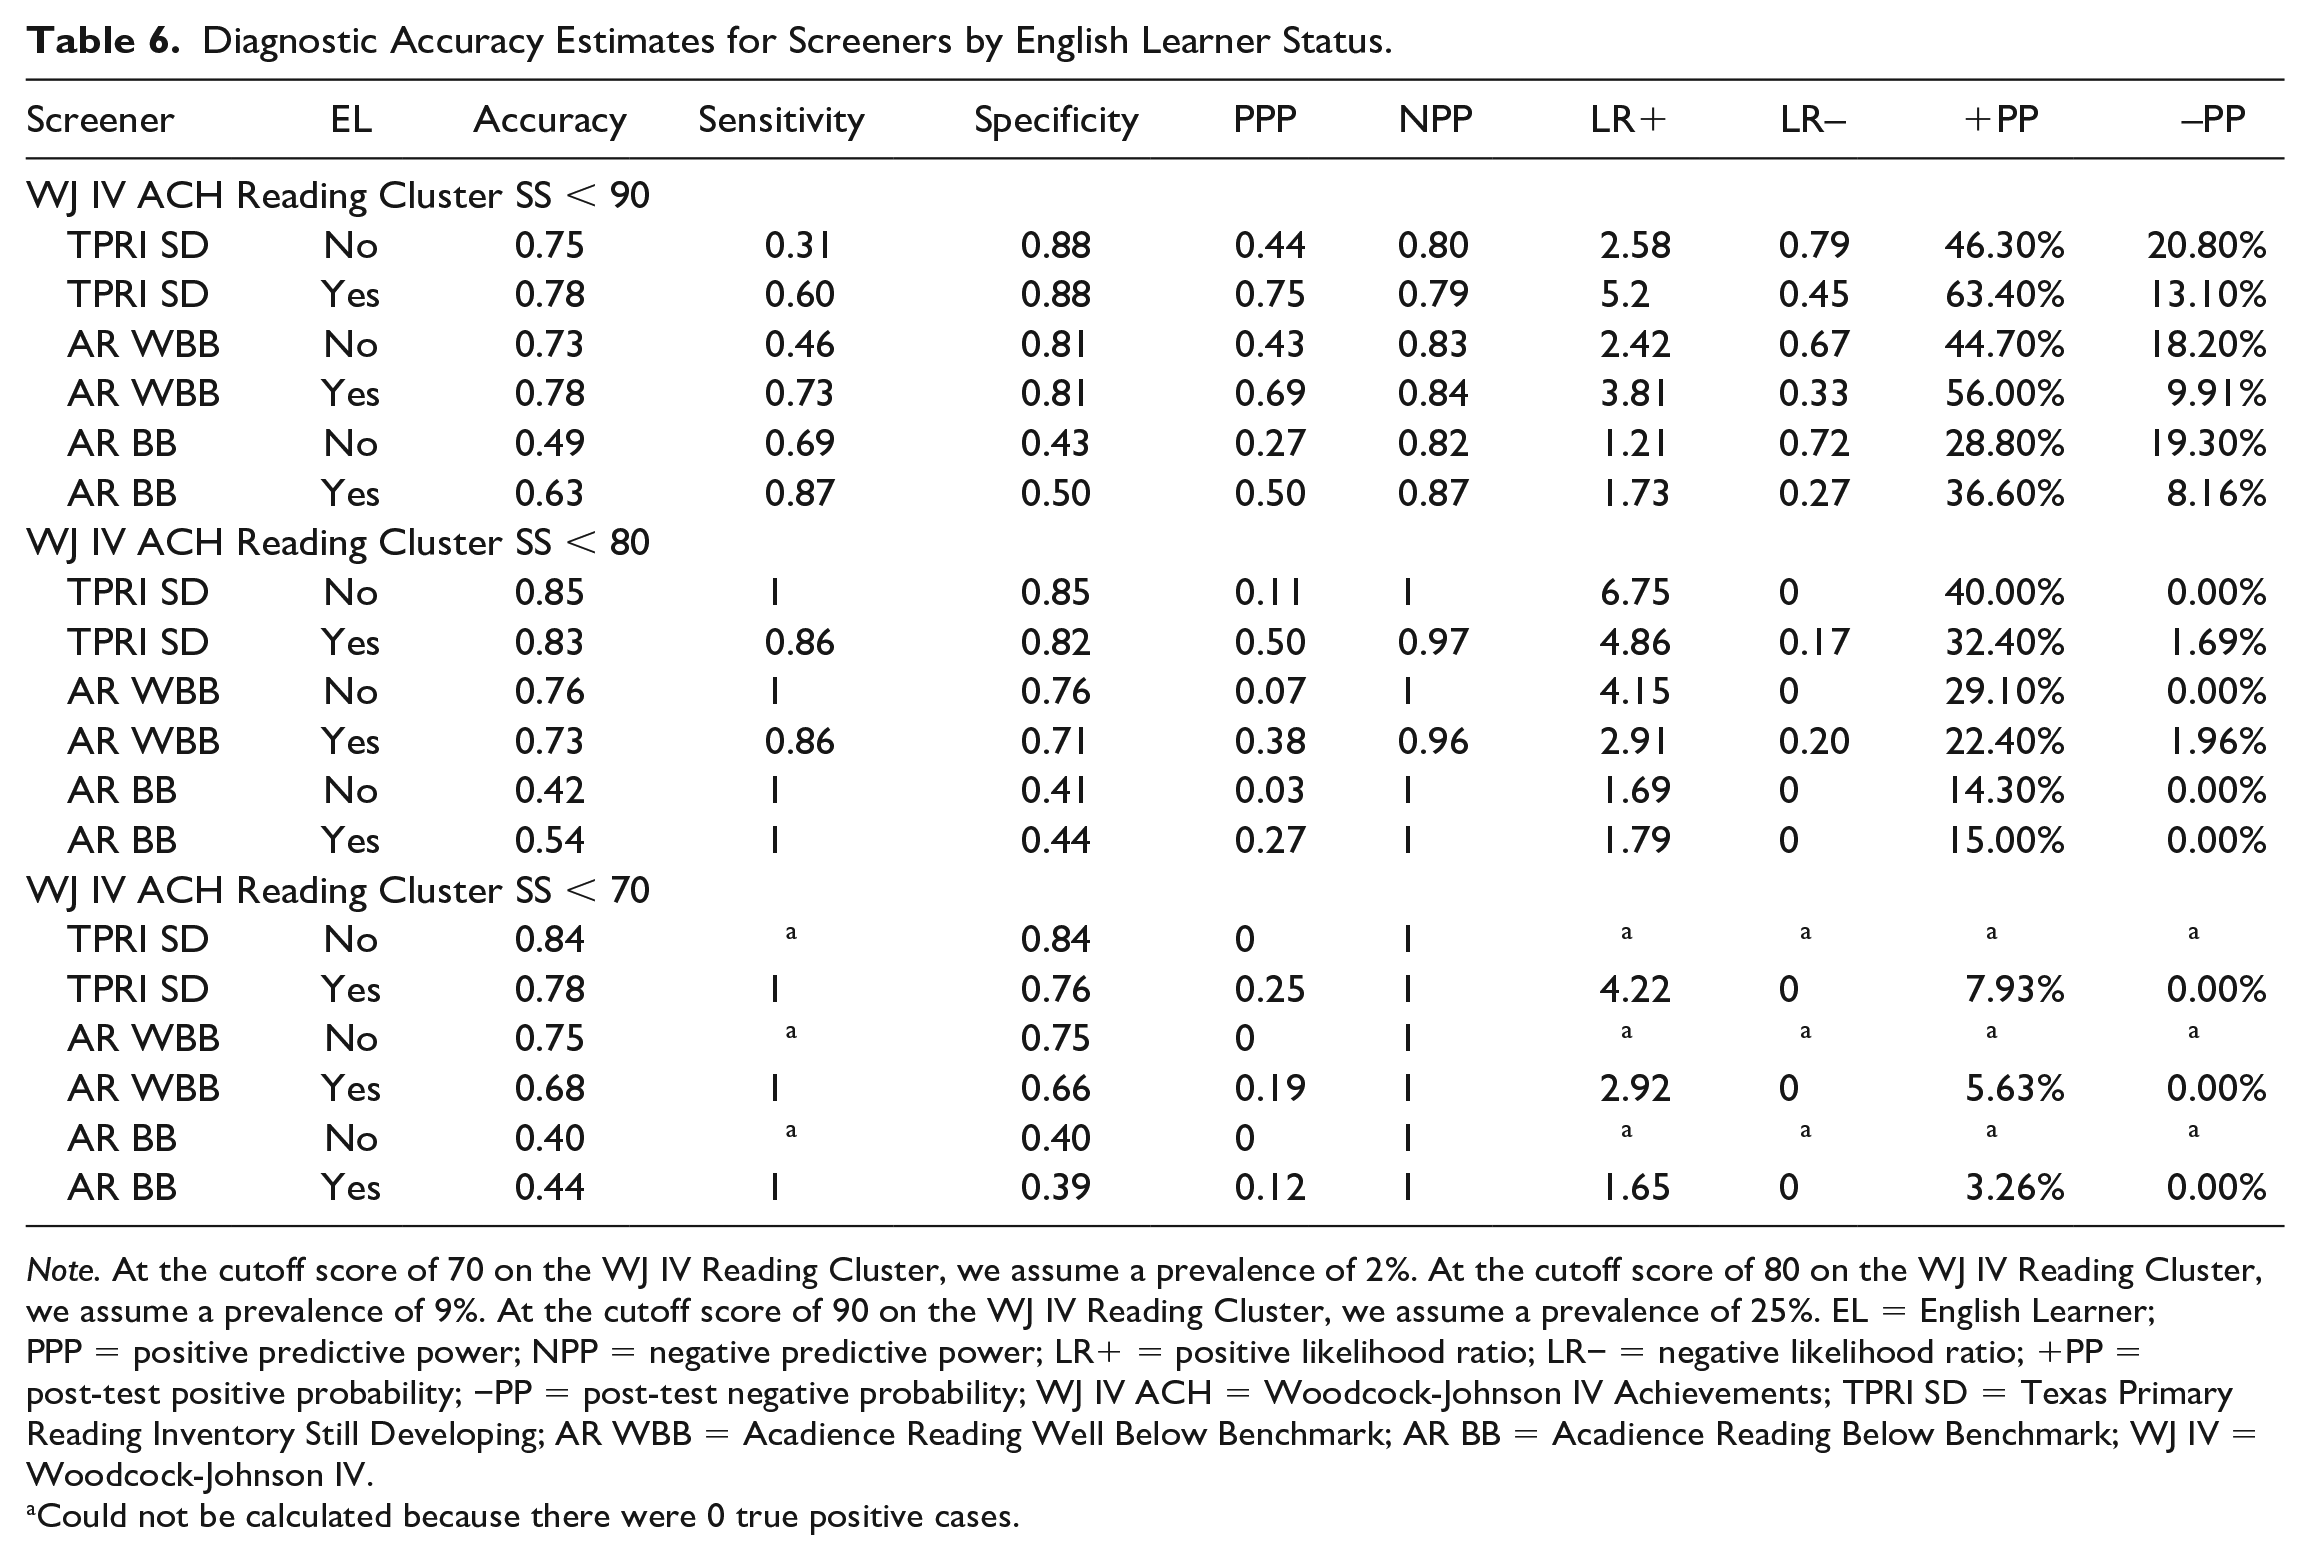
Note. At the cutoff score of 70 on the WJ IV Reading Cluster, we assume a prevalence of 2%. At the cutoff score of 80 on the WJ IV Reading Cluster, we assume a prevalence of 9%. At the cutoff score of 90 on the WJ IV Reading Cluster, we assume a prevalence of 25%. EL = English Learner; PPP = positive predictive power; NPP = negative predictive power; LR+ = positive likelihood ratio; LR− = negative likelihood ratio; +PP = post-test positive probability; −PP = post-test negative probability; WJ IV ACH = Woodcock-Johnson IV Achievements; TPRI SD = Texas Primary Reading Inventory Still Developing; AR WBB = Acadience Reading Well Below Benchmark; AR BB = Acadience Reading Below Benchmark; WJ IV = Woodcock-Johnson IV.
Could not be calculated because there were 0 true positive cases.
WJ IV cutoff at 80 SS
When using the SS 80 WJ ACH threshold, the three methods identified similar number of TPs (n = 7–8) and FNs (n = 0–1). Acadience Reading Below Benchmark yielded the lowest TNs (n = 37) and highest FPs (n = 51), whereas the TPRI the highest number of TN (n = 74) and lowest FPs (n = 14). Diagnostic accuracy statistics suggest TPRI demonstrated better overall accuracy (.84) compared with AR BB (.55) and WBB (.75). All measures showed high sensitivity (TPRI = .88, AR WBB = .88, AR BB = 1.00), while TPRI was the only screener with adequate specificity (.84). Acadience Reading Below Benchmark and WBB and TPRI had similar patterns of predictive power with PPP consistently low and NPP approaching 1. Likelihood ratio results indicated TPRI offered moderate positive (LR+ = 5.50) and negative likelihood ratio (LR− = 0.15); in other words, TPRI was the only screener to moderately improve identification of at-risk students given positive and negative screening results. Acadience Reading Below Benchmark and WBB did not perform equally well with the former demonstrating negligible positive likelihood ratio (LR+ = 1.73) and negative likelihood ratio approaching 0 and the latter showing small positive likelihood ratio (LR+ = 3.35) and moderate negative likelihood ratio (LR− = 0.17). Using pre-test probability of 9%, TPRI added predictive values for both students who receive positive (+PP = 35.20%) and negative results (−PP = 1.45%). Acadience Reading Well Below Benchmark added less predictive value for positive results (+PP = 24.90%) but similar value for negative results (−PP = 1.65%), whereas AR BB did not perform well with students receiving a positive result (+PP = 14.60%) and very well (−PP = 0%) with students receiving negative results.
WJ IV cutoff at 70 SS
When reading difficulties were defined by WJ IV ACH RC performance below SS 70, there were no FNs, indicating no students with a reading difficulty were missed. There were, however, higher FPs, compared with other WJ cutoff scores indicating more students identified as at-risk performed above the WJ IV threshold. Comparison of screeners also indicated the same number of TPs. Acadience Reading Below Benchmark resulted in the highest number of FPs (n = 56) and TPRI the lowest (n = 18). Texas Primary Reading Inventory offered the highest level of accuracy (.81), and both TPRI and AR had sensitivity levels of 1.00. Texas Primary Reading Inventory was the only screener with adequate specificity. Similar to results at SS 80, PPP was poor while NPP was perfect. Texas Primary Reading Inventory had moderate to large likelihood ratios (LR+ = 5.17, LR− = 0). Acadience Reading Below Benchmark and WBB had negligible (LR+ = 1.66) and small positive likelihood ratios (LR+ = 3.44), respectively, and large negative likelihood ratios (LR− = 0). Using a pre-test probability of 2%, a positive TPRI result increases probability of reading difficulties to 9.54%, AR WBB to 6.57%, and BB to 3.28%. All screeners had a probability near 0 for students having reading difficulties given a negative result.
Comparing EBs and monolingual English-speaking students
Table 6 displays diagnostic accuracy results for the disaggregated sample, separating findings for students identified as EBs. Results indicate similar patterns across the measures of interest but different diagnostic accuracy results. Classification results revealed similar patterns of FPs and TP and TNs across the WJ IV ACH thresholds examined. Diagnostic accuracy findings indicated overall accuracy was generally higher for TPRI regardless of WJ ACH threshold while the AR BB offered the lowest accuracy; however, it was more accurate for EB than monolingual English students. Sensitivity remained highest for all measures when examining the SS 70 threshold. Adequate sensitivity was maintained along with adequate specificity only at the WJ IV ACH SS 80 threshold and only for TPRI and AR WBB measures, not AR BB. Positive predictive power and NPP results were reflective of the aggregate sample where PPP increased as WJ ACH threshold increased while NPP was adequate. The positive and negative likelihood ratios for both groups of students were similar to the aggregate sample for the SS 70 and SS 80 thresholds; however, for TPRI SD and AR WBB, positive likelihood was higher for monolingual English students. At the SS 90, disaggregating students revealed positive likelihood was highest for EB students when using TPRI while the best negative likelihood ratio was small (0.33) and observed for EBs using the AR BB. Posttest positive and negative probabilities reflect likelihood of the condition when a test is positive or negative given condition prevalence. Disaggregate results again reflect patterns for the whole sample where use of screeners offer minimal increased likelihood of the condition at SS 70, but the likelihood increases across thresholds.
Discussion
This study was designed to examine concurrent validity evidence for two commonly used early literacy screening measures, AR and TPRI, and compare the degree to which they identify students at risk for reading difficulties in students who are EBs and those who are monolingual English speakers. Existing literature suggests screening measures of early literacy may demonstrate different functioning for children with different language backgrounds (Cummings et al., 2021), prompting a need for study of technical adequacy across different samples. Similar to the study by Nelson (2009), we examined diagnostic accuracy using a threshold of SS 90 given it reflects the 25th percentile; however, we also examined other thresholds for performance and used the TPRI screeners as a single unit. Findings extend existing literature in three important ways. First, moderate correlations between AR and TPRI and moderate correlation coefficients for AR and TPRI and WJ IV ACH RC provide validity evidence for use with kindergarteners similar to the study by Nelson (2009). Acadience reading showed a higher correlation with WJ IV ACH RC than TPRI and considering the skills on these measures provides some insight into these patterns. For example, the AR tasks are rate-based or fluency measures, while the TPRI is a criterion-oriented tool that does not have a fluency component. The pattern of correlations is aligned with the known value of fluency as an indicator of overall reading, as shown by AR Total correlation with WJ IV ACH RC scores.
A second important finding is that none of the screeners had adequate diagnostic accuracy metrics on all parameters when using SS 90 on the WJ ACH as the threshold. Acadience Reading Below Benchmark had acceptable sensitivity but inadequate specificity, whereas both AR WBB and TPRI demonstrated the opposite pattern. Moreover, all screeners resulted in an unacceptable amount of FN cases. False negatives are arguably the most problematic screening outcome because these students are not identified as having reading difficulties and might therefore not receive instructional supports. When the sample was analyzed in aggregate (i.e., EB and monolingual English students together), diagnostic accuracy statistics results showed that no methods offered a balance between sensitivity and specificity. Likelihood ratio results indicated the TPRI had small LR+ and AR WBB had small LR+ and LR−. Overall, these results were similar to Nelson (2009) when examining the combined scores from the two subtests which offered adequate levels of both sensitivity and specificity when examining a SS of 90 on the WJ IV ACH RC. There were, however, differences compared to Nelson (2009) including examination of all subtests combined, and use of data collected mid-year, contrary to typical TPRI procedures.
When the current sample was disaggregated to examine EB and monolingual English students separately, the overall patterns of diagnostic accuracy were similar where the SS of 80 offered the optimized levels of both sensitivity and specificity for both groups of students with the exception of the AR BB threshold. Additional instances where both sensitivity and specificity were adequate included the SS 70 threshold for EB students with TPRI and the SS 90 threshold for EB students with the AR WBB screener. Although we did not examine different screener cut scores or long-term relationships between screening measures and outcomes (e.g., Cummings et al., 2021; Landry et al., 2021), our study did still indicate some differences in diagnostic accuracy findings for EB and monolingual English students. Specifically, the AR WBB cut point offers the lowest overall accuracy as an indicator of reading risk compared with the other measures used, although sensitivity was still adequate. Technical adequacy differences across students with varied language backgrounds and literacy development are expected given the known differences in skill development for students who are EB (Hammer et al., 2014).
Third, two additional WJ IV ACH Reading Cluster performance levels were considered for identification of students at risk in reading. Although an SS of 90 is a common threshold for determining risk, the screeners may demonstrate varying accuracy for lower levels of reading performance. In fact, the balance between sensitivity and specificity of TPRI and AR WBB improved using a WJ IV threshold of 80, resulting in fewer students identified as at-risk for poor performance, a pattern that held when students were disaggregated by language status. There were no FN cases for AR BB and one for AR WBB and TPRI for EB students; however, there were numerous FPs, indicating students would be identified as at risk and provided with intervention, although they are likely to perform adequately. Likelihood ratio results also improved slightly, reaching adequate LR+ levels for TPRI and adequate LR− levels for AR BB. Lowering WJ IV performance thresholds to 70 offered similar diagnostic accuracy but identified only three students at risk for reading difficulties. Unfortunately, even the best performing metrics included FNs, suggesting a need for frequent measurement or the use of multiple measures such as in gated screening. Likelihood ratio results indicated TPRI consistently outperformed AR. In addition, for positive post-test probability, TPRI outperforms AR in determining whether a student has reading difficulty given screening findings.
Practical Implications
These results suggest three practical implications for universal screening in kindergarten for EB and monolingual English students. First, educators should consider the technical adequacy of measures and determine alignment with intended use generally, and more specifically for their student population. For example, using TPRI to identify students performing below SS of 80 offers adequate sensitivity for identifying those at risk, but sensitivity drops to unacceptable levels for SS below 90, a pattern that holds when students are disaggregated by language status. Second, the findings point to factors that should be considered when determining screening measure selection. The availability of resources is a key consideration. Although a measure may identify students potentially at risk for poor reading performance, a school may have finite resources to meet the needs of students including both teacher time and money for instructional interventions or materials. These are important considerations given use of different measures can lead to different numbers of students identified as at-risk. In this study, AR routinely identified more students at risk for poor reading performance compared with TPRI. Efforts should be made to implement screening tools that allow for the most accurate identification possible. Most importantly, screening occurs within a context and consideration of student characteristics, instructional context, and resources available is needed for decisions about screener selection and decisions about screening data. For example, moving the threshold for criterion performance from 90 to 80 SS would identify students likely to experience reading difficulties, while a 70 SS would identify students with more severe difficulties. Lowering the threshold too far, however, could result in very few students for intervention. Careful consideration should also be given to alignment of the measures with the instructional context. This is particularly critical for students who are EBs. Students in this study received instruction emphasizing English, thus English screeners were used. Results of this study cannot and should not be decontextualized from the individual language development or pattern of language instruction provided to students in the sample. Practitioners should consider these variables when selecting tools and the language of assessment for EB students.
Third, differences in skills and administration of the screeners must be considered. Acadience reading is fluency-based, capturing phonemic segmentation and nonsense word reading while TPRI is mastery-oriented and examines letter sound skills and blending onset-rimes. When students with different language backgrounds are considered, language development and language of instruction must be the context for interpretation. As in previous studies, there is potential for over or under identification of EB students (Newell et al., 2020). Although these results were not markedly different for subgroups, given the potential for language of instruction and language proficiency affecting student performance, screening findings should be interpreted cautiously.
Limitations and Future Directions
These findings must be considered in light of several limitations. First, AR data were gathered at one time point, but future studies should examine technical adequacy of screening across the year given this would lead to early intervention. Another limitation is the sample and instructional context. Many students in the sample were EB students in bilingual classrooms receiving instruction in both English and Spanish, with emphasis on English. Therefore, the AR and TPRI were administered in English to align with this model, where the goal is to accelerate English skills. The instructional arrangement affects generalizability of results to other EBs in other programs. In addition, we did not have access to direct measures of students’ language proficiency, further limiting generalization. Finally, thresholds for acceptable diagnostic accuracy vary. Some approaches balance sensitivity and specificity (both >.70; for example, Keller-Margulis et al., 2008) while others recommend higher thresholds (Kilgus et al., 2014). Thresholds directly influence decisions about screener performance and should be systematically considered.
Conclusion
Accurate and efficient identification of students at risk for poor literacy performance is necessary to avoid delays in intervention provision. Although screening for reading has received considerable attention (Kilgus et al., 2014), there is less focus on sublexical skills and screening that disaggregates outcomes for EB and monolingual English students. This study provides validity evidence of AR and TPRI with WJ IV ACH RC, while suggesting they did not perform well for identifying students at risk using traditional criteria (i.e., 25th percentile), a finding that persisted when disaggregating EB and monolingual English students. Further study of diagnostic accuracy for early literacy screeners and ways to maximize efficiency and incorporate language proficiency as key variables is needed.
Supplemental Material
sj-docx-1-aei-10.1177_15345084221133559 – Supplemental material for A Comparison of Reading Screeners in Kindergarten: The Texas Primary Reading Inventory and Acadience Reading With English Learners and Monolingual English Speakers
Supplemental material, sj-docx-1-aei-10.1177_15345084221133559 for A Comparison of Reading Screeners in Kindergarten: The Texas Primary Reading Inventory and Acadience Reading With English Learners and Monolingual English Speakers by Milena A. Keller-Margulis, Michael Matta, Lindsey Landry Pierce, Katherine Zopatti, Erin K. Reid and G. Thomas Schanding in Assessment for Effective Intervention
Footnotes
Declaration of Conflicting Interests
The author(s) declared no potential conflicts of interest with respect to the research, authorship, and/or publication of this article.
Funding
The author(s) received no financial support for the research, authorship, and/or publication of this article.
Supplementary Material
Supplementary material for this article is available on the Assessment for Effective Intervention website with the online version of the article.
References
Supplementary Material
Please find the following supplemental material available below.
For Open Access articles published under a Creative Commons License, all supplemental material carries the same license as the article it is associated with.
For non-Open Access articles published, all supplemental material carries a non-exclusive license, and permission requests for re-use of supplemental material or any part of supplemental material shall be sent directly to the copyright owner as specified in the copyright notice associated with the article.