
Abstract
Currently, the prevention and treatment of hypertensive crises especially when it occurs with serious adverse outcomes have led to worldwide controversy. Despite of clinical possibilities of multiple agents, clinical failures still occur frequently. Therefore, early evaluations and observations of different therapies on appropriate animals should be emphasized. In the present study, an animal model for hypertensive crises emergencies was firstly established and experimentally testified. Five-month-male spontaneously hypertensive rat was consecutively fed with 60%-Kcal fat diet for four, six, and eight weeks with body weight and blood pressure monitored every two weeks, and then followed by an acute vasoconstriction stress of 5-min ice-bath treatment in the 4-h time interval of two adrenaline injections (0.8 mg/kg). Forty-four biochemical parameters were detected, covering hepatic and renal function, blood glucose and lipid levels, myocardial enzymes and energy metabolisms, blood coagulative and anti-coagulative system, oxidative stress and anti-inflammatory cytokine, blood viscosity, and RAAS system. Six tissues including heart, brain, liver, kidney, coronary arteries, and mesenteries were removed for pathological observations with hematoxylin–eosin staining. As a result, multi-organ dysfunctions in the heart, brain, liver, kidney, vascular endothelium, and blood system were testified in the modeling rats at weeks 6 and 8. In conclusion, severe consequences of this animal model were highly similar to those in hypertensive crises emergencies, which could be further utilized in the early intervention of hypertensive crises emergencies including the possible risk factors control and efficient therapies assessment.
Impact statement
In the late 90s, numerous reports predicted that 1–2% of hypertensive individuals would undergo hypertensive crises (HPC) and figures reached as high as 7% when no antihypertensive therapies were administrated. Currently, clinical failures appear frequently due to the improper or excessive medication regimen instead of the illness itself. Therefore, early evaluations and observations of HPC on appropriate animal models ahead of patients should be discussed and emphasized more widely. In the present study, an appropriate animal model for HPC emergencies was firstly established, in which the consequences of long-term high-fat diet feeding followed by an acute vasoconstriction stress on the spontaneously hypertensive rats were experimentally testified. The proposed model would have a wide application prospects in early intervention of HPC emergencies including the controls of possible risk factors and assessments of efficient therapies.
Keywords
Introduction
Hypertensive crises (HPC, 76% urgencies, 24% emergencies) occupy more than one-fourth of all the medical urgencies or emergencies in the intensive care units (ICUs), 1 affecting more diverse population including young adults and teenagers. HPC occur mostly in young adults and two times more frequently in men than women. 2 Rather than the sudden rise of blood pressure, severe organ damage is the key to distinguish the HPC urgencies and emergencies. Approximately 1% to 2% 3 of patients with hypertension will sometimes present a hypertensive emergency with the characters of severe hypertension and acute multi-organ dysfunctions, including hypertensive encephalopathy, renal injury, heart failure, endothelial dysfunctions, etc., and the figures may reach as high as 7% when no antihypertensive therapies are administrated.
Since the organization in late 1950s, ICU has greatly benefited the managements of all the medical urgencies or emergencies. 4 But there are always challenges for HPC, especially the emerged crises, over the past decades in spite of clinical possibilities of multiple therapeutic agents and systematic vital life functions monitoring. 5 When HPC emergencies occur, the alleviation of the damage to important organs is the primary task. In some cases, the clinical failures in HPC emergencies are caused by improper or excessive medication regimen but not the illness itself. 6 Therefore, we recommend that medications should be evaluated on appropriate animal models before utilizing on patients, in order to avoid adverse outcomes for HPC emergencies and to achieve meaningful therapies.
Spontaneously hypertensive rats (SHR) share a high similarity to human being on the progression of hypertension.7,8 In the early stage, SHR show no obvious organ damage but an increased total vascular peripheral resistance up to top level within about six months. As time further extended, some SHR will present complex complications in the brain, heart, and kidney. Numerous reports have tested the prevention and alleviation effects of antihypertensive medications in SHR.9–16 However, whether and when multi-organ dysfunctions would present in SHR still remain unknown and uncontrollable. As for the chronic hypertension-induced cardiovascular changes, SHR also varied obviously in different age and gender. 17 Wexler et al. 18 reported the histopathologic changes in aging male and female SHR, suggesting that the degenerative changes showed in different severity and were associated with the gender and age. Sole SHR model, controversially, might not be suitable for HPC especially when it directs to HPC emergencies. Therefore, in the proposed model, another two modeling factors of high-fat diet and acute vasoconstriction stress were used based on spontaneously hypertension.
High-fat diet has been considered as an important pathogenic factor to hyperlipidemia,19,20 and may lead to severe cardiovascular and cerebrovascular diseases like atherosclerosis, stroke, coronary disease, myocardial infarction, etc. 21 High-fat feeding also has a close relevance to fatty liver and hepatic cirrhosis. In some studies, the researchers have demonstrated that high-fat diet could enhance cardiac abnormalities, 22 exacerbate renal injury,23–25 generate endothelial dysfunctions, 26 as well as induce lipid metabolism and oxidative stress disorders in SHR. 27
Adrenaline (Adr) is a hormone that widely known for the “fight or flight” response.28,29 As a part of the acute stress response system, Adr works through stimulating the heart rate, contracting blood vessels, and dilating air passages.30,31 Since first synthesized in 1904, Adr has been a common treatment for low cardiac output. Excess level of Adr would result in enormous pressure on heart muscle and in some worse cases cause heart failure.32,33 Exposure to ice-cold water could increase the cardiac afterload and myocardial oxygen consumption, 34 and the blood flow in peripheral vessels would decrease rapidly. 35 Some works reported that Adr injection combined with ice-bath exposure could lead to “blood stasis,” a term used in traditional Chinese medicine theory that mainly represents an impaired hemorheology and an abnormal blood coagulation activity.36–39 In the modern medicine theory, these data reflected the vasoconstriction effects in various forms, such as peripheral vessels contracting, myocardial energy consumption, and hemorheological disorders. Nonetheless, how the combination of Adr and ice-bath works in SHR, and will it be a suitable precipitating factor for HPC emergencies are still lack of knowledge.
Intriguingly, the consequences of long-term high-fat feeding followed by an acute vasoconstriction stress especially when it occurs with spontaneous hypertension and their further implications to HPC emergencies should be defined and applied. In the present study, five-month male SHR were consecutively fed with 60 kcal% fat diets for four, six, and eight weeks with body weight and blood pressure monitoring every two weeks, then followed by an acute vasoconstriction stress of 5-min ice-bath treatment in the 4-h time interval of two Adr injections (0.8 mg/kg). Forty-four parameters were determined and six tissues including heart, brain, liver, kidney, coronary arteries, and mesenteries were removed for the pathological observations (Figure 1). Based on the above experimental design and observed evidence, this study firstly combined the three factors (SHR rats + High-fat diet + Adr injection with ice-bath) to establish an appropriate animal model for HPC emergencies.
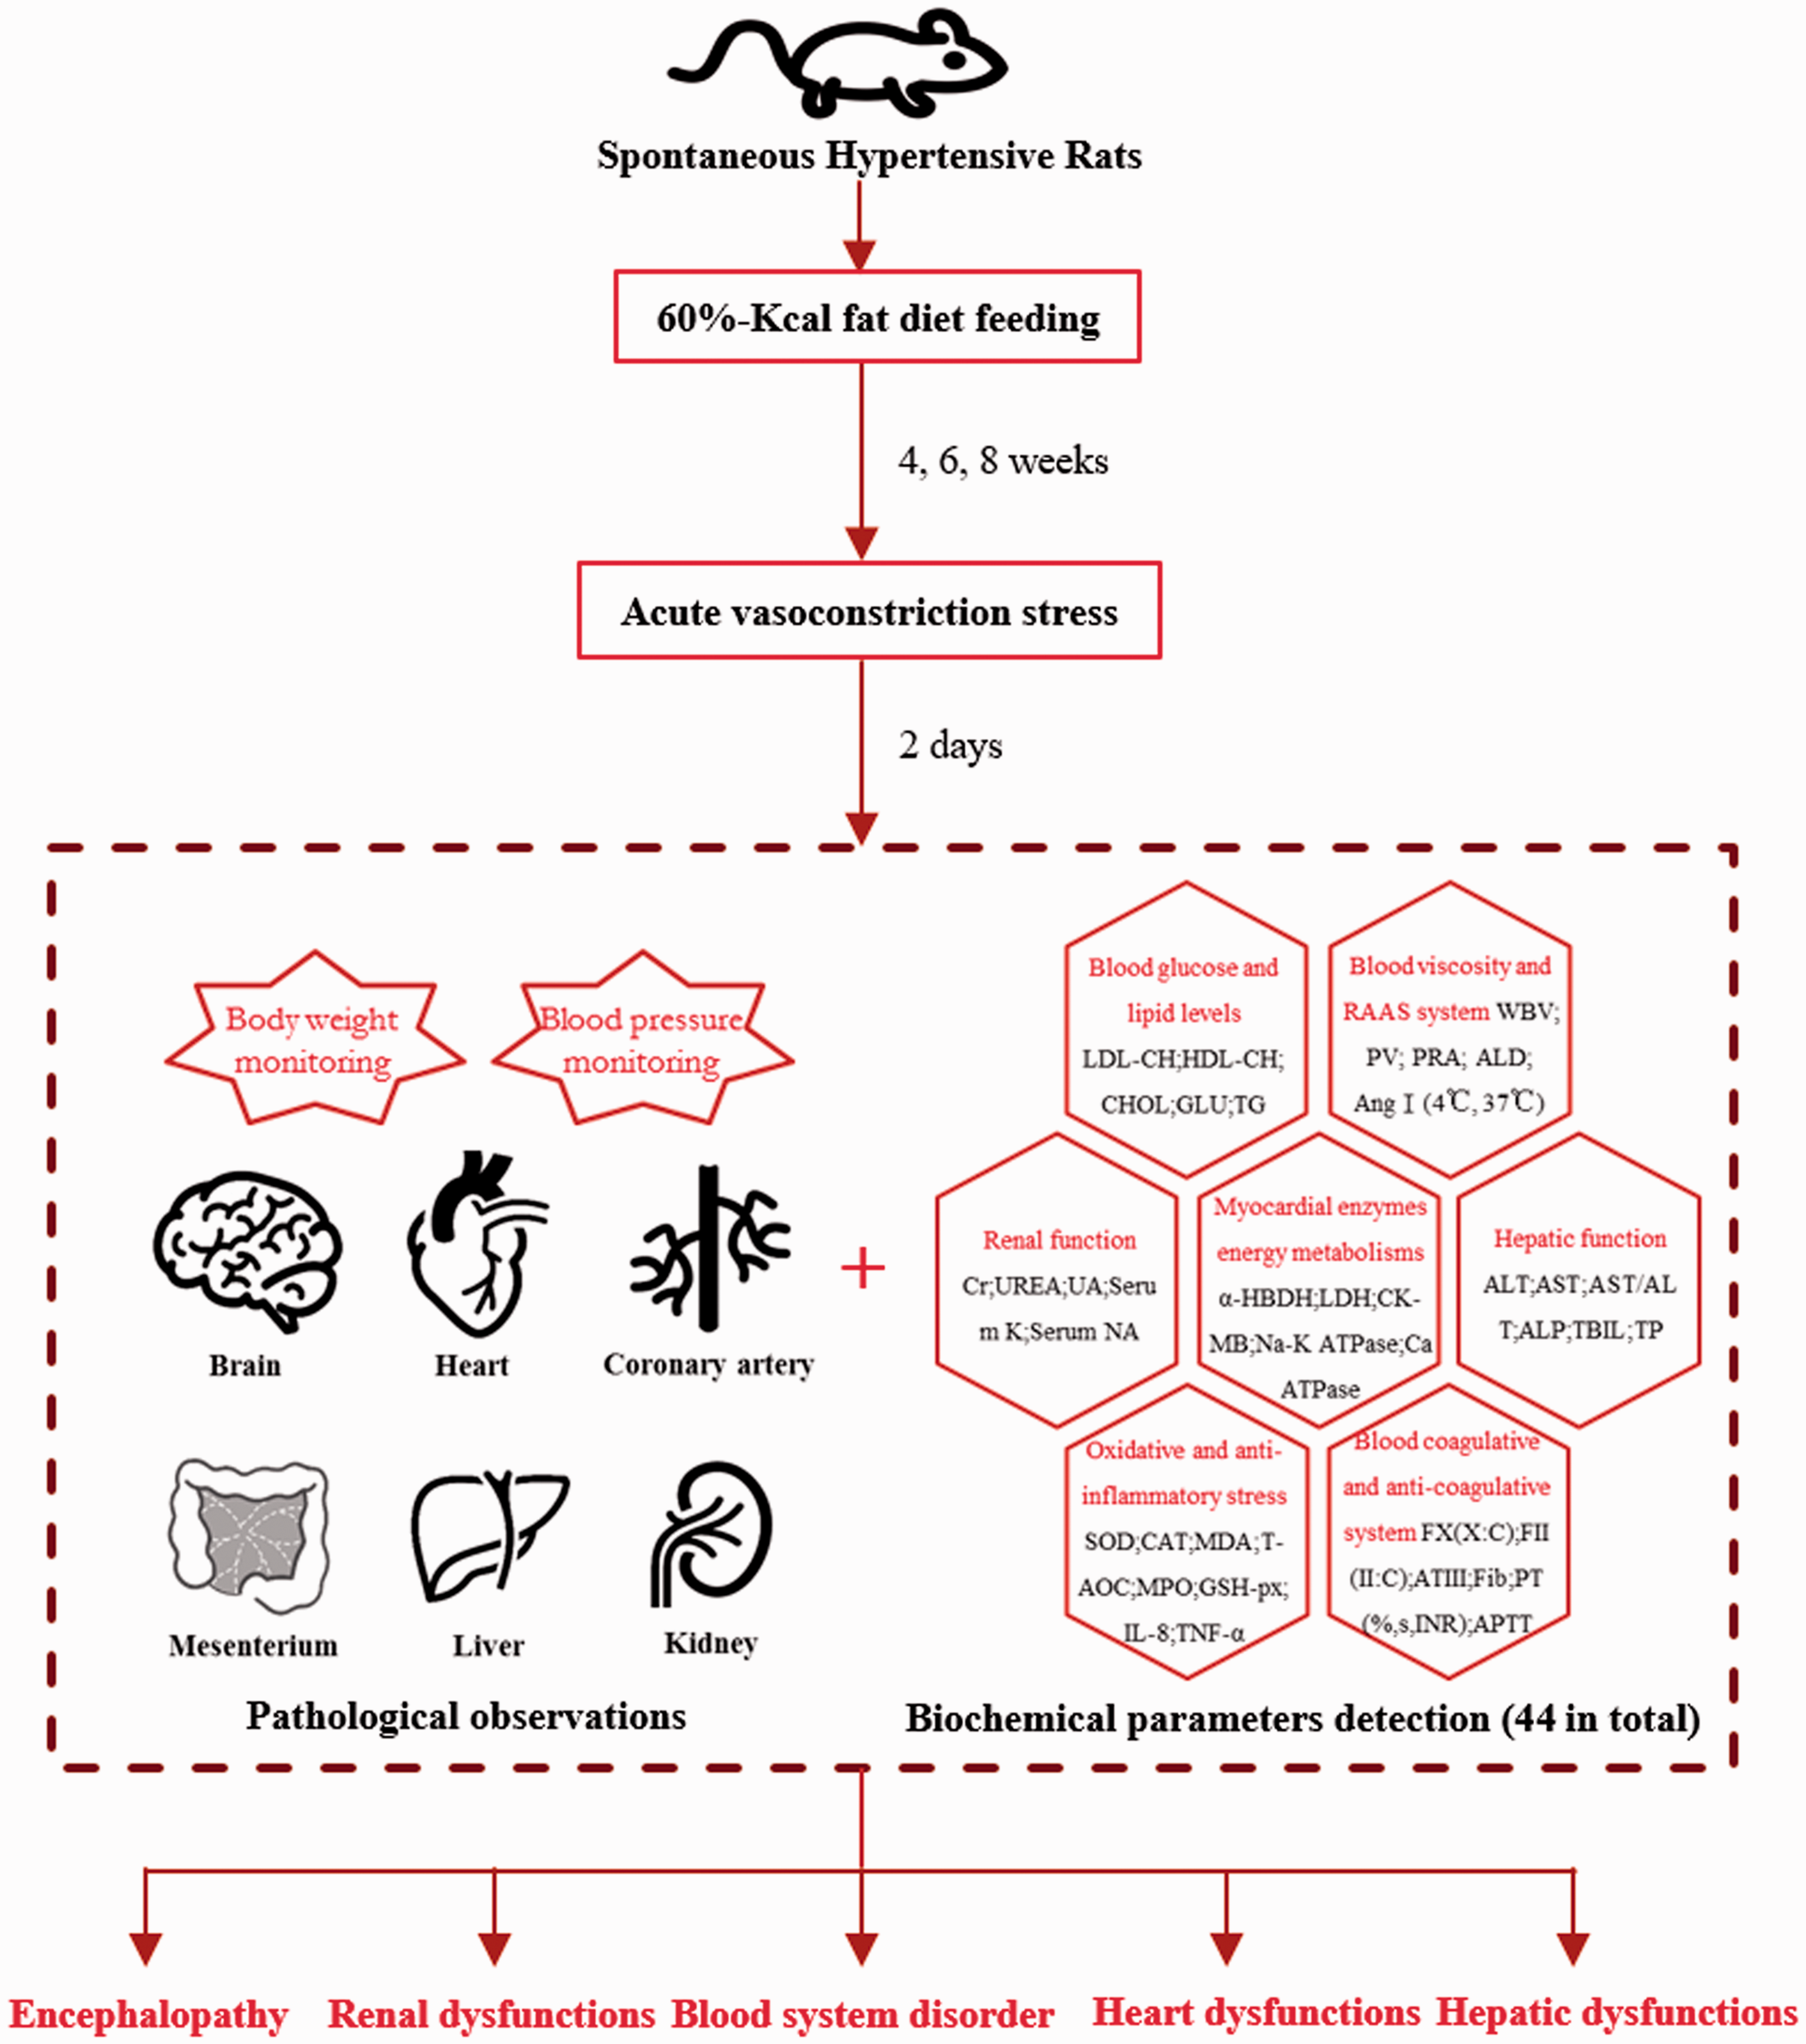
Establishment and experimental assessment of the proposed animal model. The proposed modeling method was based on the combination of the three factors (SHR+High-fat diet+Acute vasoconstriction). To experimentally testify the established model, up to 44 biochemical parameters were determined and 6 tissues including heart, brain, liver, kidney, coronary arteries, and mesenteries were pathologically observed. (A color version of this figure is available in the online journal.)
Materials and methods
Reagents and instruments
ZH-HX-Z noninvasive tail arterial blood pressure analysis system was equipped with MD3000 biological function acquisition processing system (Anhui Zhenghua Biological Instrument Equipment Co. Ltd, China). Full-automatic biochemical analyzer (MODULAR P800, Roche). Full-automatic blood coagulation analyzer (STA Compact, Stago). Ultra-low temperature freezer (BCD-568W, Haier). Refrigerated centrifuge (5430R, Eppendorf). Full-automatic self-cleaning haemorheology analyzer (LBY-N6B, Beijing Precil). Enzyme-linked immunosorbent assay (ELISA) kits for interleukin-8 (IL-8) and tumor necrosis factor-α (TNF-α) were purchased from Cusabio Biotech Co., Ltd, China. Radio immunity assay (RIA) kits for aldosterone (ALD) and angiotensin I (Ang I, 4°C and 37°C) were purchased from Beyotime Biotechnology Institute Co., Ltd, China. Colorimetric-assay kits for total antioxidant capacity (T-AOC), superoxide dismutase (SOD), methane dicarboxylic aldehyde (MDA), glutathione peroxidase (GSH-PX), myeloperoxidase (MPO), Na+-K+ adenosine triphosphatase (ATPase), Ca2+ ATPase, and bicinchoninic acid protein concentration (BCA) were purchased from Nanjing Jiancheng Bioengineering Institute Co., Ltd, China. Adr was purchased from Shanghai Harvest Pharmaceutical Co., Ltd (State medical permission No. H31021062, Batch No. 20141009). Rodent diet with 60 kcal% fat was purchased from Research Diets, Inc. (ID: D12492). Standard laboratory pellet feed was purchased from Guangdong Medical Experimental Animal Center (License No. SCXK-(Yue) 2013–0002).
Animals
Thirty specific-pathogen-free (SPF) SHR (five-month, male, 180–200 g, Experimental Animal Quality Qualification Certificate No. 11400700075950) and 30 SPF Wistar-Kyoto rats (WKY, five-month, male, 180–200 g, Experimental Animal Quality Qualification Certificate No. 4400210000 4293) were provided by the Vital River Laboratory Animal Technology Co. Ltd (License No. SCXK-(Jing) 2012–0001) and raised in the SPF houses of Ocean and Traditional Chinese Medicine Laboratory of Sun Yat-sen University (License No. SCXK-(Yue) 2014–0020). The experimental procedures were approved by Animal Care and Use Committee of School of Life Sciences of Sun Yat-sen University (Permission No. 2015122406) and carried out in accordance with the National Institutes of Health guide for the care and use of Laboratory animals (NIH Publications No. 8023, revised 1978). The temperature of SPF houses was 20–23°C and the relative humidity was 50–65%. Rats were kept under a 12-h dark-light cycle. Experiments began after the rats adapted to the new environment for one week. The harm to the experimental rats was reduced to a minimal extent during the experimental process by taking appropriate measures.
Modeling methods
Thirty WKY were randomly divided into Control_4, Control_6, and Control_8 groups. Thirty SHR were randomly divided into Model_4, Model_6, and Model_8 groups. The WKY in the Control_4, Control_6, and Control_8 groups were fed with standard laboratory pellet feed consecutively for four, six, and eight weeks. The SHR in the Model_4, Model_6, and Model_8 groups were fed with 60%-Kcal fat diet (ID: D12492, Research Diets, Inc.) for four, six, and eight weeks. After four, six, and eight weeks, the SHR in the Model_4, Model_6, and Model_8 groups were subcutaneously injected with Adr (0.8 mg/kg). After 2 h, the SHR were kept in ice-cold water (0–4°C) for 5 min and another 2 h later were subcutaneously injected again with Adr (0.8 mg/kg).37–39 After the re-injection, the SHR were fasted for 12 h before the blood and tissue sampling. While the WKY in the Control_4, Control_6, and Control_8 groups were subcutaneously injected with the same volume of normal saline and fasted for 12 h. General modeling process is shown in Figure 2.
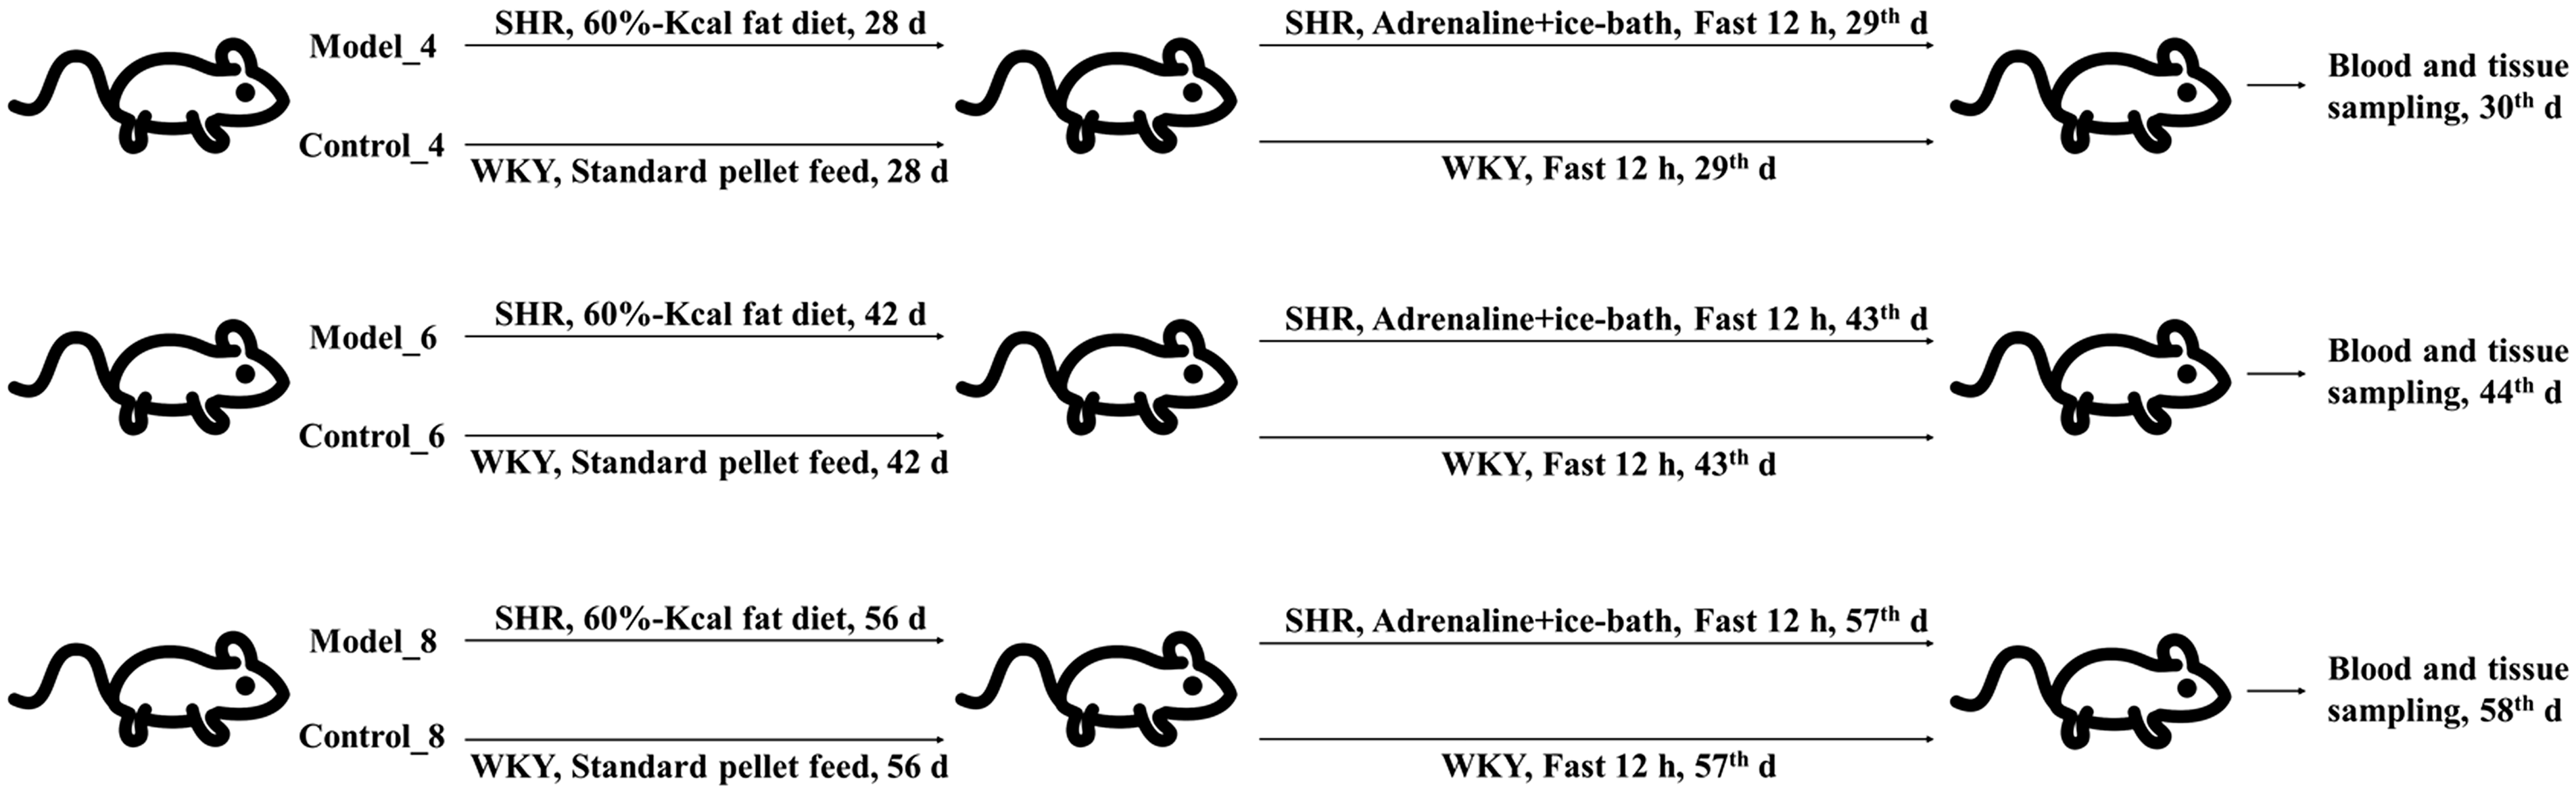
General modeling process of the proposed animal model. Thirty WKY were randomly divided into Control_4, Control_6, and Control_8 groups. Thirty SHR were randomly divided into Model_4, Model_6, and Model_8 groups. The modeling rats were fed with 60%-Kcal fat diet for four, six, and eight weeks while the control rats were fed with standard laboratory pellet feed. After four, six, and eight weeks, the modeling rats were treated with the acute vasoconstriction stress, which was 5-min ice-bath treatment in the 4-h time interval of two adrenaline subcutaneous injections. Then the blood and tissue samples were obtained after fasted for 12 h. The control rats were subcutaneously injected with the same volume of normal saline, and fasted for 12 h before sampling.
Monitoring of body weight and blood pressure
In the first day and the next every two weeks, systolic blood pressure (SBP) and diastolic blood pressure (DBP) of tail arterial were measured through the ZH-HX-Z noninvasive blood pressure analysis system, with the data processed by the MD3000 biological function acquisition processing system. SBP was defined by the appearance of the very first wave. DBP was defined by the appearance of the first wave with maximum amplitude. Both SBP and DBP were presented by the average value of eight consecutive measurements. Body weight was measured every two weeks and the general living states of mental conditions, coat color, appetite, and activity were recorded every one week.
Sampling of the blood and tissues
At the 30th day, 44th day, and 58th day, the blood and tissues were sampled. Rats were intraperitoneally injected with chloral hydrate (10%, 3.5 ml/kg) for anesthesia after 12-h fast. Total volume of 8–10 ml blood was drawn from the abdominal aorta, of which 5 ml was standing without any anticoagulants and the rest was collected into plastic tubes to mix with sodium citrate (3.2%, citrate/blood: 1/9, v/v). All the blood samples were processed and examined strictly by standard operating procedures. Immediately following the blood sampling, the thoracic and abdominal cavities were dissected open with iodine (2%) disinfecting the skin. Six tissues including fresh heart, brain, liver, kidney (left), coronary arteries, and mesenteries were then removed and preserved in the 10% buffered formalin.
Determination of biochemical parameters and pathological observations of the tissues
Anticoagulant blood of 1.0 ml was put directly into LBY-N6B to detect the whole blood viscosity (WBV) at 5 s−1, 30 s−1, 50 s−1, 150 s−1, and 200 s−1 share rates and plasma viscosity (PV) at 120 s−1 shear rates. Plasma obtained from 2.0 ml anticoagulant blood (3500 r/min, 4°C, 10 min) was put into STA Compact to detect the factor X coagulant activity (FX: C), factor II coagulant activity (FII: C), antithrombin III (ATIII), fibrinogen (Fib), prothrombin time (PT, %, INR, s), and activated partial thromboplastin time (APTT). Non-anticoagulant blood of 5.0 ml was standing for 30 min at the room temperature of 20–25°C and then centrifuged (3500 r/min, 4°C, 10 min) to get the serum; 600 μl serum was put into MODULAR P800 to detect the alanine transaminase (ALT), aspartate transaminase (AST), alkaline phosphatase (ALP), total bilirubin (TBIL), total protein (TP), Creatinine (Cr), urea (Ur), uric acid (UA), serum K+, serum Na+, total cholesterol (CHOL), low-density lipoprotein cholesterol (LDL-CH), high-density lipoprotein cholesterol (HDL-CH), blood glucose (GLU), triglyceride (TG), α-hydroxybutyric dehydrogenase (α-HBDH), creatine kinase-MB (CK-MB), and lactic dehydrogenase (LDH); 300 μl serum was used to detect the ALD and Ang I (4°C and 37°C) through the RIA kits; 150 μl serum was used to detect the IL-8 and TNF-α through the ELISA kits; 1000 μl serum in total was divided into several fractions to detect the T-AOC, SOD, MDA, GSH-PX, MPO, Na+-K+ ATPase, Ca2+ ATPase, and BCA protein concentration through the colorimetric-assay kits. All the measurements were performed strictly according to the corresponding explanatory instructions. Heart, brain, liver, kidney (left), coronary arteries, and mesenteries were made into routine paraffin sections. Pathological observations were conducted through the hematoxylin-eosin (HE) staining.
Statistical analysis
Grey relational analysis (GRA), principal component analysis (PCA), and Minkowski distance (MD) were used to compare the statistical differences among the treatment groups. GRA, providing an alternative approach to identify the correlations among factors, has been successfully applied to quantify the influence of compared series on the reference series. Grey relational degree (GRD) is used for ranking the influence of compared series, which can be represented by the relative distance between them in an imaging grey space without making prior assumption about the distribution type.40,41 As shown in Table S1, the minimal difference-baseline was chosen as the reference series and regarded as one new variable based on the assumption that no difference between the control and model groups at weeks 4, 6, and 8. The absolute differences of 44 parameter values between the corresponding control and model groups were defined as three new variables and chose as the compared series, as shown in Table S1 (Absolute difference-week 4, Absolute difference-week 6, Absolute difference-week 8). GRD of each compared series to the reference series was calculated with the resolution ratio of 0.5. 42 The smaller the GRD, the less the similarity to the baseline, the worse the physical conditions of the treatment groups. PCA is widely used for the numerical classification. The basic idea is to switch the multidimensional problems into low dimensions with visual scatter plot in the Euclidean Space of two-dimension or three-dimension to sort different groups. 43 Six treatment groups with 44 parameter values in each were defined as six variables (Control_4, Control_6, Control_8, Model_4, Model_6, and Model_8) and used in the PCA. Two principal components (PC) were extracted, contributing to 92% of the total variance. MD is considered as a generalization of both Euclidean distance and Manhattan distance. 44 MD (first power, P = 1) was used to evaluate the similarity among six variables (Control_4, Control_6, Control_8, Model_4, Model_6, and Model_8). In the cluster analysis, MD (first power, P = 1) was employed to calculate the distance. Between-group linkage was used as the amalgamation rule.
Data processing
Data were documented as mean ± standard deviation (SD) and processed by one-way analysis of variance, Student’s t-test, and least significant difference multiple comparisons in SPSS (Version: 19.0), with P-values less than 0.05 or 0.01 considered to have statistical significance.
Results
Monitoring of body weight and blood pressure
Compared with the beginning, the body weight in WKY significantly increased at weeks 2, 4, 6, and 8, while in SHR, it significantly decreased after 4 weeks. The SBP and DBP in WKY stayed at the same level over the time of eight weeks. While in SHR, both SBP and DBP raised significantly and remained at around 220 mmHg (SBP) and 150 mmHg (DBP) six weeks later (Figure 3).
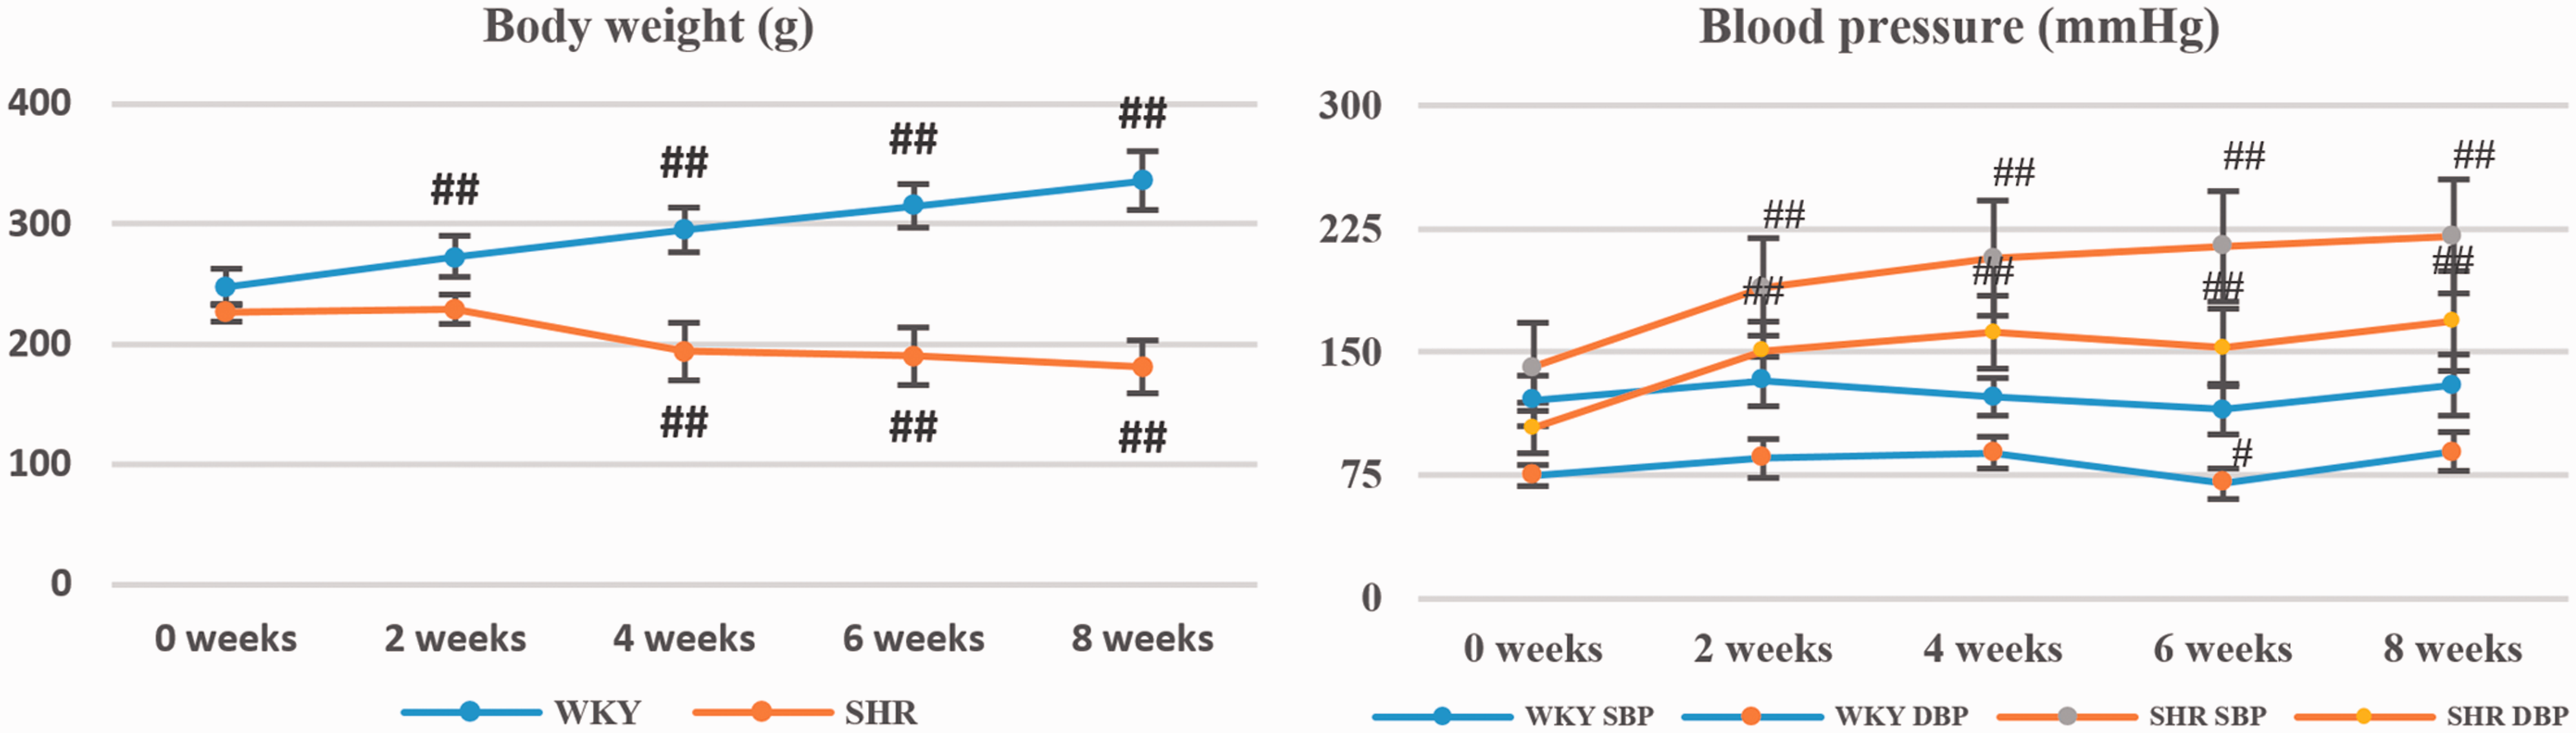
Body weight and blood pressure monitoring at weeks 2, 4, 6, and 8. SBP: systolic blood pressure; DBP: diastolic blood pressure. #referred to P < 0.05 and ##referred to P < 0.01 vs. the initial measured value (0 weeks). (A color version of this figure is available in the online journal.)
Determination of biochemical parameters
Forty-four biochemical parameters related with myocardial enzymes and energy metabolisms, hepatic and renal functions, blood glucose and lipid levels, blood coagulative and anti-coagulative system, oxidative stress and anti-inflammatory cytokines, blood and plasma viscosity, and RAAS system were determined (Tables 1 to 8, Figure 4).
Myocardial enzymes and energy metabolism tests of the treatment groups at weeks 4, 6, and 8.
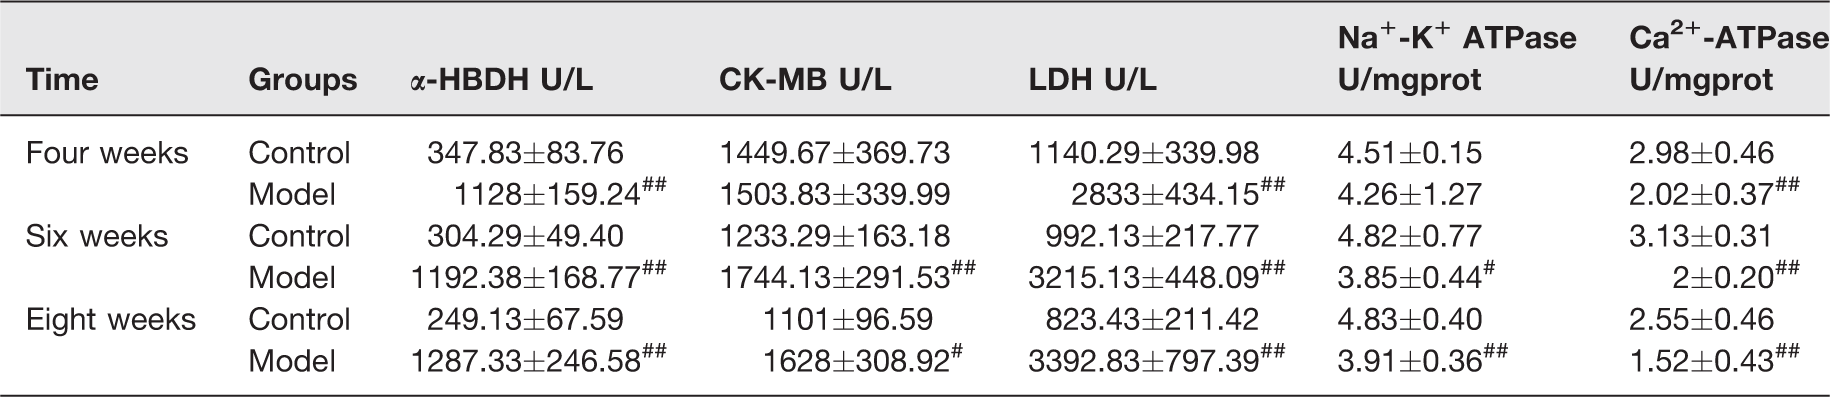
α-HBDH: α-hydroxybutyric dehydrogenase; CK-MB: creatine kinase-MB; LDH: lactic dehydrogenase, ATPase: adenosine triphosphatase.
#P < 0.05 and ##P < 0.01 vs. control group.
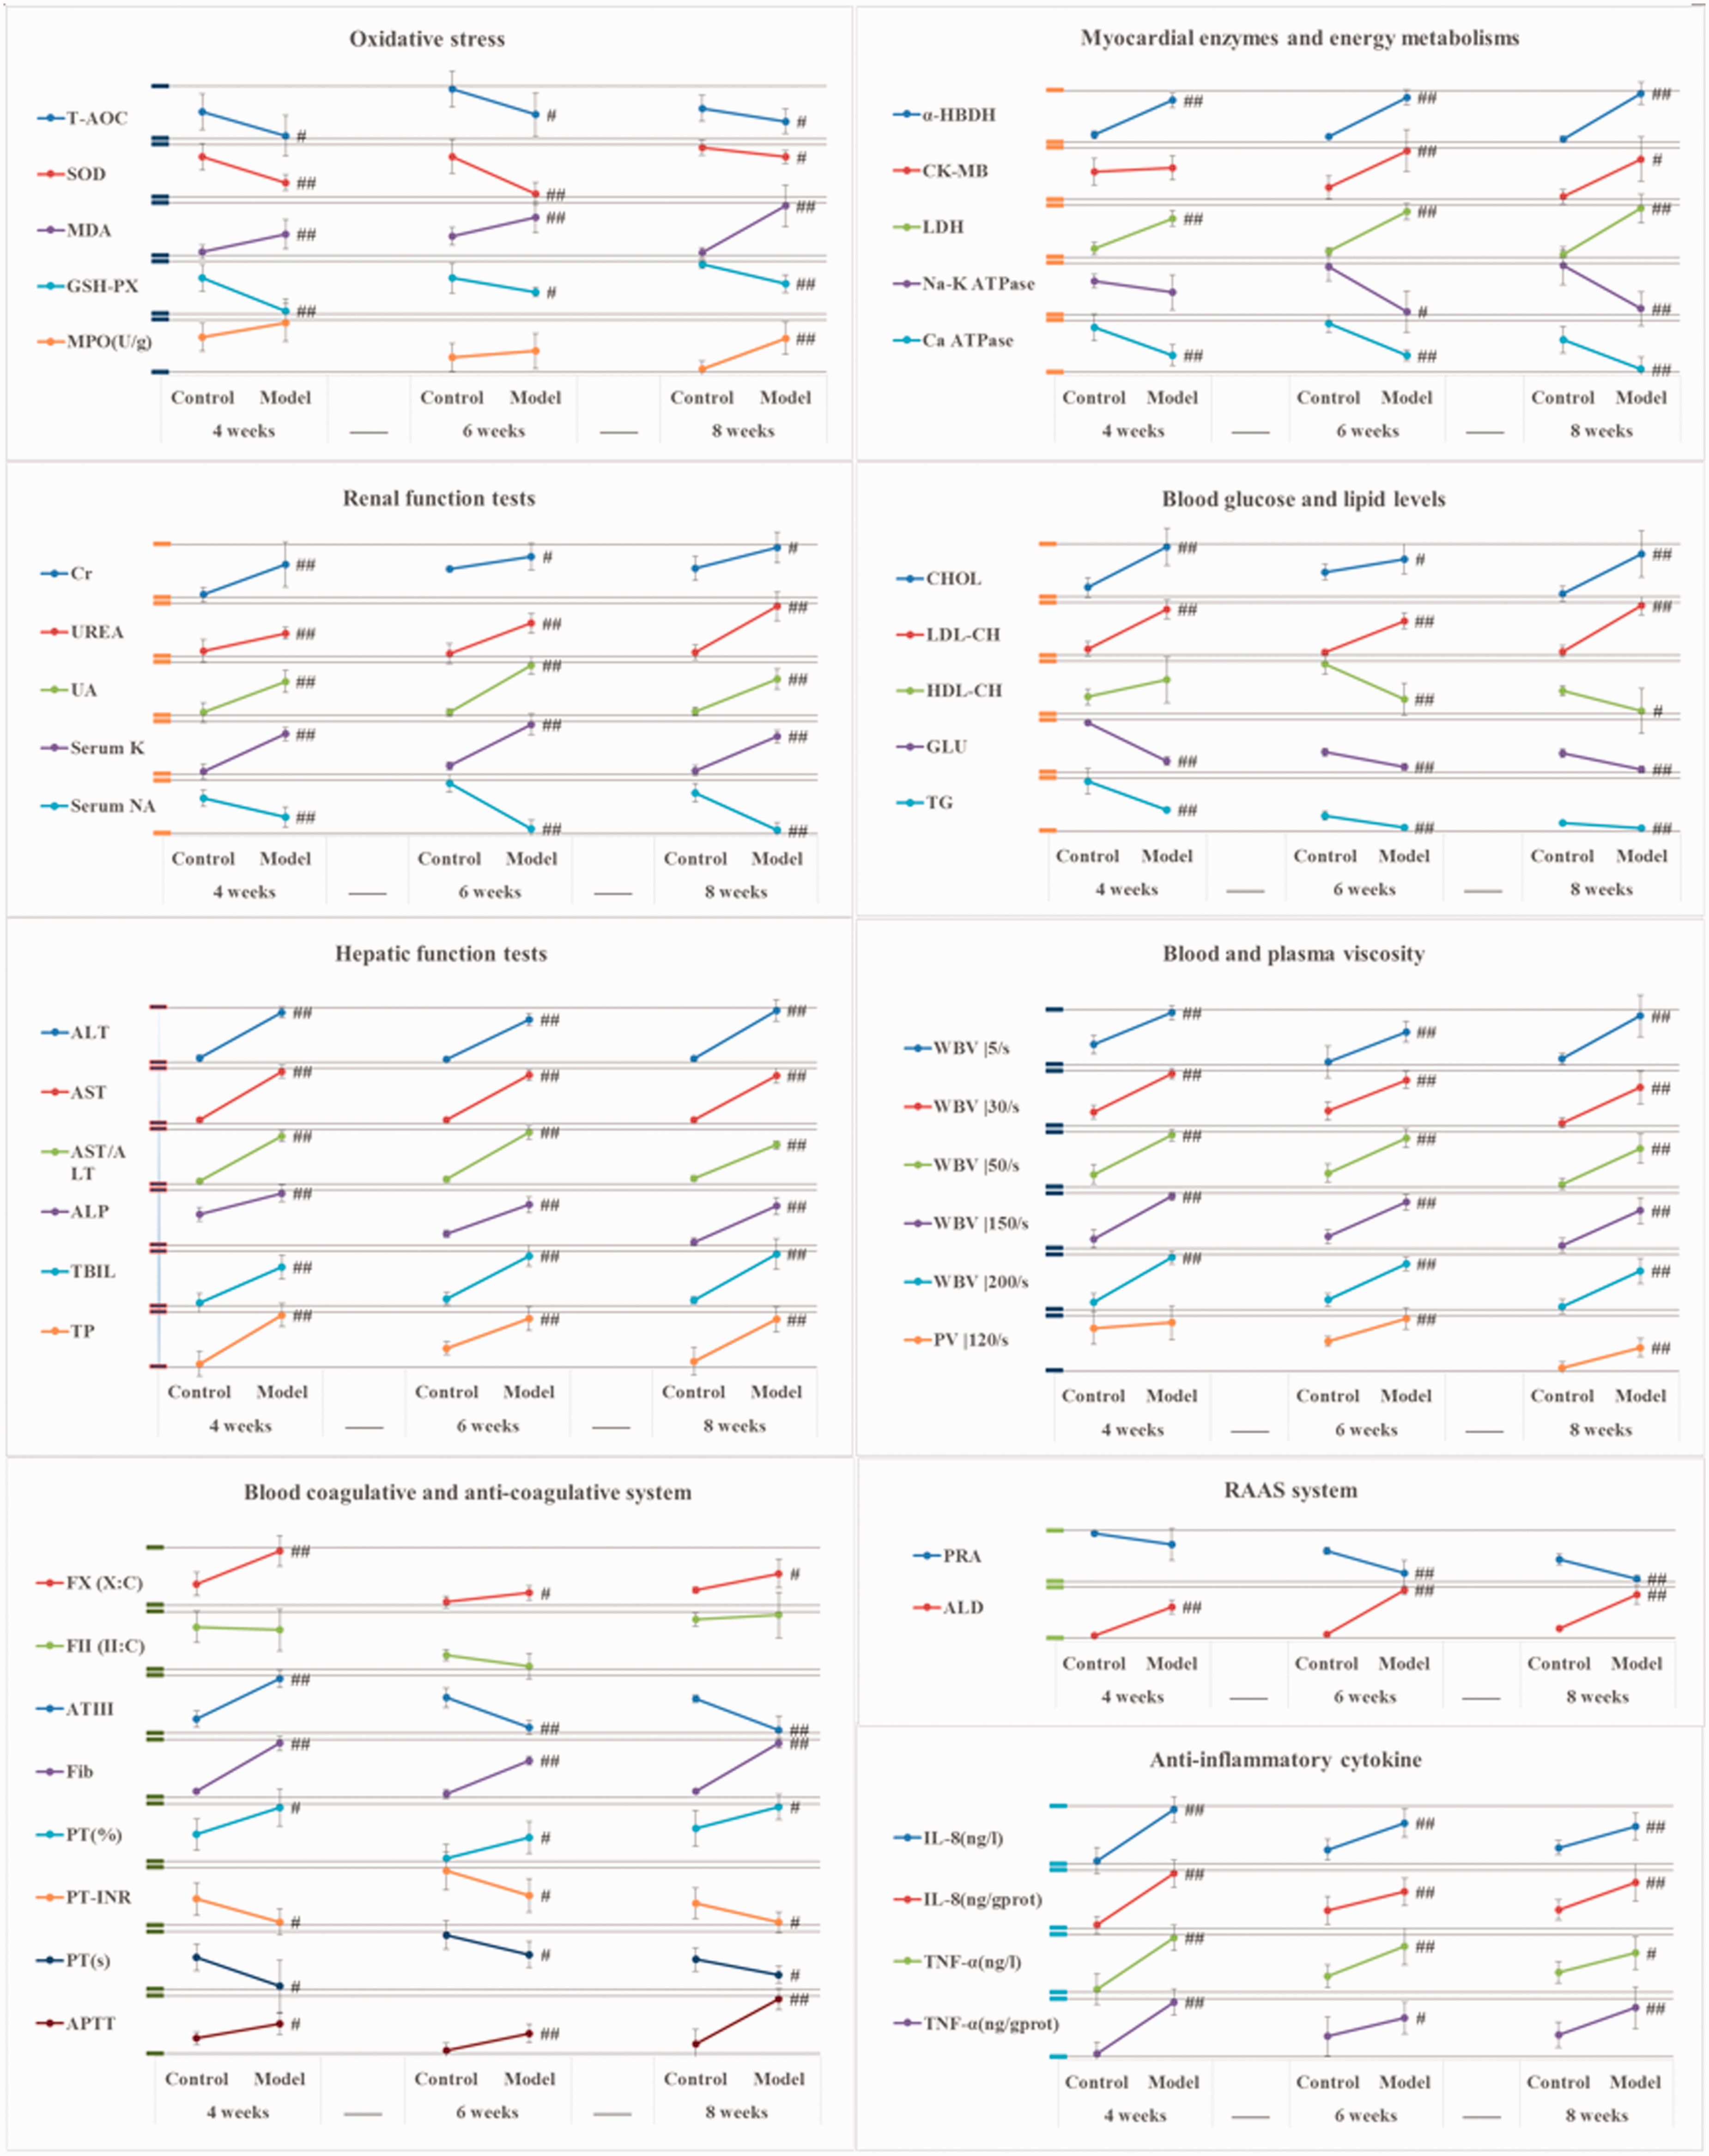
The tendency of forty-four biochemical parameters at weeks 4, 6, and 8. Data are presented as Mean ± Standard Deviation. Mean: (Mean−Min)/(Max−Min)×0.8; Standard Deviation: Standard Deviation/(Max−Min)×0.8. Mean: the average parameter value of a treatment group. Max: the maximal average parameter value of the treatment groups at weeks 4, 6, and 8. Min: the minimal average parameter value of the treatment groups at weeks 4, 6, and 8. The original mean and standard deviation value was thus dealt with to present the trends of 44 biochemical parameters at weeks 4, 6, and 8 more directly and clearly, without changing the nature of the original data. #referred to P < 0.05 and ##referred to P < 0.01 vs. control group. (A color version of this figure is available in the online journal.)
Myocardial enzymes and energy metabolisms
At week 4, CK-MB increased and Na+-K+ ATPase decreased, but with no statistical significance. The α-hydroxybutyric dehydrogenase (α-HBDH), LDH, and Ca2+-ATPase showed significant changes. To the weeks 6 and 8, significant differences were observed in all the five parameters (Table 1).
Hepatic and renal functions
ALT, AST, and alkaline ALP raised significantly at weeks 4, 6, and 8. The contents of TBIL and TP also showed a significant increase (Table 2). Cr, Ur, and UA had significant higher concentrations in serum at weeks 4, 6, and 8. Serum K+ increased and serum Na+ decreased with statistical significance (Table 3).
Hepatic function tests of the treatment groups at weeks 4, 6, and 8.
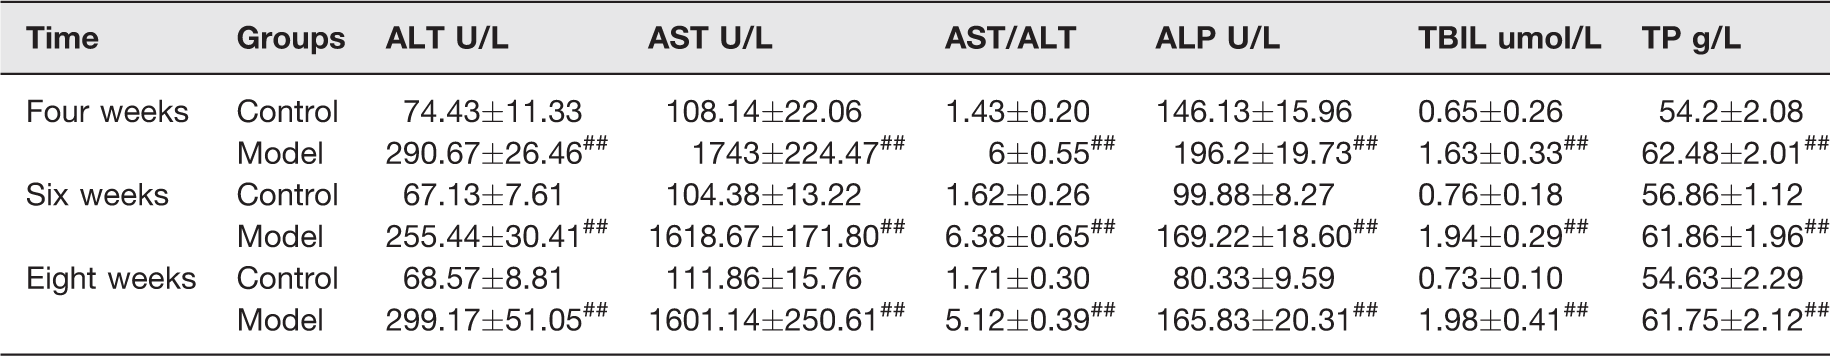
ALT: alanine transaminase; AST: aspartate transaminase; ALP: alkaline phosphatase; TBIL: total bilirubin; TP: total protein.
#P < 0.05 and ##P < 0.01 vs. control group.
Renal function tests of the treatment groups at weeks 4, 6, and 8.
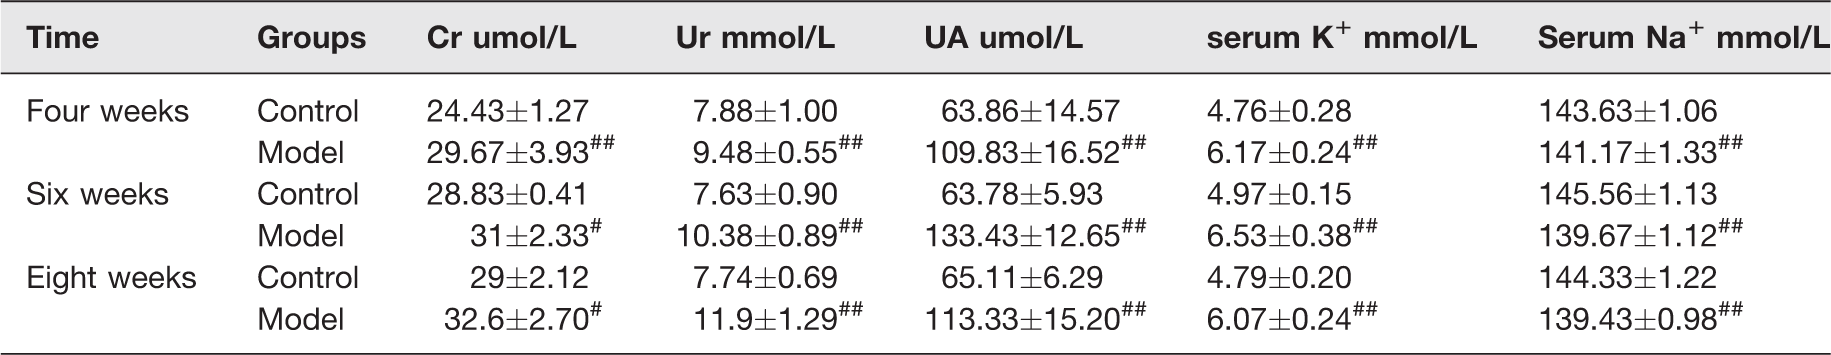
Cr: creatinine; Ur: urea; UA: uric acid; K+: kalium ion; Na+: natrium ion.
#P < 0.05 and ##P < 0.01 vs. control group.
Blood glucose and lipid levels
CHOL and LDL-CH showed significant higher concentrations at weeks 4, 6, and 8, while blood glucose (GLU) and TG went down significantly at the same time. HDL-CH increased at week 4, but showed significant decreases at weeks 6 and 8 (Table 4).
Blood glucose and lipid levels of the treatment groups at weeks 4, 6, and 8.
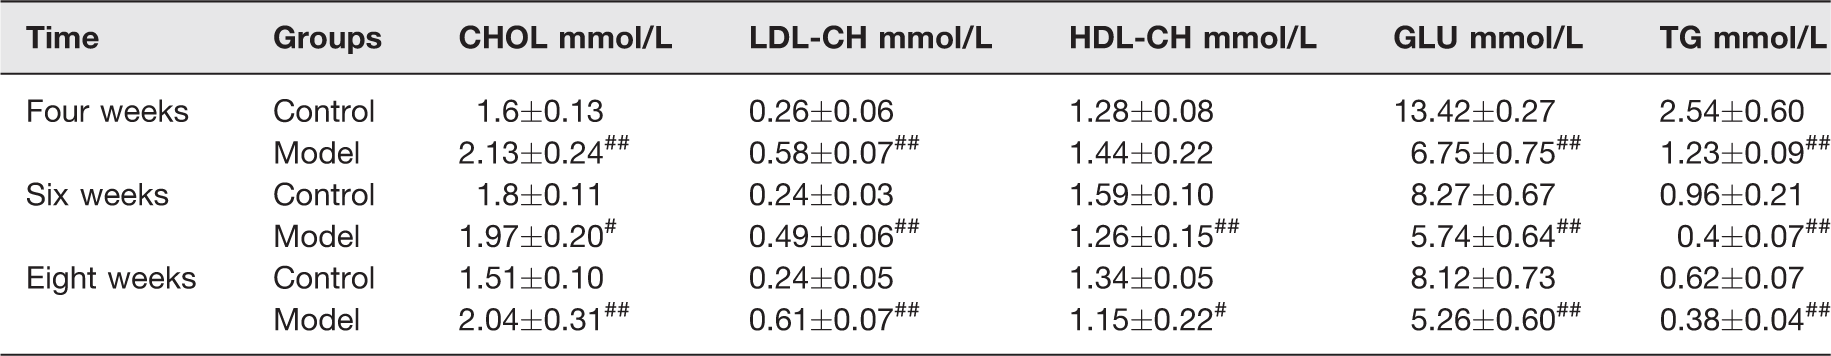
CHOL: total cholesterol; LDL-CH: low density lipoprotein cholesterol; HDL-CH: high density lipoprotein cholesterol; GLU: blood glucose; TG: triglyceride.
#P < 0.05 and ##P < 0.01 vs. control group.
Blood coagulative and anti-coagulative system
FX: C significantly increased and fibrinogen (Fib) showed significant higher concentration at weeks 4, 6, and 8. There were no obvious changes observed in the factor II coagulant activity (FII: C) at either weeks 4, 6, or 8. ATIII increased significantly at week 4, but decreased at weeks 6 and 8 compared with the corresponding control groups. A prolonged APTT and a shortened prothrombin time (PT) were detected at weeks 4, 6, and 8 (Table 5).
Blood coagulative and anti-coagulative system tests of the treatment groups at weeks 4, 6, and 8.
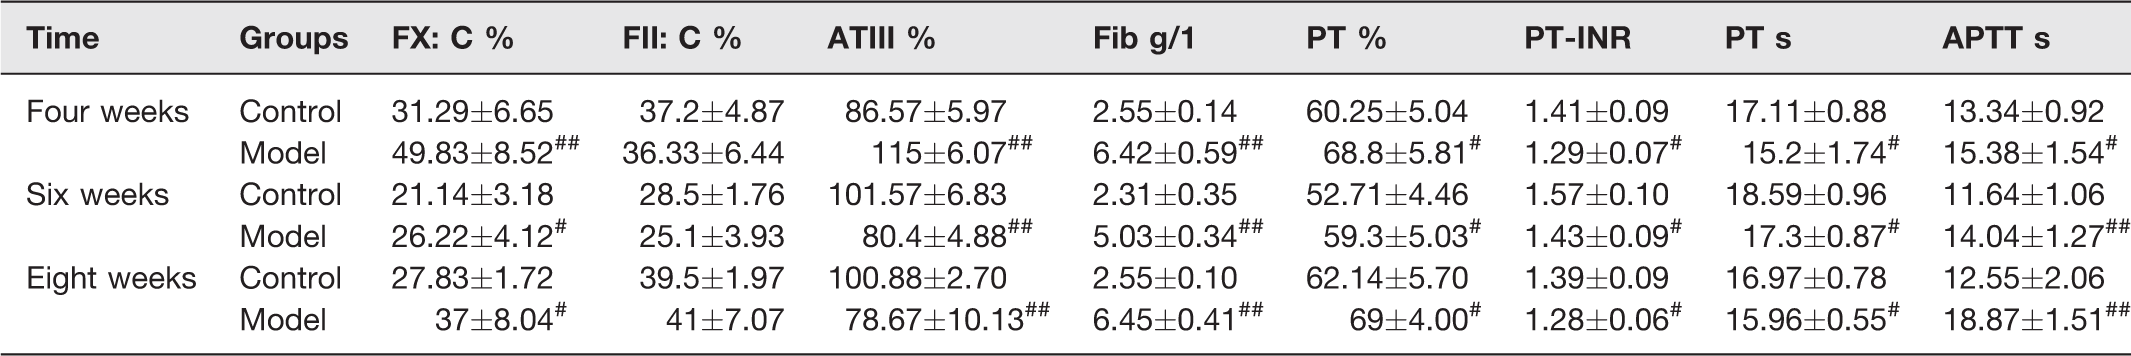
FX: C: factor X coagulant activity; FII: C: factor II coagulant activity; ATIII: antithrombin III; Fib: fibrinogen; PT: prothrombin time; PT-INR: prothrombin time-international normalized ratio; APTT: activated partial thromboplastin time.
#P < 0.05 and ##P < 0.01 vs. control group.
Oxidative stress, anti-inflammatory cytokines, and renin-angiotensin-aldosterone system
After four weeks, T-AOC descended, while MDA contents increased significantly. SOD, GSH-PX, and MPO decreased significantly at weeks 4, 6, and 8 (Table 6). Interleukin-8 (IL-8) and TNF-α increased significantly at weeks 4, 6, and 8. ALD showed extremely significant rise after four weeks, while plasma renin activity (PRA) decreased significantly after six weeks (Table 7).
Oxidative stress tests of the treatment groups at weeks 4, 6, and 8.
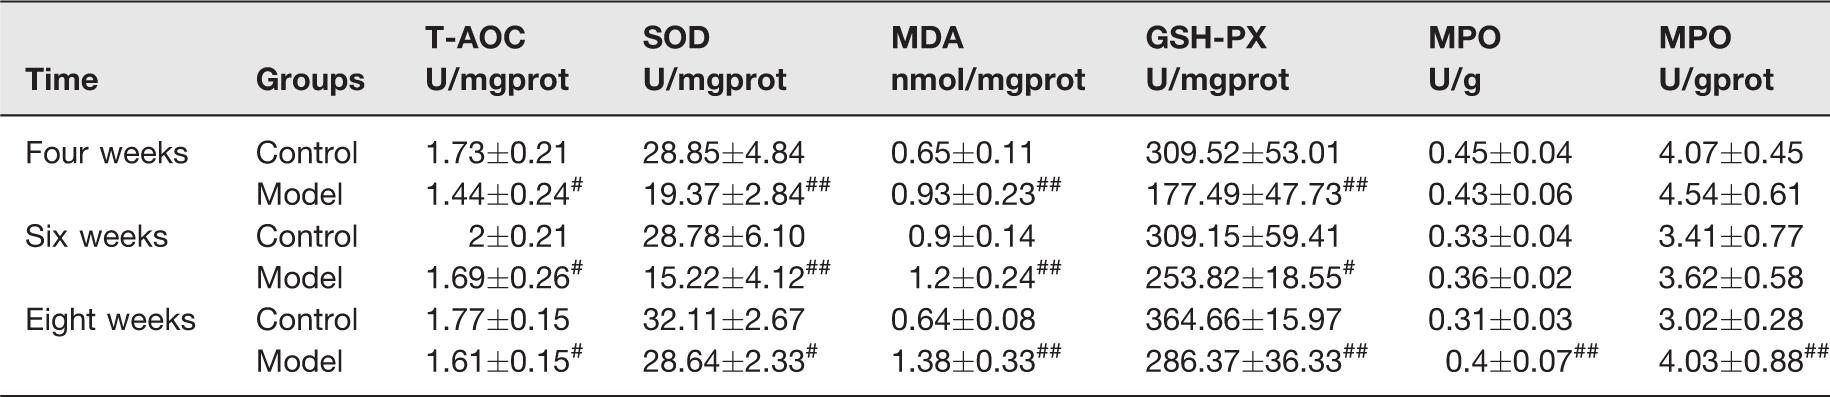
T-AOC: total antioxidant capacity; SOD: superoxide dismutase; MDA: methane dicarboxylic aldehyde; GSH-PX: glutathione peroxidase; MPO: myeloperoxidase.
#P < 0.05 and ##P < 0.01 vs. control group.
Anti-inflammatory cytokine and RAAS system tests of the treatment groups at weeks 4, 6, and 8.
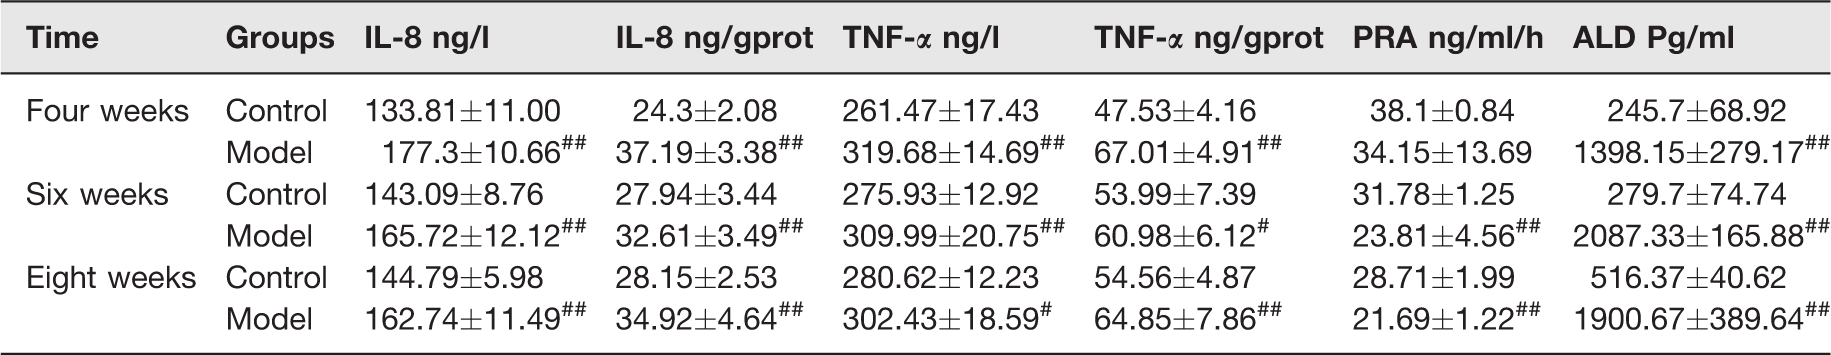
RAAS: renin-angiolensin-aldosterone system; PRA: plasma renin activity; ALD: aldosterone; Ang I: angiotensin I; IL-8: interleukin-8; TNF-α: tumor necrosis factor-α.
Note: PRA was presented by the generation of Ang I (37°C–4°C) per hour.
#P < 0.05 and ##P < 0.01 vs. control group.
Blood and plasma viscosity
WBV showed significant increase at weeks 4, 6, and 8 at all the five share rates. The significant rise of plasma viscosity (PV) could be detected after six weeks (Table 8).
Pathological observations of the tissues (hematoxylin–eosin staining, ×100, ×200, ×400)
Myocardium (Figure 5): The damage aggravated with the extension of modeling time, which could be observed in various forms such as eosinophilic degeneration, lymphocyte infiltration, red clots, and myocardial cells necrosis. After six weeks, myocardial cell necrosis appeared along with the infiltration of inflammatory cells. Liver (Figure 5): Vacuolar degeneration was the main observed damage. Partial liver cells became eosinophilic. Kidney (Figure 5): Vacuolar degeneration was frequently observed in the epithelial cells of the renal tubules in cortex. Partial renal tubules expanded. Coronary arteries (Figure 6): Endothelial cells swells and smooth muscle layer thickening began to appear after six weeks and aggravated with modeling time. Mesenteries (Figure 6): The main injuries were capillary hyperemia and lymphocyte infiltration, which were observed after six weeks and aggravated with modeling time. Brain (Figure 7): At week 6, pyramidal cells degeneration, focal lymphocytic infiltration, focal edema, and individual neurons apoptosis could be observed. At week 8, more pyramidal cells degenerations were found in the cerebral cortex and the hippocampal CA1, CA3.
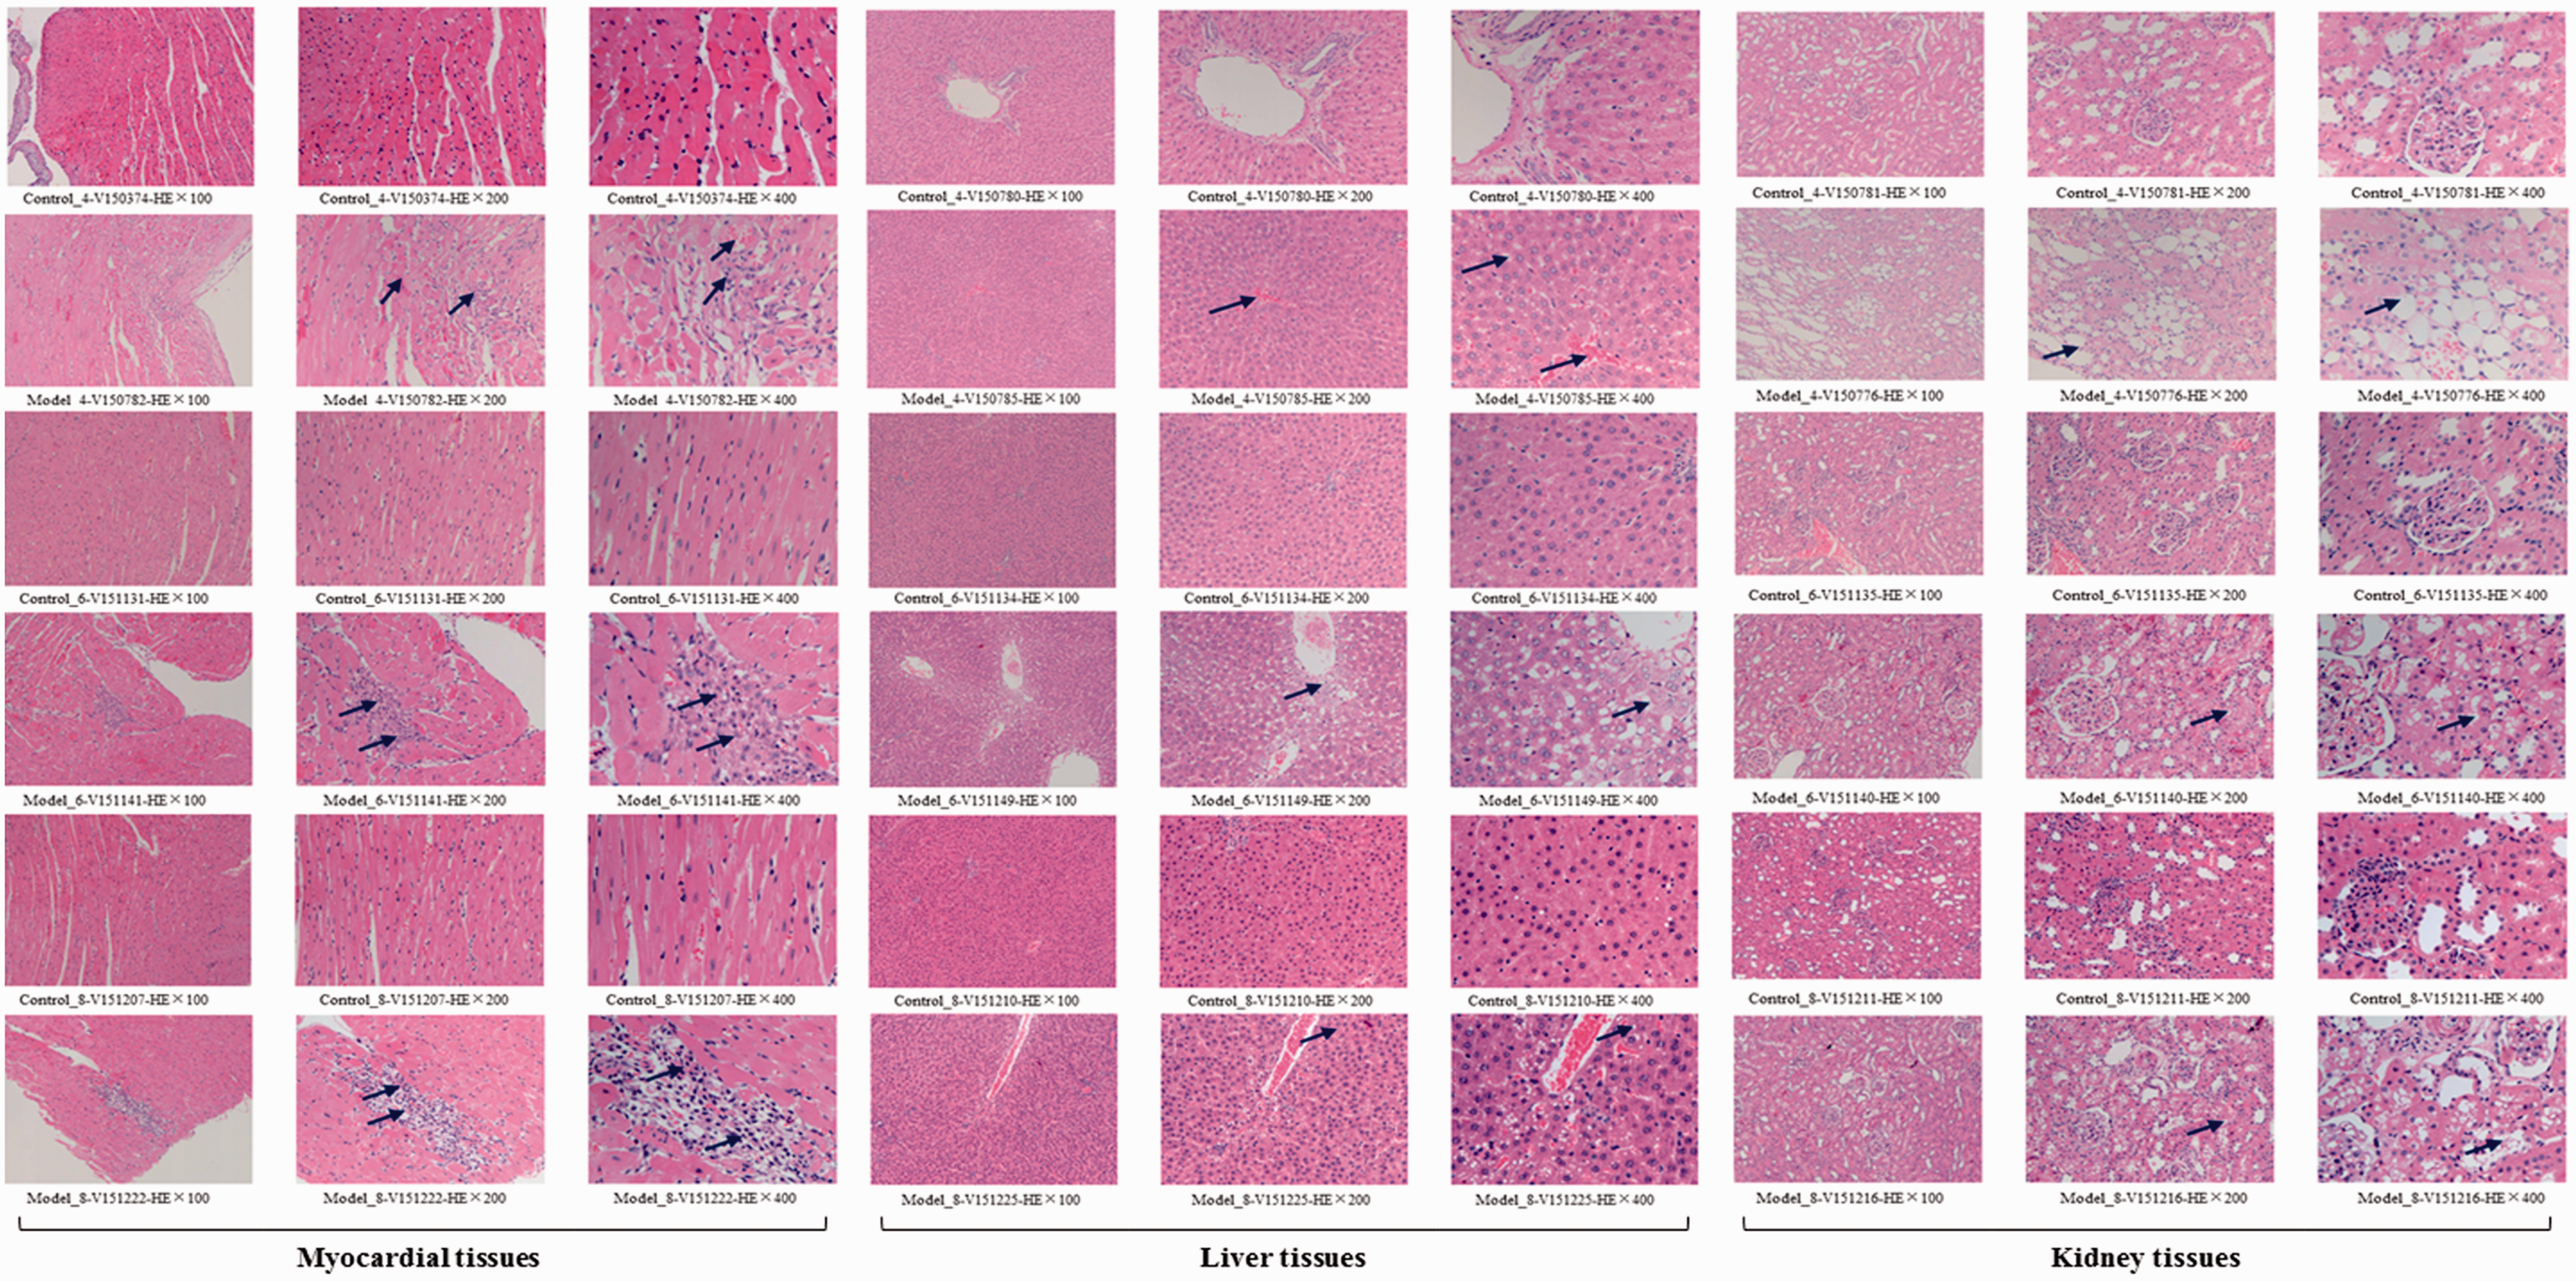
Pathological observations with hematoxylin-eosin (HE) staining on the myocardial, liver, and kidney tissues. Control_4, _6, _8: the control group at weeks 4, 6, and 8. Model_4, _6, _8: the model group at weeks 4, 6, and 8. No abnormalities were observed in the control groups at weeks 4, 6, and 8. Myocardial tissues: At week 4, partial myocardial cells (5–10%) became eosinophilic; lymphocyte infiltration (1–5%) was visible in partial myocardium; red clots were visible in the heart cavity. At week 6, partial myocardial cells (5–10%) became eosinophilic; lymphocyte infiltration (1–5%) was visible; partial myocardial cells necrosis (1–5%) appeared. At week 8, partial myocardial cells (5–10%) became eosinophilic; lymphocyte infiltration (5–10%) was visible; partial endocardia cells necrosis (1–5%) appeared. The damage of myocardial tissues aggravated with the extension of modelling time. Myocardial cell necrosis began to appear after six weeks along with the infiltration of inflammatory cells. Liver tissues: At week 4, partial liver cells (5–10%) became eosinophilic; liver cells around the central vein showed vacuolar degeneration (10–20%). At week 6, partial liver cells (10–20%) became eosinophilic; liver cells around or far away from the central vein showed vacuolar degeneration (20–30%). At week 8, focal vacuolar degeneration (30–40%) could be observed around or far away from the central vein. The damage of liver tissues aggravated with the extension of modeling time. Kidney tissues: At week 4, partial renal tubules (10–20%) expanded; partial epithelial cells in the renal tubules showed vacuolar degeneration (10–20%). At week 6, partial epithelial cells in the renal tubules of cortex showed vacuolar degeneration (30–40%). At week 8, vacuolar degeneration could be observed in the epithelial cells of the renal tubules of cortex (30–40%). The damage of kidney tissues aggravated with the extension of modeling time. Overall, the model group at weeks 6 and 8 showed similar damage degree. (A color version of this figure is available in the online journal.)
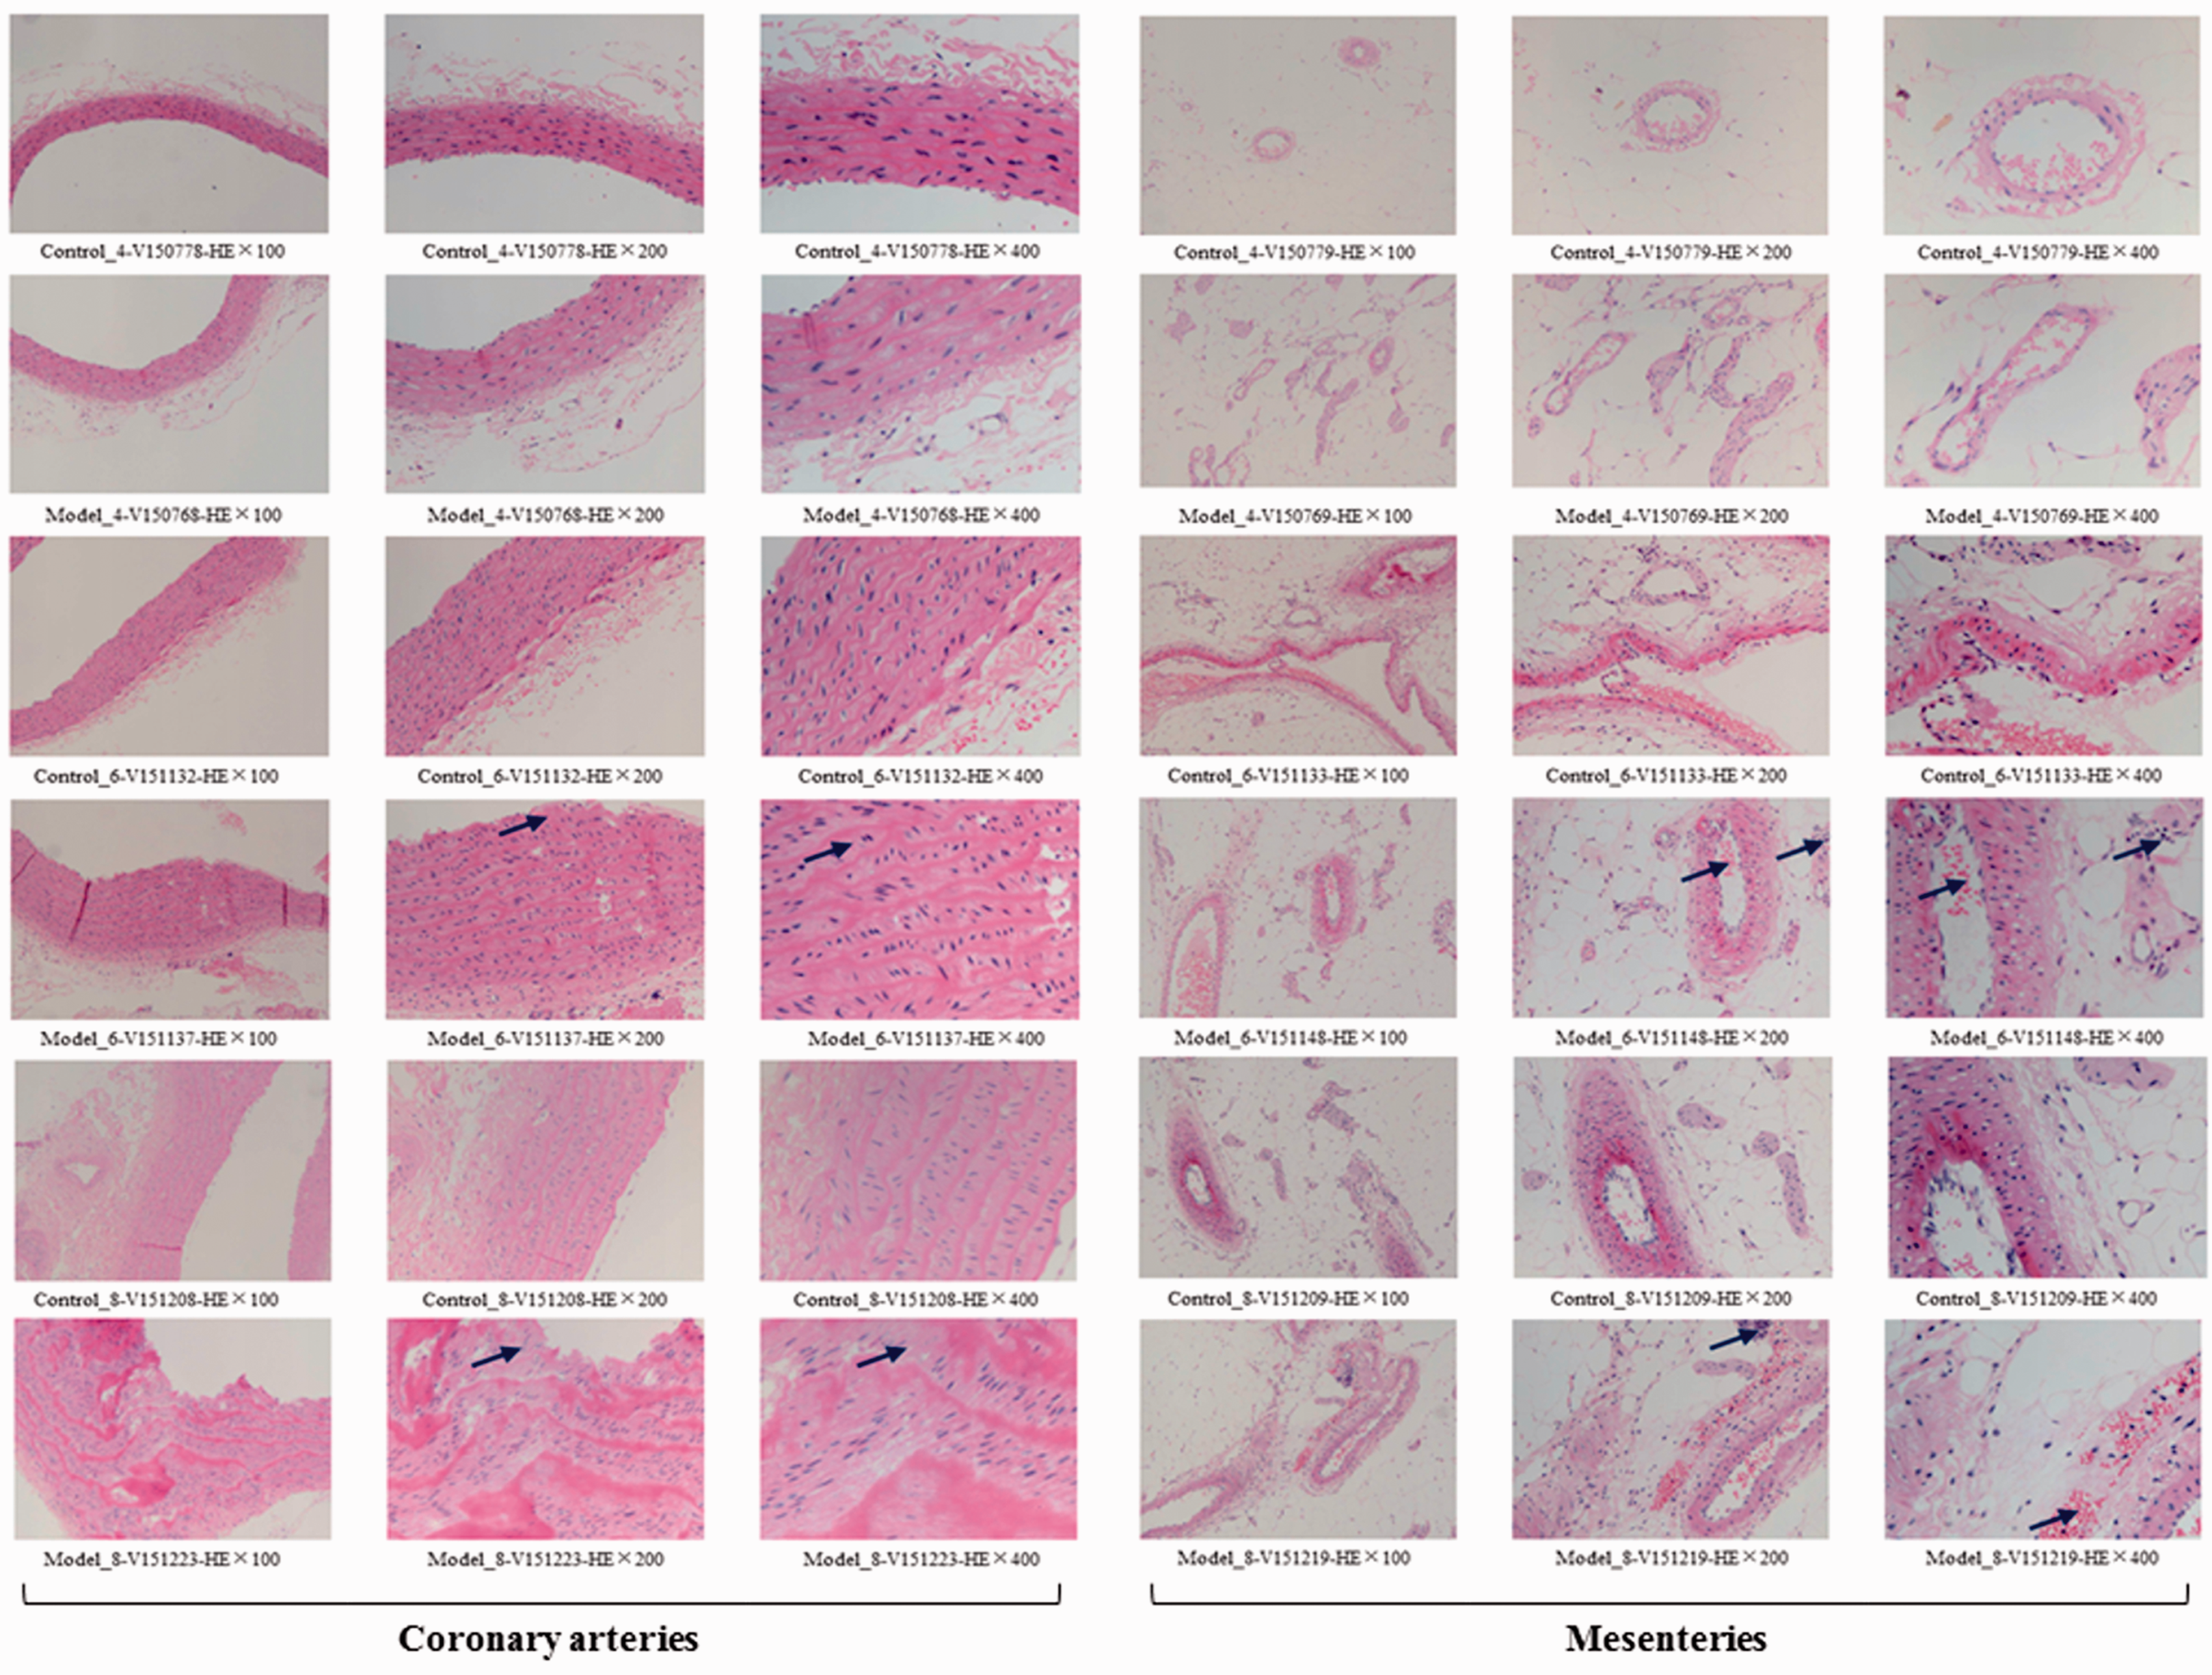
Pathological observations with hematoxylin-eosin (HE) staining on the coronary arteries and mesenteries. Control_4, _6, _8: the control group at weeks 4, 6, and 8. Model_4, _6, _8: the model group at weeks 4, 6, and 8. No abnormalities were observed in the control groups at weeks 4, 6, and 8. Coronary arteries: The model group at week 4 showed no abnormalities. At week 6, partial endothelial cells in the vascular intima were swelling (5–10%). At week 8, partial artery walls (5–10%) and smooth muscle layer (10–20%) were thickened. The damage of coronary arteries began to appear after six weeks and aggravated with the extension of modelling time. Mesenteries: The model group at week 4 showed no abnormalities. At week 6, partial capillary hyperemia (5–10%) and a small amount of lymphocyte infiltration (1–5%) were observed. At week 8, partial capillary hyperemia (10–20%) and lymphocyte infiltration (1–5%) were observed. The damage of mesenteries began to appear after six weeks and aggravated with the extension of modeling time. Overall, the model group at weeks 6 and 8 showed similar damage degree. (A color version of this figure is available in the online journal.)
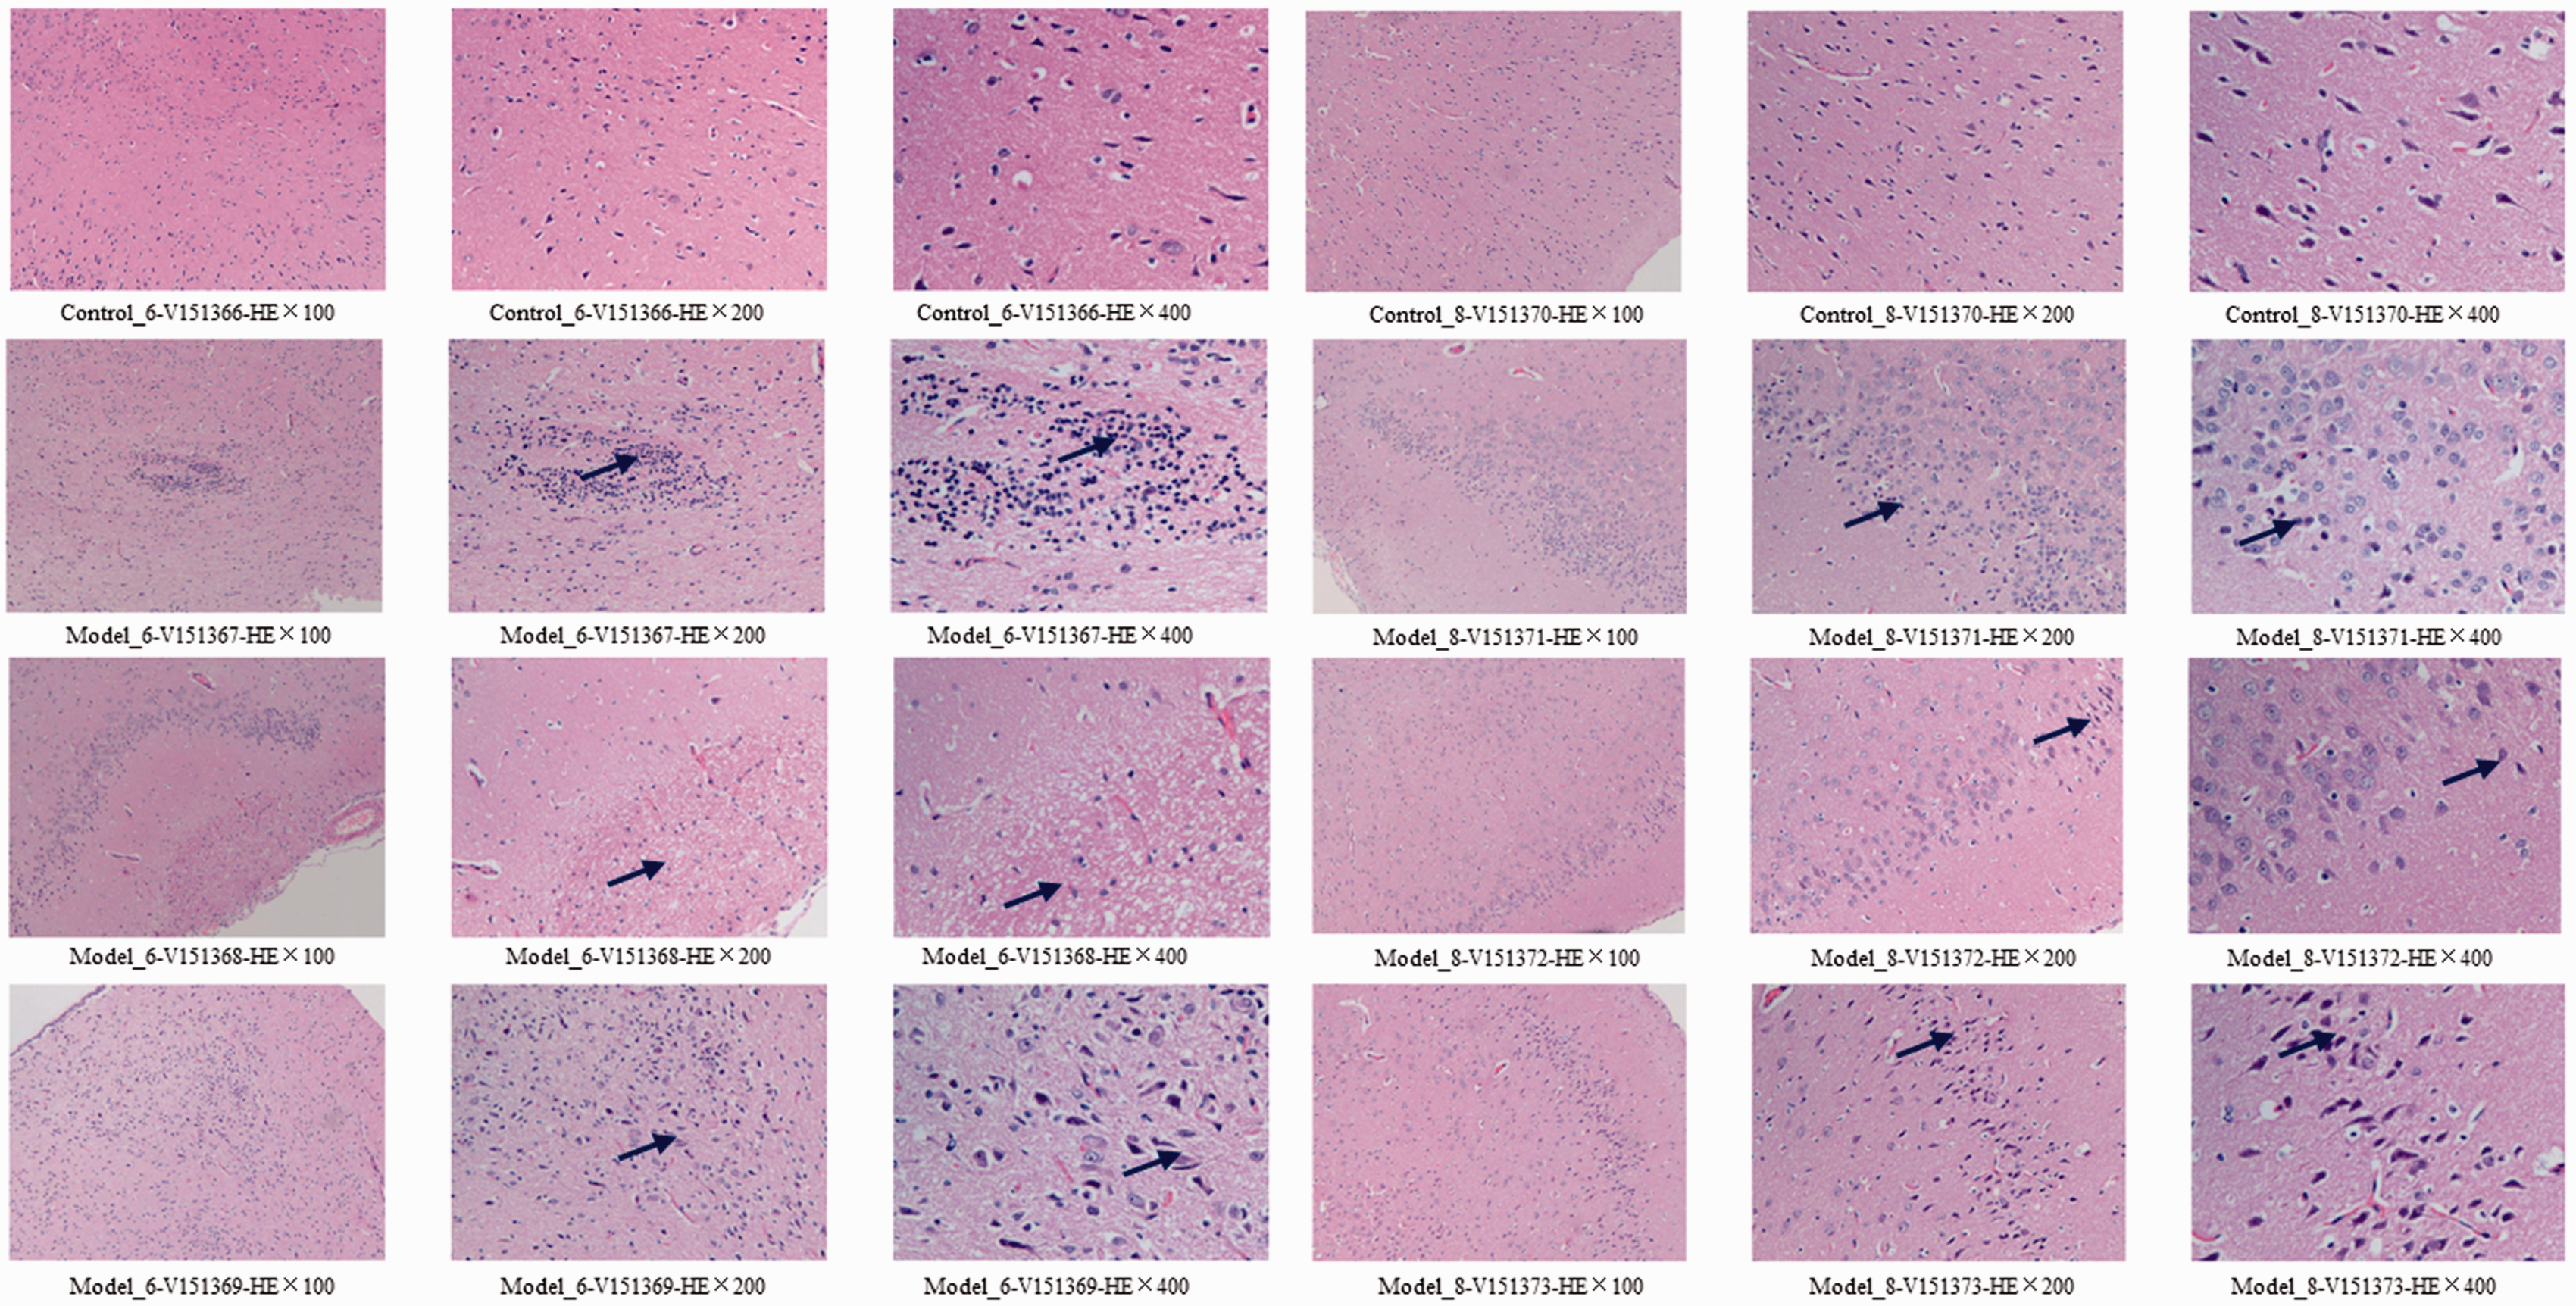
Pathological observations with hematoxylin-eosin (HE) staining on the brain tissues. Control_6, _8: the control group at weeks 6 and 8. Model_6, _8: the model group at weeks 6 and 8. Brain tissues: No abnormalities were observed in the control groups at weeks 6 and 8. At week 6, partial pyramidal cells in the cerebral cortex were degenerated (20–30%); focal lymphocytic infiltration (5–10%) appeared; focal edema (5–10%) was visible in the molecular layer of cerebral cortex; individual neurons apoptosis (1–5%) appeared. At week 8, partial pyramidal cells in the cerebral cortex were degenerated (20–30%); partial pyramidal cells degeneration (20–30%) was observed in the hippocampal CA1, CA3. The damage of brain tissues at weeks 6 and 8 showed similar damage degree. (A color version of this figure is available in the online journal.)
The difference analysis with statistical significance among the treatment groups
Six treatment groups with 44 parameter values were considered as six new variables for the statistical analysis (Table S1). Cluster analysis outputs, the same as the principal component analysis, showed that the model groups at weeks 4, 6, and 8 were obviously different from the corresponding control groups, and the model groups at weeks 6 and 8 shared high similarity (Figure 8). MD between the control and model groups increased from four to eight weeks (Table 9). GRA showed that the difference between the control and model groups was larger at week 8 than that at weeks 4 and 6 (Table 10). The statistical results illustrated obvious differences between the control and model groups.
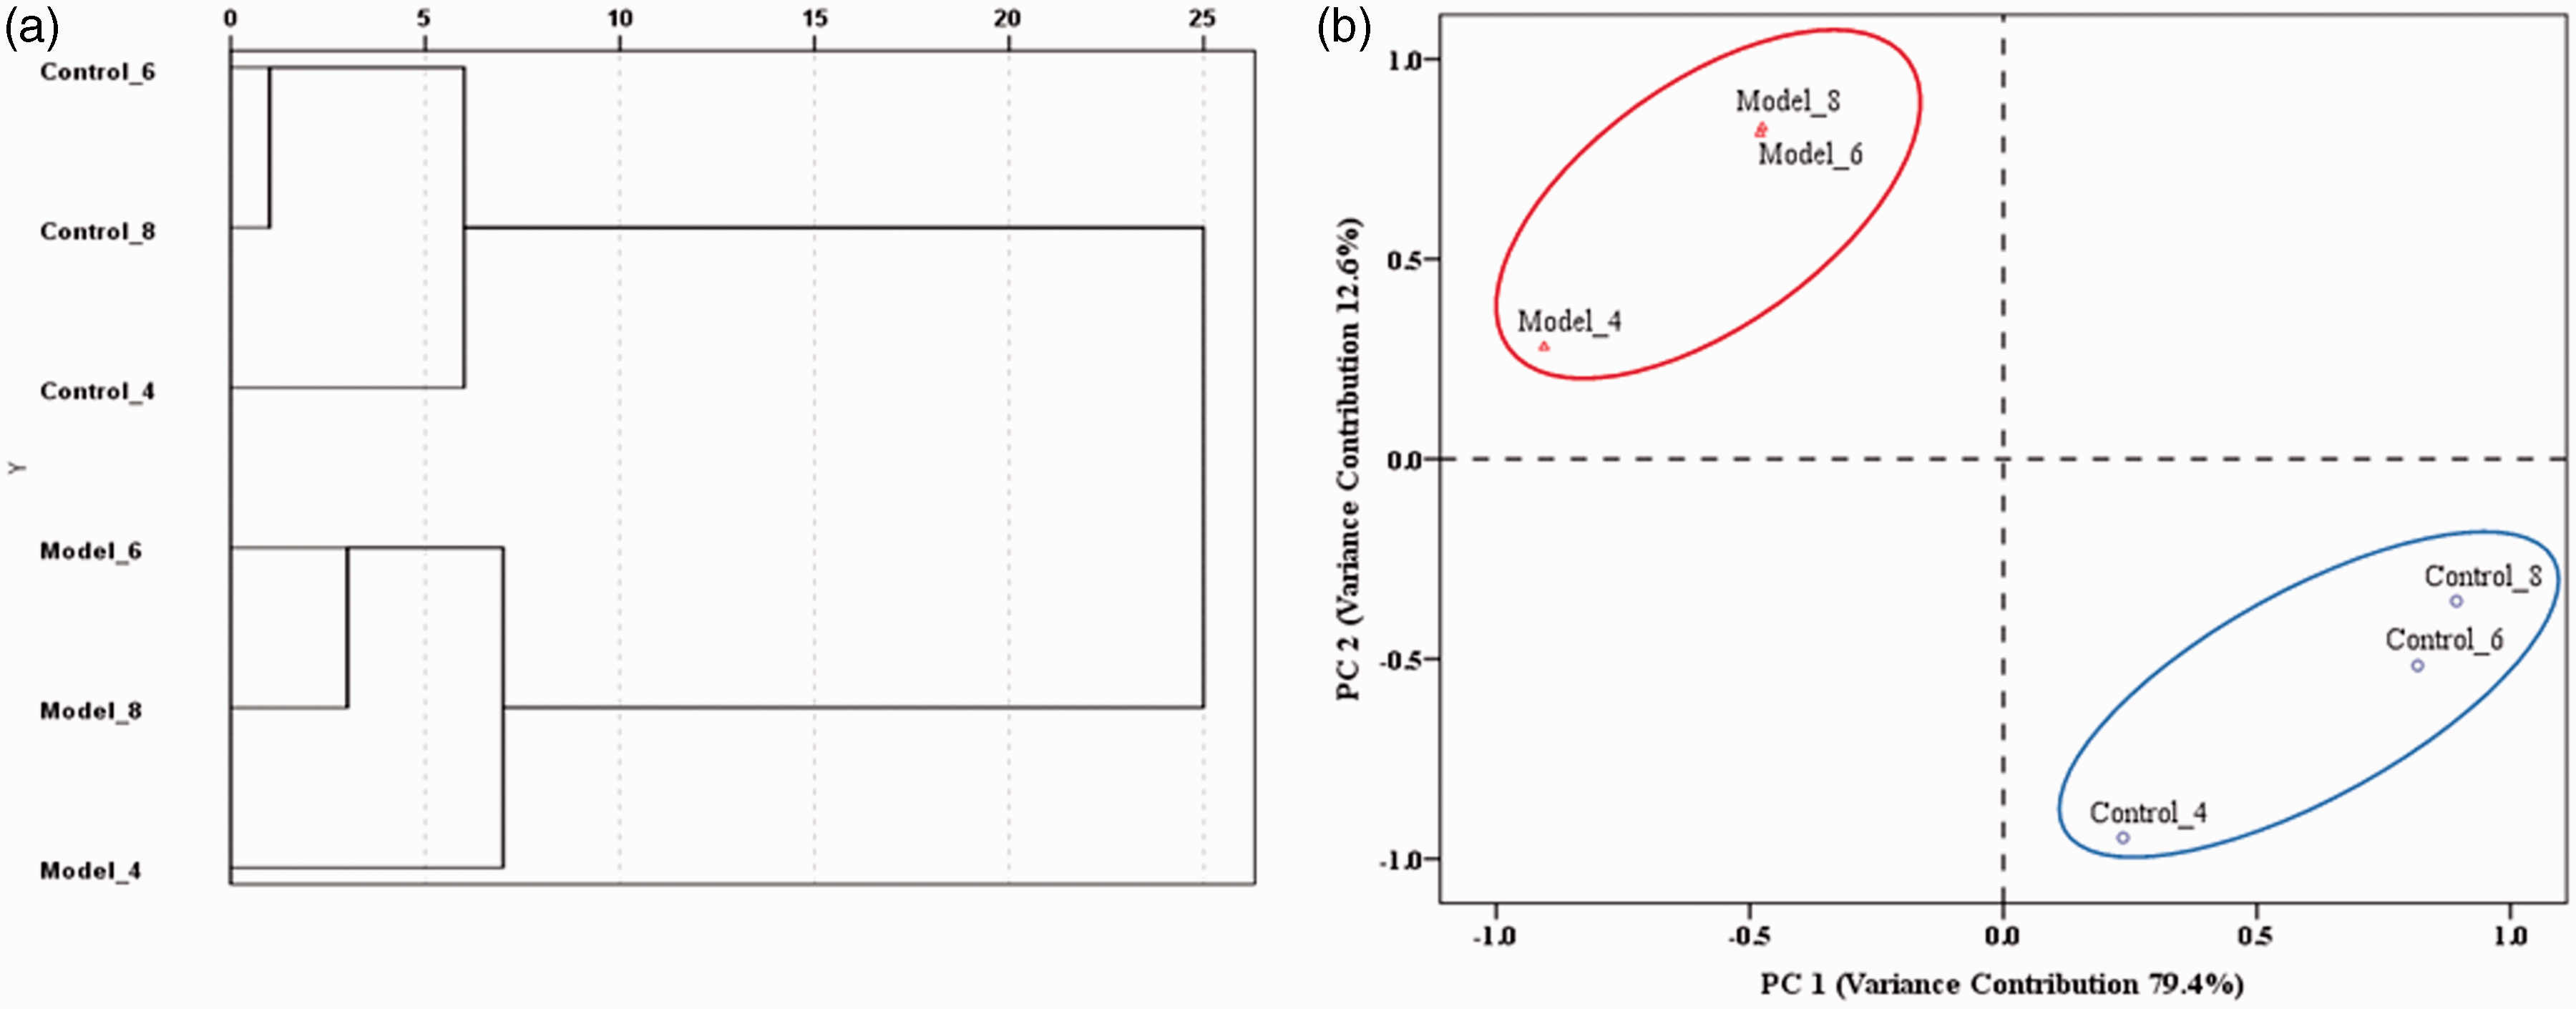
The cluster analysis (a) and principal component analysis (b) of the treatment groups at weeks 4, 6, and 8. Control_4, _6, _8: the control group at weeks 4, 6, and 8. Model_4, _6, _8: the model group at weeks 4, 6, and 8. Cluster analysis: Between-group linkage method was used as the amalgamation rule. Minkowski (first power, P=1) method was employed to calculate the distance. Principal component analysis: Two extracted principal components (PC 1 and PC 2) contributed to 92% of the total variance. (A color version of this figure is available in the online journal.)
Blood and plasma viscosity of the treatment groups at weeks 4, 6, and 8.
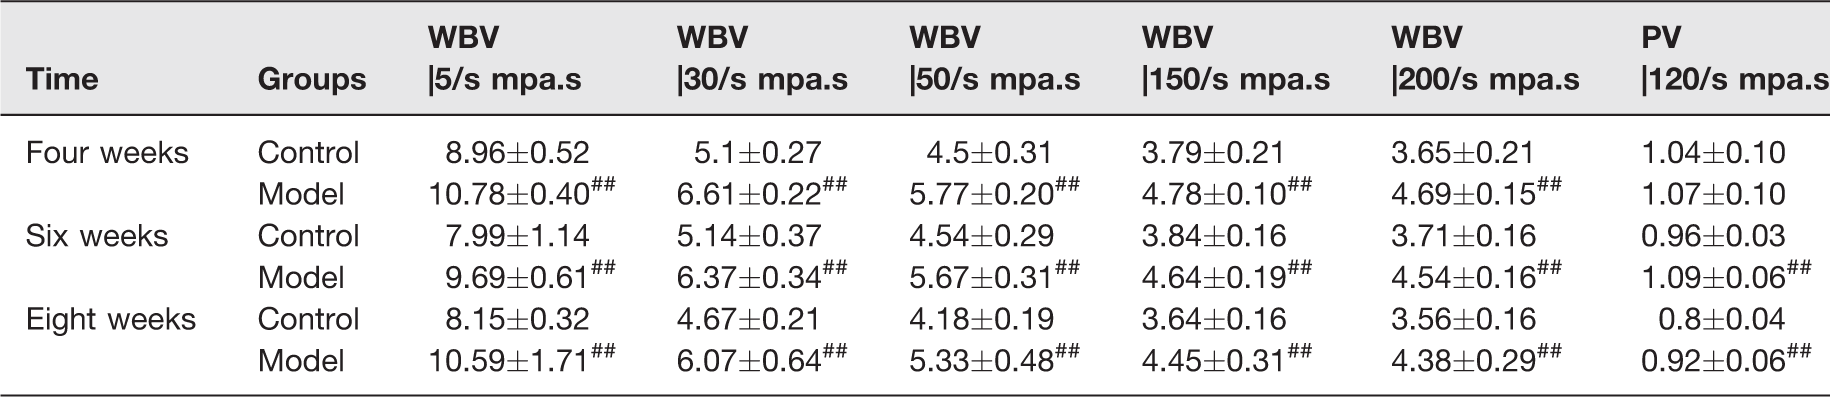
WBV: whole blood viscosity; PV: plasma viscosity.
#P < 0.05 and ##P < 0.01 vs. control group.
Differences presented by Minkowski Distance of the treatment groups at weeks 4, 6, and 8.
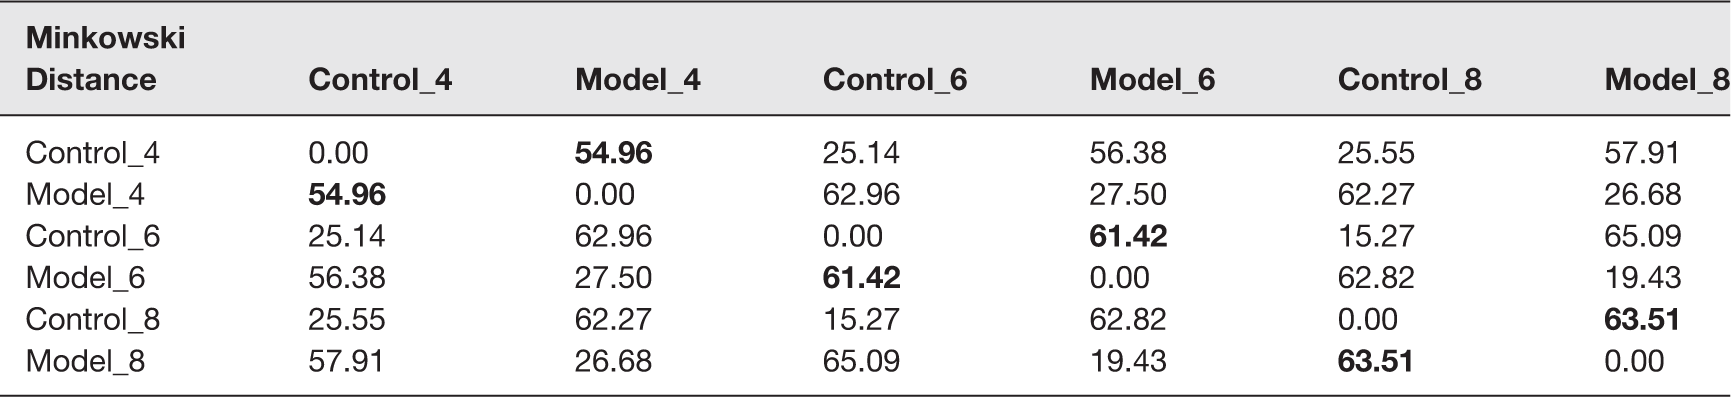
Note: Control_4, _6, _8: the control group at weeks 4, 6, and 8. Model_4, _6, _8: the model group at weeks 4, 6, and 8. Minkowski distance was calculated to the first power (P = 1).
Differences presented by GRDa of the treatment groups at weeks 4, 6, and 8.
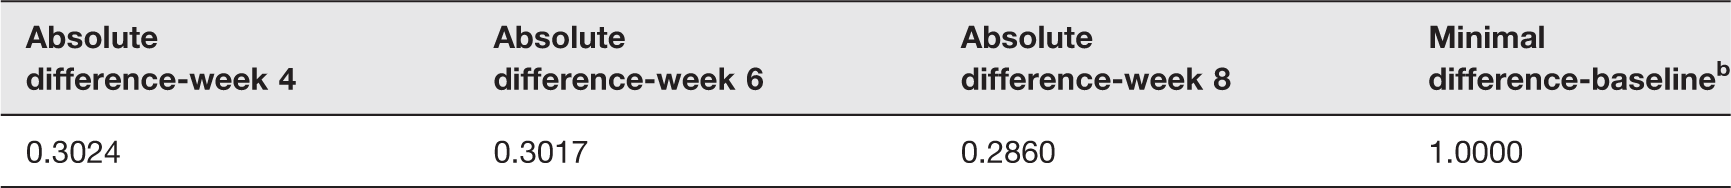
aGRD: grey relational degree. The smaller the GRD, the less the similarity to the baseline, the worse the physical conditions of corresponding treatment groups.
bThe assumption that no difference between the control and model groups at weeks 4, 6, and 8.
Discussion
In 2013, European Society of Hypertension (ESH) and European Society of Cardiology (ESC) strongly emphasized that the damage of high BP to target organs in HPC, prior to the absolute BP value, is the determining factor through the immediate depressurization. 45 In China, the frequently used intravenous medications are Sodium Nitroprusside, UrapLdil, Diltiazem, Phentolamine, Nicardipine, Normodyne, Esmolol, and Clevidipine.45–48 The most of these drugs, accordingly, can also lead to severe adverse reactions such as dizziness, nausea, and fatigue. In some cases, the clinical failures in HPC emergencies are caused by an improper or excessive medication regimen but not the illness itself. Therefore, early evaluations and observations for HPC emergencies should be testified on appropriate animal models, ahead of patients, to reduce the risks of improper medications to the lowest degree.
On the basis of the original hypertension, HPC emergencies mostly occur through some risk factors such as extreme fatigue, cold stimulation, excessive nervous, endocrine disorders, etc. These risk factors can trigger the release of endogenous vasoconstrictors to cause a sudden rise of the peripheral vascular resistance and a followed high BP. 49 Elevated BP then would induce vascular endothelial injury, and activate the coagulation factors chain and platelets. With further significant rise of BP, widespread injuries of endothelial cells and fibrinoid necrosis of small arteries come up consequently. 50 In HPC, evidence of cardiac injury or infarction, pulmonary edema, acute renal failure, stroke in the setting of acute rise in blood pressure are considered as end-organ damage.51,52 Hypertensive emergency would accompany with high mortality when it comes to end-organ involvement. 53 A recent study by Shah et al. 54 analyzed the relationship between end-organ complications and in-hospital mortality. A total of 129,914 nationwide admissions for the hypertensive emergency were included from the year 2002 to 2012 in which 630 patient deaths were reported during hospital stay. Among the patient deaths, 66.2% had acute heart failure, followed by renal failure (41.4%), neurological symptoms (21.3%), stroke (19.2%), and acute myocardial infarction (16.7%).
CK-MB mainly distributes in the myocardial tissue and specifically rises when myocardial infarction occurs, which is even more sensitive than electrocardiogram. 55 LDH, α-HBDH, ALT, and AST are also commonly used for the auxiliary examination of myocardial infarction and myocarditis. All the parameters above showed significant increase in the modeling rats. Through the HE staining, eosinophilic cells, lymphocyte infiltration, and even endocardia cells necrosis were visible in partial myocardium. Red clots were seen in heart cavity. The results indicated the severe myocardial ischemia and cardiac dysfunctions. Significant decrease of Na+-K+ ATPase and Ca2+-ATPase showed abnormal energy metabolism of myocardial cells.56–58 It was reported that long-term high-fat diet for SHR would irreversibly cause cardiac abnormalities like myocardial fibrosis and hypertrophy. 22 In the modeling rats, myocardial ischemia with abnormal energy metabolism led to an insufficient heart pump, resulting in the circulation disorders.
Serum enzymes, such as ALP, ALT, and AST, would sensitively increase when liver cells are injured or necrotic.59,60 In the modeling rats, ALP significantly increased as much as twice, ALT was 4 times, while AST was even more than 10 times. Through the HE staining, 30% of the liver cells became eosinophilic and showed vacuolar degeneration. Large scale damage of liver cells caused severe liver dysfunctions in both the secretion and synthesis as evidenced by the significant increase of TBIL and TP. High serum K+ is mainly caused by renal failure. 61 Low serum Na+ occurs in the encephaledema, intracranial hypertension, and especially renal failure.62,63 Unusual high levels of Cr, Ur, and UA showed the dysfunctions in glomerular filtration and renal tubular secretion. Long-term high-fat diet feeding caused an over accumulation of adipose in kidney; 30%–40% of the epithelial cells in the renal tubules of cortex showed the vacuolar degeneration, which further worsened the renal damage.
Adr can bind both the alpha (α) and beta (β) type adrenergic receptors. Subcutaneous injection of excessive Adr is very dangerous especially for the patients with hypertension or cerebral diseases. 64 Over activation of β1 receptors would increase the myocardial oxygen level that might result in ischemia, arrhythmia, and even ventricular fibrillation. 65 Cardiac loads rise sharply and finally turn into heart failure. On the other hand, when α1 receptors are over activated, a wide range of skin and mucosa vessels will consequentially contract, as well as the small vascular in many internal organs especially in the kidney. 66 As an acute vasoconstriction-stress, subcutaneous injection of over dose Adr could induce a sharp rise of SBP, which increased the risks of brain hyperemia. Hence, in the modeling rats, 20%–30% of the pyramidal cells in the cerebral cortex were degenerated. Focal lymphocytic infiltration, edema, and 1%–5% individual neurons apoptosis appeared.
RAAS plays an important role in maintaining fluid balance and reducing tissue injury. 67 In HPC emergencies, suddenly impacts of the boosted BP would exceed the adjusting ability of RAAS itself. 68 At weeks 6 and 8, the modeling rats showed significantly declining PRA, reduced serum Na+, increased serum K+, and a compensatory rise of ALD (five to eight times). Inadequate cardiac outputs compelled the over activation of RAAS, leading to the rise of ALD level. Overmuch ALD accelerated the reabsorption of water and Na+ and further raised the BP. ALD could suppress NO release to injure the vascular endothelial functions. 69 The excess of ALD would also influence the remodeling of myocardium and vascular smooth muscle to induce ventricular-vascular stiffness, which worsened the heart dysfunctions.70,71 Therefore, the sensitivity of RAAS to a sudden raised BP was closely associated with the supervening damage consequences of heart, kidney, and vascular. In clinic, when high BP, high ALD, and low PRA exist simultaneously, ALD inhibitors should be considered in priority to control the BP.
Evidenced by the abnormal hemorheology and disordered blood coagulation system, 38 the combination of Adr and ice-bath would induce a sluggish of blood circulation.72,73 High-fat diet feeding could also add the intrinsic resistance to blood flow. In the modeling rats, both WBV and PV significantly increased at weeks 6 and 8. Activated FX (FXa) can turn prothrombin into thrombin in the presence of Factor V, Ca2+, and phospholipid. The result of significant shortened PT might be caused by the significant increased FX: C, but not the FII: C because FII: C showed no obvious changes. An obviously higher Fib was also detected, and they would be cleaved into more fibrin to increase the blood viscosity. ATIII can effectively inhibit thrombin and FXa. ATIII was significantly increased at week 4. Yet at weeks 6 and 8, ATIII decreased significantly due to the excessive consumption and reduced liver synthesis. 74 Consequently, the out-of-balance coagulation and anti-coagulation system accounted for the blood hypercoagulability and led to the severe blood circulation disorders. The damaged liver could not produce enough endogenous clotting factors such as XII, XI, IV, IX, and VIII,75,76 which might be associated with the prolonging of APTT as observed. Through the HE staining, no abnormalities in the coronary arteries and mesenteries were observed in the modeling rats at week 4. While after six weeks, endothelial cell swells and smooth muscle layer thickening could be seen in the coronary arteries. Capillary hyperemia and lymphocyte infiltration were visible in the mesenteries. These observations indicated that the modeling rats had some self-regulation ability to resist the vascular damages before four weeks. However, suffering from the long-term lipid accumulation and blood hypercoagulability, blood vessels consequentially got injured to different degrees at weeks 6 and 8.
LDL-CH and CHOL were significantly increased at weeks 4, 6, and 8. HDL-CH showed an obvious rise at week 4, yet decreased significantly at weeks 6 and 8, indicating that the modeling rats could not eliminate excess cholesterol in blood after four weeks. Interestingly, TG, which was supposed to increase, showed a significant reduction instead. It could be explained in three aspects. Firstly, the modeling rats were severely malnourished and not able to absorb TG. Secondly, the injured liver could not excrete TG timely to cause the excessive accumulation of TG in liver. 77 Thirdly, the energy metabolism disorders in multi-organs led to an excess decomposition of blood TG. Currently, there are no direct evidences to support the specific relation between high-fat diet feeding and BP elevation in SHR. However, some studies have reported that feeding high-fat diet to SHR would worsen the heart and kidney failure, induce vascular endothelial damage, and cause the hyperlipidemia and nonalcoholic fatty liver.22–26,78–80 According to the pathological observation, the damage of excess fat was very evident, especially in the liver and kidney where as high as 40% of the cells showed vacuolar degeneration.
HPC emergencies are associated with a sudden elevation of reactive oxygen species (ROS), and also with an impairment of endogenous antioxidant mechanisms. 81 Large amount of ROS would change the oxidative and inflammation stress, which worsen the damage to multiple tissues. Anti-oxidative capacity in the modeling rats declined significantly as evidenced by the significantly lower T-AOC, SOD, GSH-PX, and an obviously higher MDA. MPO, a member of the peroxidase family, emerges as a major player in the development of atherosclerotic cardiovascular diseases.82,83 MPO showed no differences at weeks 4 and 6 but appeared to increase significantly at week 8. This was consistent with the vascular observation results that the coronary arteries and mesenteries showed no obvious damage at weeks 4 and 6 but appeared large-scale injuries at week 8. TNF-α induces the production of inflammatory mediators (e.g. IL-1, IL-6, etc.) and promotes the migration of inflammatory cells. IL-8 possesses diverse functions and participates in the chemotaxis of neutrophils, T cells, and basophils.84,85 In the modeling rats, the sudden ice-bath stimulation activated the acute inflammatory responses as evidenced by the significantly increased TNF-α and IL-8, and the observed lymphocytic infiltrations in multiple organs including brain, heart, liver, kidney, and blood vessels.
Overall, the sharp rise of BP and multi-organ dysfunctions could be observed at week 4, and the vascular injuries began to appear from six weeks. Until week 8, the modeling rats underwent severe multi-organ damages with the mortality rate reaching to 20%. Abnormal oxidative stress, activated inflammatory responses, and disordered blood circulation had always existed through the whole modeling time. Based on all the 44 parameters, a further statistical comparison among different treatment groups was conducted. The compared results indicated that the model groups at weeks 4, 6, and 8 were obviously different from the corresponding control groups, and the model groups at weeks 6 and 8 shared high similarity. The total damages aggravated with the extension of modeling time. Therefore, to fit the clinical manifestations of HPC emergencies and avoid high mortality rate, six-week modeling time was appropriate.
Conclusions
High-fat diet feeding (six week) followed by an acute vasoconstriction-stress induced severe multi-organ damages in SHR. In the modeling rats, multiple syndromes, which were similar to those in HPC emergencies, including encephalopathy, heart dysfunctions, hepatic and renal dysfunctions, and blood system disorders, were experimentally testified through the detections of 44 biochemical parameters and the pathological observations of 6 tissues. As simple, economical, and highly similar, this proposed model would have a wide application prospects in the early intervention of HPC emergencies including the controls of possible risk factors and assessments of efficient therapies.
Footnotes
Authors’ contributions
All authors participated in the design, interpretation of the studies, analysis of the data, and review of the manuscript. YHL, LCF, and LH conceived and designed the experiments. LH, ZWJ, LYY, ZX, CTB, and BC performed the experiments. LH and LPB analyzed the data and wrote the manuscript. SWW and WZ helped perform the analysis with constructive discussions. ZYY produced the figures. YZH prepared the reagents and materials.
Declaration of Conflicting Interests
All the authors involved in this research have no competing interests in the submission of this manuscript. All the materials were exclusively for our experiments and did not represent any commercial company's interests. There was no financial support from commercial companies. There are no patents, products in development or marketed products to declare. This information does not alter our adherence to all the Experimental Biology and Medicine policies on sharing data and materials.
Funding
This work was supported by the grants of Secondary Development Projects of Traditional Chinese Herbal Formula Compound Xueshuantong Capsule (2017-No.19), Preclinical Study of Radix Ophiopogonis Oligosaccharides Against Type 2 Diabetes As A New Chinese Medicine Drug with Independent Intellectual Properties (2013A022100022), Preclinical Study of A New Chinese Medicine Drug to Treat Diabetes (201704020119), and Secondary Development and Post-Marketing Re-Evaluation of Kouyanqing Granule (2018). The funders had no role in the study design, data collection and analysis, decision to publish, or preparation of the manuscript.
References
Supplementary Material
Please find the following supplemental material available below.
For Open Access articles published under a Creative Commons License, all supplemental material carries the same license as the article it is associated with.
For non-Open Access articles published, all supplemental material carries a non-exclusive license, and permission requests for re-use of supplemental material or any part of supplemental material shall be sent directly to the copyright owner as specified in the copyright notice associated with the article.