
Abstract
We have developed a multimodal imaging system, which integrated optical resolution photoacoustic microscopy, optical coherence tomography, optical coherence tomography angiography, and confocal fluorescence microscopy in one platform. The system is able to image complementary features of a biological sample by combining different contrast mechanisms. We achieved fast imaging and large field of view by combining optical scanning with mechanical scanning, similar to our previous publication. We have demonstrated the capability of the multimodal imaging system by imaging a mouse ear in vivo.
Impact statement
Photoacoustic microscopy-based multimodal imaging technology can provide high-resolution complementary information for biological tissues in vivo. It will potentially bring significant impact on the research and diagnosis of diseases by providing combined structural and functional information.
Keywords
Introduction
Many complex diseases are associated with changes in multiple biomarkers reflecting different pathologies indicating progression of the specific disease at different stages.1,2 It is necessary to examine each biomarker to pinpoint comprehensive disease-related information for disease diagnosis and research. Thus, an imaging technology that can reveal different biomarkers and acquire registered images simultaneously is desired. Biomedical optical imaging technologies, such as photoacoustic microscopy (PAM),3,4 optical coherence tomography (OCT),5,6 optical coherence tomography angiography (OCTA),7–10 and confocal fluorescence microscopy (CFM)11,12 are powerful microscopic imaging tools based on different contrast mechanisms. Each of these optical imaging technologies can only provide specific information of biological tissues limited by the optical contrast that each can offer. For instance, the optical contrasts of PAM, OCT, OCTA, and CFM are based on different optical properties of biological tissues: optical absorption, back-scattering, motion of scatters, and fluorescence of endogenous or exogenous fluorophores, respectively. Multimodal imaging techniques13–16 can overcome such limitations by providing complementary contrasts for imaging. In our previous publications,17,18 we reported a simultaneous multimodal imaging platform, which integrated PAM, OCT, CFM, and optical Doppler tomography (ODT) 18 to offer multimodal multi-contrast imaging of biological tissues in vivo.
In the current study, we investigated the feasibility of integrating the OCTA function to our multimodal imaging platform. OCTA is a clinically significant branch of OCT for non-invasive imaging of the microcirculation in vivo. OCTA has been used in preclinical and clinical research for studying various diseases in several medical areas such as dermatology, 19 gastroenterology, 20 cardiology, 21 and neurology. 22 The system is thus able to provide absorption, scattering, fluorescence, Doppler, and motion contrast in one platform.
Methods
Imaging system
We updated our previously reported multimodal imaging system 17 for the current study by changing the CCD camera of the OCT spectrometer to significantly increase the OCT imaging speed to a line rate of up to 70 kHz. Figure 1 shows a schematic of the imaging system. Details of the imaging system can be found in our previous publications.17,18 In brief, a broadband superluminescent diode-based near-infrared (NIR) light source (T-840 Broadlighter, Superlum Diodes Ltd, Ireland) and a Q-switched frequency-doubled Nd:YAG laser (SPOT-10–200-532, Elforlight Ltd, wavelength: 532 nm, maximum pulse energy: 20 µJ, pulse duration: 2 ns, maximum pulse repetition rate (PRR): 30 kHz) were used for OCT/OCTA and PAM/CFM, respectively. The NIR and visible light were combined by a dichroic mirror and scanned together by a X-Y galvanometer scanner. The light was focused onto a sample by an objective lens (Microspot focusing objectives, LMH-5X-532, EFL= 40 mm, NA = 0.13, Thorlabs). The back-scattered NIR light from the sample was collected by the objective lens, combined with the reflected light in the reference arm, and detected in the spectral domain by a home-made spectrometer. To make the system suitable for OCTA, we improved the OCT imaging speed by using a fast CCD camera in the spectrometer (Aviiva-EM4-CL-2014, 2048 pixels with 14 µm pixel size operating in 12-bit mode, e2V). The spectrometer used a 1200 lines/mm transmission grating and a multi-element imaging lens (f = 150 mm).
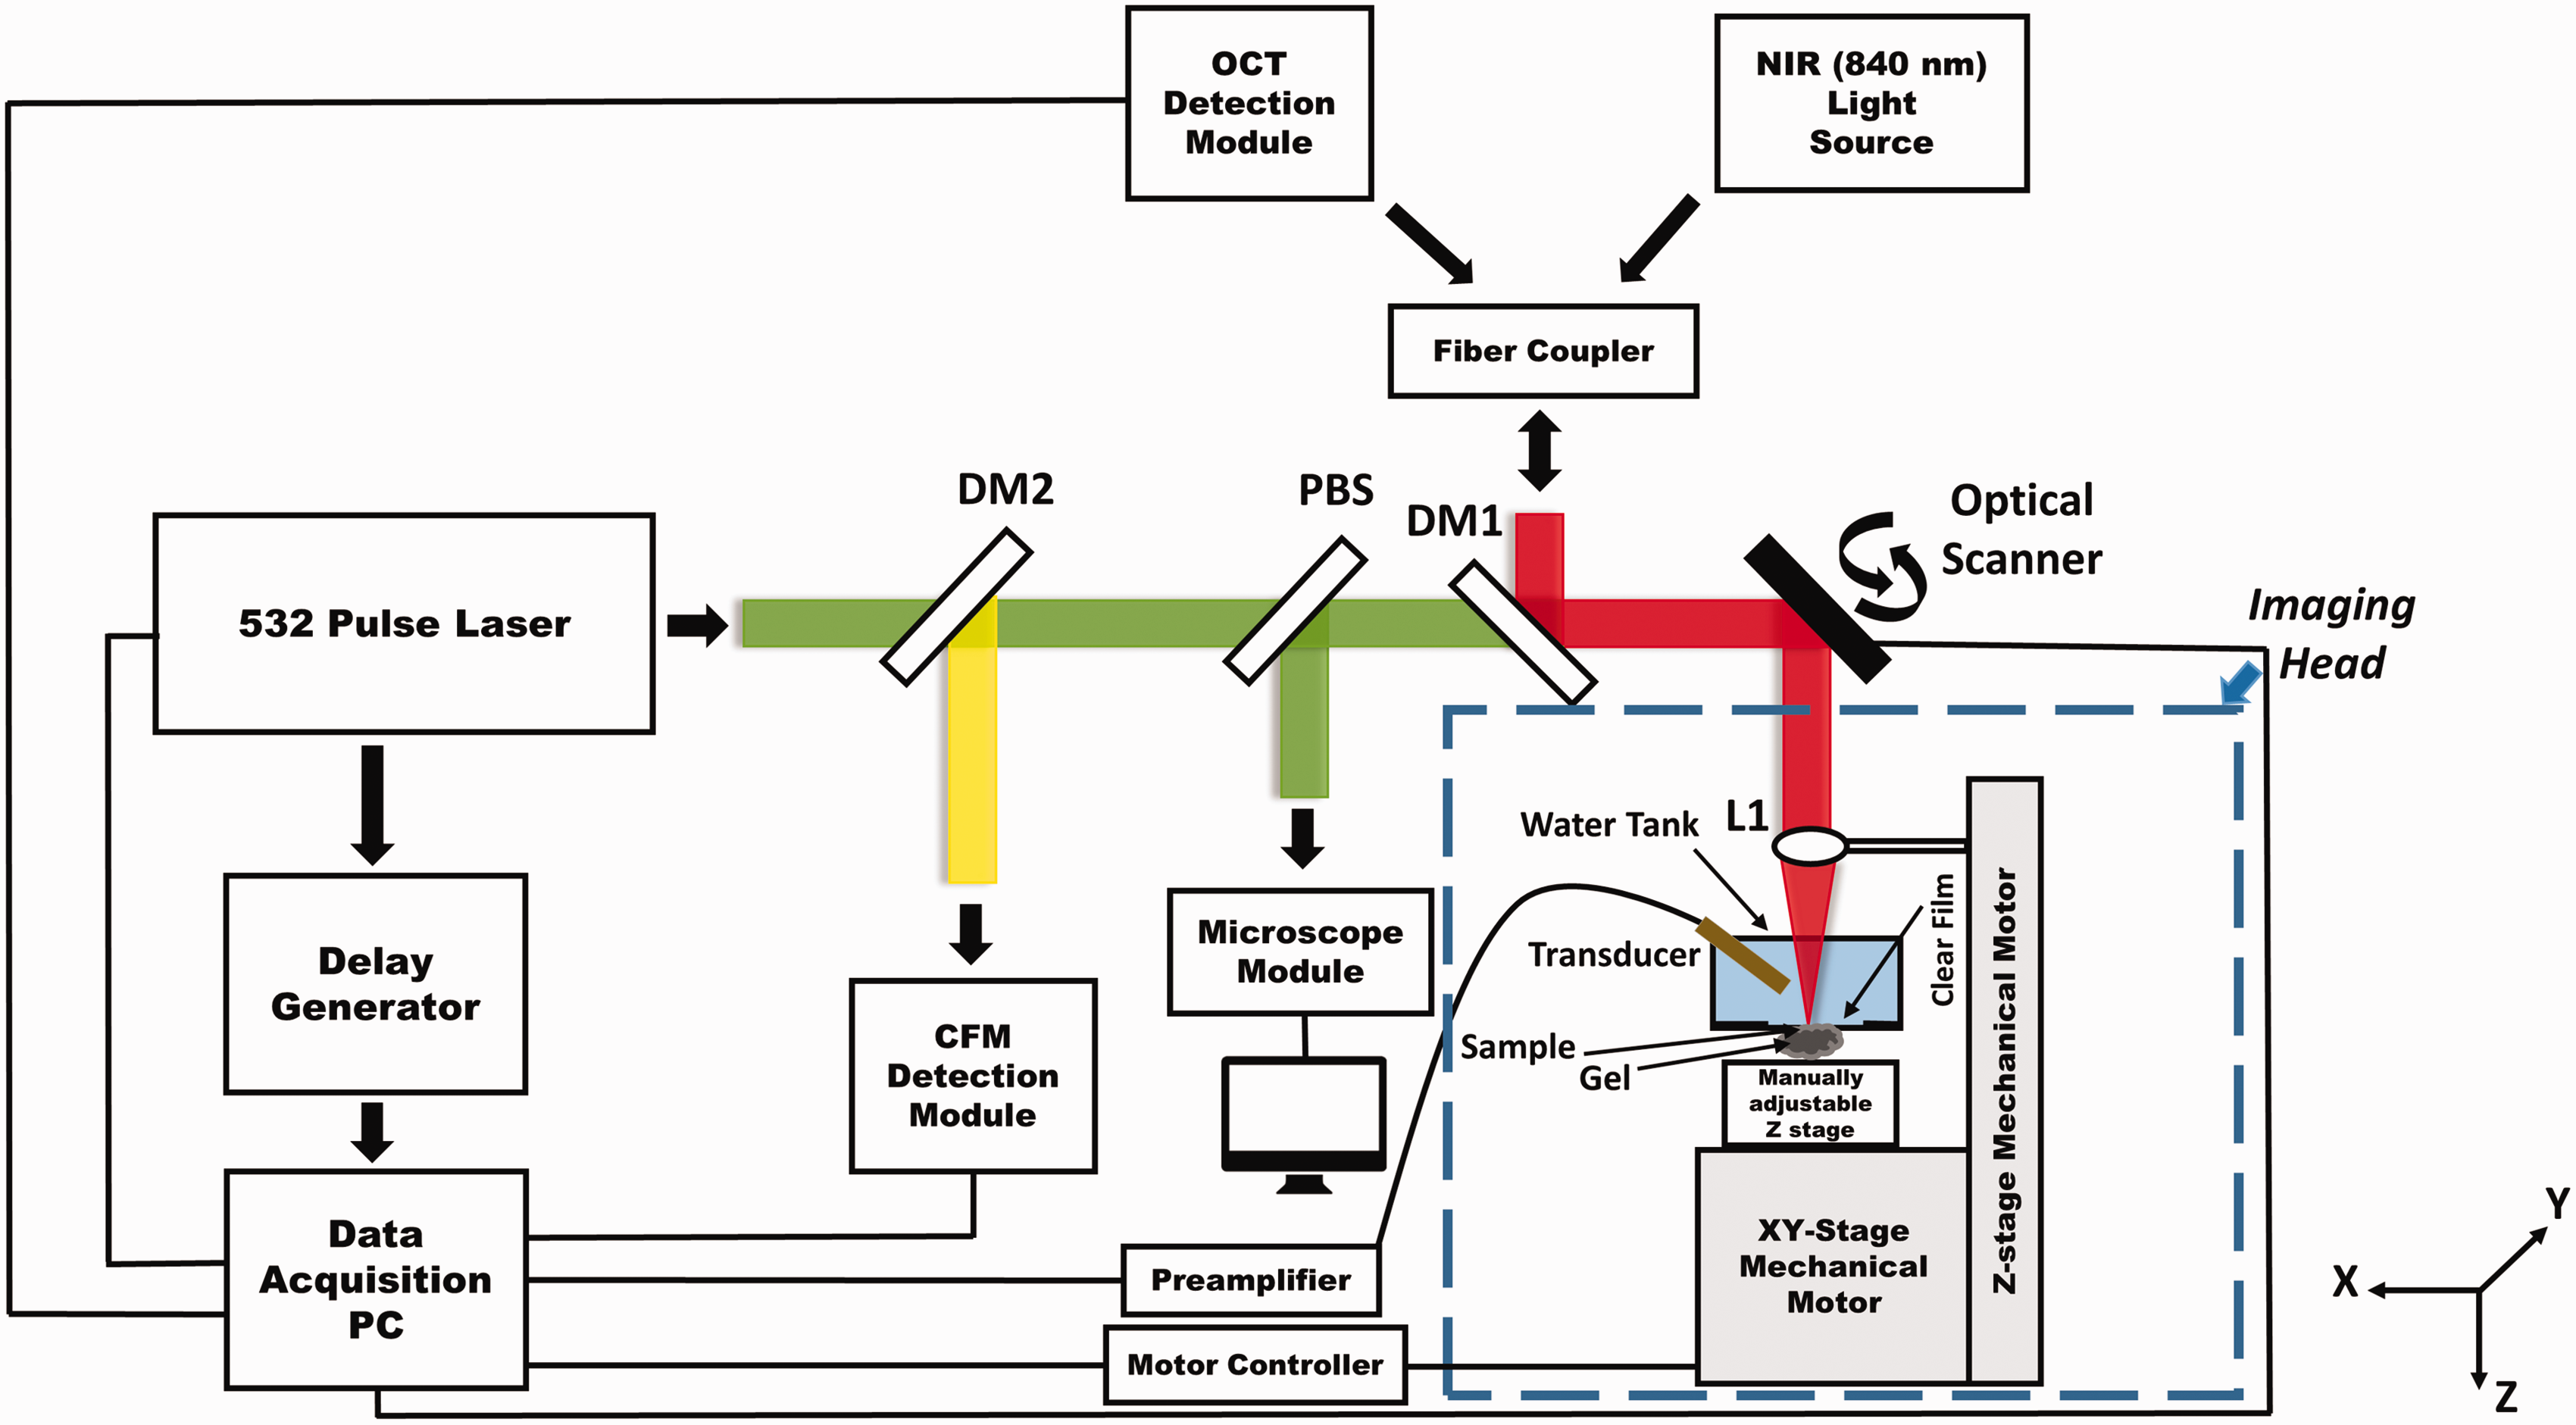
Schematic of the integrated PAM/OCT/CFM/OCTA multimodal imaging platform. L1: Objective lens; DM1, DM2: Dichroic mirror; PBS: Pellicle beam splitter. (A color version of this figure is available in the online journal.)
The photoacoustic signal was detected by a 30 MHz unfocused small footprint ultrasonic transducer immersed in a water tank filled with deionized water. The water tank has a window at the bottom sealed with polystyrene film. For PAM imaging, the sample was attached to the window through ultrasound coupling gel. The fluorescence signal excited by the 532 nm laser pulse was also collected by the objective lens and detected by a PMT with the combination of a set of filters and a pinhole.
We combined optical scanning with mechanical scanning to achieve large field of view (FOV). Mechanical scan was accomplished by using a step-motor driven platform (UniSlide, Velmex, Inc.) to scan the sample together with the water tank in the X and Y directions. Dynamic focusing was accomplished by using a motorized stage to adjust the objective lens in the Z direction.
For multimodal imaging, we performed OCTA separately before or after acquiring the combined OCT, PAM, and CFM images due to the differences of the imaging speed. The maximum imaging speed of PAM and CFM is 24 kHz determined by the PRR of the pulsed laser, which can be improved by using a laser with higher PRR. The performance of all the sub-imaging systems, including lateral and axial resolutions is reported in our previous studies. 18
OCT angiography algorithm
For OCTA imaging, each cross-sectional scan (B-scan) was repeated four times at each spatial location of the sample. Each B-scan consisted of 512 depth scans (A-lines). The scanning rate of 40 kHz was selected for in vivo mouse ear imaging. Over the years, numerous OCTA algorithms were developed,
23
which have been successfully applied to different in vivo samples for visualization of the vasculature, such as speckle variance,
24
phase variance,
25
correlation mapping,
26
split-spectrum amplitude-decorrelation,
27
and optical microangiography.
28
We used an algorithm similar to the improved speckle-contrast OCTA (ISC-OCTA)
29
to calculate the OCTA signal in the current study. The amplitude of the raw OCT signals was extracted from each of the four B-scans and the speckle contrast image


Results
We validated the performance of the proposed multimodal imaging system by imaging a mouse ear in vivo. We first imaged a large area of a mouse ear by using the combined optical scanning with mechanical scanning to demonstrate the capability of the OCTA function with large FOV. All animal procedures were conducted following the protocol approved by the Florida International University’s Institutional Animal Care and Use Committee.
Figure 2 shows the OCTA image of a mouse ear with a FOV of 12 mm × 12 mm. Before imaging, the mouse was anesthetized by intraperitoneal injection of a cocktail containing ketamine (54 mg/kg body weight) and xylazine (6 mg/kg body weight). Then, the animal was restrained in an animal mount secured on the manually adjustable Z-axis stage, which was mounted on the X-Y motorized stage. The NIR light was scanned within the aperture of the objective lens by the fast galvanometer scanner to acquire the OCT signals for OCTA imaging. The sample was then moved to the neighboring imaging area by the mechanical scanner. This procedure was repeated until the entire region of interest (ROI) was imaged. Each fast imaging area consisted of 512 × 128 A-lines covering an area of 2 mm × 2 mm contributing to the final large FOV of 12 mm × 12 mm. The entire image acquisition took about 9 min. The OCTA images of all the fast scanned areas were stitched together to generate the final image.
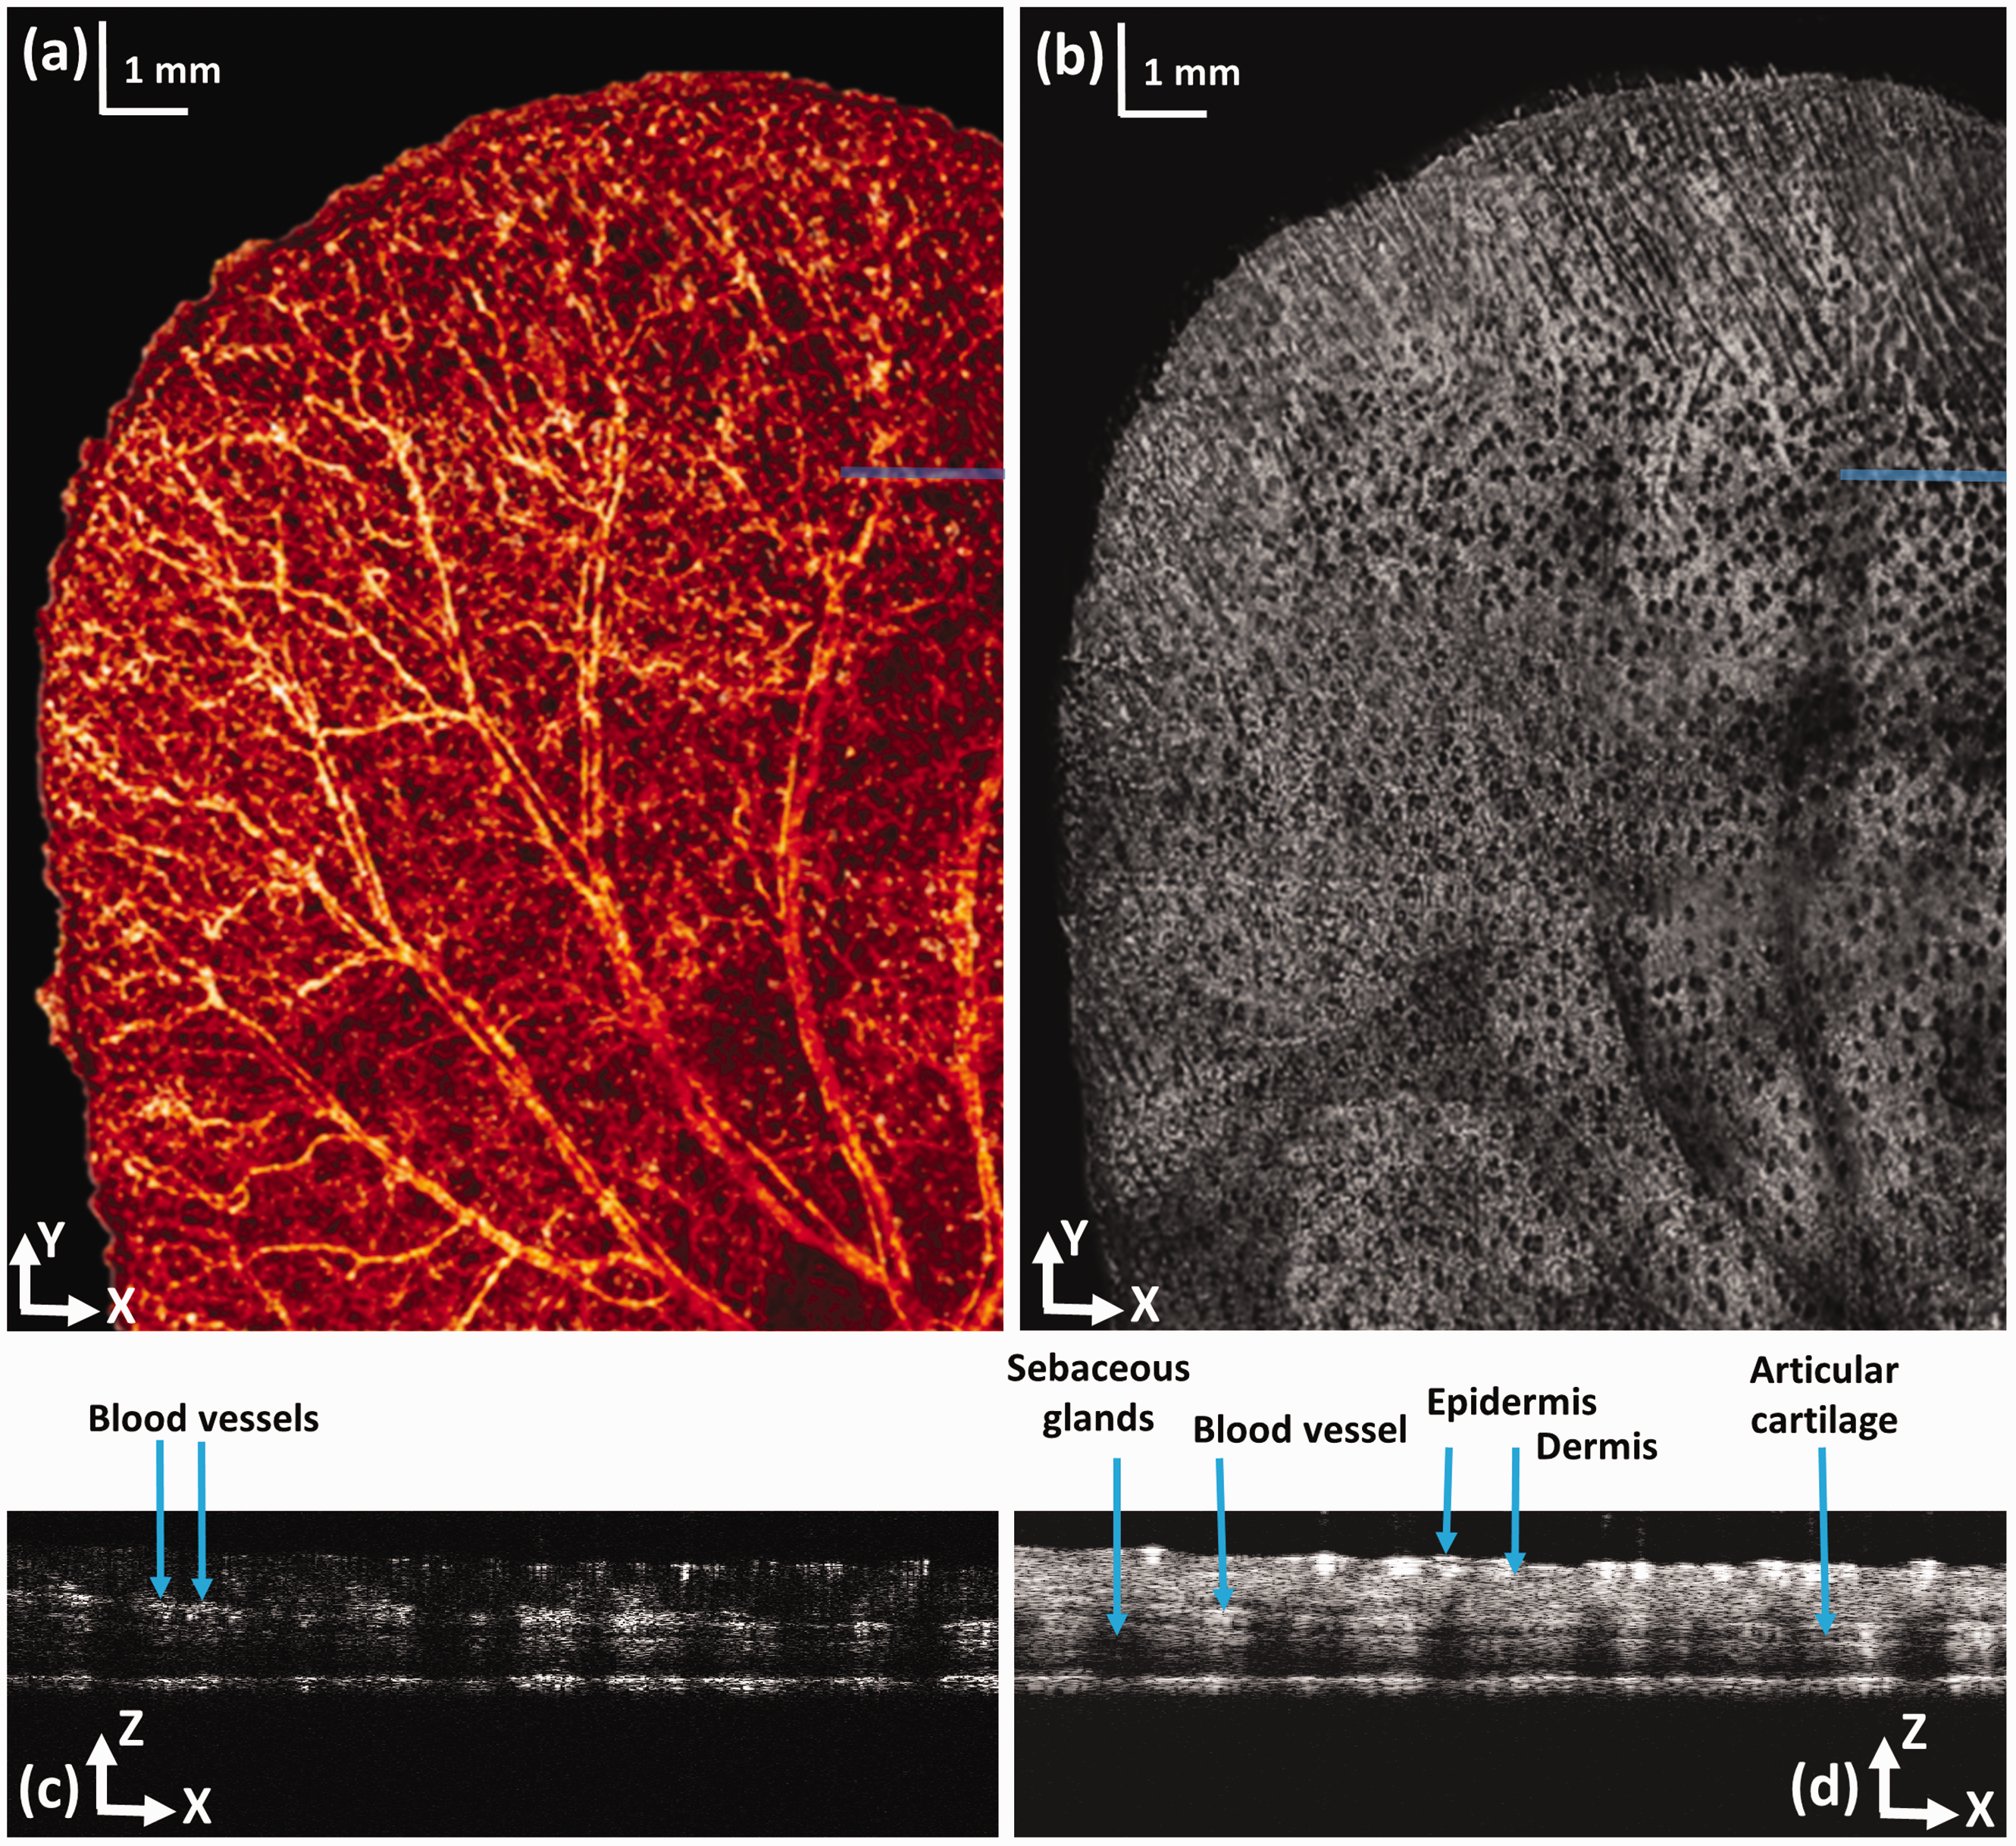
OCTA image of a mouse ear. (a) En face projection of the OCTA image; (b) OCT projection image generated from the acquired 3D OCT dataset; (c) Cross-sectional OCT blood flow image at the location marked in panel (a) by a solid line; (d) OCT B-scan at the location marked in panel (b) by a solid line; bar; 1 mm. (A color version of this figure is available in the online journal.)
Figure 2(a) displays an en face view of the large FOV OCTA image of the mouse ear. We can see that both the large vessels and the small capillaries were clearly revealed over the entire imaging area. Figure 2(b) shows the projection of the 3D OCT dataset in the X-Y plane, which shows clearly the different features compared to the OCTA image demonstrating the different contrast mechanisms. We can see that the sebaceous glands appear as black spots in the image due to the shadowing effect as shown in the depth-resolved OCT B-scan image (Figure 2(d)), which shows the tissue structure. The OCTA signal is displayed in Figure 2(c) revealing the blood flow separated from the stationary background tissue.
After successful OCTA imaging of the mouse ear with large FOV, we performed in vivo multimodal imaging on a different mouse ear to demonstrate the capability of the multimodal imaging system providing complementary information of living tissue. Before imaging, we followed the same sample preparation standards17,18 for anesthesia, animal fixation, hair removal, and acoustic coupling gel application. Using the guidance of the real-time microscope, integrated in the multimodal imaging system, we visually selected the ROI and moved the animal to the focal plane of the objective lens, which corresponds to the maximum PAM signal, and the same procedure was used for dynamic focusing in our previous studies.17,18 We only imaged a small area of 2 mm × 2 mm, limited by the small FOV of the ultrasonic transducer, with the fast optical scanning.
We first scanned the ROI with PAM, OCT, and CFM at an imaging speed of 24 kHz, which took about 4 s, and then OCTA imaging was performed on the same ROI at an imaging speed of 40 kHz taking about 3 s. The OCTA was performed separately due to the limited PRR of the pulsed laser and the different scanning pattern which repeated each B-scan four times at each location.
Figure 3(a) shows the PAM image of the mouse ear revealing the vasculature network in the tissue. The blood vessels appear bright due to the high optical absorption of hemoglobin in the red blood cells at 532 nm generating strong ultrasound signal. Figure 3(b) displays an en face view of the OCTA image of the same imaged area. The blood vessels including the small capillaries appear bright in the OCTA image due to the specific imaging contrast mechanism that OCTA provides separating the flowing particles from the stationary tissue. Figure 3(c) shows the autofluorescence image of the skin tissue. 30 Figure 3(d) shows a projection of the 3D OCT data on the X-Y plane. Figure 3(e) and (f) shows the OCT and the OCTA B-scan images at the location marked in Figure 3(b) and (d) revealing the tissue structures and the blood flow, respectively.
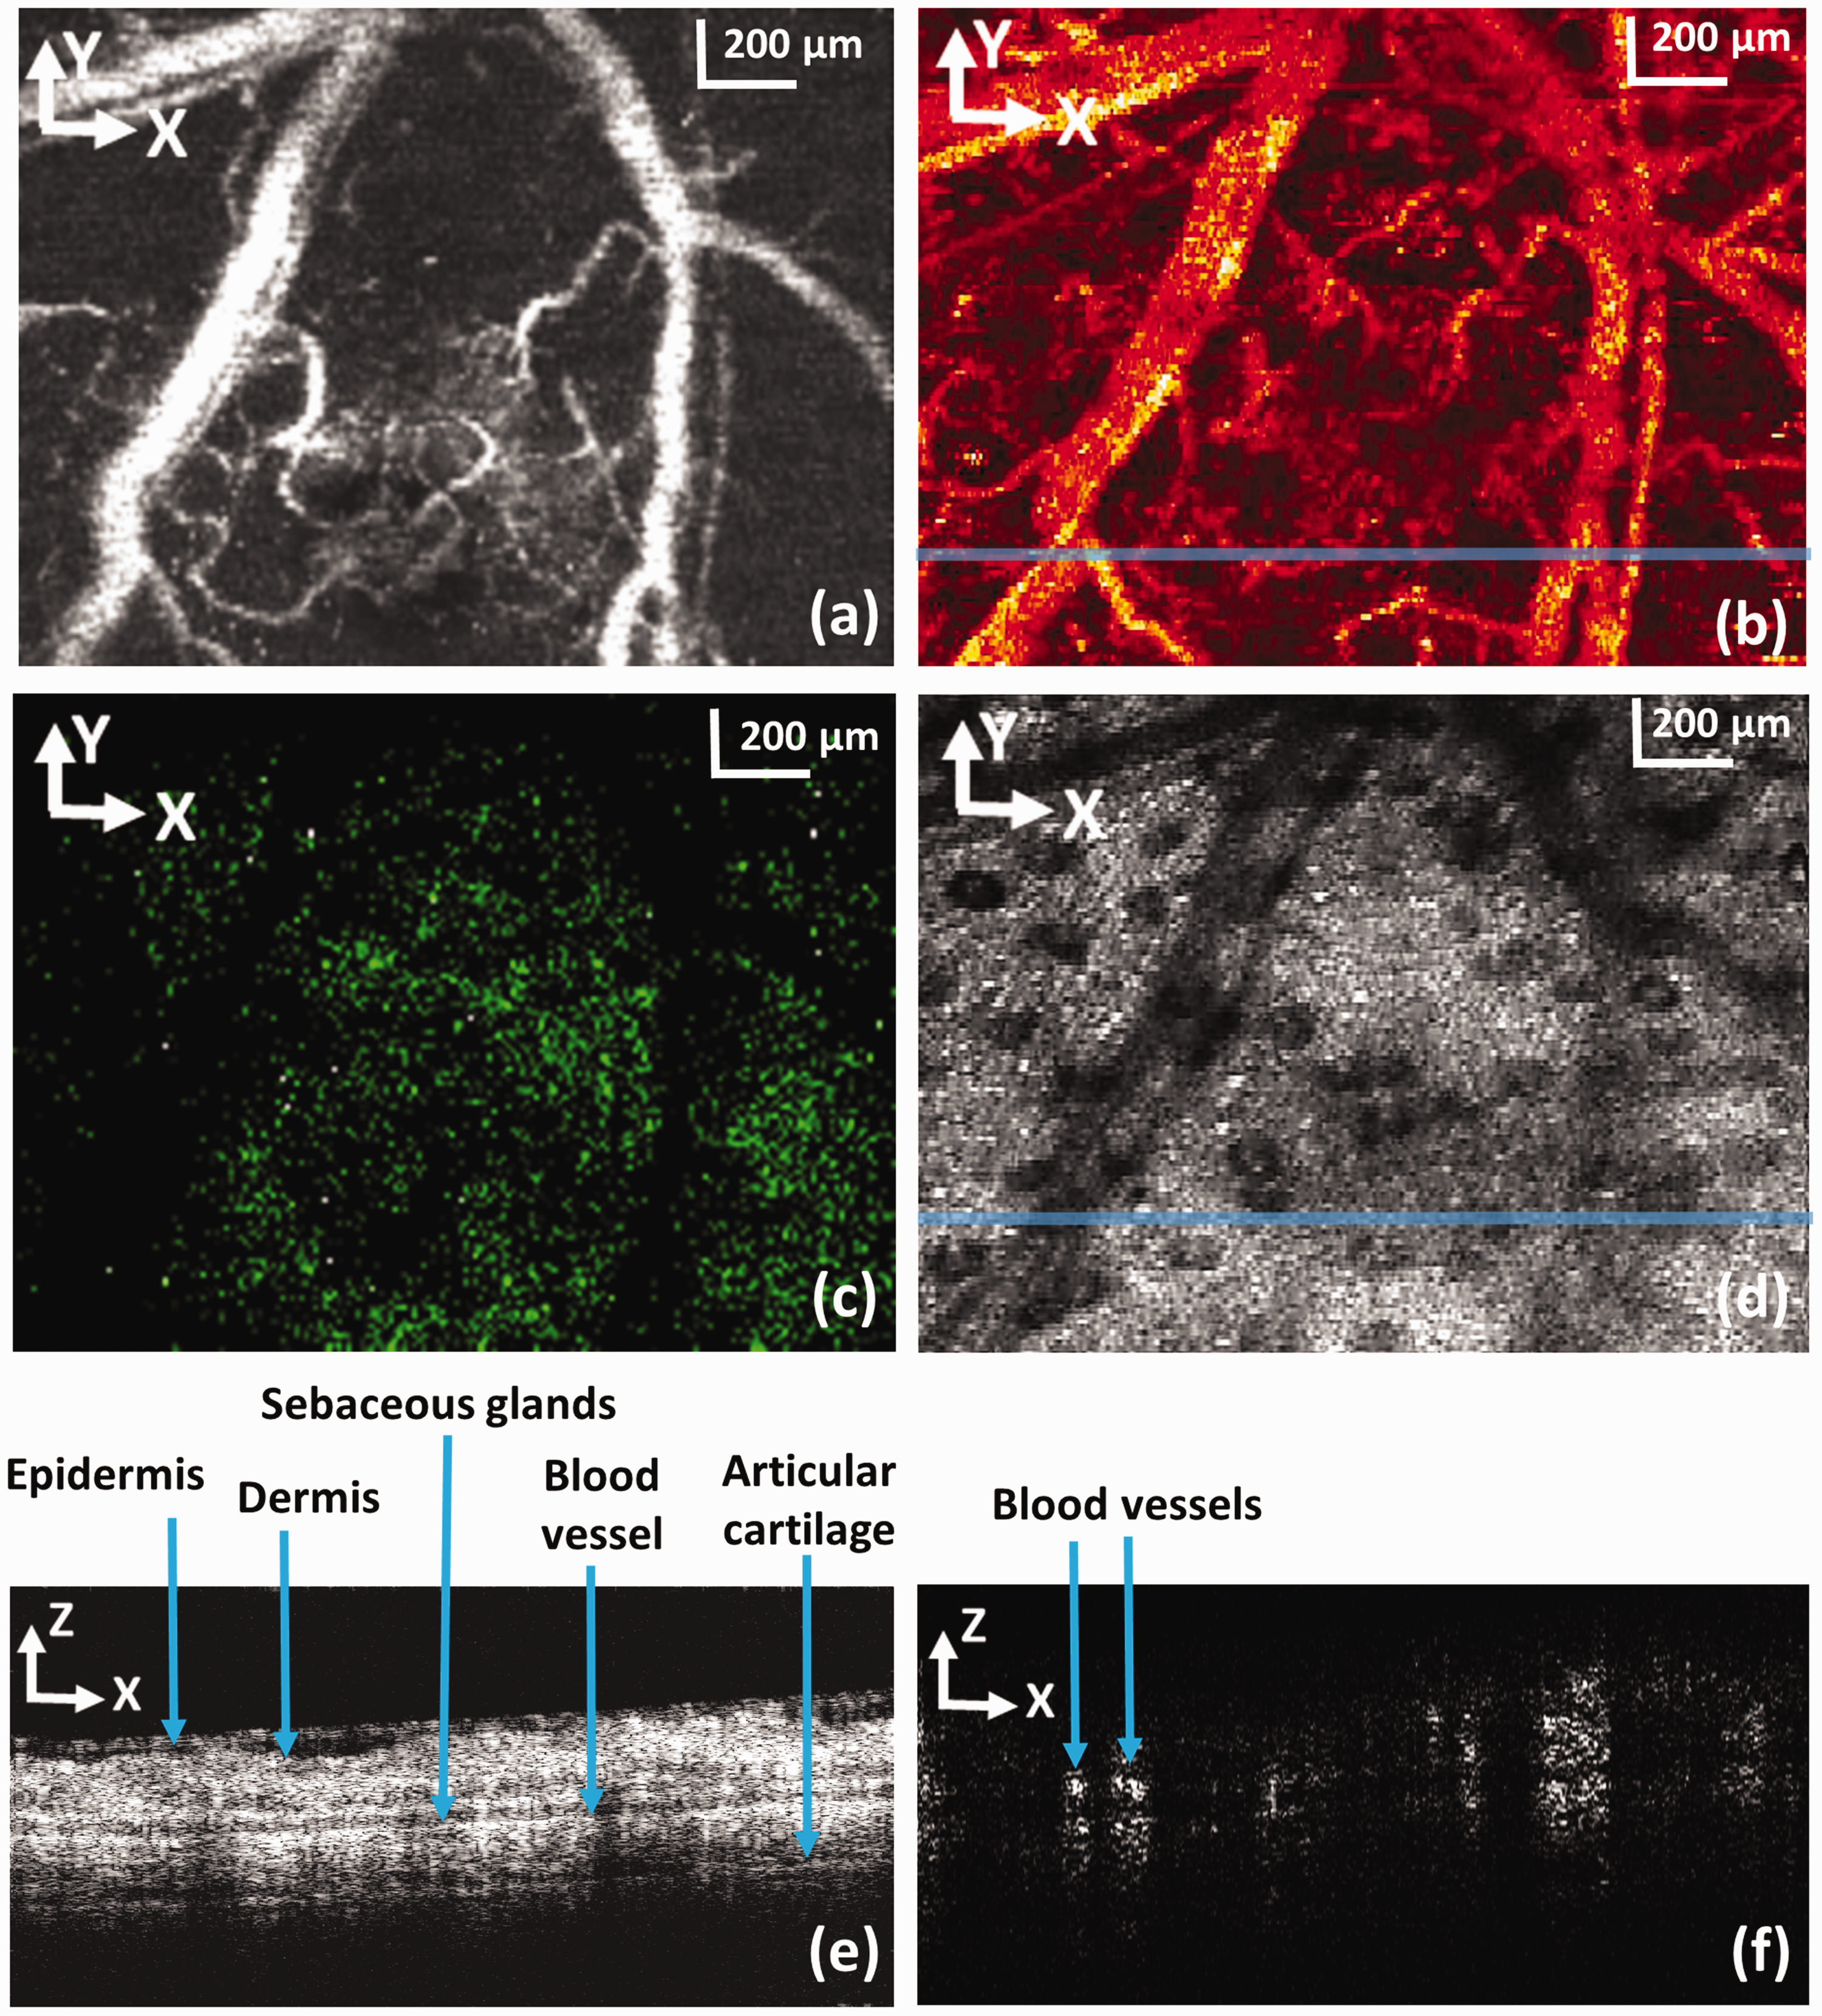
Simultaneously acquired PAM, CFM, and OCT images together with the OCTA image in the same ROI of a mouse ear. (a) Maximum amplitude projection of the PAM image; (b) en face view of the OCTA image; (c) CFM image; (d) OCT projection images generated from the acquired 3D OCT dataset; (e) OCT B-scan at the location marked in panel (d) by a solid line; (f) Cross-sectional OCT blood flow image at the location marked in panel (b) by a solid line; bar: 200 µm. (A color version of this figure is available in the online journal.)
Discussions
We can see in the imaging results that the PAM and OCTA revealed similar features of the vasculature of the biological samples. Although both PAM and OCTA are developed to image the vasculature, the contrast mechanisms are different. PAM is based on the optical absorption of hemoglobin in the red blood cells and is able to image the oxygenation of the blood vessels by using multiple illuminating wavelengths. PAM is not sensitive to motion of the scattering blood cells, i.e. it is not sensitive to blood vessel non-perfusion. In contrast, OCTA is based on motion of the scatters in the blood vessels, not limited to the red blood cells. OCTA is sensitive to motion. It can thus reveal blood vessel non-perfusion, characteristics of the non-functioning microvasculature. The two optical imaging modalities can thus reveal complementary information of the microcirculation.
The lateral resolution of the different imaging modalities in the multimodal imaging system depends on the optical focus of the objective lens. Since the wavelength of the PAM illumination laser in the visible spectrum is much shorter than that used for OCTA, we expect that the lateral resolution of the optical-resolution PAM is better than that of OCTA in the superficial region. However, the imaging depth of OCTA is expected to be better that that of optical-resolution PAM. Different from OCTA, a pure optical imaging modality, the sensitivity and the fast scanning FOV of PAM depend on the detection sensitivity and FOV of the ultrasonic transducer. Thus, the PAM image quality highly depends on the ultrasonic transducer used.
We increased the FOV by combining optical scanning with mechanical scanning. To make the system suitable for practical applications, we need to improve the FOV for the fast scan, which is currently limited by the FOV of the ultrasonic transducer. To further improve the imaging speed, we need to use a laser with higher PRR. A state-of-the-art Q-switched laser can reach a PRR of higher than 100 kHz, which can increase our imaging speed of about 5-folds. In the current study, we decoupled OCTA imaging from the simultaneous acquisition of PAM, OCT, and CFM images. This is because the PRR of the pulsed laser is limited to 24 kHz, so it is not possible to simultaneously trigger the pulsed laser and the CCD camera for performing simultaneous imaging.
The imaging speed of the OCTA subsystem is limited by the line rate of the CCD camera and the achievable scanning speed of the galvanometer scanner. The allowable OCTA imaging speed of 70 kHz is similar to that used in most of the systems in ophthalmic applications. We used a speed of 40 kHz for the experiments due to the limitations of the galvanometer scanner. A faster galvanometer scanner will be needed to use the full speed of the spectrometer for OCTA.
The proposed imaging system will potentially be able to provide complementary information of either healthy or diseased tissues. For example, the proposed imaging system has the potential to be used in retinal imaging for the study and diagnosis of degenerative retinal diseases, where the contrasts of all the different imaging modalities are provided by endogenous agents such as, melanin (PAM), lipofuscin (CFM), retina tissue structure (OCT), and retinal capillary network (OCTA). Another example would be for brain imaging where blood vessel oxygen saturation can be measured with PAM for metabolism study; neural network imaging can be performed using multiphoton CFM (the current pulsed laser needs to be replaced with an ultrafast laser). In this application, OCTA will be able to image the vasculature in the brain down to capillary level with higher imaging depth and faster imaging speed compared to optical-resolution PAM.
Conclusion
In summary, we have successfully added OCTA capability in our multimodal imaging platform. The system is able to provide OCTA together with PAM, OCT, and CFM imaging of biological tissues. We achieved large FOV and high imaging speed by combining optical scanning with mechanical scanning. The upgraded multimodal imaging system was tested by imaging animal models in vivo. We expect that further improvement on the proposed multimodal imaging system will make it more suitable for research and clinical studies.
Footnotes
Authors’ contributions
SJ initiated and supervised the project. AD performed the experiments and analyzed the results. SJ and AD discussed the results and contributed to the manuscript.
DECLARATION OF CONFLICTING INTERESTS
The author(s) declared no potential conflicts of interest with respect to the research, authorship, and/or publication of this article.
FUNDING
The author(s) disclosed receipt of the following financial support for the research, authorship, and/or publication of this article: This work was supported by the National Institutes of Health (NIH) (1R01EY026643).