
Abstract
Optical coherence tomography angiography (OCTA) is a functional extension of optical coherence tomography for non-invasive in vivo three-dimensional imaging of the microvasculature of biological tissues. Several algorithms have been developed to construct OCTA images from the measured optical coherence tomography signals. In this study, we compared the performance of three OCTA algorithms that are based on the variance of phase, amplitude, and the complex representations of the optical coherence tomography signals for rodent retinal imaging, namely the phase variance, improved speckle contrast, and optical microangiography. The performance of the different algorithms was evaluated by comparing the quality of the OCTA images regarding how well the vasculature network can be resolved. Quantities that are widely used in ophthalmic studies including blood vessel density, vessel diameter index, vessel perimeter index, vessel complexity index were also compared. Results showed that both the improved speckle contrast and optical microangiography algorithms are more robust than phase variance, and they can reveal similar vasculature features while there are statistical differences in the calculated quantities.
Keywords
Impact statement
Different algorithms have been developed for optical coherence tomography angiography (OCTA) to provide high resolution three-dimensional imaging of the vascular network of biological tissues in vivo. Understanding the performance of each algorithm can help researchers to select the most reliable OCTA algorithms for rodent retinal imaging, which may affect the research of retinal diseases that have vascular involvement.
Introduction
Optical coherence tomography angiography (OCTA) is a non-invasive imaging technology, which can reveal the three-dimensional (3D) microvasculature of biological tissues in vivo. 1 Based on the motion contrasts among the repetitively acquired OCT images, OCTA can differentiate moving particles (mainly red blood cells in blood flow) from the static background tissue generating a 3D map of the perfusing blood vessels. OCTA has been recognized as a powerful diagnostic and research tool in ophthalmology for evaluating retinal diseases such as diabetic retinopathy, 2 glaucoma, 3 age-related macular degeneration (AMD), 4 artery and vein occlusions, 5 etc. In addition, OCTA has also been used in the research and clinical investigations in dermatology, 6 gastroenterology, 7 and neurology. 8
Several OCTA algorithms have been developed to extract the motion contrast buried in the amplitude and phase of the measured OCT signals, which result from the interference of the light reflected from the reference and sample arms of the light interferometer. Depending on whether phase, intensity, or the complex interference signal is used for the calculation, the algorithms can be categorized into phase based, intensity based, and complex signal-based OCTA. The most widely used algorithms include split-spectrum amplitude-decorrelation angiography (SSADA), 9 speckle variance (SV), 10 phase variance (PV), 11 improved speckle contrast (ISC), 12 and optical microangiography (OMAG). 13
Imaging the retinal vasculature of animals, especially rodent models, is one critical application of OCTA, since animal models play a key role in basic research and treatment development for all kinds of eye diseases. However, a large majority of the OCTA ophthalmic applications are on humans including comparative studies of the different algorithms.14–23 Since the anatomy, size, and metabolic rate of rodent eyes are different from human, the performance of the different OCTA algorithms may differ from that in human applications. In this study, we compared the angiographic images calculated from the same datasets by using the three different OCTA algorithms in the three different categories qualitatively and quantitatively. A statistical analysis is performed among the quantitative results (a paired t-test) to provide more information about the performance of each of the OCTA algorithms.
Materials and methods
Study design
To make a more general comparison among the different OCTA algorithms for ophthalmology and microscopic imaging applications, we imaged both rat retina and mouse ear. Four eyes of albino Spraque Dawley rats were imaged, and a mouse ear (Swiss Webster) was also imaged in vivo. All experimental animal procedures were conducted in compliance with the guidelines of the Florida International University’s Institutional Animal Care and Use Committee.
System and in vivo animal imaging
We used the near infrared OCT (NIR-OCT) in our previously developed multimodal visible-light optical coherence tomography and fundus autofluorescence (VIS-OCT-FAF) retinal imaging system 24 for rodent retinal imaging. In brief, the NIR-OCT used a broadband superluminescent diode (SLD) with a center wavelength of 840 nm and bandwidth of 50 nm as the light source. The interference light (the OCT signal) was detected by a home-built spectrometer with a line scan CMOS camera (Sprint, Basler) with an A-line rate of up to 140 KHz. For in vivo mouse ear imaging, we used the OCTA function of our recently developed penta-modal imaging system, 25 in which a SLD-based NIR light source with a center wavelength of 840 nm and bandwidth of 100 nm (Broadlighter, Superlume Diodes) was used. In the penta-modal imaging system, the OCT signal was detected by a home-built spectrometer with a fast CCD camera (Aviva EM4, e2V, maximum A-line rate: 70 KHz). In both retina and mouse ear imaging, we used A-scan speed of 40 KHz, considering the limitation of the X-Y galvanometer scanner. The imaging conditions, including the position of the reference arm, light power, and focus, have been kept constant in each experiment. For OCTA imaging, each of the 128 B-scans was repeated four times at each spatial location, i.e. each y location, of the sample. Each B-scan consisted of 512 A-lines. Thus, in each imaging area, a total of 512 × 4 × 128 A-lines were acquired, covering an area of 1.5 mm × 0.75 mm of the rat retina (2 mm × 2 mm of the mouse ear). The NIR light power was 800 μW and 600 μW for in vivo rat retina and mouse ear imaging, respectively.
OCTA algorithms
For OCTA imaging, at each spatial location of the sample (either rat retina or mouse ear in our studies), four cross-sectional images (B-scans) were acquired consecutively. The coordinate system was selected in which X represents the coordinate of the fast scan (B scan, the horizontal direction for retinal imaging), Y represents the coordinate of the slow scan (vertical direction in retinal imaging), and Z represents the coordinate in the depth. We use j to represent the number of the repetitive B-scan and N to represent the total number of the repetitive B-scan at each sample location. The depth resolved OCT signal at each spatial location can then be described as

PV algorithm
The PV algorithm calculates the phase difference among the repeated consecutive cross-sectional OCT B-scans. Unlike the method for Doppler OCT, in which the phase difference is calculated between the adjacent A-lines in a B-scan, calculations are done among the B-scans, with a much longer time interval. Consequently, the images contain no flow velocity information. This method minimizes the dependency of flow detection on vessel orientation. Typically, PV requires bulk motion correction and phase unwrapping prior to the final phase variance calculation. This algorithm has been successfully implemented in retinal imaging.26,27 The PV algorithm can be expressed in the following formula
28


ISC algorithm
In the ISC algorithm, the changes in the OCT signal intensity between subsequent B-scans caused by the moving particles are calculated.12,29 To calculate the OCTA signal, the amplitude of the OCT signals from each of the 4 B-scans was used to calculate the speckle contrast image

The final blood flow image was generated as following:

OMAG algorithm
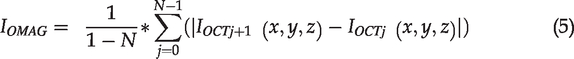
OMAG calculates the flow signal by performing a direct subtraction of the complex OCT signal between the consecutively repeated B-scans.30,31 The flow signal can be calculated with the following equation
32
Each acquired dataset was processed with the ISC, PV, and OMAG algorithms. The retinal images were segmented manually at the inner limiting membrane (ILM), the inner nuclear layer (INL), the external limiting membrane (ELM), and the retinal pigment epithelium (RPE). The superficial, deep, and RPE layers were defined as the retinal layers from ILM to INL, INL to ELM, and ELM to RPE. For each layer, the OCTA data were projected onto the X-Y plane by using axial summation amplitude projection (SAP). The quality of the projected OCTA images was compared first visually by looking at how much detail of the capillary network can be resolved. To make quantitative comparisons, we calculated the blood vessel density (BVD), vessel diameter index (VDI), vessel perimeter index (VPI), and vessel complexity index (VCI) for the segmented superficial retinal layers.33,34 All the linear-scale images were denoised, binarized, and skeletonized prior to the quantitative analysis. 35
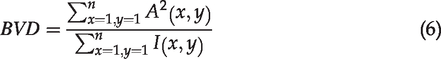
BVD is defined as the ratio of the total image area occupied by the vasculature to the total area in an OCTA image
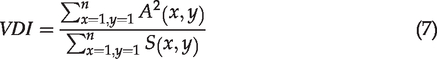
VDI is calculated as the ratio of the vessel area to the vessel length, as shown in the following formula
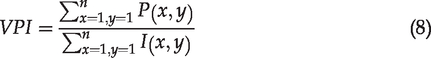
VPI is defined as the ratio of overall contour length of blood vessel boundaries to the total area in the OCTA image
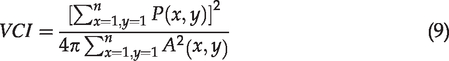
VCI is quantified using both the vessel perimeter and the vessel area map, calculated as
Results
Figure 1 shows the retinal images processed with the ISC (Figure 1(c) to (e)), OMAG (Figure 1(g) to (i)), and PV (Figure 1(k) to (m)) algorithms. The OCT fundus image 36 (en face view of the 3 D OCT data) and the OCT cross-sectional image demonstrating the segmentation are shown in Figure 1(a) and (b), respectively. Figure 1(f) and (j) shows the composite images of all the retinal layers coded with color (red: superficial retinal layer; green: deep retinal layer; blue: RPE layer). As can be observed in Figure 1(c) to (j), both the ISC and OMAG algorithms are successful in mapping the vascular networks in different retinal layers. However, there are some differences in revealing the details of the microcapillaries. As pointed by the arrows in Figure 1(e), and (i), the OMAG algorithm can resolve more capillaries and yield higher signal strength in the deeper layer. In contrast, the PV algorithm was able to visualize only the large blood vessels in the superficial layer of the retina (Figure 1(k)). We cannot see the vasculature network of the deeper layers processed with the PV algorithm (Figure 1l(m)) due to high phase noise level resulting in poor image quality.
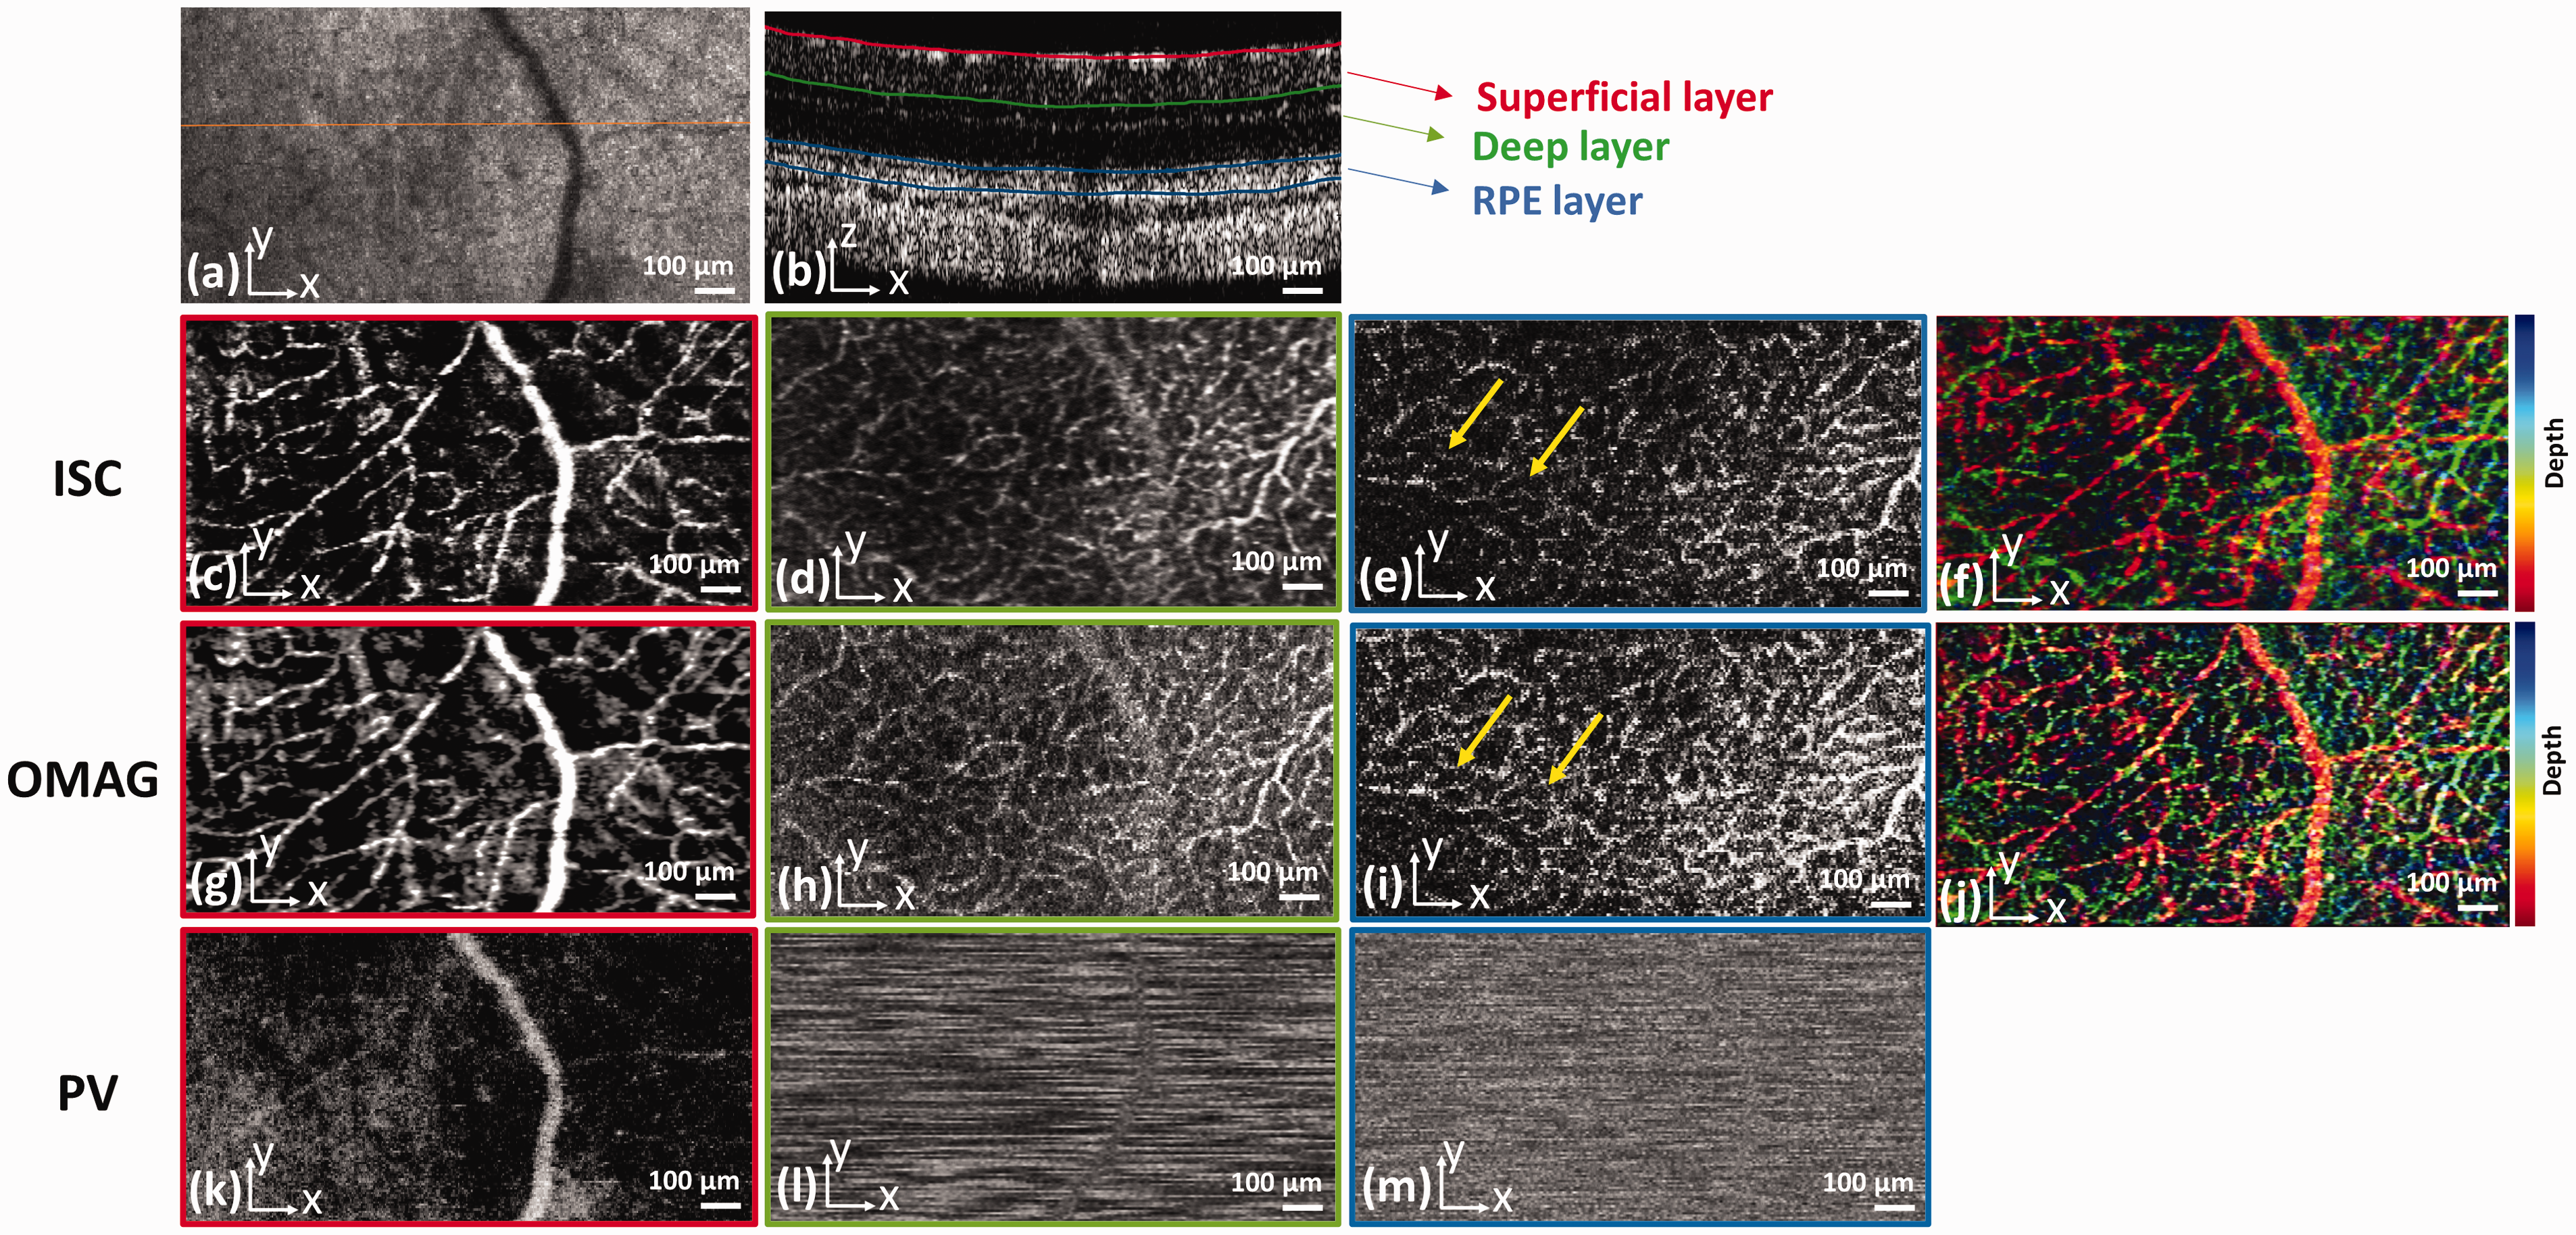
The OCTA retinal image of an albino rat processed with ISC, OMAG, and PV. (a) OCT fundus image; (b) OCT cross-sectional image illustrating the segmented retinal layers in the retina at the location marked in panel (a) by the solid line. (c), (d), and (e): SAP of the OCTA data in the superficial, deep, and RPE layers processed with ISC; (f): the ISC composite image of all the retinal layers coded with color; (g), (h), and (i): SAP of the OCTA data in the superficial, deep, and RPE layers processed with OMAG; (j): the OMAG composite image of all the retinal layers coded with color; (k), (l), and (m): SAP of the OCTA data in the superficial, deep, and RPE layers processed with PV; Colormap: red=superficial retinal layer, green= deep retinal, blue= RPE layer; Scale bar: 100 µm.
Figure 2 shows the in vivo imaging results of the mouse ear. Figure 2(a) is the en face view of the 3D OCT data, in which no blood vessels can be clearly visualized. Figure 2(b) to (d) are the SAP of the OCTA images constructed with the ISC, OMAG, and PV algorithms, respectively. We can see that all the three OCTA algorithms can comparatively visualize the major blood vessels in the mouse ear, while ISC and OMAG are more successful in resolving the capillaries, a result consistent with that of rodent retinal imaging.

OCTA image of a mouse ear processed with ISC, OMAG, and PV. (a): OCT en face view; (b): SAP of the OCTA data processed with ISC; (c) SAP of the OCTA data processed with OMAG; (d) SAP of the OCTA data processed with PV; Scale bar: 200 µm.
OCTA algorithm quantitative comparisons
We quantitatively compared the performance of ISC and OMAG in rodent retina and mouse ear imaging. Due to the relatively poor performance of the PV methods in visualizing the small blood vessels and capillaries compared to ISC and OMAG, we excluded this technique in our quantitative comparison study. Table 1 shows the calculated BVD, VDI, VPI, and VCI, from the acquired images (n = 4 for rat retina and n = 1 for the mouse ear).
Summary of the calculated OCTA quantitative parameters.
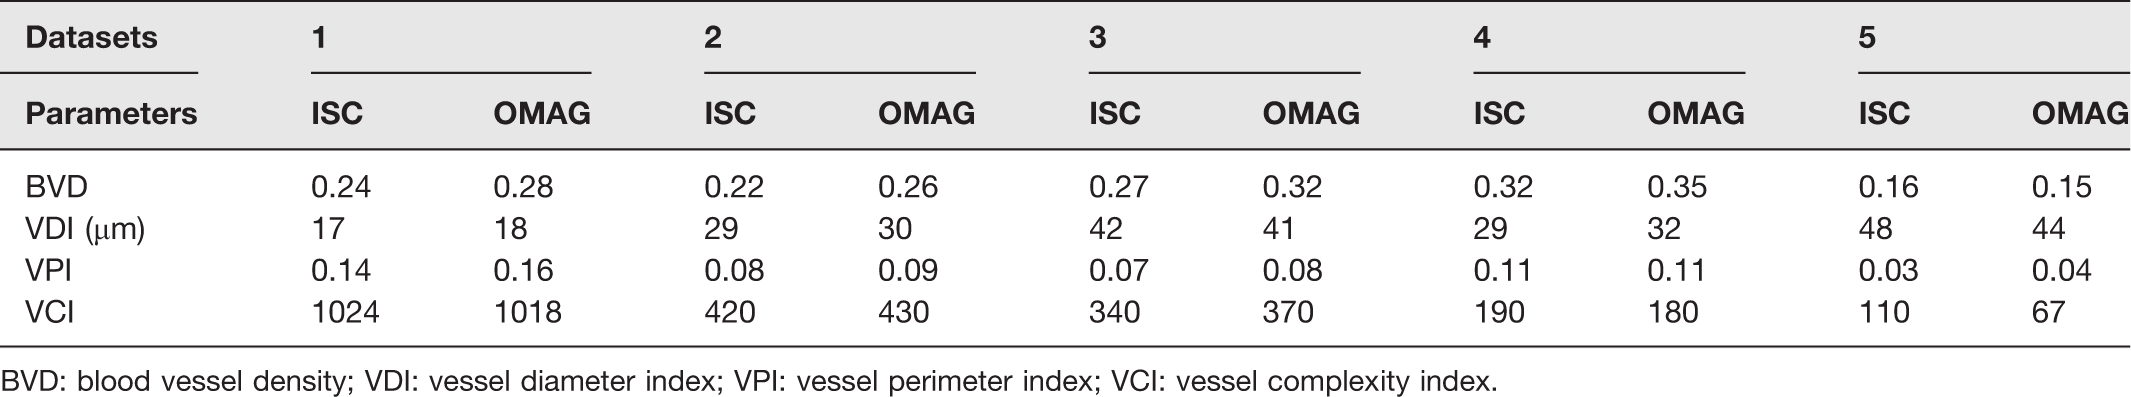
BVD: blood vessel density; VDI: vessel diameter index; VPI: vessel perimeter index; VCI: vessel complexity index.
A paired t-test analysis was performed for the data between the two algorithms (P ≤ 0.05 was assumed for statistical significance). The OMAG algorithm provided statistically significant higher mean values of BVD and VPI compared to the ISC algorithm (0.27 ± 0.07 vs. 0.24 ± 0.05 for BVD; 0.09 ± 0.04 and 0.08 ± 0.04 for VPI), while no statistically significant difference was observed for VDI and VCI among the algorithms (Table 2).
Statistical analysis results between ISC and OMAG.
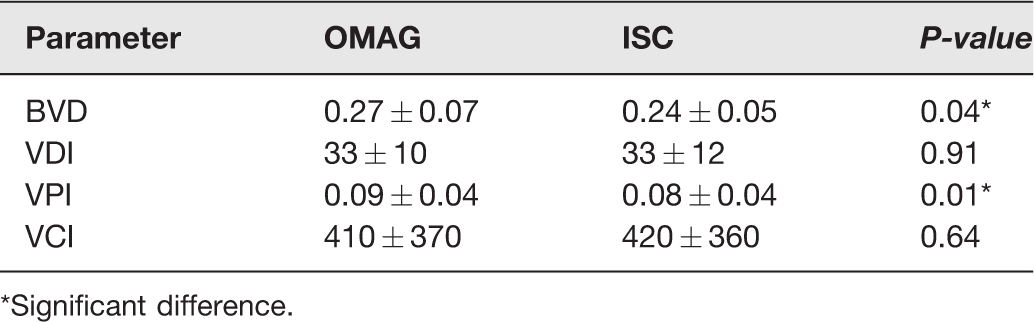
*Significant difference.
Discussion
From the imaging results on rat retina and mouse ear, we can see that both ISC and OMAG images are similar in visualizing the microvasculature, suggesting that both algorithms are suitable for OCTA applications in rodent models. The PV algorithm performed poorly, especially in retinal imaging. This might be caused by several factors including phase instability of the imaging system and uncontrolled sample motion. Previous studies 37 concluded that the sole phase information may not be ideal for obtaining high quality images of the vascular structures. For visualizing capillaries in deeper layers such as the RPE (see Figure 1(e) and (i)), consistent with previously reported in the literature,15,37 OMAG provided slightly better results for the vascular network compared to ISC, possibly due to the utilization of the full OCT signal for flow signal calculation. However, since the ISC algorithm only takes the amplitude of the OCT signal into account for motion-contrast calculations, this algorithm is less computationally intensive compared to OMAG. Additionally, OMAG and PV are both sensitive to bulk motion artifacts induced by heartbeats, breathing, and other involuntary motion. The phase shift caused by bulk motion is estimated by calculating the histogram of the phase difference between adjacent A-lines. However, it may not be always successful in removing the bulk motion effects. We noted that none of the above techniques were successful in visualizing the choriocapillaris in rodent retina, which needs to be investigated further. One probable reason is the anatomy of the rodent eye, such as the structure of the anterior segments and the small pupil size of the rat eye compared to humans, which may negatively affect the capability in resolving the deep choriocapillaris. We observed that some of the small vessels which appeared in the OCTA images were not fully connected. We hypothesize that this discontinuity was due to either the limited sampling density or slower blood flow in the rodent’s eye compared to humans.
In the quantitative evaluations, we can see that OMAG provided statistically significant higher mean values of BVD and VPI compared to the ISC, which may mean that OMAG can reveal more blood vessels as evidenced in the OCTA images. However, this evaluation is not conclusive. Whether OMAG is superior in revealing the true values still need studies to compare with histology. The importance of the current findings, although with limited data, is that when using OCTA as a tool in research or diagnostic applications, one needs to be aware of the algorithm used when trying to make qualitative and quantitative comparisons. A limitation of this study was that in the calculations of BVD, VDI, VPI, and VCI, we only evaluated the superficial retinal layers for quantitative comparison, since imaging the vasculature of the deep retinal layers in the rodent retinas were not always successful.
In this study, we imaged rat retina and mouse ear to cover different OCTA applications, such as ophthalmoscopy and microscopy. The two applications have different optical configurations. Retinal imaging requires an ocular lens, while microscopy requires only an objective lens for focusing the prob light onto the imaging subject. In ophthalmoscopy, the lateral resolution is mainly limited by the optics of the eye, while in microscopy the lateral resolution is mainly limited by the numerical aperture (NA) of the objective lens. Thus, this study may represent general imaging conditions although more data are needed to make the observations more conclusive. The poor performance of PV in our study may relate to the specific imaging system we used. Further studies will be needed to include not only larger sample size but also different imaging systems preferably commercial OCT systems with and without eye tracking.
Conclusions
In summary, we compared three representative OCTA algorithms, ISC, PV, and OMAG for imaging animal models qualitatively and quantitatively. It was shown that ISC and OMAG algorithms were more robust to provide high quality OCTA images in rodent imaging in vivo. Results also demonstrated that OMAG may provide slightly better visualization of the vascular network in deeper layers compared to the ISC method. The statistically significant higher BVD and VDI values calculated from OMAG than ISC suggest that it is more reliable to use the same OCTA algorithm for quantitative comparisons in research and diagnosis when these quantities are used as markers of disease status, progression, or treatment outcomes.
Footnotes
AUTHORS’ CONTRIBUTIONS
SJ initiated and supervised the project. AD and DP performed the experiments and analyzed the results. SJ, AD, and DP discussed the results and contributed to the manuscript.
DECLARATION OF CONFLICTING INTERESTS
The author(s) declared no potential conflicts of interest with respect to the research, authorship, and/or publication of this article.
FUNDING
The author(s) disclosed receipt of the following financial support for the research, authorship, and/or publication of this article: This work was supported by the National Institutes of Health (NIH) (1R01EY026643).