
Abstract
Prognosis stratification in colorectal cancer helps to address cancer heterogeneity and contributes to the improvement of tailored treatments for colorectal cancer patients. In this study, an autoencoder-based model was implemented to predict the prognosis of colorectal cancer via the integration of multi-omics data. DNA methylation, RNA-seq, and miRNA-seq data from The Cancer Genome Atlas (TCGA) database were integrated as input for the autoencoder, and 175 transformed features were produced. The survival-related features were used to cluster the samples using k-means clustering. The autoencoder-based strategy was compared to the principal component analysis (PCA)-, t-distributed random neighbor embedded (t-SNE)-, non-negative matrix factorization (NMF)-, or individual Cox proportional hazards (Cox-PH)-based strategies. Using the 175 transformed features, tumor samples were clustered into two groups (G1 and G2) with significantly different survival rates. The autoencoder-based strategy performed better at identifying survival-related features than the other transformation strategies. Further, the two survival groups were robustly validated using “hold-out” validation and five validation cohorts. Gene expression profiles, miRNA profiles, DNA methylation, and signaling pathway profiles varied from the poor prognosis group (G2) to the good prognosis group (G1). miRNA–mRNA networks were constructed using six differentially expressed miRNAs (let-7c, mir-34c, mir-133b, let-7e, mir-144, and mir-106a) and 19 predicted target genes. The autoencoder-based computational framework could distinguish good prognosis samples from bad prognosis samples and facilitate a better understanding of the molecular biology of colorectal cancer.
Impact statement
There is a dire need to better understand the pathophysiology and evaluate the survival prediction for CRC to increase the array of treatment options and improve prognosis. We used deep learning algorithms to integrate multi-omics for predicting the prognosis of CRC. We identified two survival-specific groups of CRC and validated these groups in independent validation cohorts. Overall, our study provides novel insights into the differential mechanisms of the two survival groups.
Introduction
Colorectal carcinogenesis involves the accumulation of complicated histological, morphological, and genetic changes over time. 1 Although routine screening decreases the incidence and mortality rate 2 of colorectal cancer (CRC), this malignancy remains one of the most severe and deadly cancers worldwide, with an overall survival (OS) of less than three years for patients with advanced CRC. 3 Accordingly, there is a dire need to better understand the pathophysiology and evaluate the survival prediction for CRC to increase treatment options and improve the prognosis of patients.
Deep learning (DL) algorithms have attracted wide attention in processing medical image and computer vision, owing to their stronger computing power and lower hardware cost. 4 DL techniques have been used for the detection, classification, segmentation, and survival predictions of CRC based on histopathological slides and radiological or colonoscopic images.5,6 The Cancer Genome Atlas (TCGA) database collects multi-omics data, including genomic, transcriptomic, proteomic, and epigenomic data of more than 30 cancer types, thereby providing multiple views of the same patients. 7 DL algorithms offer a potential solution to the integrative analysis of multi-omics data and have been successfully applied to explore the molecular mechanisms of cancers. 8 Multi-omics integration using DL algorithms has shown great promise for the survival prediction of breast cancer 9 and neuroblastoma. 10 However, only few studies have been published on the application of DL procedures for prognosis prediction in CRC.
An autoencoder is an unsupervised DL method that includes input, hidden, and outer layers. Using the input data, the autoencoder creates different representative features in the hidden layer and regenerates the output data. 11 The autoencoder-based model has identified survival-related multi-omics features of liver cancer and successfully defines two survival-sensitive subtypes. 12 Our study employed an autoencoder-based model to integrate DNA methylation, RNA-seq, and miRNA-seq data from CRC patients and extract representative features. Based on the survival-related features, we identified two survival-specific groups and verified these groups in the validation cohorts. We also assessed the differential molecular mechanisms of the two survival groups.
Materials and methods
Datasets and preprocessing
We downloaded coupled methylation beta value data (Methylation Illumina 450k BeadChip), RNA-seq FPKM data (RNA-seq Illumina HiSeq 2000 RNA Sequencing platform), and miRNA-seq RPM data of 379 CRC samples (miRNA-seq Illumina Hiseq platform), together with the corresponding clinical characteristics from TCGA (https://gdc-portal.nci.nih.gov/) database. The retrieved data were defined as the training cohort of our study (TCGA cohort).
To preprocess raw data, we removed the probes or genes missing values across more than half of all samples, samples missing more than 20% three-omics features, and input features whose values were zero in all samples. The methylation value of a gene promoter region that covers 1500 base pairs (bp) from the transcription start sites (TSS) was annotated using IlluminaHumanMethylation450kanno.ilmn12.hg19 package 13 and calculated using average methylation beta values of all CpG islands within the gene promoter region. Additionally, missing values were filled out using the impute package of R software (https://www.r-project.org/, version 3.5.2). 14 We obtained five validation cohorts containing RNA expression profiles of CRC samples from the ArrayExpress (https://www.ebi.ac.uk/ arrayexpress/) database. These cohorts included E-GEOD-17538 (N = 232, https://www.ebi.ac.uk/arrayexpress/experiments/E-GEOD-17538/A-AFFY-44 platform, https://www.ebi.ac.uk/arrayexpress/arrays/A-AFFY-44/?ref=E-GEOD-17538), E-GEOD-28722 (N = 125,https://www.ebi.ac.uk/arrayexpress/experiments/E-GEOD-28722/A-GEOD-13425 platform: https://www.ebi.ac.uk/arrayexpress/arrays/A-GEOD-13425/?ref=E-GEOD-28722), E-GEOD-38832 (N = 122, A-AFFY-44 platform; www.ebi.ac.uk/arrayexpress/arrays/A-AFFY-44/?ref=E-GEOD-38832), E-GEOD- 39582 (N = 558, A-AFFY-44 platform:https://www.ebi.ac.uk/arrayexpress/arrays/A-AFFY-44/?ref=E-GEOD-39582), and E-GEOD-41258 (N = 141, A-AFFY-33 platform, https://www.ebi.ac.uk/arrayexpress/arrays/A-AFFY-33/?ref=E-GEOD-41258). First, the probes were converted into gene symbols. Thereafter, the gene expression data were calculated by averaging the probes corresponding to the same gene. Table 1 shows the demographic and clinical data of TCGA and validation cohorts.
Demographic and clinical characteristics of TCGA set and five validation datasets.

OS: overall survival; DFS: disease-free survival.
Features transformation
The autoencoder was implemented as described previously 12 using the TCGA cohort. DNA methylation, RNA-seq, and miRNA-seq data were unit-norm scaled by sample as follows:
For a given sample vector 
The three matrices were stacked as input features for the autoencoder, and defined as the following functions:
Assuming that the input with n-dimensional features is denoted as
The purpose of the autoencoder is to reshape 
In the k-layer autoencoder, 
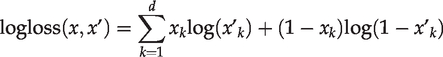
To prevent over-fitting, we added the L1 regularization penalty 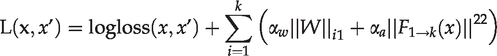
K-means clustering
We built a univariate Cox proportional hazards (Cox-PH) model for each transformed feature using the R survival package (https://cran.r-project.org/web/packages/survival/index.html) with a log-rank p < 0.01 as the significance cutoff. K-means clustering was then applied to the TCGA cohort based on the survival-related features using the R NbClust package. 15 The optimal number of clusters was selected by calculating the Calinski-Harabasz criterion and the silhouette index. A Kaplan-Meier (KM) curve was plotted for each cluster (risk group). The robustness of the predicted risk groups was assessed using the C-index, Log-rank P-value, and Brier score.
The C-index was considered as the proportion of all samples with corrected ordered survival times 16 and was calculated using the R survcomp 17 package. A C-index score of ≥0.7 suggests good performance of a model, whereas 0.5 suggests random background.
Log-rank P-value of Cox-PH regression reflects the survival difference of different risk groups with KM survival curves and was calculated using the R survival package. A smaller log-rank p-value suggested better performance of the survival prediction model.
Brier score was another metric used in the survival analysis to evaluate the inaccuracy between the predicted and actual survival beyond a certain time. 18 Brier score (range: 0–1) was obtained using the function sbrier.score2proba in the R survcomp package, with larger scores indicating higher inaccuracy.
Alternative transformation approaches to the autoencoder framework
The autoencoder framework was compared to three other dimensionality-reduction techniques, including principal component analysis (PCA), t-distributed random neighbor embedded (t-SNE), and non-negative matrix factorization (NMF). As the autoencoder framework had 175 bottleneck layer nodes, PCA, t-SNE, and NMF transformed the initial features into 175 transformed features using the Python Keras library. Likewise, the survival-related features were obtained from the transformed features using univariate Cox-PH models and then used to perform K-means clustering analysis on TCGA samples, as depicted in Figure 1(b). These methods are defined as alternative transformation strategies.
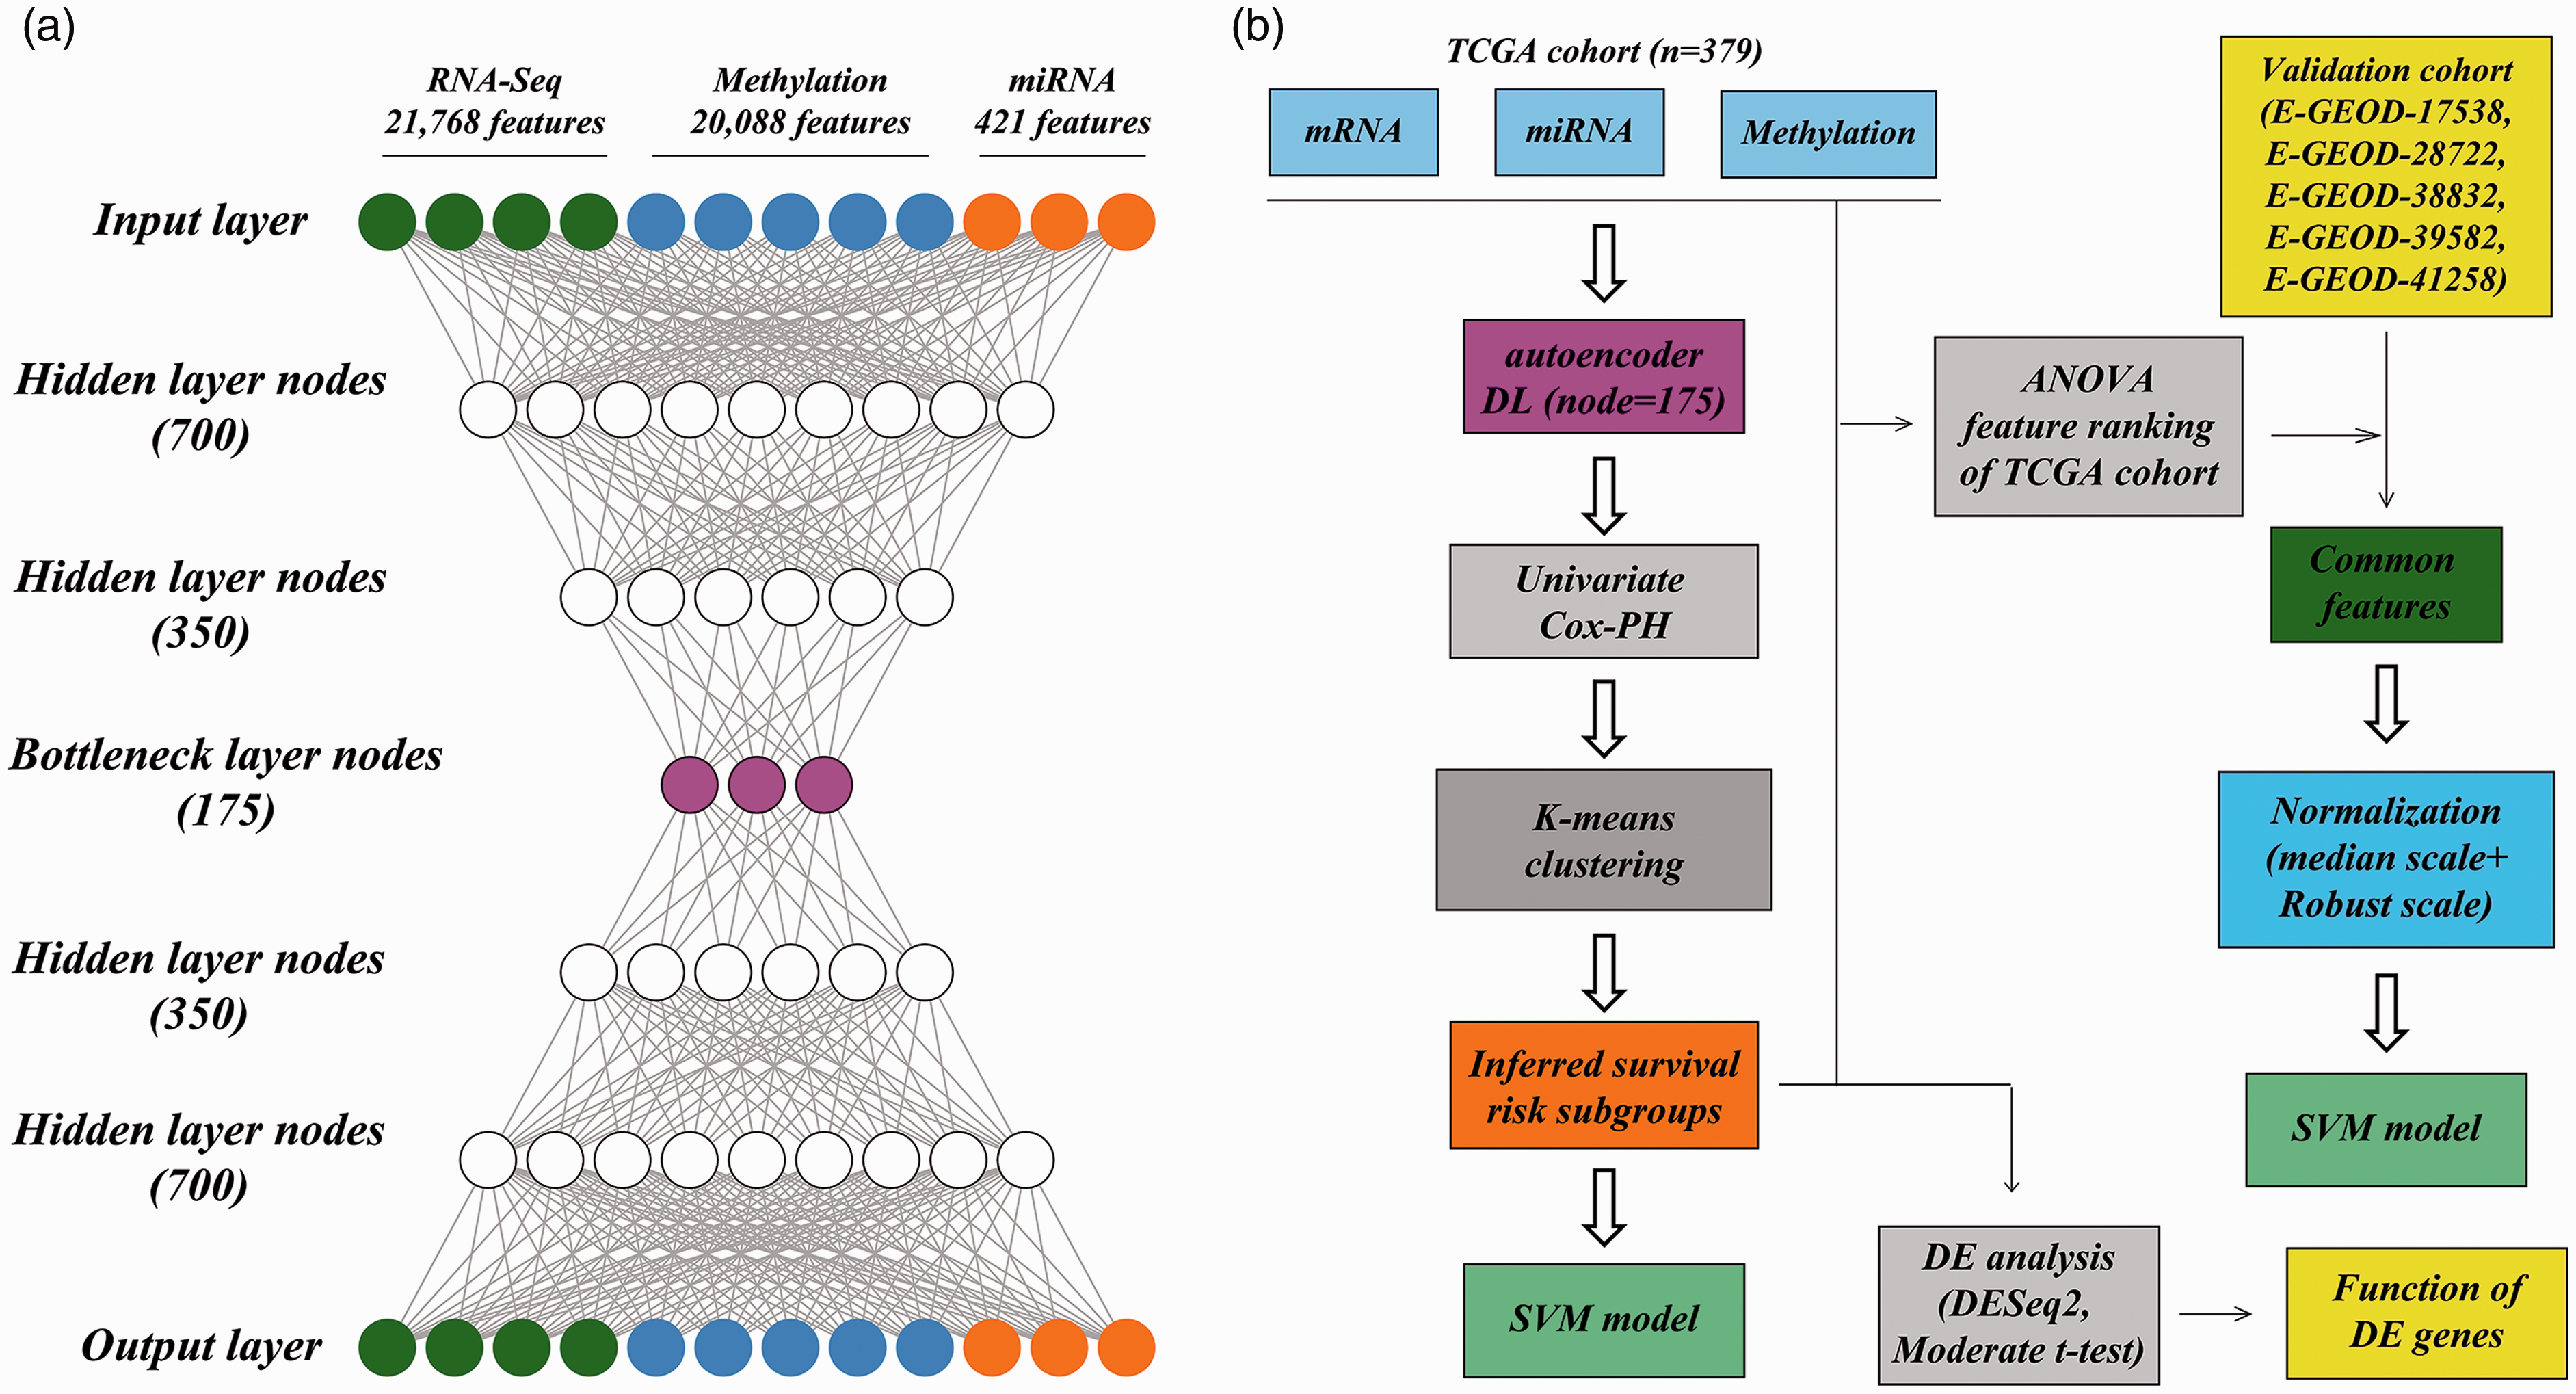
Overall design. (a) autoencoder framework; (b) an analytic pipeline including the autoencoder, uni-variate Cox-PH model, K-means clustering, and construction of the SVM models. (A color version of this figure is available in the online journal.)
The autoencoder framework was compared to the individual Cox-PH-based strategy. Specifically, the uni-variate Cox-PH model was used for the omics data of TCGA cohort. The Top N features according to C-index were selected to cluster all TCGA samples using K-means clustering, as mentioned above. N refers to the number of survival-related features in the autoencoder-based strategy.
Hold-out validation and supervised classification
The robustness of the obtained risk groups was evaluated using hold-out validation with the R caret package as previously described (http://topepo.github.io/caret/index.html). 12 Briefly, all TCGA samples were randomly split into a training set and a test set randomly using a ratio of 60%:40%. Analysis of variance (ANOVA) was performed on each omics data. For RNA-seq data, DNA methylation data, miRNA-seq data, or the 3-omics data in the TCGA cohort, according to the ANOVA F-value, the top 85 mRNA features, top 30 methylation features, top 30 miRNA features, or survival-related transformed features were selected to construct separate support vector machine (SVM) models and predict the risk subgroup labels of samples in the test set.
The TCGA data were cross-validated 10 times according to the splitting strategy. Arithmetic means of the C-index and Brier score, and the geometric mean of the log-rank P-value were generated to assess the model performance. With the radial basis function as the kernel function, the svmfs function in R penalizeSVM package 19 was used to construct the SVM model. For the SVM model (S), the svmfs function performs grid search to determine the optimal hyperparameters using five-fold CV and penalties, including L1 norm, elastic net (L1 + L2 norms), smooth clipped absolute deviation (SCAD), and ELastic SCAD (SCAD + L1 norm).
Validation in five validation cohorts
The robustness of the obtained risk groups was verified in five validation cohorts of RNA expression data: E-GEOD-17538, E-GEOD-28722, E-GEOD-38832, E-GEOD-39582, and E-GEOD-41258. We did not find any dataset of methylation or miRNA data with the corresponding clinical information. Specifically, common features between the TCGA cohort and each validation cohort were separately selected and subjected to median scale normalization and robust scale normalization using R software. 12 The Top 85 mRNA features according to ANOVA F value were used to construct SVM models and predict risk subgroup labels of samples in each validation cohort using the above-mentioned procedure (Figure 1(b)).
Statistical analysis
Uni- and multivariate Cox regression analyses were performed to identify prognostic factors (p < 0.05). Using the TCGA data, differentially expressed genes and miRNAs (DEGs and DEmiRNAs) were screened between different risk groups using the R DESeq2 package, 20 with |log2FC| >1 and FDR < 0.05 as the strict cutoff of significance. Differentially methylated genes (DMGs) (|beta difference| > 0.1 and FDR < 0.05) were identified using the R limma package 21 and moderate t-test.
The correlations between DNA methylation data and mRNA expression data from the TCGA cohort were analyzed using Pearson correlation analysis (Pearson correlation <–0.5, p-value <0.001). Target genes were predicted for the identified DEmiRNAs using the miRDB database 22 (prediction score >80, version 6.0, http://mirdb.org/index. html) and TargetScan database (probability of conserved targeting) >0.8, http://www.targetscan.org/vert_72/, version 7.2). The DEGs that were predicted to be target genes of the DEmiRNAs by both databases were selected to construct the miRNA-mRNA networks, which were visualized using Cytoscape software (version 3.7.1). Kyoto Encyclopedia of Genes and Genomes (KEGG) signaling pathway enrichment analysis was carried out for upregulated and downregulated DEGs, respectively, using KOBAS software 23 (FDR < 0.05).
The source code files of bioinformatics analyses are provided in Supplemental Files.
Results
The two survival groups obtained using the autoencoder-based strategy
The autoencoder model was trained using 421 miRNA features, 21,768 mRNA features, and 20,088 methylation features obtained from the TCGA data. Of the resulting 175 transformed features, 24 survival-related features with Log-rank P-value <0.05 were found using the univariate Cox-PH model and used to cluster samples of the TCGA cohort using K-means clustering analysis. The optimal cluster number K was determined to be 2, and samples were dichotomized into two clusters (G1 and G2 risk groups, Supplemental Table 1). Figure 2(a) shows that the G2 group had a poorer prognosis with a significantly shorter OS than the G1 group (C-index = 0.781, Brier score = 0.198, Log-rank P-value = 1.53e-7). Therefore, the G2 group was suggested to be the more aggressive subtype, while the G1 group was regarded as the less aggressive subtype.
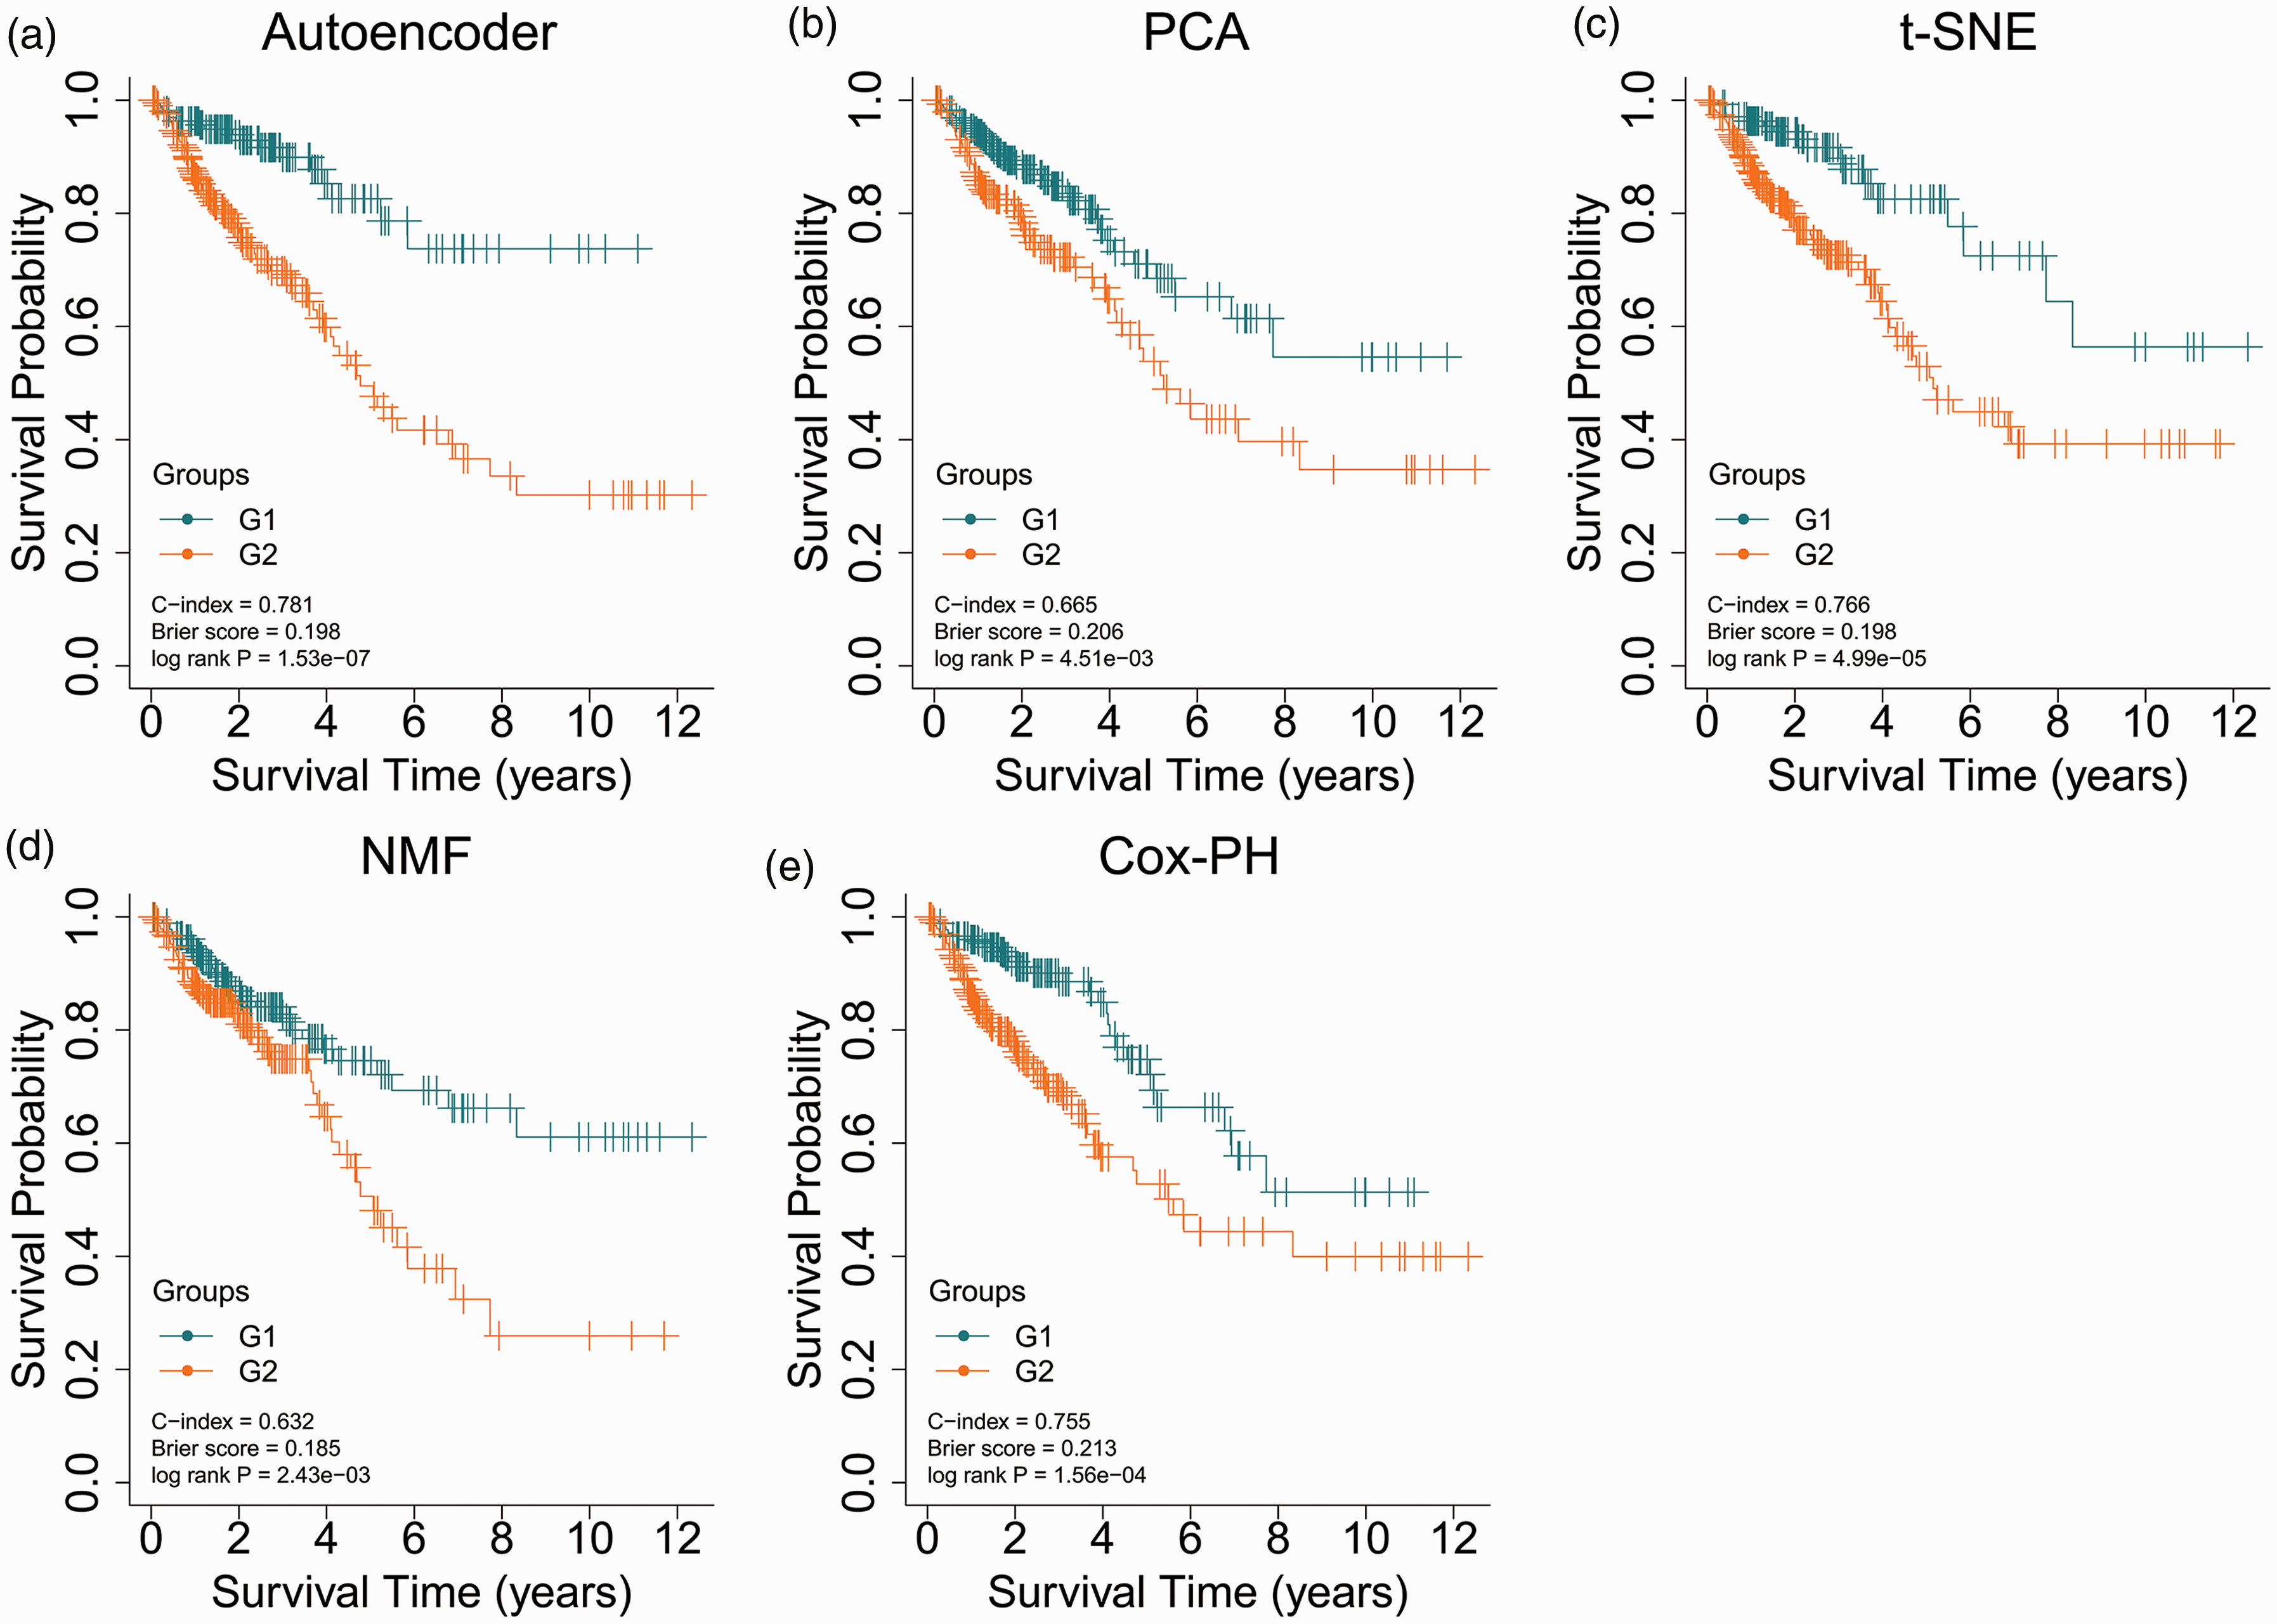
KM curves for TCGA set by the autoencoder- (a), PCA- (b), t-SNE-(c), NMF- (d), or individual Cox-PH-based strategy (e). (A color version of this figure is available in the online journal.)
Autoencoder-based strategy performed better than other strategies
The autoencoder-based strategy was compared with other strategies. Using PCA, t-SNE, or NMF, 175 transformed features were obtained. Among the 175 transformed features, 24 features by autoencoder, 9 features by PCA, 8 features by NMF, and 14 features by t-SNE were significantly related to survival in univariate Cox-PH regression analysis (Supplemental Table 8). Such finding indicates that the autoencoder could better capture survival-related features than other approaches.
The PCA-based strategy dichotomized samples into G1 and G2 groups and yielded a C-index of 0.665, a Brier score of 0.206, and a Log-rank P-value of 4.51e-3 (Figure 2(b)). The t-SNE-based strategy resulted in a C-index of 0.766, a Brier score of 0.198 and a Log-rank P-value of 4.99e-5 (Figure 2(c)). The NMF-based strategy generated a C-index of 0.632, a Log-rank P-value of 2.43e-3, and a Brier score of 0.185 (Figure 2(d)). The cluster labels of samples predicted by each strategy are presented in Supplemental Table 9. Comparative analysis of the clustering results using different strategies was conducted using the chi-square test. Clustering results using the autoencoder-based strategy were consistent with those of the PCA-based strategy (χ2 = 30.03, P = 4.25e-08) or the t-SNE-based strategy (χ2 = 5.44, p = 0.020, Supplementary Figure 2). However, the NMF-based strategy did not yield a significant p-value (χ2 = 2.09, P = 0.149, Supplementary Figure 2).
With regard to the individual Cox-PH-based strategy, the top 24 mRNA features, miRNA features, and methylation features according to C-index were combined to cluster samples using K-means clustering analysis. The individual Cox-PH-based strategy showed a C-index of 0.755, a Brier score of 0.213, and a Log-rank P-value of 1.56e-4 (Figure 2(e)).These results suggest that the autoencoder-based strategy is superior to other strategies.
The risk group classification by the autoencoder was an independent prognostic factor for CRC
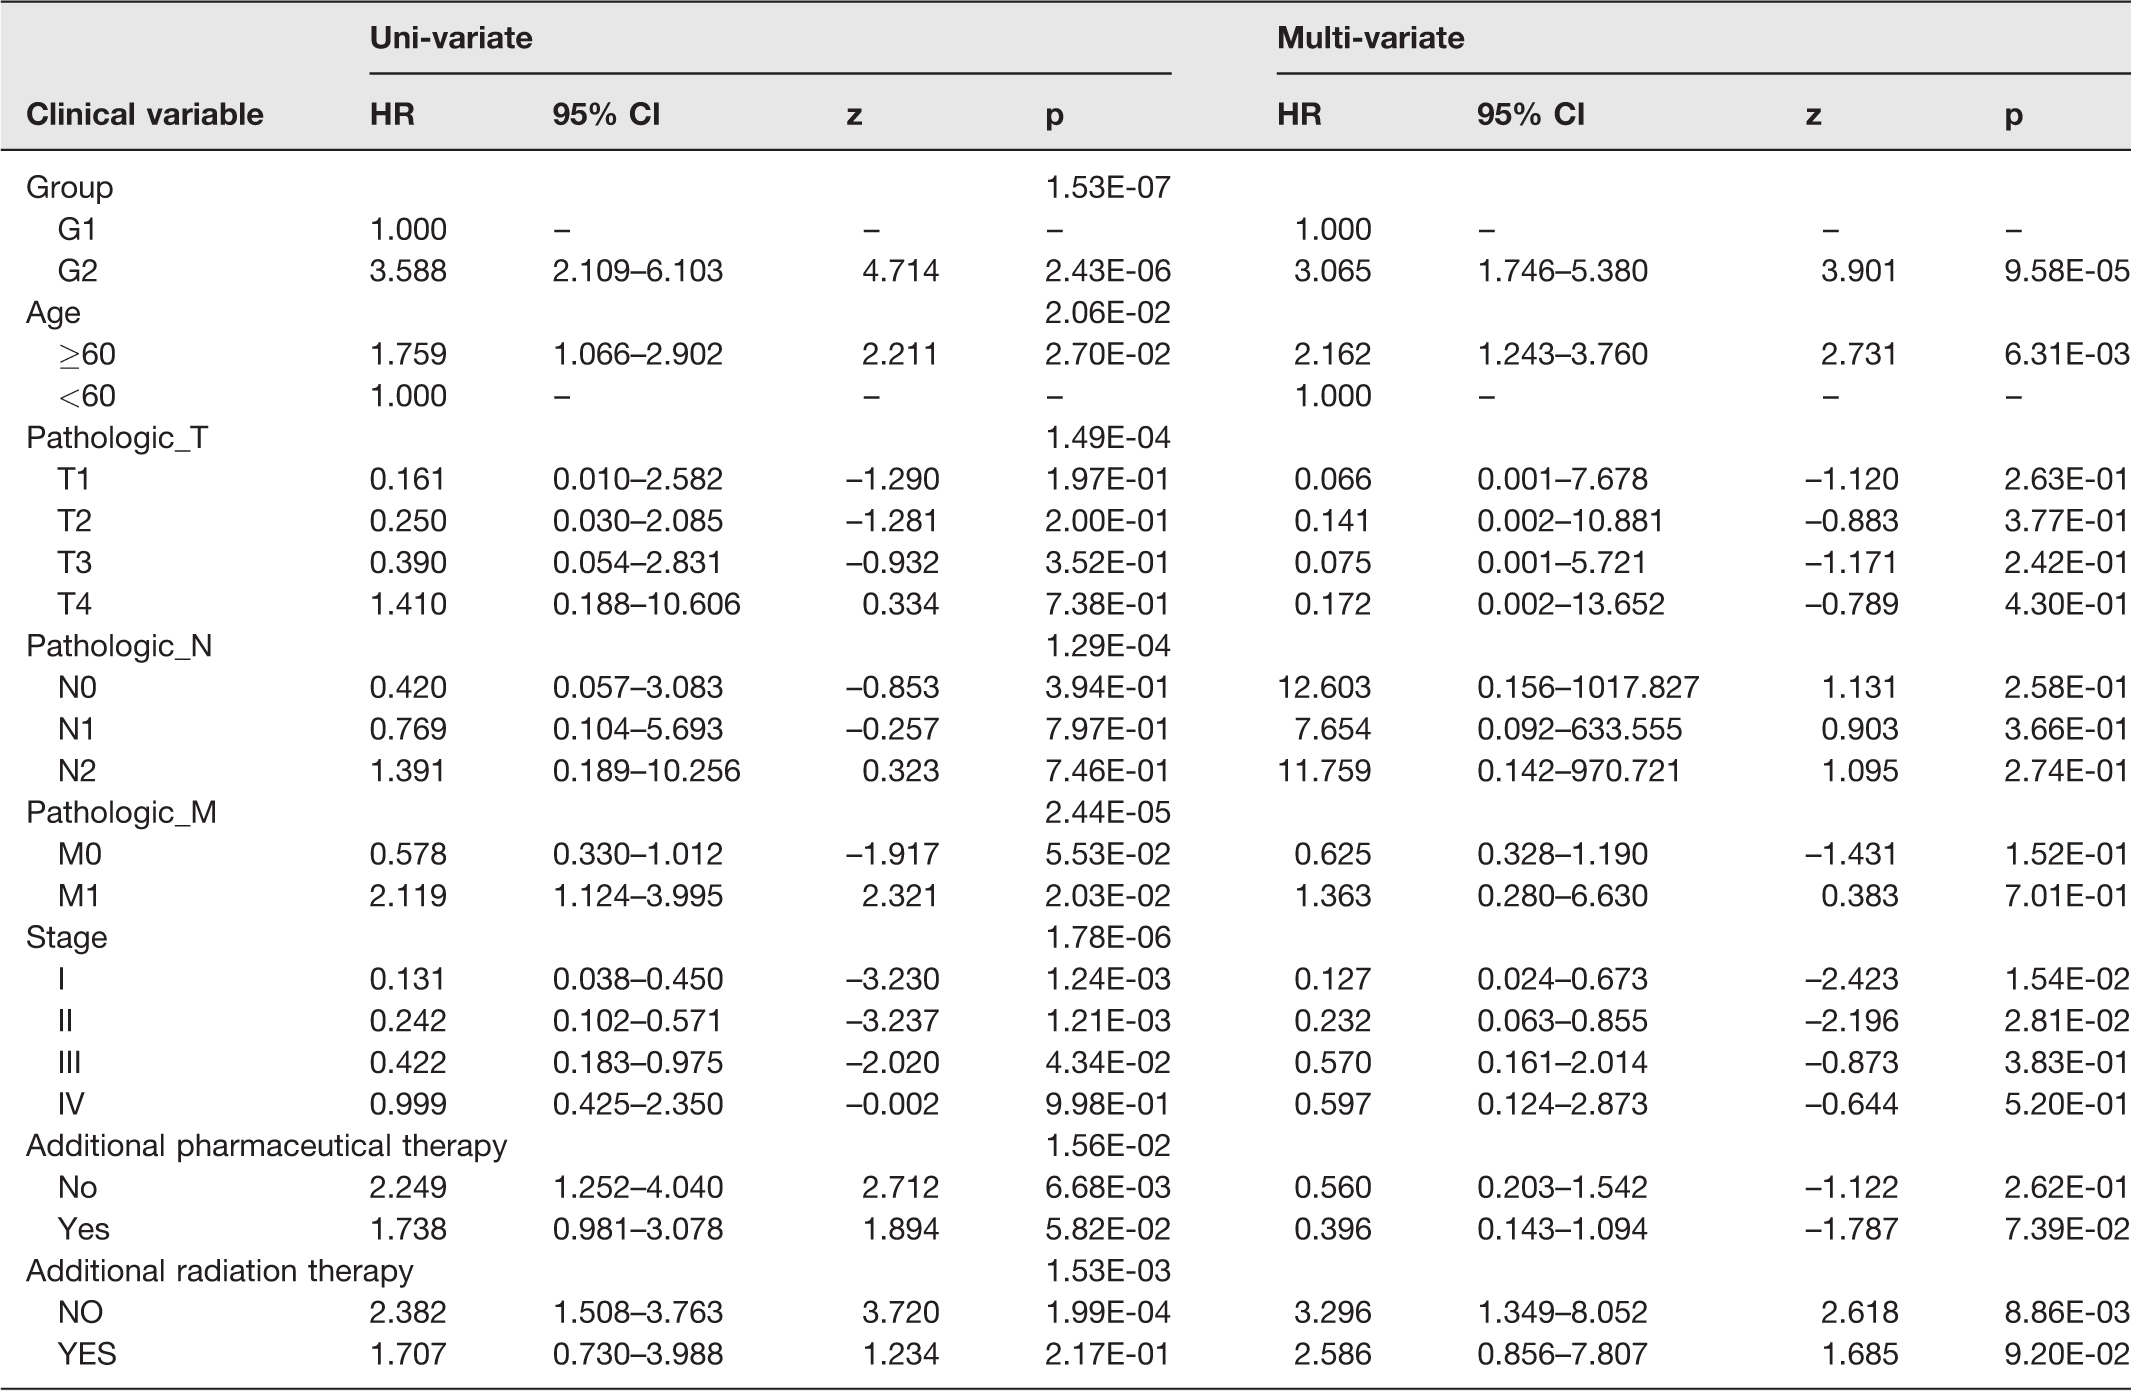
Risk groups (P-value = 2.43E-06), age (P-value = 2.06E-02), pathologic _T (p-value = 1.49E-04), pathologic _N (P-value = 1.29E-04), pathologic_M (P-value = 2.44E-05), tumor stage (P-value = 1.78E-06), additional pharmaceutical therapy (P-value = 1.56E-02), and additional radiation therapy (P-value =1.53E-03) were significantly related to survival in univariate Cox regression analysis (Table 2). In multivariate Cox regression analysis, the risk groups were further identified as independent prognostic factors (HR = 3.065, 95% CI = 1.746–5.380, P-value = 9.58E-05, Table 2).
Results of uni-and multi-variate Cox regression analysis.
Robustness of the risk groups based on hold-out validation
We used hold-out validation to verify the robustness of the obtained risk groups using 3-omics data and each single omic data of the TCGA cohort. In the training set, an SVM model was built and then in the test set the risk group labels were predicted. Both the 3-omics training set and the 3-omics test set generated a high C-index (0.74 ± 0.08; 0.65 ± 0.11), low Brier score (0.20 ± 0.01; 0.20 ± 0.02), and significant log-rank P-value (1.53e-4; 4.40e-2, Table 3).
CV-based performance metrics on training and test set of TCGA cohort.
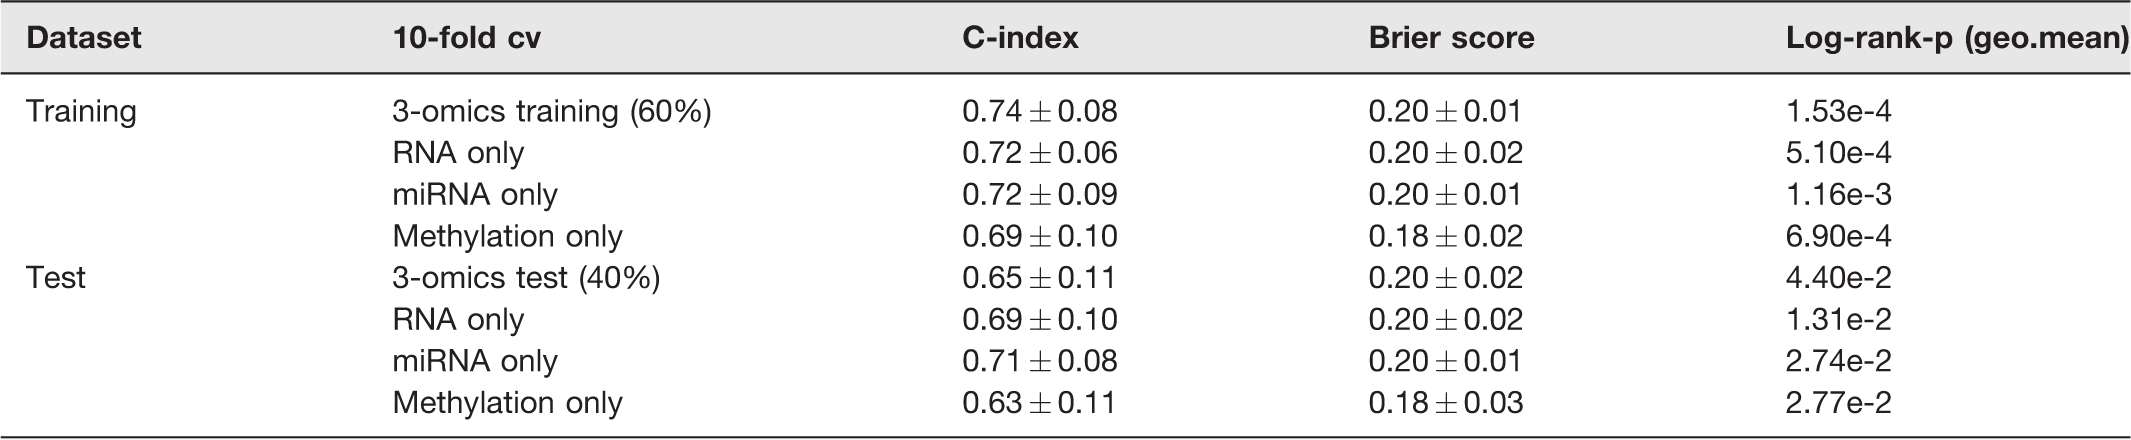
When single omic data were employed, the top 85 RNA features, top 30 methylation features, and top 30 miRNA features according to ANOVA F-value were selected to construct the SVM model (Supplemental Table 2). When the methylation data were tested, the training set yielded a C-index of 0.69 ± 0.10, a log-rank P-value of 6.90e-4, and a Brier score of 0.18 ± 0.02, while the test set yielded a C-index of 0.63 ± 0.11, a log-rank P-value of 2.77e-2, and a Brier score of 0.18 ± 0.03 (Table 3). The SVM model also displayed good performances for the training set and test set of RNA-seq and miRNA-seq (Table 3). It demonstrates the robustness of the obtained risk groups and suggests that multi-omics data outperform single omics data at predicting survival.
Successful verification of the obtained risk groups in five validation cohorts
With regard to the five validation cohorts, E-GEOD-17538 (N = 232), E-GEOD-28722 (N = 125), E-GEOD-38832 (N = 122), E-GEOD-39582 (N = 558), and E-GEOD-41258 (N = 141), shared 12974, 12486, 11759, 12974, and 11628 common mRNA features with TCGA cohort, respectively. The Top 85 common mRNA features according to ANOVA F-values were selected to build the SVM model to predict the risk group label of samples in the corresponding validation cohort. E-GEOD-17538 had a C-index of 0.651, a Log-rank P-value of 1.33e-2, and a Brier score of 0.201 for OS (Figure 3(a)) and a C-index of 0.662, a Log-rank P-value of 3.33e-3, and a Brier score of 0.149 for disease-free survival (DFS) (Figure 3(b)). In E-GEOD-28722, significantly different DFS was found for the two risk groups (C-index = 0.717, Brier score = 0.187, Log-rank P-value =2.37e-2, Figure 3(c)). The log-rank P-value of E-GEOD-38832, the smallest cohort, was marginally significant (8.70e-2, Figure 3(d)), which might be attributed to the small sample size. Either E-GEOD-39582 (C-index = 0.609, Brier score =0.217, Log-rank P-value = 4.76e-3, Figure 3(e)) or E-GEOD-41258 (C-index = 0.678, Brier score =0.188, Log-rank P-value = 3.03e-2, Figure 3(f)) was partitioned into two risk groups with significantly different DFS. These results reveal that the autoencoder-based strategy for risk stratification can be generalized to other cohorts of patients with CRC.
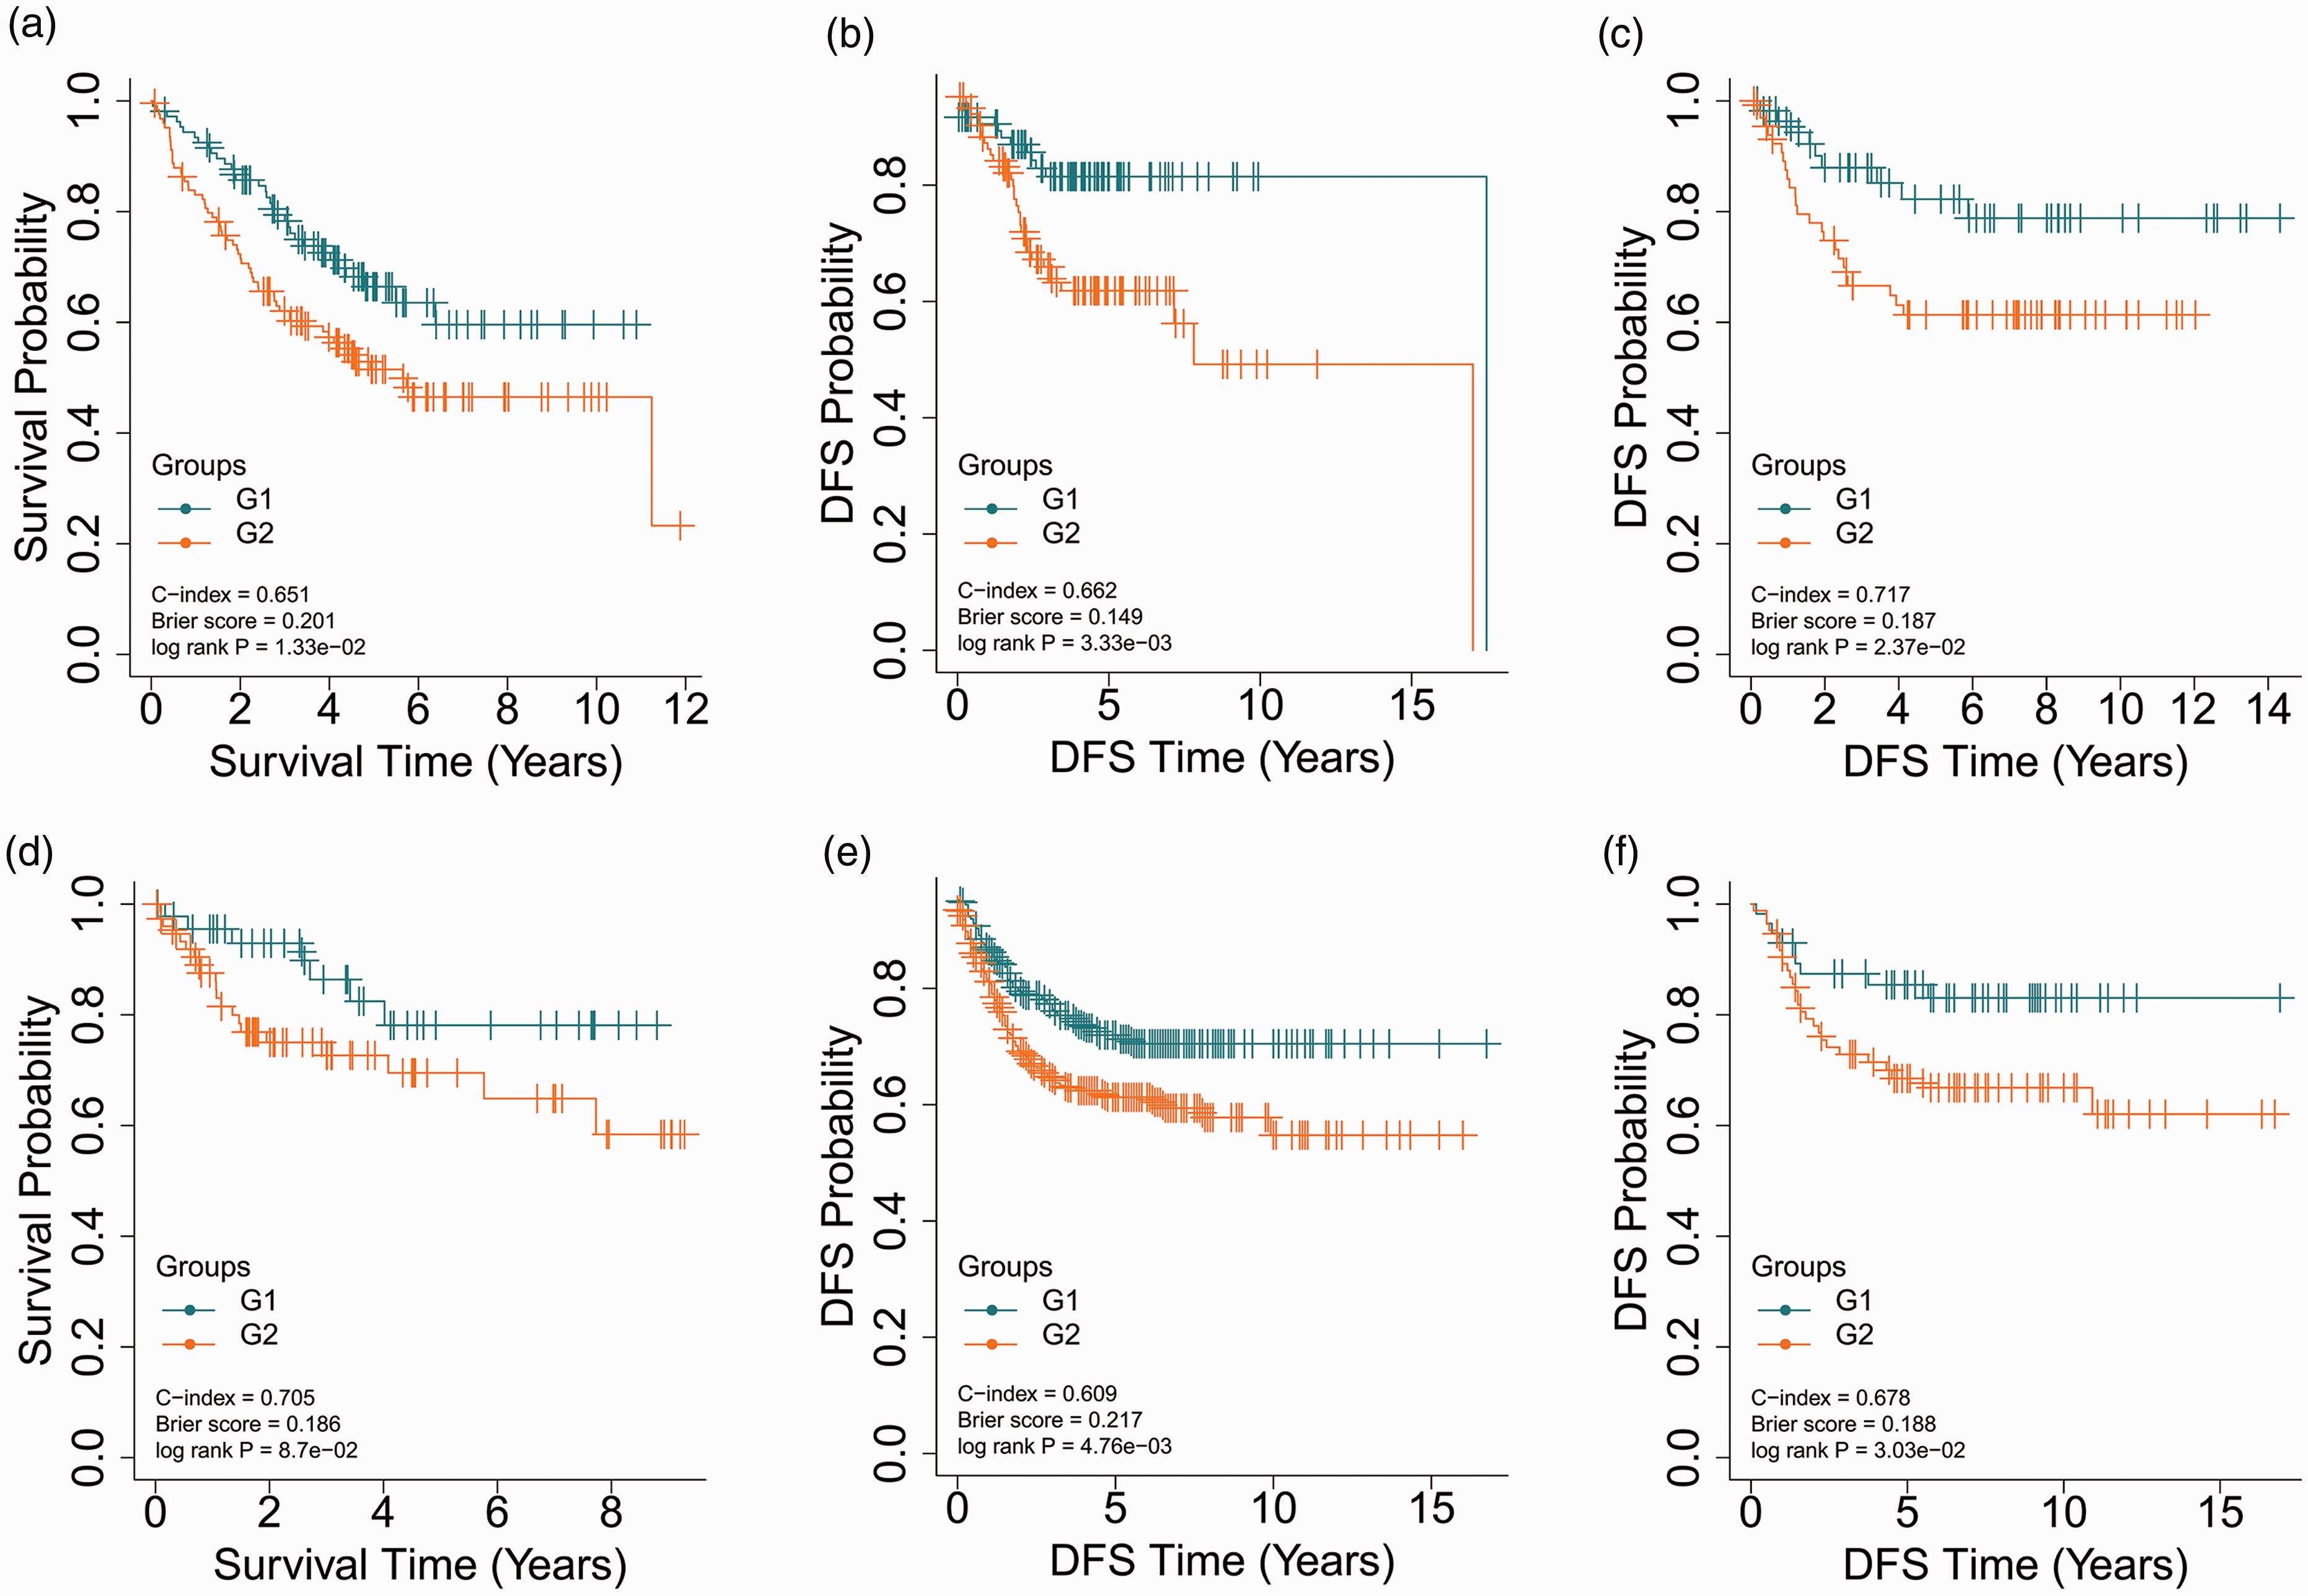
KM curves for the five validation datasets. (a) KM curves for OS in E-GEOD-17538; (b) KM curves for DFS in E-GEOD-17538; (c) KM curves for DFS in E-GEOD-28722; (d) KM curves for OS in E-GEOD-38832; (e) KM curves for DFS in E-GEOD-39582; (f) KM curves for DFS in E-GEOD-41258. (A color version of this figure is available in the online journal.)
Function analysis of the survival groups of the TCGA cohort
The TCGA cohort was divided into G1 and G2 groups using the autoencoder-based strategy. We identified 708 significant DEGs (|log2FC|>1 and FDR < 0.05), including 368 upregulated genes and 340 downregulated genes in the group G2 relative to the group G1 (Supplemental Table 3). A total of 31 DEmiRNAs met the cutoff of |log2FC| > 0.585 and FDR < 0.05, including 22 upregulated and 9 downregulated DEmiRNAs in the group G2 compared to the group G1 (Supplemental Table 4). Moreover, SLAMF6 and CASP5 with FDR < 0.05 and |delta methylation| > 0.1 were significantly hypermethylated in the group G2 compared to the group G1 (Supplemental Table 5). The top 10 DEGs, top 10 DEmiRNAs, and top 10 DMGs according to FDR value are displayed in Figure 4. Distinctive expression patterns of these features were observed between the G1 and G2 groups.
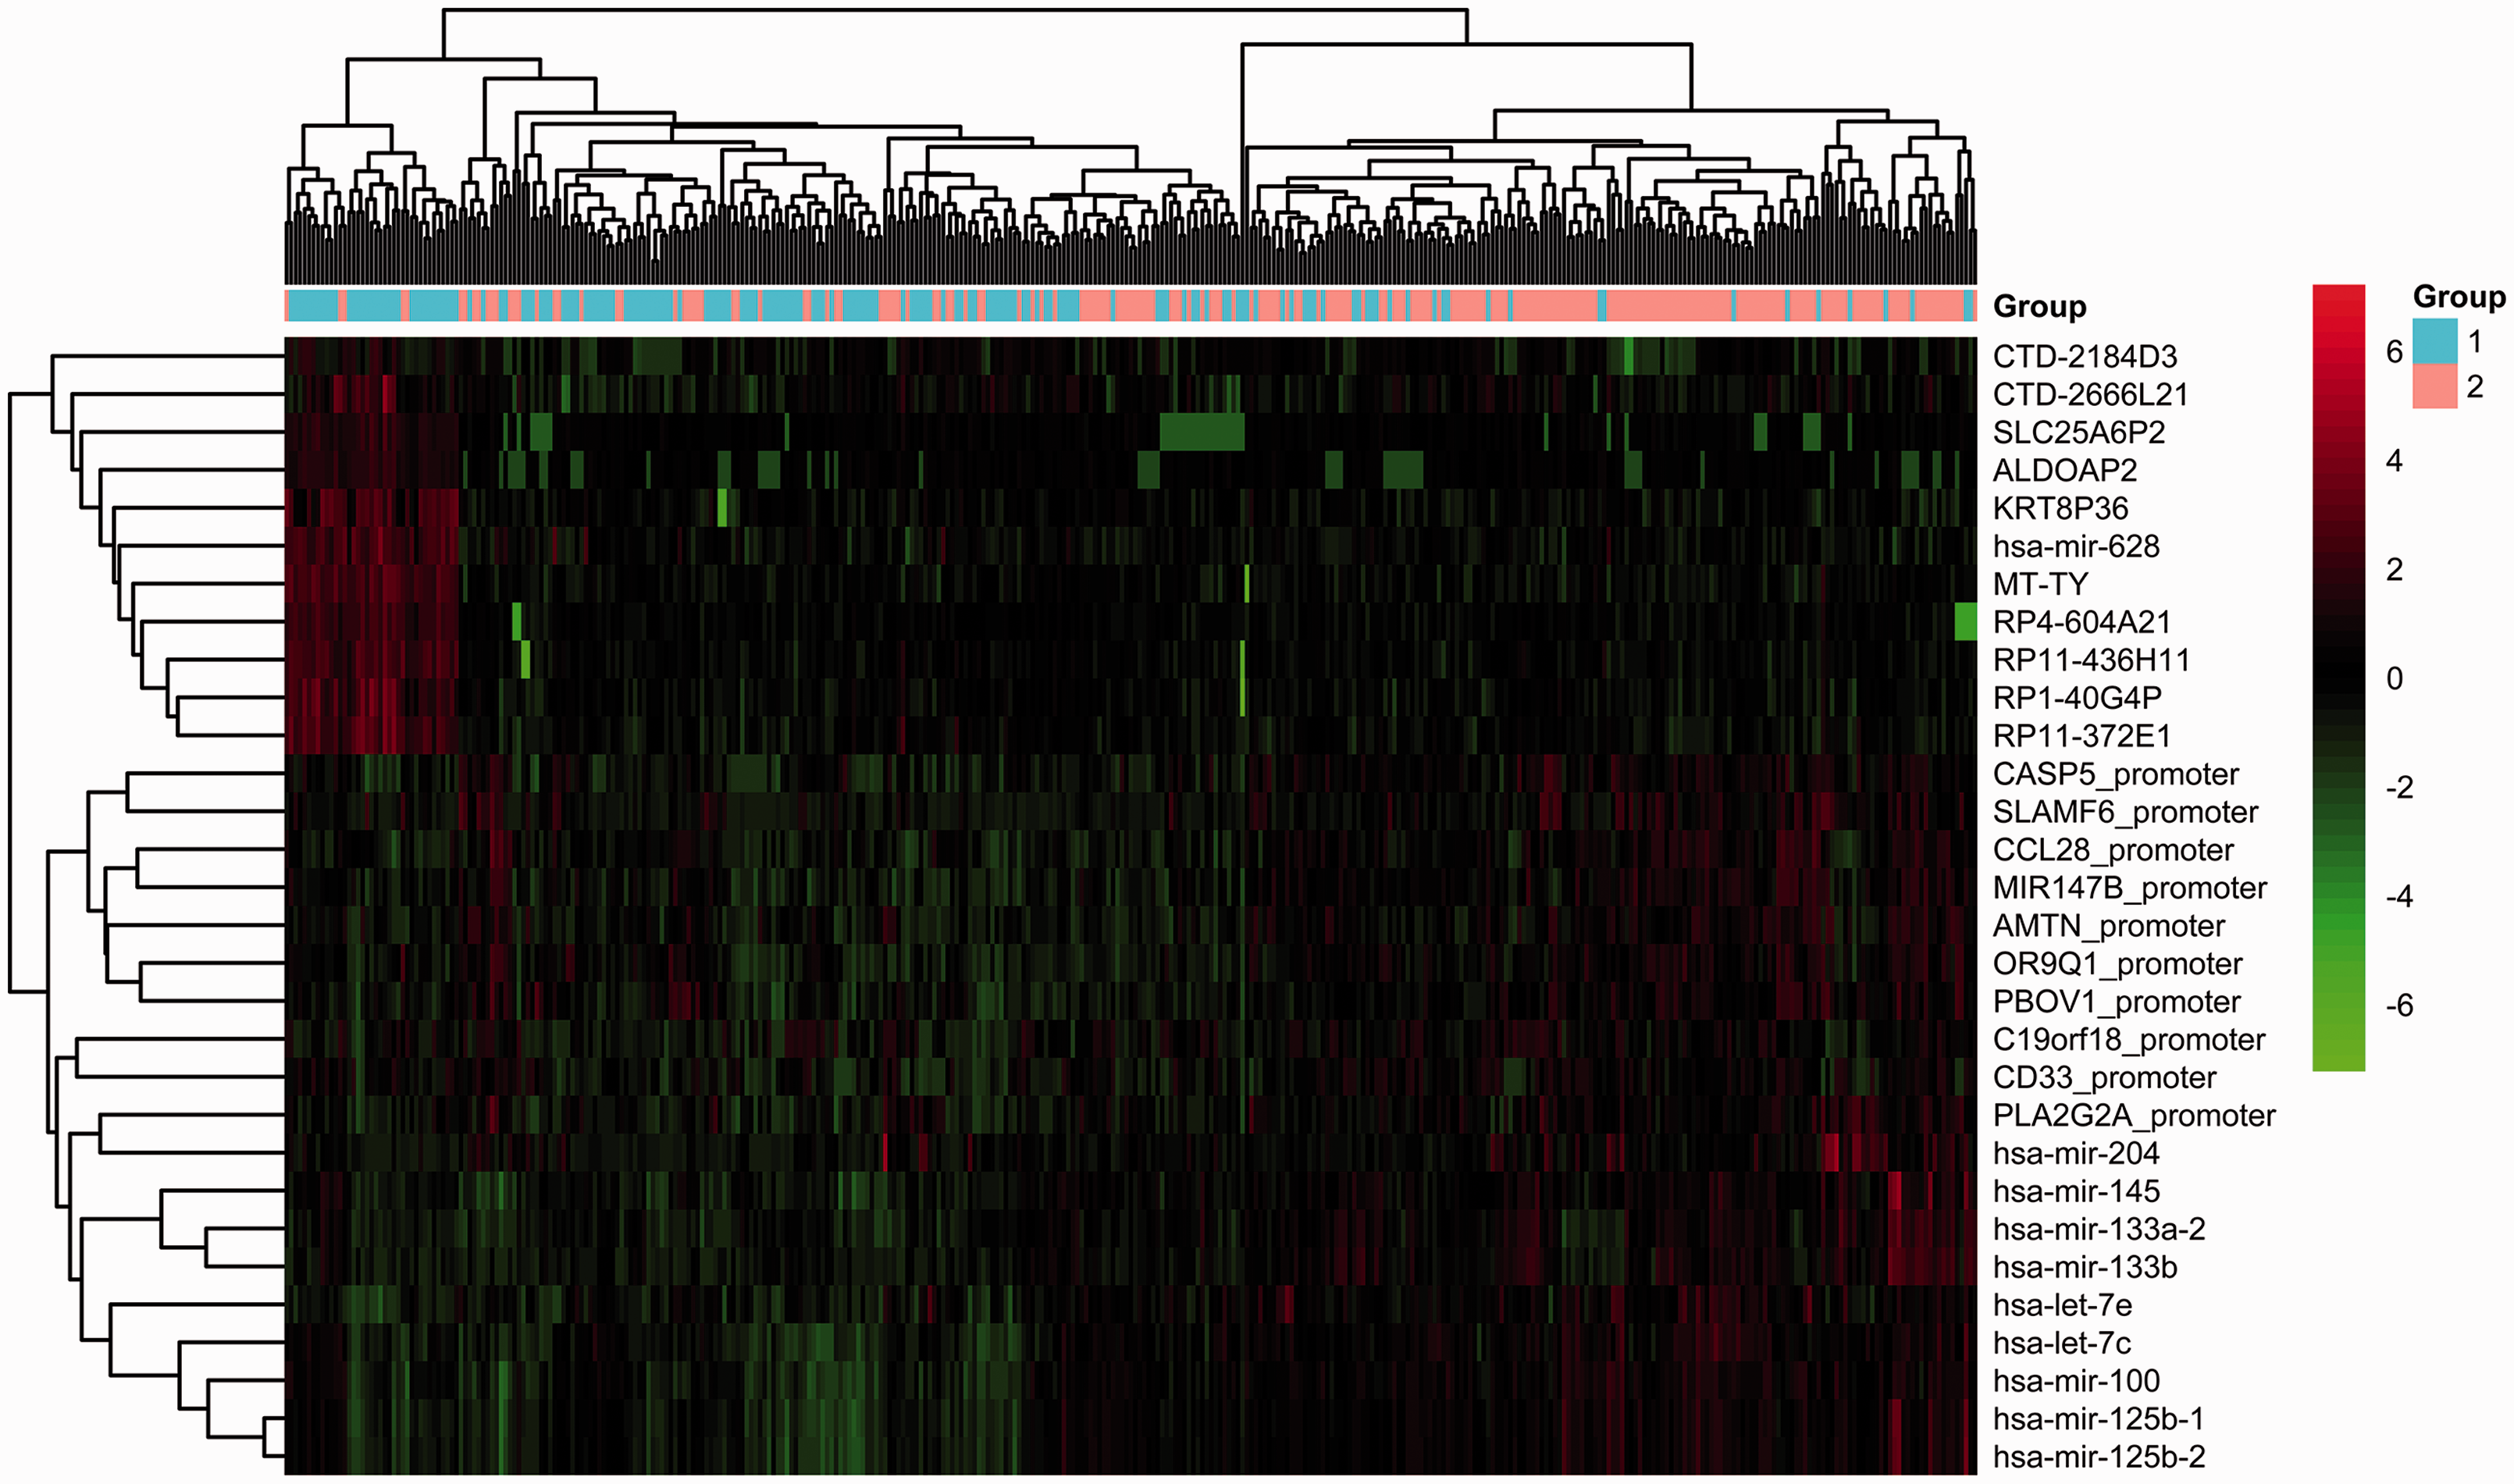
Heatmap of the clustering analysis results of the top 10 DEGs, top 10 DEmiRNAs, and top 10 DMGs. Blue and orange bars represent the G1 and G2 groups, respectively. (A color version of this figure is available in the online journal.)
These results indicate that the two survival groups have distinct genomic properties. Gene expression was not affected by promoter methylation in any gene using Pearson correlation analysis (correlation coefficient <–0.5, P < 0.001).
Of the 708 identified DEGs, 19 were predicted to be targets of six DEmiRNAs using the miRDB database (prediction score >80) and the TargetScan database (Pct > 0.8) (Supplemental Table 6). These miRNA-mRNA pairs were used to construct miRNA–mRNA networks, which included eight target genes (B3GNT7, SCUBE3, GDF6, BNC2, PCDH19, PEG10, PLA2G3, and CPEB1) of upregulated let-7c, five target genes (SCN2B, NAV3, KCNK3, INA, and CPLX2) of upregulated mir-34c, two target genes (GPM6A and PTPRZ1) of upregulated mir-133b, three target genes (KCNB1, OSR1, and ZFPM2) of downregulated mir-106a, six target genes (B3GNT7, PCDH19, PEG10, GDF6, PLA2G3, and CPEB1) of upregulated let-7e, and one target gene (FST) of downregulated mir-144 (Figure 5). Only B3GNT7 and PLA2G3 were downregulated DEGs, while the other 17 genes were upregulated DEGs. Additionally, let-7c, mir-133b, and let-7e were among the top 10 DEmiRNAs mentioned above.

miRNA-gene networks. Six DEmiRNAs and 19 predicted target DEGs are included in the networks. (A color version of this figure is available in the online journal.)
Using the upregulated and downregulated DEGs, we performed KEGG pathway enrichment analysis, respectively. Specifically, 27 signaling pathways were significantly enriched with the upregulated DEGs, including Wnt signaling pathway, calcium signaling pathway, and PI3K-Akt signaling pathway, whereas 25 signaling pathways significantly involved the downregulated DEGs, such as pancreatic secretion, nitrogen metabolism, and intestinal immune network for IgA production pathways (Figure 6, Supplemental Table 7). These results suggest that different signaling pathways are implicated in the carcinogenic mechanisms of the G1 and G2 groups.
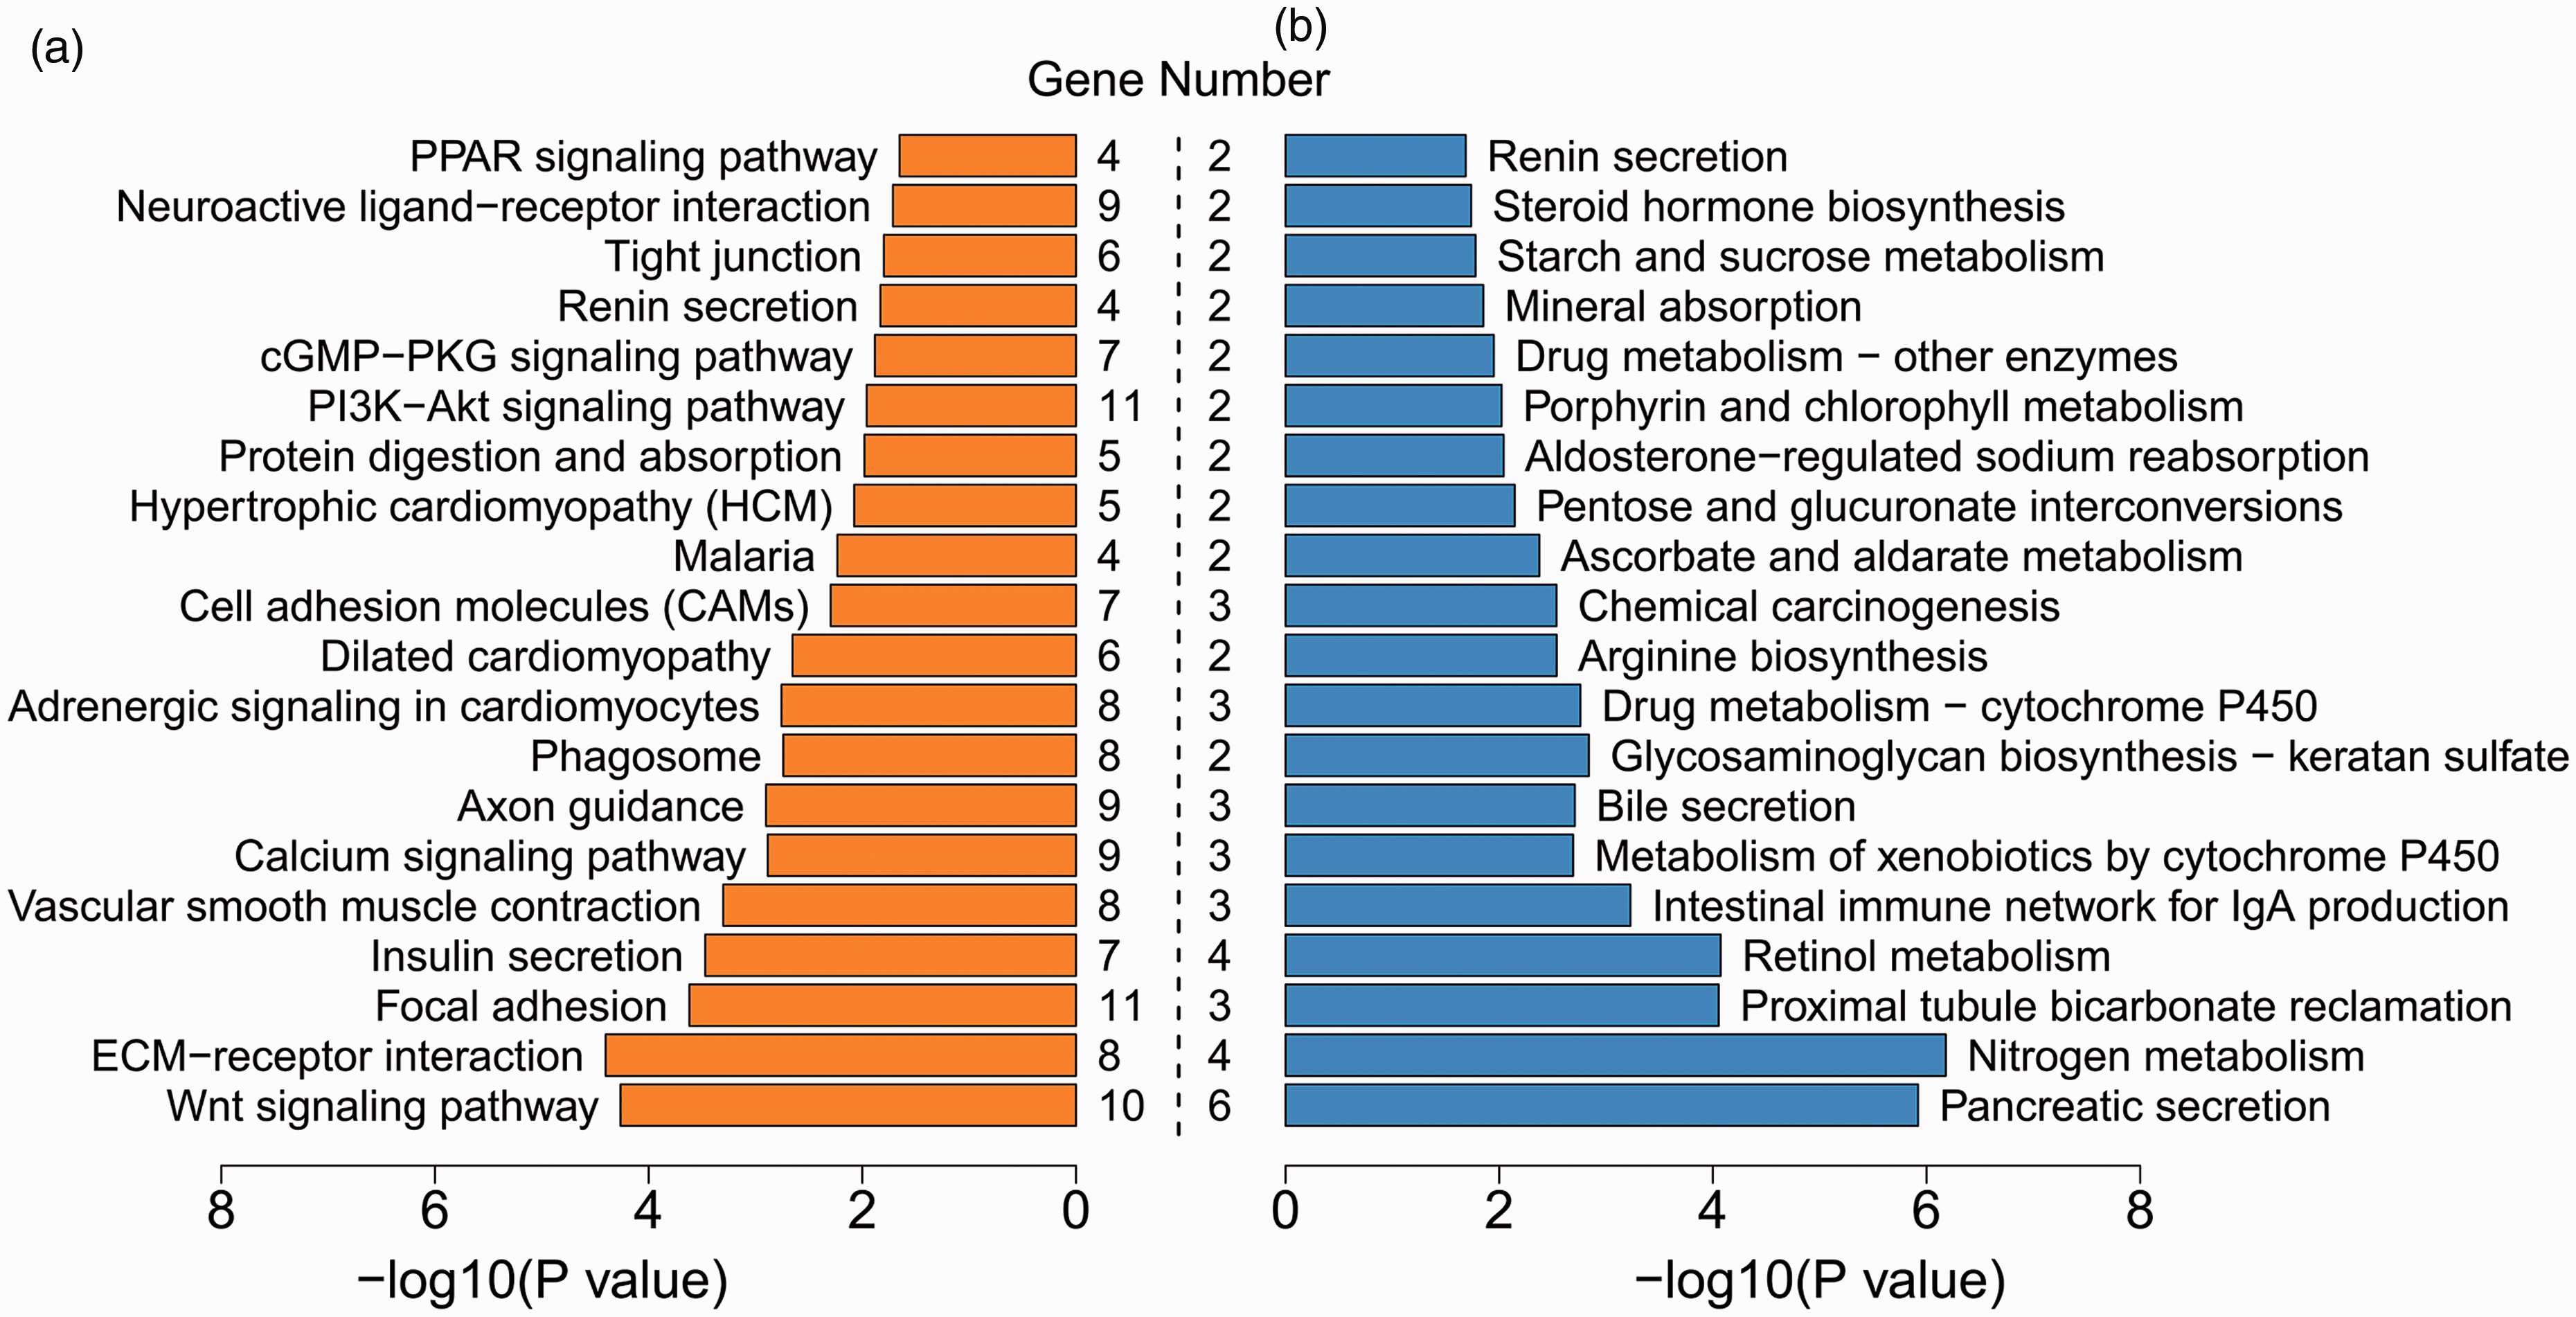
Top 20 significant signaling pathways for upregulated (a) and downregulated (b) DEGs. Gene number suggests the count of genes significantly enriched in a pathway. (A color version of this figure is available in the online journal.)
Discussion
CRC is characterized by high tumor heterogeneity, varied outcomes, and differential drug responses; thus, it is a difficult task to predict the survival of patients with CRC. 24 Mortality risk stratification in CRC patients would facilitate a deeper understanding of the molecular biology of CRC and a more precise use of individualized therapies, thereby leading to an improvement in the outcome of patients. 25 Our study successfully dichotomized CRC patients into two survival subpopulations using an autoencoder-based model. DNA methylation, RNA-seq, and miRNA-seq data of CRC samples from TCGA were integrated as a single input vector for the autoencoder framework to yield transformed features. Two optimal risk groups were obtained using k-means clustering and were used to build the SVM model. The prognostic value of the autoencoder-based model was robustly verified using hold-out validation and five validation cohorts. The risk groups were not only significantly related to survival, but also had significant prognostic value independent of clinical factors. To the best of our knowledge, this is the first study to employ an autoencoder-based model to capture the survival-related multi-omics features of CRC.
Incorporating multi-omics data enables the extraction of coherent biological features and is of remarkable significance for tailored medicine and management. 26 Multi-omics analysis data possess strong predictive power and can overcome the shortcomings of one-omics analysis, such as non-universality, uniqueness, and noisy data. 27 In this study, an autoencoder was applied for multi-omics integration to regenerate new representative features of CRC. Compared to other DL algorithms, the autoencoder does not require training data to be labeled, regenerates a smaller size of encodings, and has low computational complexity, with similar input and output data. 28 Owing to these prominent advantages, autoencoders have been frequently used in the field of medical data processing. 5 Furthermore, the current study showed that the autoencoder framework outperformed PCA, t-SNE, NMF, and the univariate Cox-PH-based strategy in identifying survival-related features of CRC. Our results suggest that the autoencoder is a feasible and reliable tool for multi-omics integration.
Our findings implied that the good prognosis group (G1) had more aggressive behaviors, whereas the poor prognosis group (G2) had less aggressive behaviors. The two groups have distinct carcinogenic mechanisms at the gene, miRNA, methylation, and pathway levels. Our results also indicate that the six DEmiRNAs (let-7c, mir-34c, mir-133b, let-7e, mir-144, and mir-106a) and their predicted 19 target genes in the constructed miRNA-mRNA networks are critical participants in the differential molecular mechanisms of the two groups and are important causes of their distinctive outcomes. Studies have reported that let-7c-5p is associated with the prognosis of CRC and may play a critical role in the progression of CRC.29,30 Previous reports have also revealed that another DEmiRNA, let-7e, is downregulated in CRC and exerts suppressive effects on the proliferation and migration of CRC cells.31,32 In the miRNA-mRNA networks constructed in our study, let-7c and let-7e shared six common target DEGs, including downregulated B3GNT7 and PLA2G3, and upregulated PCDH19, PEG10, GDF6, and CPEB1. These findings imply that let-7c and let-7e promote the progression and migration of CRC by downregulating B3GNT7 and PLA2G3, and upregulating PCDH19, PEG10, GDF6, and CPEB1. Beta-1, 3-N-acetylglucosaminyltransferase 7 (B3GNT7) is suppressed in colon oncogenetic processes to promote the cancer metastasis by increasing the expression of cell surface sialyl Lewis a and x antigens. 33 Phospholipase A2 group III (PLA2G3) plays an oncogenic and pro-inflammatory role in the biology of CRC and is a risk factor for lymph node metastasis as well as a prognostic biomarker. 34 Downregulation of protocadherin 19 (PCDH19), a tumor suppressor gene, promotes the metastasis and proliferation of hepatocellular carcinoma and is a predictor of poor prognosis.35,36 Paternally expressed gene 10 (PEG10) is involved in rectal adenocarcinoma metastasis 37 and contributes to tumor cell proliferation and invasion. 38 Growth differentiation factor 6 (GDF6), a member of the transforming growth factor (TGF)-β family, was significantly enriched in the TGF-β signaling pathway in our study, which is involved in modulating cell growth, differentiation, apoptosis, and homeostasis. 39 Cytoplasmic polyadenylation element-binding protein 1 (CPEB1), encoding a key component of tight junctions, mediates epithelial-to-mesenchymal transition (EMT) and the metastasis of breast cancer by regulating matrix metalloproteinase 9. 40
miR-34c-5p promotes the proliferation of cancer cells and CRC metastasis. 41 In the miRNA-mRNA networks, miR-34c was predicted to target SCN2B, NAV3, KCNK3, INA, and CPLX2, indicating that the five target genes mediate the promoting effect of miR-34c on CRC. Sodium voltage-gated channel beta subunit 2 (SCN2B) encodes cell adhesion molecules and is associated with the adhesion and migration of breast cancer cells. 42 Navigator 3 (NAV3) acts as a target gene of p73 to inhibit colon cancer metastasis 43 and is associated with colon cancer development-related inflammation. 44 TWIK-related acid-sensitive potassium channel 1 (TASK-1) encoded by potassium channel subfamily K member 3 (KCNK3) participates in the regulation of apoptosis and proliferation of lung cancer cells. 45 α-internexin (INA) inhibits microtubule polymerization in early stage CRC. 46 Complexin-2 (CPLX2) is upregulated in high-grade lung neuroendocrine tumors and serves as a potential prognostic biomarker. 47
Accumulating evidence shows that miR-133b is a tumor suppressor involved in the regulation of CRC cell proliferation and apoptosis.48,49 We found that miR-133b was upregulated in the poor prognosis group relative to the good prognosis group and was predicted to target GPM6A and PTPRZ1. Glycoprotein M6A (GPM6A), an oncogene, is related to EMT and cell migration in gonadotroph pituitary adenomas. 50 GPM6A expression at the mRNA and protein levels is negatively regulated by miR-133b during prenatal stress, 51 which aligns with our results. Protein tyrosine phosphatase receptor-like type Z polypeptide 1 (PTPRZ1) shows increased expression in CRC tissues and contributes to carcinogenesis. 52
miR-106a, a tumor suppressor, suppresses cell proliferation and strengthens cell apoptosis in CRC, 53 which aligns with our results that Hsa-mir-106a is downregulated in the poor prognosis group, targeting upregulated KCNB1, OSR1, and ZFPM2. Potassium channel subfamily B member 1 (KCNB1) expression is decreased in gastric and colorectal cancers and may be a promising prognostic biomarker. 54 Oxidative stress-responsive kinase 1 (OSR1) is related to the angiogenesis and proliferation of hepatoma cells. 55 The expression of zinc finger protein, FOG family member 2 (ZFPM2), a glioma susceptibility gene, is associated with the incidence and severity of glioma. 56 Additionally, the present study showed that downregulated miRNA-144 targeted FST, which was significantly enriched in the TGF-β signaling pathway. Consistently, there is a rich body of evidence that miRNA-144 functions as a tumor suppressor in CRC.57,58 Follistatin (FST) acts as an antagonist of the TGF-β family and participates in the tumorigenesis of solid tumors. 59 FST and TGF-β are inferred to mediate the inhibitory effect of miRNA-144 on CRC. Our study supports these miRNAs and target genes as potential prognostic biomarkers and therapeutic targets of CRC, providing more insights into the complicated regulatory mechanisms of CRC.
Our study illustrates an applicable analytical model for the survival prediction of CRC based on the integration of multi-omics data. However, some limitations of this study should not be ignored. Further improvements, such as the inclusion of clinical information as an additional modality, are beneficial for improving the performance of our autoencoder-based model before its application to other cancers. Further, the prognostic miRNAs and target genes should be validated using in vivo and in vitro experiments in future studies. Herein, the model was trained using coupled DNA methylation, RNA-seq, and miRNA-seq data from 379 tumor samples. Larger datasets with more tumor samples are expected to yield better results.
Supplemental Material
sj-pdf-1-ebm-10.1177_15353702211065010 - Supplemental material for Survival stratification for colorectal cancer via multi-omics integration using an autoencoder-based model
Supplemental material, sj-pdf-1-ebm-10.1177_15353702211065010 for Survival stratification for colorectal cancer via multi-omics integration using an autoencoder-based model by Hu Song, Chengwei Ruan, Yixin Xu, Teng Xu, Ruizhi Fan, Tao Jiang, Meng Cao and Jun Song in Experimental Biology and Medicine
Footnotes
AUTHORS’ CONTRIBUTIONS
All authors participated in the design, interpretation of the studies, analysis of the data, and review of the manuscript; HS and JS wrote the article.
DECLARATION OF CONFLICTING INTERESTS
The author(s) declare no potential conflicts of interest with respect to the research, authorship, and/or publication of this article.
FUNDING
The author(s) disclosed receipt of the following financial support for the research, authorship, and/or publication of this article: This work was supported by the Project of Invigorating Health Care through Science, Technology and Education for Jiangsu Provincial Medical Youth Talent (grant number QNRC2016790).
SupplementAL MATERIAL
Supplemental material for this article is available online.
References
Supplementary Material
Please find the following supplemental material available below.
For Open Access articles published under a Creative Commons License, all supplemental material carries the same license as the article it is associated with.
For non-Open Access articles published, all supplemental material carries a non-exclusive license, and permission requests for re-use of supplemental material or any part of supplemental material shall be sent directly to the copyright owner as specified in the copyright notice associated with the article.