
Abstract
In this article, we present the
Introduction
Continuous glucose monitoring systems (CGMs) were originally designed for the clinical management of type 1 diabetes. However, their use has expanded rapidly, and they are now used by patients with type 2 diabetes and even individuals without diabetes. There have been numerous randomized clinical trials demonstrating the benefits of CGM use for managing glucose control (Beck et al. 2017; Martens et al. 2021), and CGMs have been incorporated into large, population-based studies to examine glucose patterns in the general community and their associations with clinical outcomes (Daya et al. 2024; Shah et al. 2019; Selvin et al. 2021; Spartano et al. 2025). CGM systems generate a large amount of data (that is, ∼1,300 to ∼21,000 readings over 15 days, depending on the sensor) in different formats. Flexible and reproducible tools are needed for researchers to analyze and interpret these data. While CGM manufacturers produce CGM summary reports for patients and their providers, these reports are designed for clinical use and typically summarize up to ∼2 weeks of data on a single person with a limited number of CGM summary statistics.
There is currently no standardized approach to the processing or analysis of CGM data. This lack of standardization in the field is complicated by the diversity of data output formatting across CGM systems, making it difficult to directly compare results including CGM summary statistics across studies. Thus, there is a need for flexible statistical commands that can process a wide variety of data and conduct analyses using different approaches. For example, these commands should be able to vary cutpoints for time in range and time above and below range, alter the definition of hypoglycemic or hyperglycemic episodes based on level and duration, require a certain percentage of valid readings (for example, 70%) for the summary metrics to be considered reliable, and be able to drop the first or last 24 hours of data. Typically, CGM sensor data are considered less reliable during the first 24 hours of wear. During this time, a CGM sensor may have unexpectedly high or low readings as it is initializing and calibrating. Over time, sensor degradation or changes in adhesion to the skin may lead to inaccurate readings or signal interruptions toward the end of the wear period. There also may be gaps in the data because of issues with the sensor or transmitter (that is, sensor displacement, poor adhesion, software glitches, etc.). There is no standard approach for handling these issues.
In prior studies, including major randomized clinical trials, it is unclear if some CGM data points were excluded or if all available sensor readings were used (Aleppo et al. 2017). For example, some studies drop the first and last days of CGM data, but others do not (Beck et al. 2017; Wan et al. 2018). The handling of missing data is also variable. While some studies impute small gaps (that is, less than 30 minutes) using interpolation methods, others do not (Kuang et al. Forthcoming). Large gaps may lead to exclusion of participants if the missing data exceed a predefined threshold to deem the summary statistic reliable (that is, the guidelines suggest that a minimum of 70% of data are captured from the total CGM wear time).
The lack of standardization in data processing methods across studies including clinical trials involving CGM data suggests a need for clearer reporting and methodological consistency to enhance the reliability of findings.
Automating the calculation of CGM metrics is efficient and ensures an accurate and reproducible approach. Several commands exist, primarily in R or as web-based or desktop applications, to process and summarize CGM data (Karakus, Snell-Bergeon, and Akturk 2025). To our knowledge, there are no commands that provide a flexible and automated approach to process and comprehensively analyze CGM data. Also, existing commands often lack the flexibility to accommodate data from the more than 10 major CGM systems used globally that store glucose readings at various intervals. They also lack the flexibility to allow users to easily drop a specified number of 24-hour periods from the start or end of the wear period or restrict the analysis to a specified period according to dates and times, all in one command. Most software commands do not automatically generate individual time-series data for a given person to examine how an individual’s CGM summary metrics vary by day.
We created the first command to process, summarize, and visualize data from CGM systems.
The
Because CGMs are increasingly used by patients and in research studies, there is a growing need for software to summarize and visualize CGM time series using a flexible approach and with automated output of standard CGM metrics that are consistent with clinical practice. The
The cgmstats command
Description
The
The
Syntax
The input dataset or datasets must contain three columns with the following information: ID (unique identifier for each person); timestamp (date and time of glucose reading); and sensor glucose reading. The user specifies the variable name for each of the three columns.
Raw CGM data are typically received in the comma-separated values format. The user may prepare the respective .
All input datasets should be saved in the user-specified directory or, if not specified in the command syntax, the working directory (by default).
The command syntax is
If timestamp is in the incorrect format, the user will receive an error that says, for example,

Additionally, if duplicate timestamps are found, the user will receive the following error:

If the directory containing the input .

Options
hyper(numlist) defines glucose value cutpoints for a hyperglycemic episode. An episode is defined as no values below glucose value cutpoints for a certain period of time. Default values are 140 mg/dL (7.8 mmol/L), 180 mg/dL (10 mmol/L), and 250 mg/dL (13.9 mmol/L).
Output
After users run the

If Xi, contains a decimal point, it is converted to an underscore in the variable name. For example, if Xi, is 2.9, the variable name would be
The output dataset is saved in the specified working directory ($
Example 1
This example (using

Note that the decimal point in “3.9” (one of the default values for
This is a snapshot of the output dataset:

Figure 1 displays frequency histograms of the CGM summary statistics that we specified in the hist() option of the previous
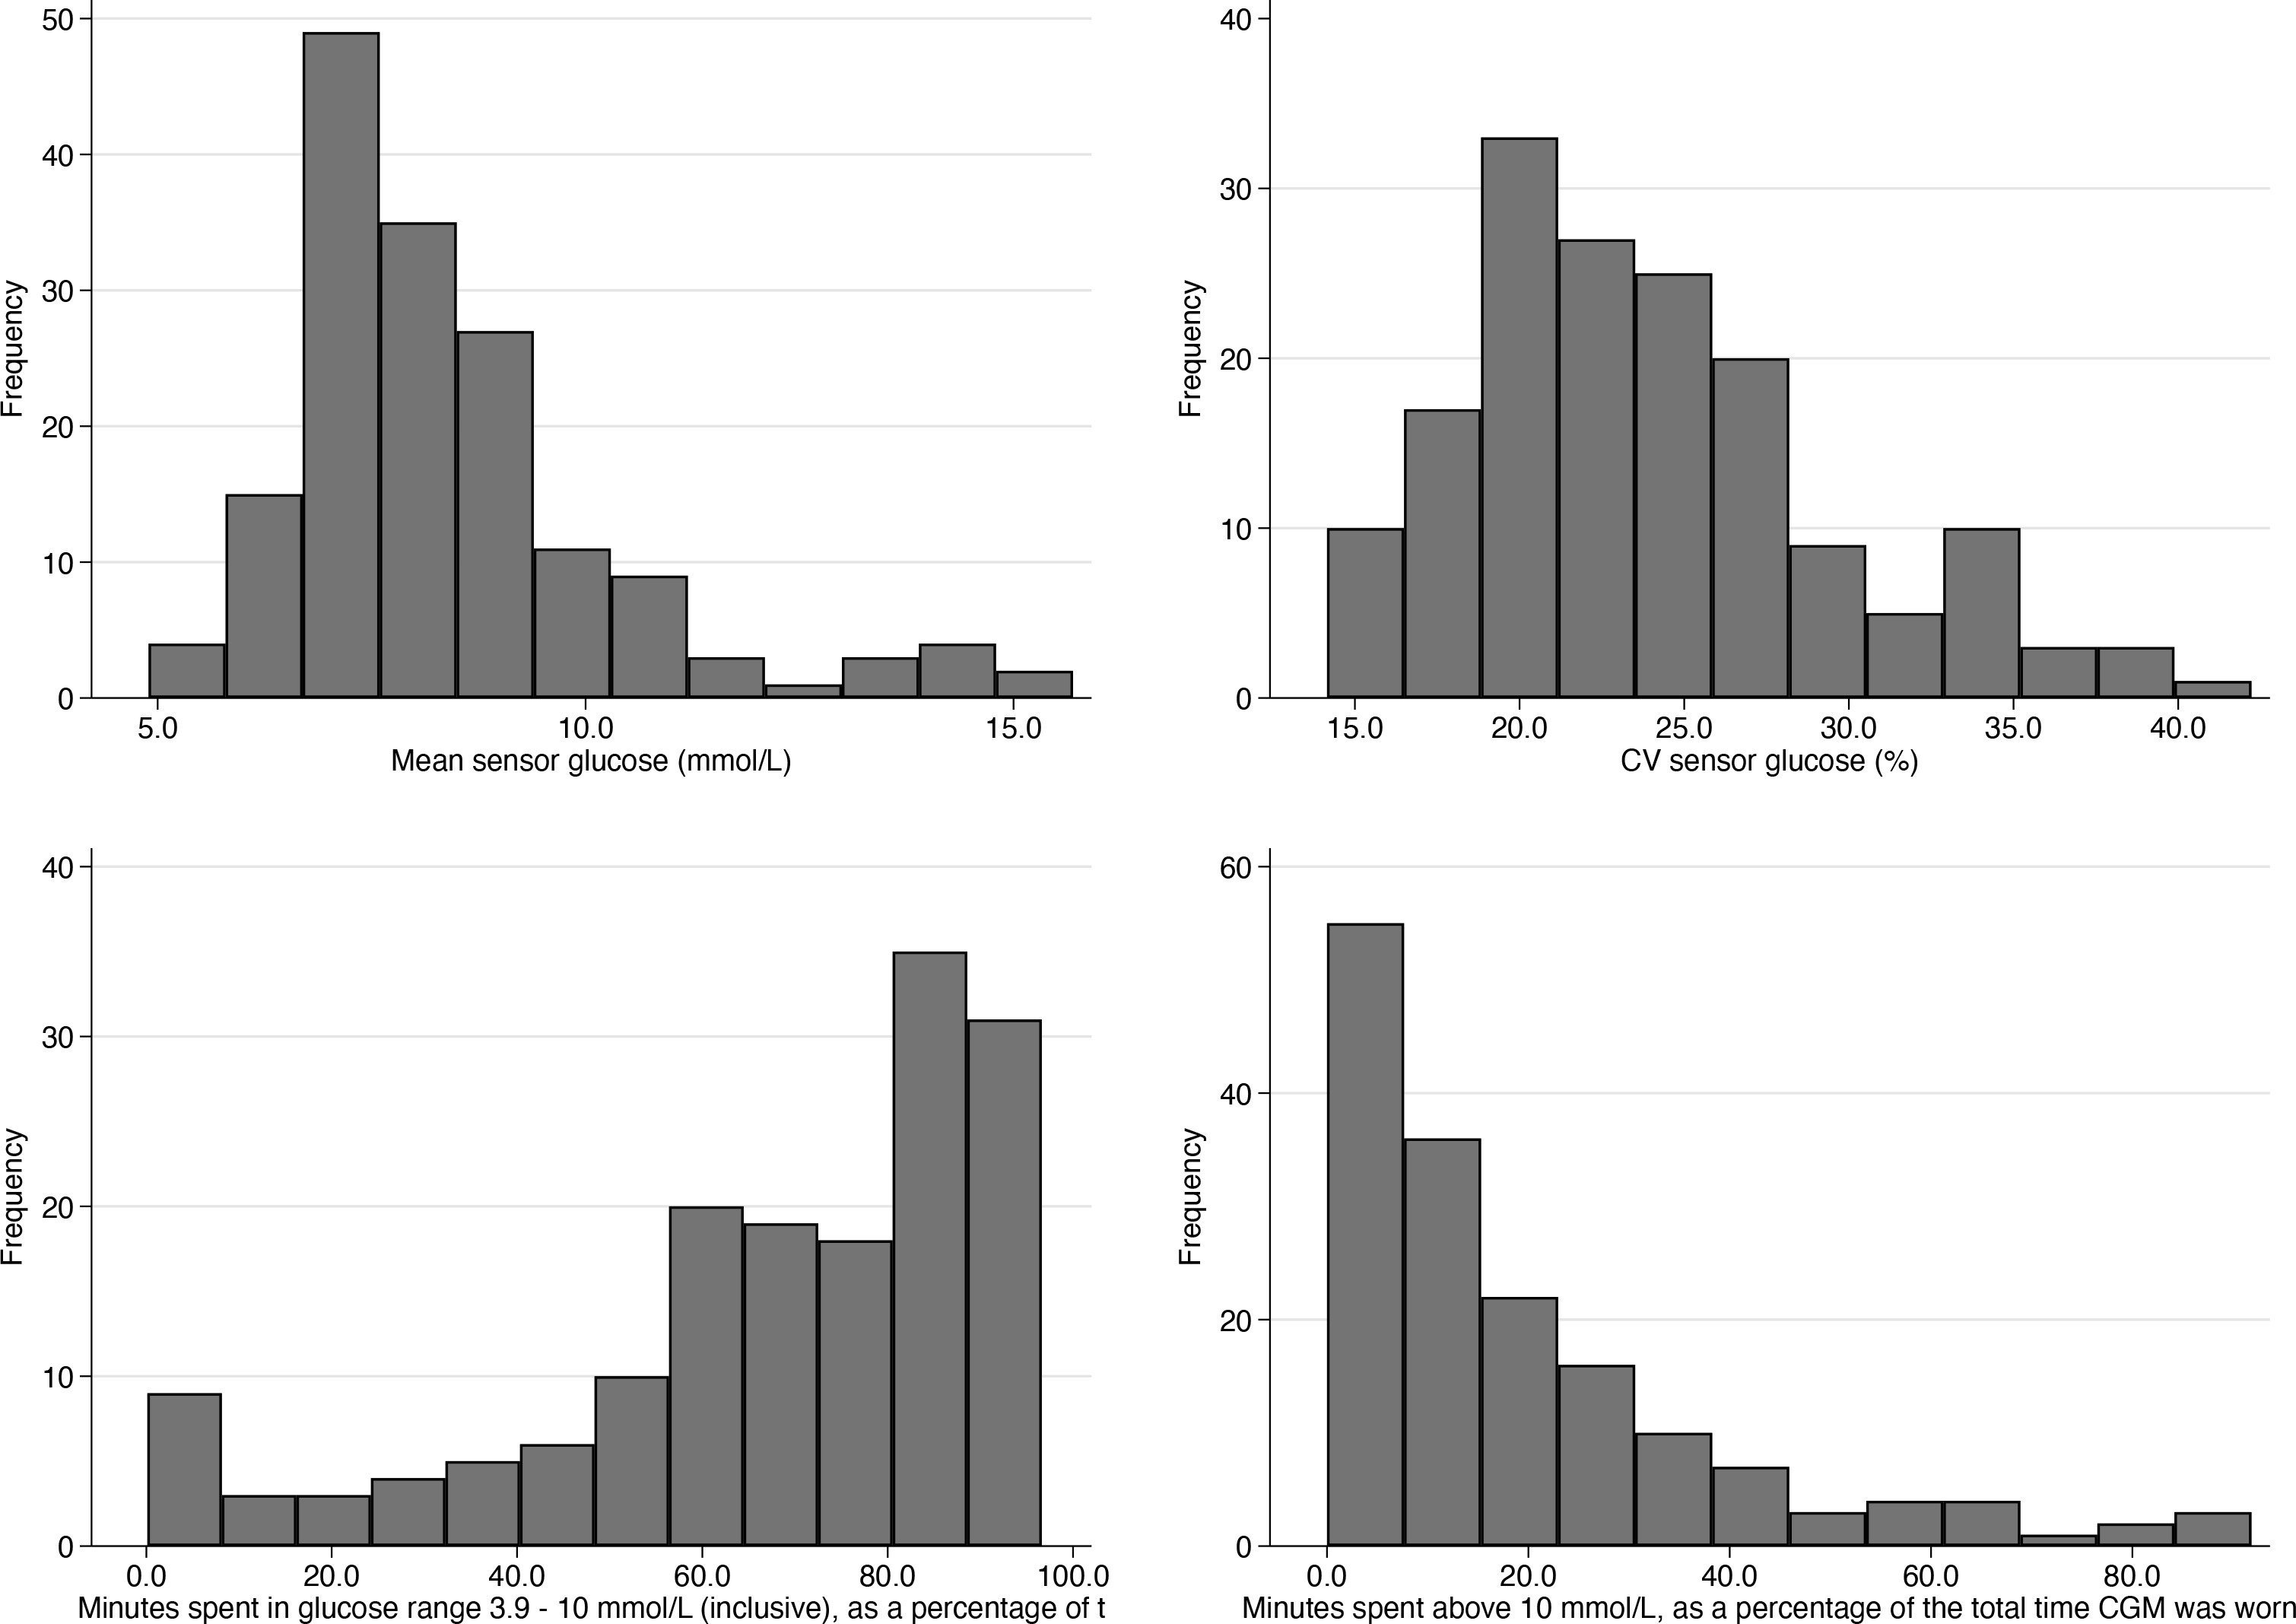
Frequency histograms of CGM specified summary statistics
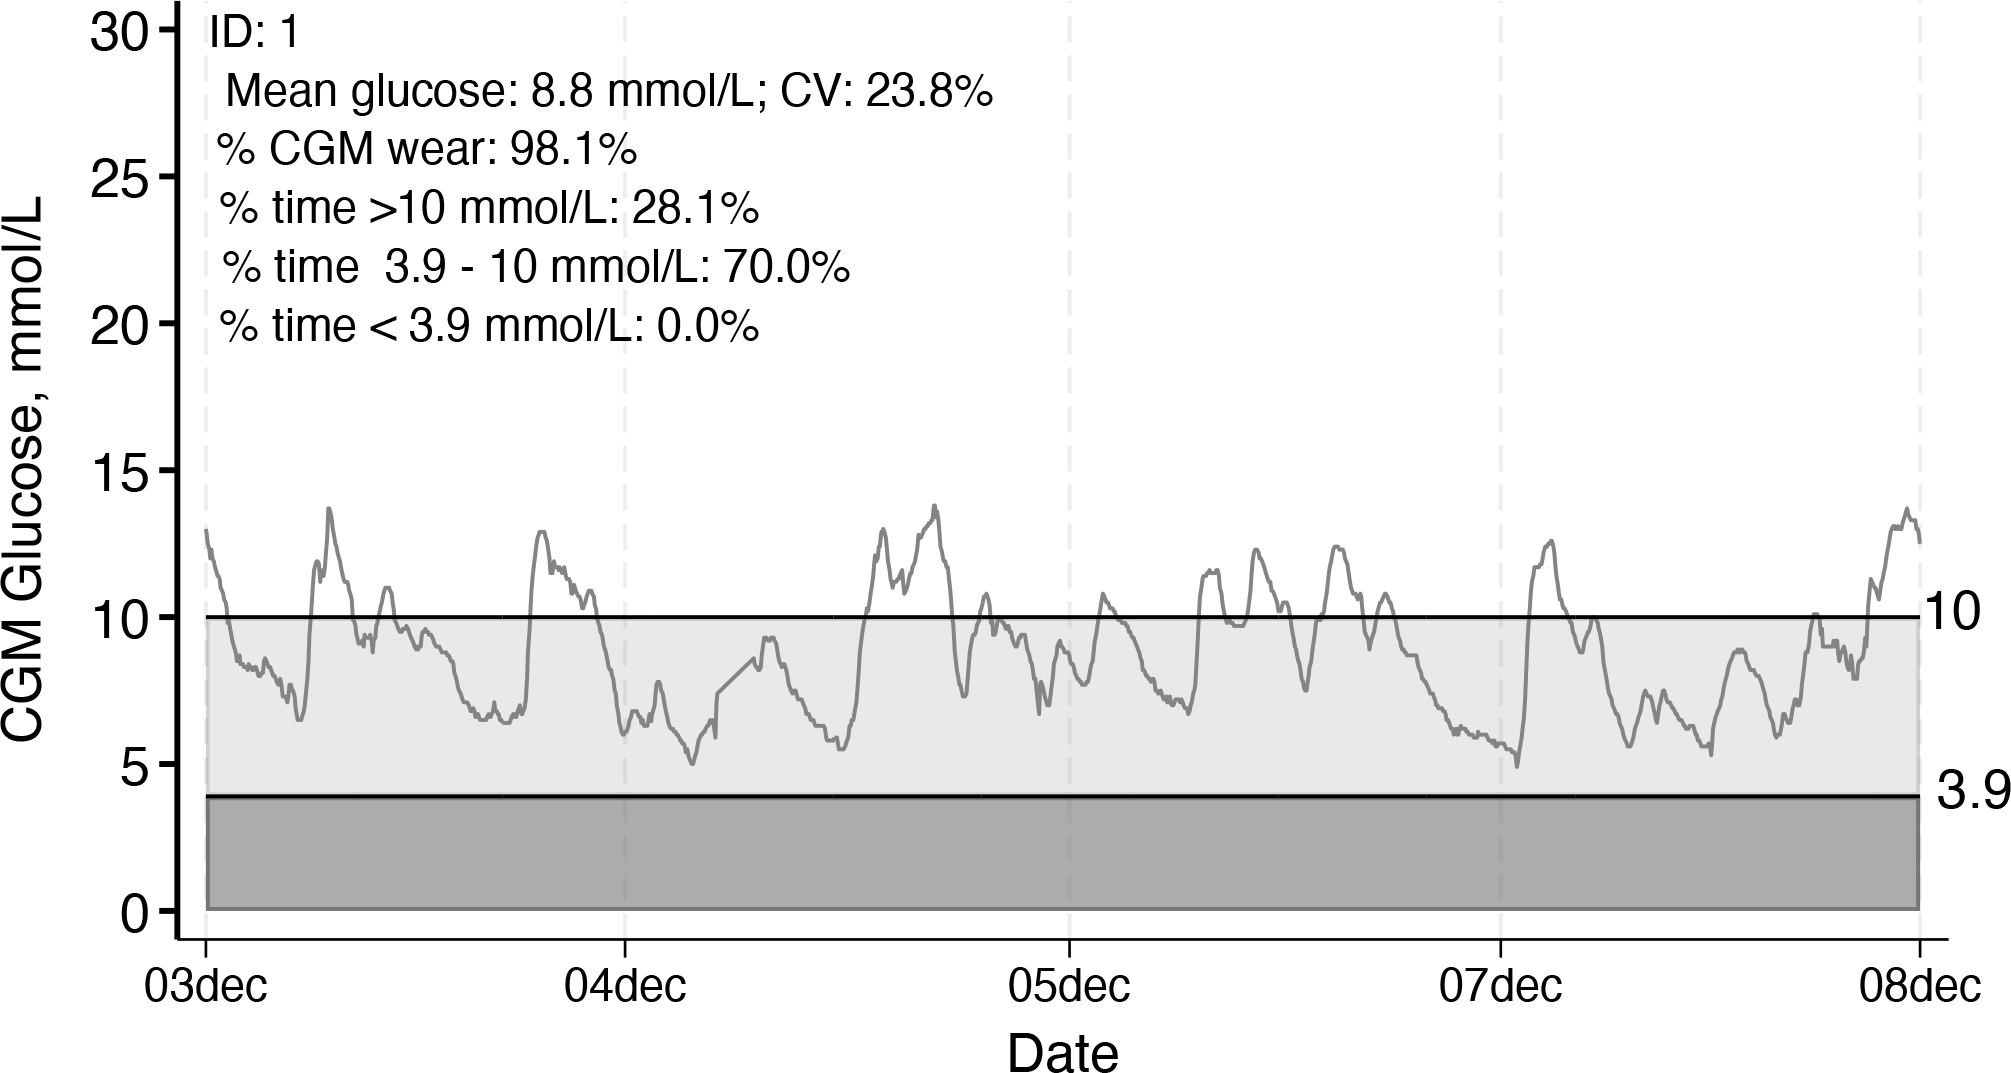
The CGM glucose tracings for each individual in the dataset are output using the option

Individual CGM glucose tracing with summary data displayed, example 1, ID 1

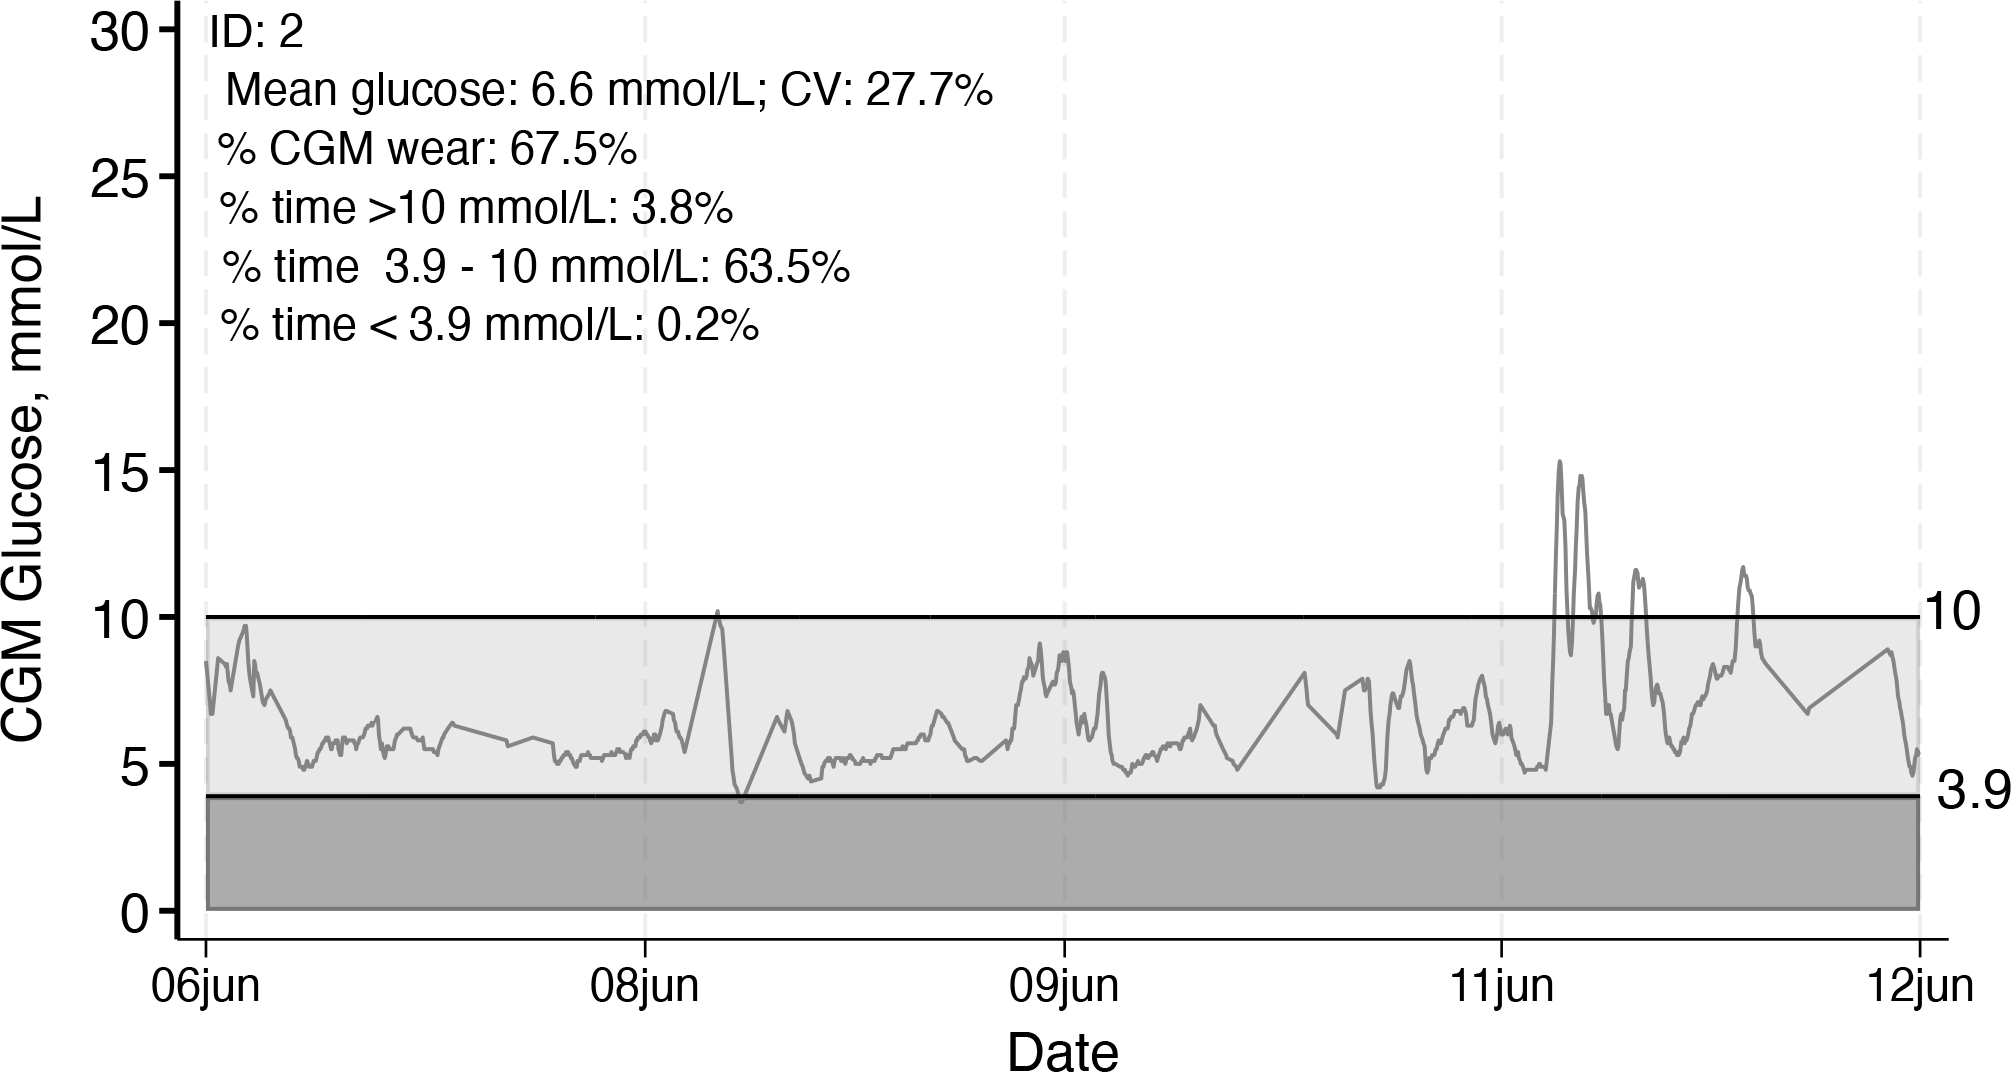
Individual CGM glucose tracing with summary data displayed, example 1, ID 2
The lighter shading indicates time in range, and the darker shading indicates time below range, as specified by the user or according to the default (time in range 70-140 mg/dL or 3.9-7.8 mmol/L).
In the example CGM tracings above, there are gaps between CGM glucose readings. If we specify the option

In both versions, the summary statistics printed on the plots are from the actual data (no interpolation). Summary statistics can be suppressed using the option
This example (using

This is a snapshot of the output dataset:

The CGM glucose tracings for each person and each day of wear are outputted using the option
Individual CGM glucose tracing with summary data displayed and gaps filled using linear interpolation, example 1, ID 1
Individual CGM glucose tracing with summary data displayed and gaps filled using linear interpolation, example 1, ID 2

Individual CGM tracing by day with day-specific summary statistics, example 2, ID 6, day 5
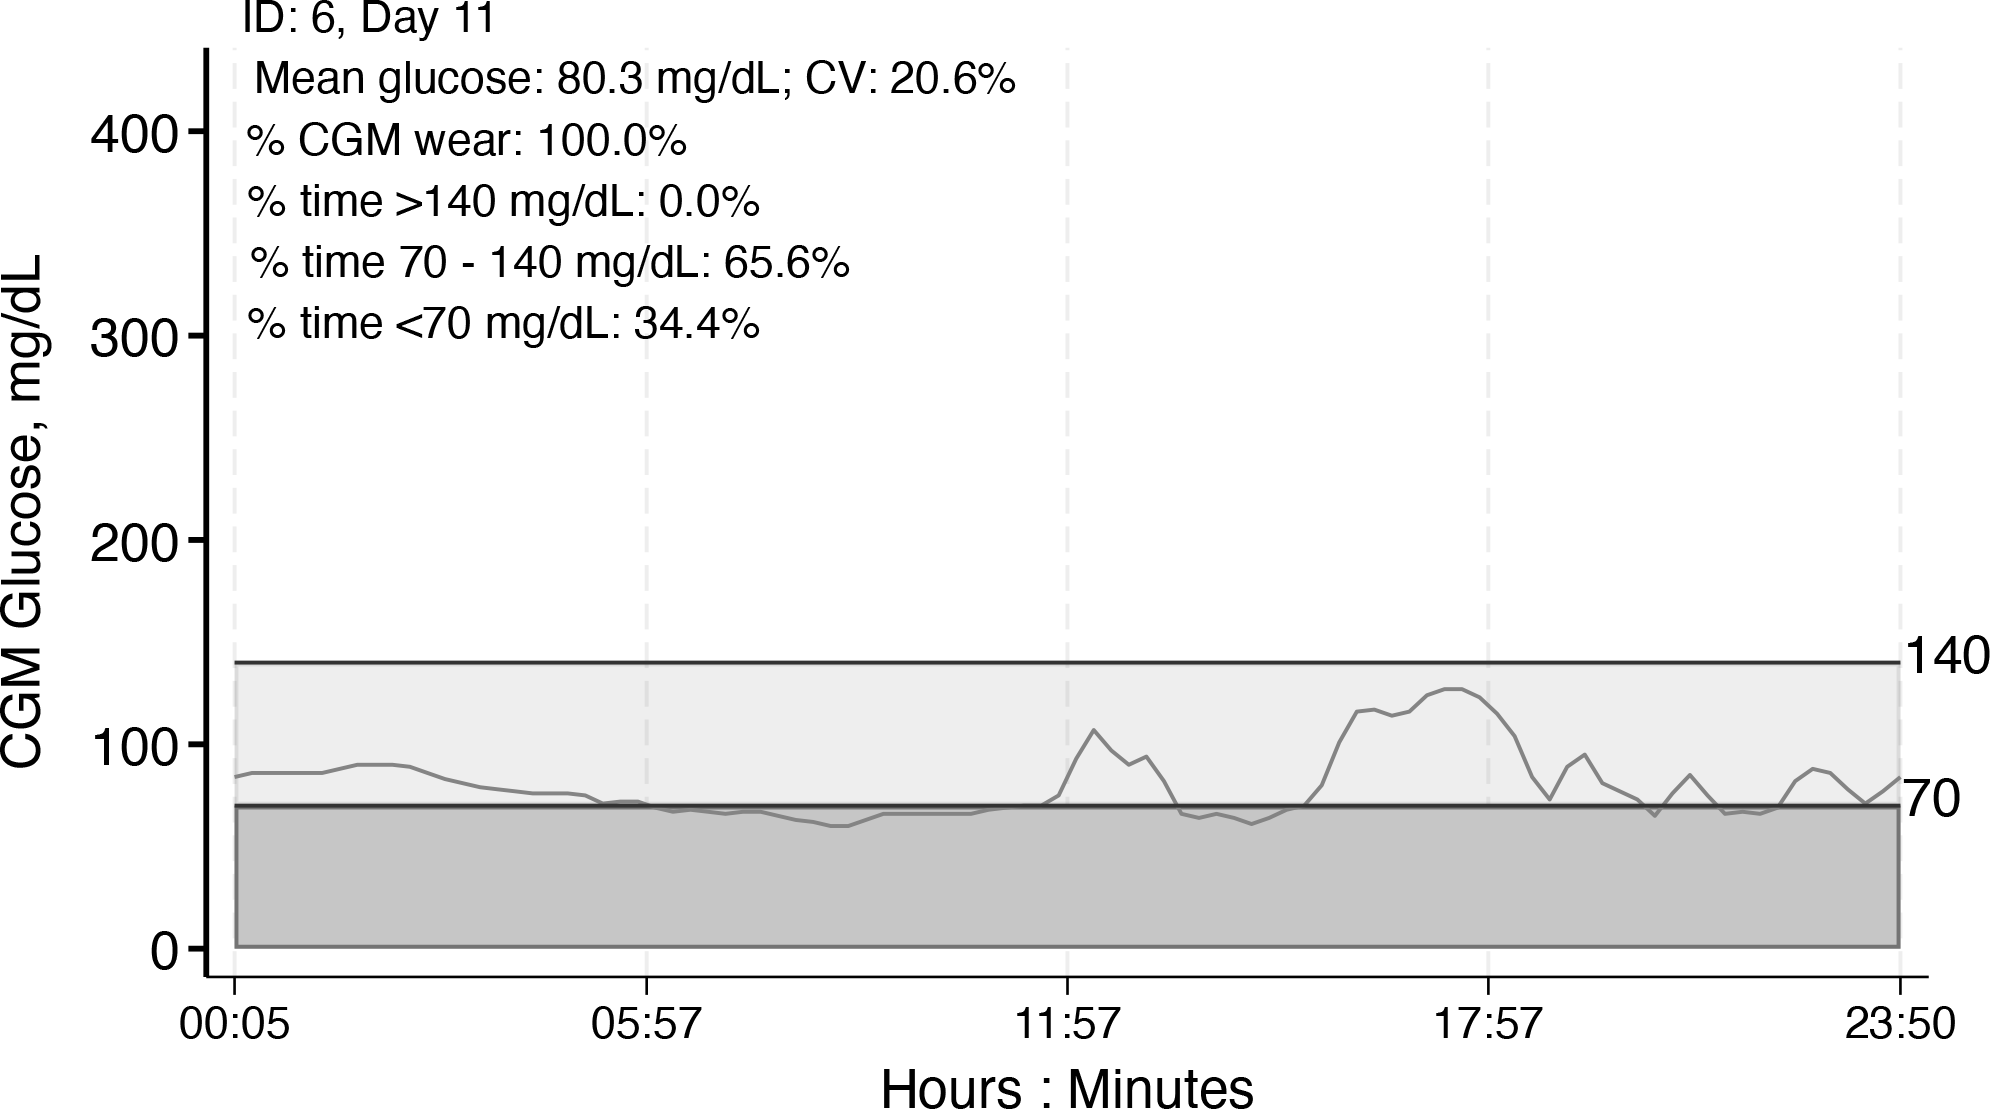
Individual CGM tracing by day with day-specific summary statistics, example 2, ID 6, day 11
This article introduced
Emerging research using CGM data involves advanced approaches including machine learning models (Dave et al. 2020; Klonoff et al. 2025). Although the
The functions and flexibility offered in
Supplemental Material
sj-txt-1-stj-10.1177_1536867X261450271 - Supplemental material for Summarizing data from continuous glucose monitors using the cgmstats command
Supplemental material, sj-txt-1-stj-10.1177_1536867X261450271 for Summarizing data from continuous glucose monitors using the cgmstats command by Natalie Daya Malek, Dan Wang, Sui Zhang, Michael Fang, Amelia Wallace, Scott Zeger and Elizabeth Selvin in The Stata Journal
Supplemental Material
sj-dta-4-stj-10.1177_1536867X261450271 - Supplemental material for Summarizing data from continuous glucose monitors using the cgmstats command
Supplemental material, sj-dta-4-stj-10.1177_1536867X261450271 for Summarizing data from continuous glucose monitors using the cgmstats command by Natalie Daya Malek, Dan Wang, Sui Zhang, Michael Fang, Amelia Wallace, Scott Zeger and Elizabeth Selvin in The Stata Journal
Supplemental Material
sj-dta-3-stj-10.1177_1536867X261450271 - Supplemental material for Summarizing data from continuous glucose monitors using the cgmstats command
Supplemental material, sj-dta-3-stj-10.1177_1536867X261450271 for Summarizing data from continuous glucose monitors using the cgmstats command by Natalie Daya Malek, Dan Wang, Sui Zhang, Michael Fang, Amelia Wallace, Scott Zeger and Elizabeth Selvin in The Stata Journal
Supplemental Material
sj-dta-2-stj-10.1177_1536867X261450271 - Supplemental material for Summarizing data from continuous glucose monitors using the cgmstats command
Supplemental material, sj-dta-2-stj-10.1177_1536867X261450271 for Summarizing data from continuous glucose monitors using the cgmstats command by Natalie Daya Malek, Dan Wang, Sui Zhang, Michael Fang, Amelia Wallace, Scott Zeger and Elizabeth Selvin in The Stata Journal
Supplemental Material
sj-dta-1-stj-10.1177_1536867X261450271 - Supplemental material for Summarizing data from continuous glucose monitors using the cgmstats command
Supplemental material, sj-dta-1-stj-10.1177_1536867X261450271 for Summarizing data from continuous glucose monitors using the cgmstats command by Natalie Daya Malek, Dan Wang, Sui Zhang, Michael Fang, Amelia Wallace, Scott Zeger and Elizabeth Selvin in The Stata Journal
Footnotes
7 Acknowledgments
We thank the members of Dr. Elizabeth Selvin’s Diabetes Data group for their invaluable support with this work, including pilot testing and feedback. Dr. Selvin is supported by National Institutes of Health and National Institute of Diabetes and Digestive and Kidney Diseases grant R01 DK128837 and a Merit Award from the American Heart Association. Dr. Fang is supported by National Institutes of Health and National Institute of Diabetes and Digestive and Kidney Diseases career development award K01 DK138273.
8 Programs and supplemental materials
To install the software files as they existed at the time of publication of this article, type
About the authors
Natalie Daya Malek is a research associate at the Johns Hopkins Bloomberg School of Public Health (Welch Center for Prevention, Epidemiology, and Clinical Research).
Dan Wang and Sui Zhang are senior biostatisticians at the Johns Hopkins Bloomberg School of Public Health (Welch Center for Prevention, Epidemiology, and Clinical Research).
Michael Fang is an assistant professor at the Johns Hopkins Bloomberg School of Public Health (Welch Center for Prevention, Epidemiology, and Clinical Research).
Amelia Wallace is an assistant scientist at the Johns Hopkins Bloomberg School of Public Health (Welch Center for Prevention, Epidemiology, and Clinical Research).
Scott Zeger is a professor at Johns Hopkins Bloomberg School of Public Health in the Department of Biostatistics.
Elizabeth Selvin is a professor at Johns Hopkins Bloomberg School of Public Health and the director of the Welch Center for Prevention, Epidemiology, and Clinical Research.
All authors are longtime Stata users.
References
Supplementary Material
Please find the following supplemental material available below.
For Open Access articles published under a Creative Commons License, all supplemental material carries the same license as the article it is associated with.
For non-Open Access articles published, all supplemental material carries a non-exclusive license, and permission requests for re-use of supplemental material or any part of supplemental material shall be sent directly to the copyright owner as specified in the copyright notice associated with the article.