
Abstract
Despite embelin’s (EB) promising biological activities including the hepatoprotective effect, its clinical use is constrained by inadequate solubility and low oral bioavailability, which restrict its therapeutic effectiveness. The current study aimed to address this gap by developing EB-loaded glycerosomes (GLSMs), an advanced vesicular system designed to improve oral bioavailability and enhance drug delivery to the liver. EB-loaded GLSMs were prepared using a thin-film hydration method and optimized via a 32 Box–Behnken design. The concentrations of soy lecithin and glycerol, along with the probe sonication cycle, were chosen as independent variables to study their effect on vesicle size and percentage drug entrapment. The prepared formulation was tested for vesicle size and its distribution, surface charge (zeta potential), and drug release and was also assessed in vivo. The optimized formulation exhibited a vesicle size of 214.41 ± 2.12 nm, a polydispersity index of 0.145 ± 0.02, a zeta potential of −30 ± 1.14 mV, and an entrapment efficiency (EE) of 94.74% ± 0.056%. Transmission electron microscopy images confirmed the presence of uniform, spherical vesicles with no signs of aggregation. The sustained-release properties of the GLSM formulation were evident, with 99% of EB released from the pure drug suspension within 2 h, compared with the same amount released from the EB-loaded GLSMs over 12 h. In vivo pharmacokinetic studies showed a significantly higher plasma maximum concentration (Cmax), AUC0–t, and AUC0–∞ values for optimized EB-loaded GLSMs compared with aqueous EB suspension (p < 0.01), resulting in approximately 2.5-fold greater plasma bioavailability. Furthermore, rats treated with the optimized EB-loaded GLSMs showed significantly lower serum triglyceride and total cholesterol levels compared with those treated with the aqueous EB suspension. The developed EB-loaded GLSMs exhibited promising lipid-lowering and hepatoprotective effects, suggesting their potential as a therapeutic approach for liver diseases.
Keywords
INTRODUCTION
Broadly, metabolic dysfunction-associated steatotic liver disease (MASLD) refers to a spectrum of conditions characterized by hepatic steatosis in hepatocytes and excessive fat accumulation. 1 The pathological processes associated with MASLD include nonalcoholic steatohepatitis (NASH), through progressive hepatic fibrosis, leading to cirrhosis (an irreversible process) as determined by liver biopsy. 2 MASLD has been identified as the most common liver disease, with a global prevalence of 25.4%. Its prevalence is higher in Western countries, the Middle East, and South America (∼30%) and lowest in Africa (∼13%).3–5 In Asian countries such as India, MASLD has emerged as the most common liver disease.6,7
Despite its growing health impact, MASLD remains a diagnostic and therapeutic challenge for clinicians. The pathogenesis of MASLD is multifactorial; therefore, current therapy primarily relies on lifestyle modifications and pharmacological interventions. Rezdiffra® (resmetirom) became the first drug approved by the U.S. Food and Drug Administration (FDA) for the treatment of MASLD in 2024. It is specifically recommended for patients with noncirrhotic NASH with moderate to advanced fibrosis. However, existing medications can be cytotoxic and may cause adverse effects due to poor targeting and nonspecific cellular uptake. In addition, the insulin sensitizer and oral hypoglycemic agents are not liver targeted and may cause systemic adverse effects including gastrointestinal symptoms.8,9 Rezdiffra is expensive, costing approximately $40,000–$50,000 annually, and exhibits a low patient response rate of 25%–30%. Consequently, there is an urgent need to explore alternative therapeutic options for MASLD treatment. 10
The use of herbal medicines for MASLD has gained attention in recent decades due to their widespread availability, fewer side effects, and demonstrated therapeutic potential. Preclinical and clinical studies have shown that herbal remedies can positively influence the onset and progression of MASLD. Furthermore, randomized controlled trials have provided encouraging evidence regarding the safety and efficacy of traditional herbal treatments. 11 Herbal extracts have been shown to enhance insulin sensitivity and lipid metabolism, and to reduce oxidative stress and inflammation. 12
Embelin (EB) is a naturally occurring para-benzoquinone compound derived from the Embelia genus, specifically Embelia ribes Burm.f. It exhibits a range of pharmacological effects, including antibacterial, 13 hepatoprotective, 14 analgesic, 15 wound healing, 16 and anticonvulsant 17 properties. EB has demonstrated protective effects against liver disorders, particularly hepatocarcinogenesis and lipid peroxidation. Moreover, EB plays a significant role in regulating hepatic fibrosis by mitigating inflammation associated with macrophages and oxidative stress in the liver. However, limited research is available on the potential role of EB in MASLD treatment. 18
Despite its promising in vitro bioactivity, EB’s therapeutic efficacy in vivo is hindered by its rapid liver metabolism and low aqueous solubility. As a result, its absorption is poor, and its oral bioavailability is limited to 30.2%. 19 This low bioavailability may reduce its therapeutic effectiveness, necessitating higher doses to achieve the desired outcome. Given EB’s potential as a therapeutic agent and its limited oral absorption, it is essential to develop alternative formulations to improve its solubility, dissolution, and oral bioavailability. 20
While various nanocarrier systems—such as liposomes, solid lipid nanoparticles (SLNs), and polymeric nanoparticles—have been explored to enhance the delivery of poorly water-soluble drugs,21,22 glycerosomes (GLSMs) were specifically selected for EB due to their unique advantages. Unlike conventional liposomes with limited flexibility, GLSMs incorporate 10%–30% w/v glycerol into phospholipid bilayers, enhancing vesicle deformability, gastrointestinal stability, and lymphatic uptake while avoiding the scale-up complexities and potential toxicity of SLNs or polymeric nanoparticles. 23 Glycerol is considered safe, nontoxic, and nonirritating. GLSMs are capable of encapsulating both hydrophilic and hydrophobic drugs. 24 The high glycerol content alters the bilayer membrane structure, enhancing the vesicles’ fluidity. 25 In addition, GLSMs can protect encapsulated drugs from degradation in the gastrointestinal tract. 26 Their lipid composition enables targeting of the lymphatic system,27,28 allowing oral administration of drugs while bypassing hepatic first-pass metabolism via lymphatic absorption.29–31
In this study, EB-loaded GLSMs were designed and optimized by selecting the amount of soy lecithin (X1), glycerol concentration (X2), and probe sonication cycles (X3) as input variables. The formulations were optimized based on the following two response parameters: percentage drug entrapment (Y1) and vesicle size (Y2). The final optimized formulation was then evaluated for drug EE, vesicle size, surface charge, drug release profile, release kinetics, cytotoxicity, in vivo pharmacokinetics, and pharmacodynamic properties.
MATERIALS AND METHODS
Materials
EB was purchased from Yucca Enterprises (Mumbai, Maharashtra, India), while soy lecithin and cholesterol were obtained from Sigma Aldrich (New Delhi, India). The high-fat diet (HFD; TD88137) was purchased from Inotiv (Indiana, United States). Culture media, penicillin–streptomycin, MTT [(4,5-dimethylthiazol-2yl)-2,5-diphenyl tetrazolium bromide], fetal bovine serum (FBS), and Dulbecco’s modified Eagle’s medium (DMEM) reagents used in the cell line study were purchased from HiMedia Laboratories Pvt. Ltd., Mumbai, India (Gibco®). The ultraviolet–visible spectrophotometer (UV–visible) was purchased from Shimadzu (Japan) and the Buchi Rotavapor R-300 from Accumax (India).
Preparation of EB-Loaded GLSMs
EB-loaded GLSMs were prepared using the thin-film hydration technique based on the Bangham method with modifications. An accurately weighed amount of EB was solubilized in a solvent mixture of chloroform and methanol (7:3 v/v) and sonicated for 1 min using a batch sonicator to obtain a clear solution. This solution was then transferred to a 100 mL round-bottom flask containing soya lecithin (16.21 mM), cholesterol (10 mM), and glycerol (17.9% v/v) and evaporated using a rotary evaporator (60°C, 0.028 g, reduced pressure) to form a thin lipid film. The formed thin film was further subjected to drying in a desiccator to remove residual organic solvents.
The thin film was hydrated in two stages with 10 mL of a glycerol–water solution. In the first stage, 5 mL of the glycerol aqueous solution was used to hydrate the thin film, followed by rotation at 60°C for 1 h using the rotary evaporator. In the second stage, the remaining 5 mL of glycerol aqueous solution was added, and the film was further rotated for another 1 h at 60°C. The resulting dispersion was probe-sonicated at 40% amplitude for 25 cycles of 4 s on/5 s off. The final dispersion was labeled and stored at 2°C–8°C (Fig. 1).32,33 Placebo GLSMs were prepared identically, excluding EB to serve as a control to evaluate the effects due to the carrier system.
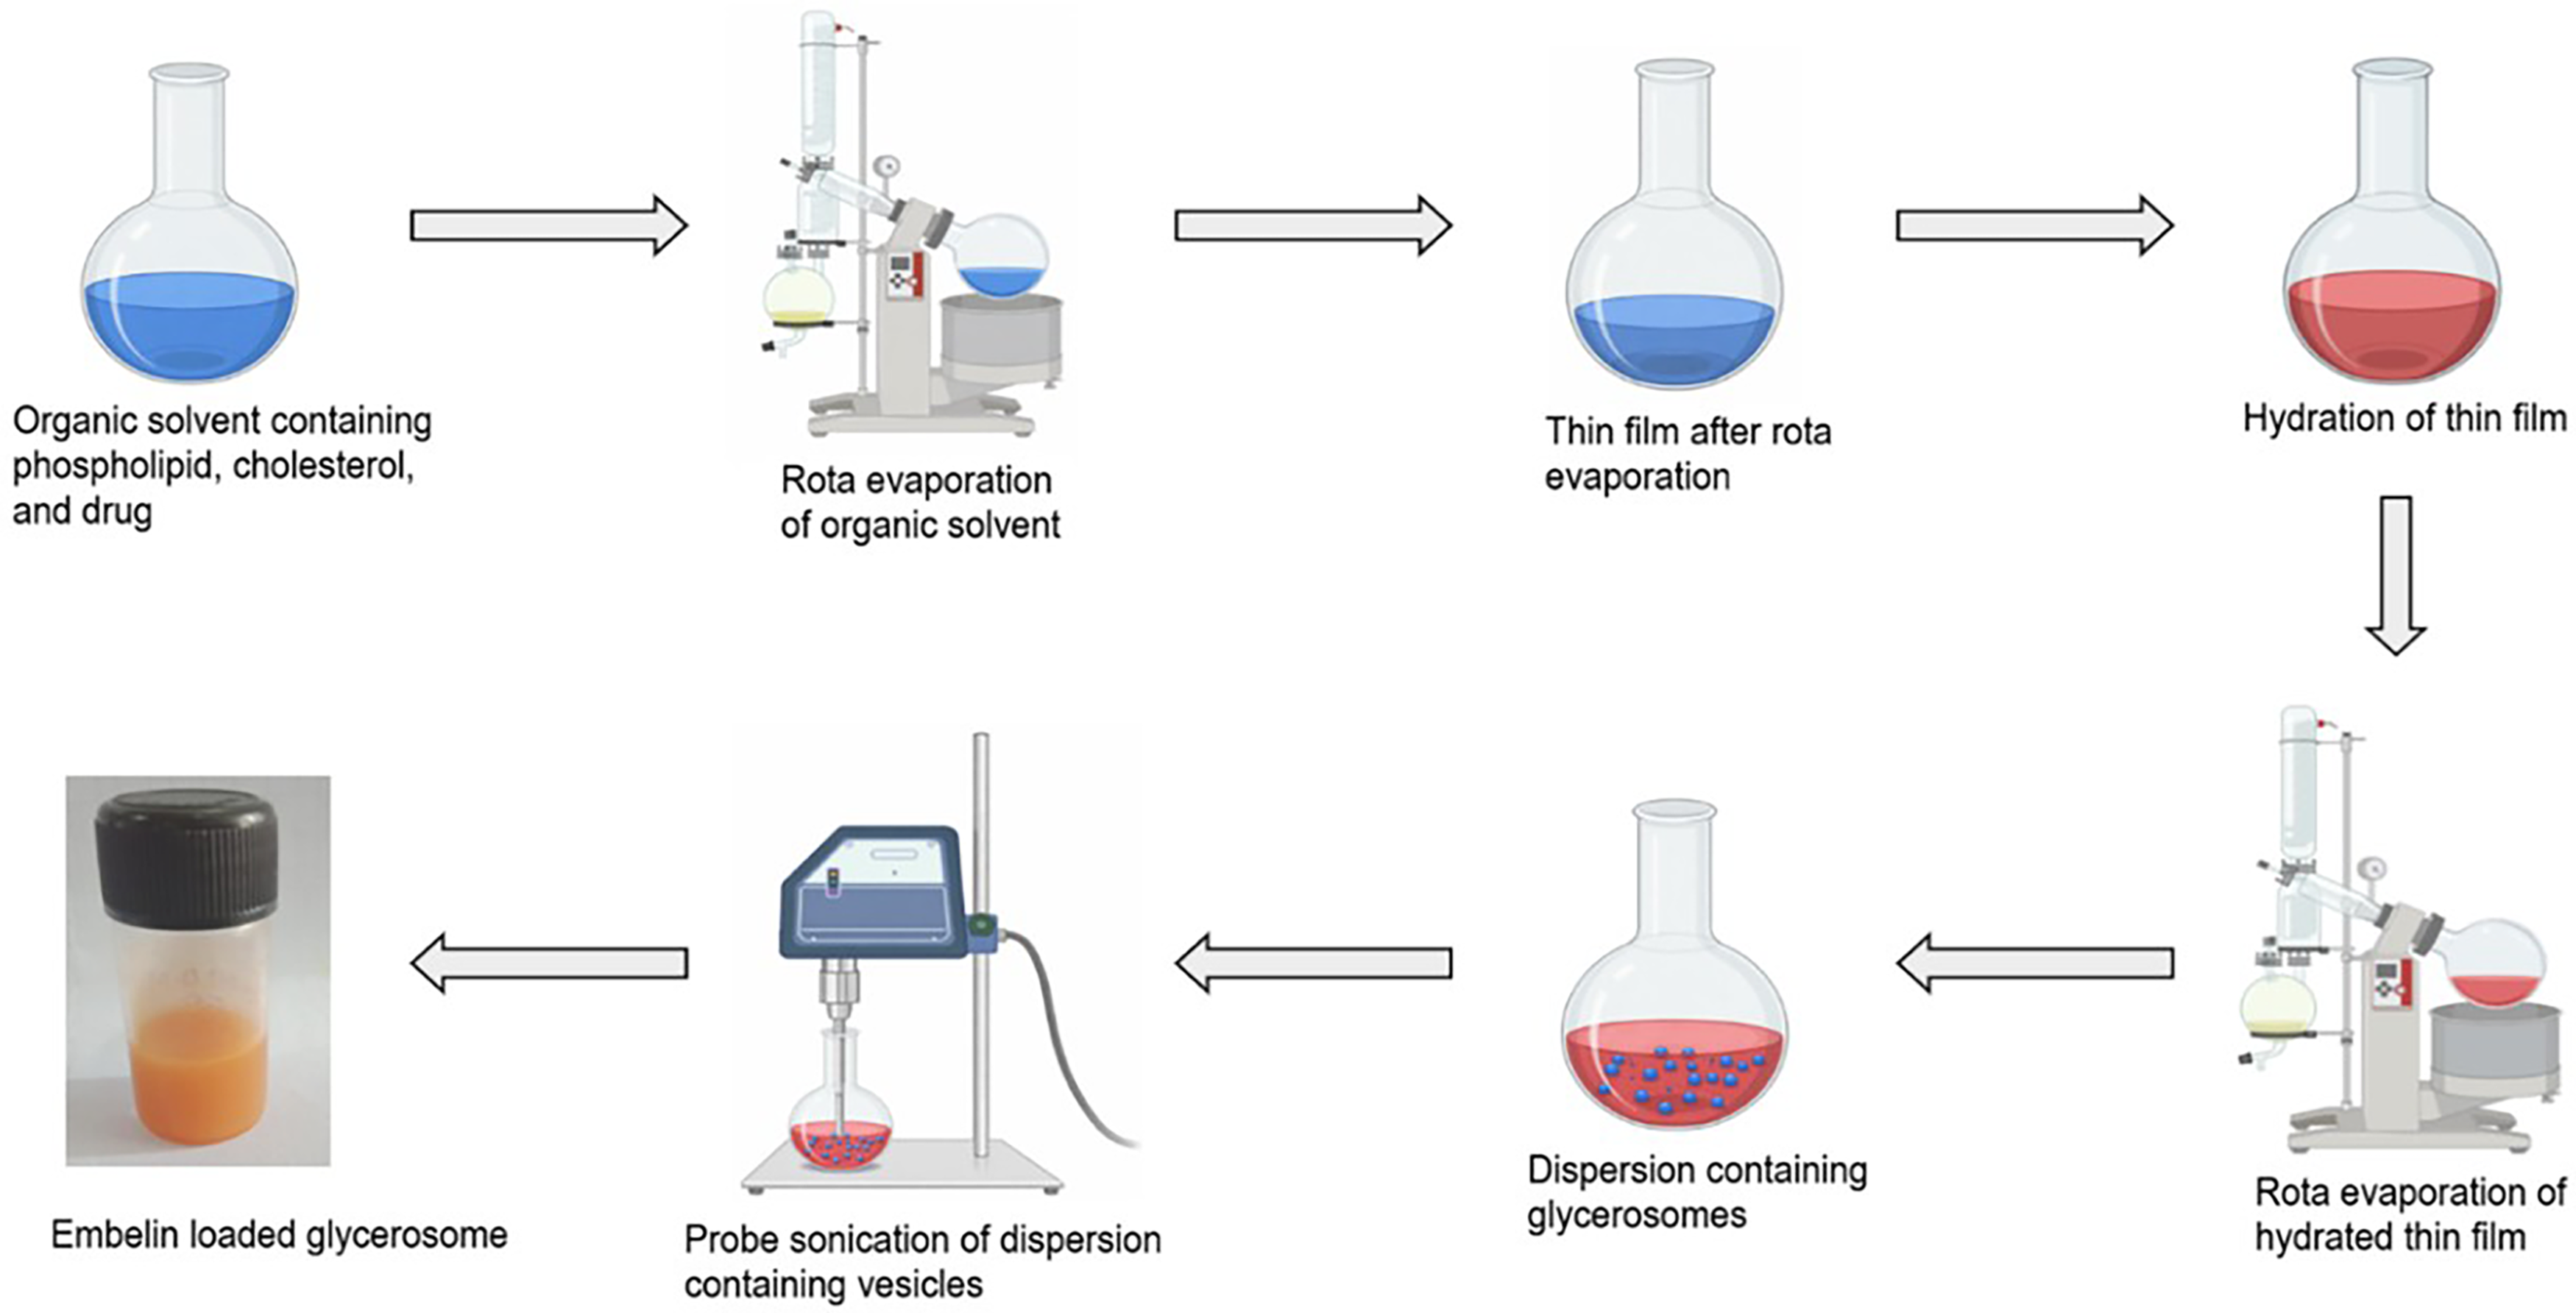
Method of preparation of embelin-loaded glycerosomes multilamellar vesicles.
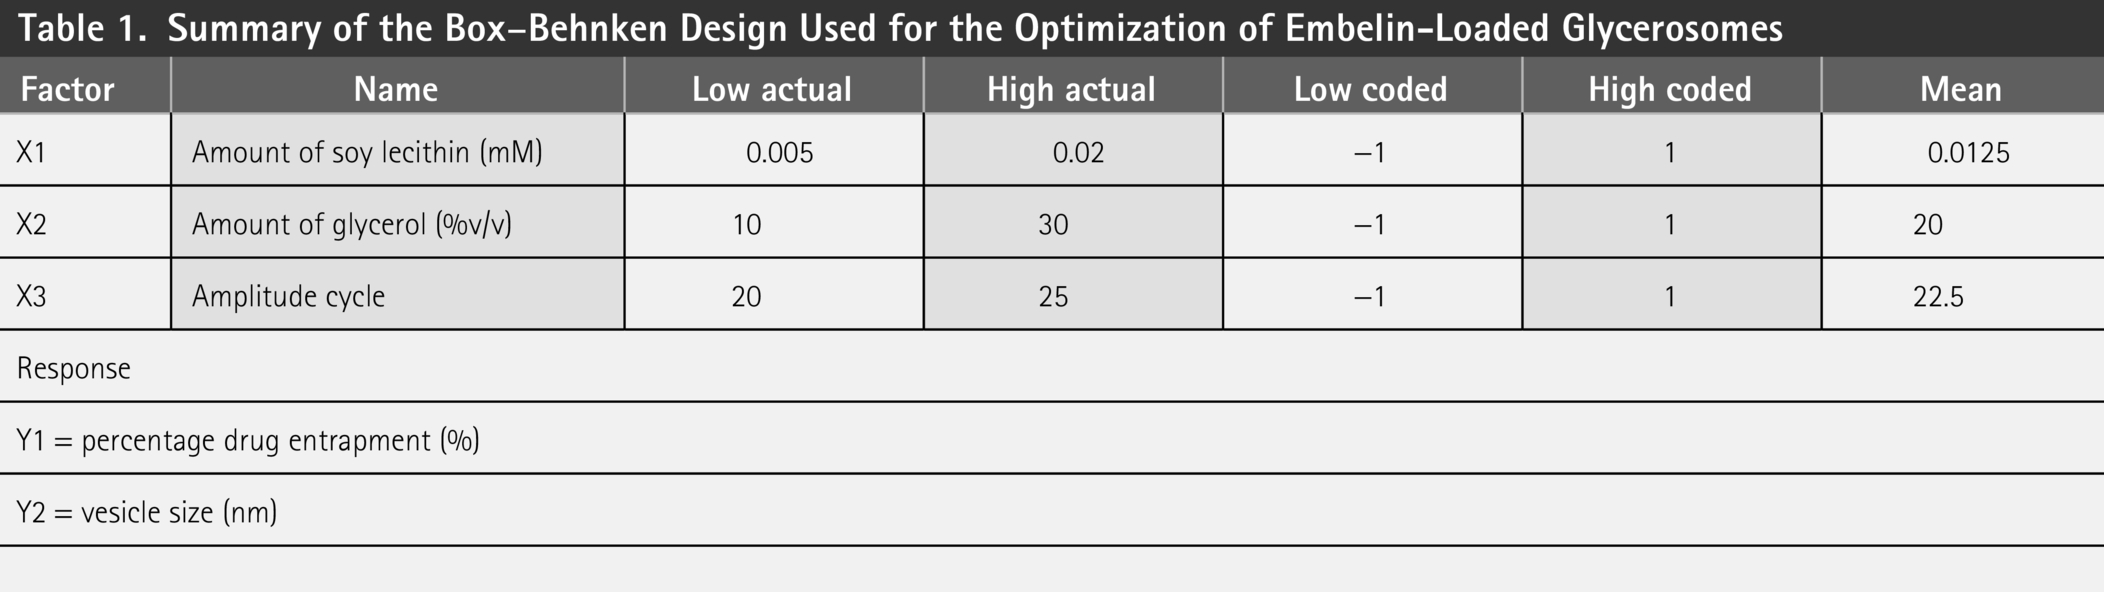
Optimization of EB-Loaded GLSMs
The 3D response surface plots constructed via the Box–Behnken design illustrate the influence of various factors on the characteristics of the EB-loaded GLSMs.34–36 A total of 17 experimental runs were conducted using a three-level, two-factor model to optimize the EB-loaded GLSMs, utilizing Design Expert software. Table 1 presents the independent and dependent variables. Of the various models tested (interaction, cubic, linear, and quadratic), the best-fitting model was determined through analysis of variance (ANOVA) for statistical evaluation. The optimal model was selected based on a significant F-value, low PRESS value, and a nonsignificant lack of fit (p > 0.05). 37
Summary of the Box–Behnken Design Used for the Optimization of Embelin-Loaded Glycerosomes
EB-Loaded GLSM Characterization
Size, surface charge, and polydispersity index
The physicochemical characteristics of the EB-loaded GLSM dispersion, including particle size, surface charge (zeta potential), and polydispersity index (PDI), were analyzed using a Zetasizer Nano ZS instrument. The test sample was diluted 20-fold with high-performance liquid chromatography (HPLC)-grade water before measurement. The diluted sample was transferred into a sample cell, and measurements were conducted at 25°C with a 90° scattering angle. 38
High-resolution transmission electron microscopy
The morphological features of the EB-loaded GLSMs were examined using high-resolution transmission electron microscopy (JEOL JEM-1010, Tokyo, Japan). The sample was diluted 20-fold with HPLC-grade water, and 10 µL of the sample (diluted) was placed on a carbon-layered copper grid. It was subsequently stained with phosphotungstic acid (1%) and analyzed at high resolution under an accelerating voltage of 80 kV. 39
Fourier Transform-Infrared Spectroscopy
Fourier transform-infrared (FT-IR) spectroscopy was performed to assess potential interactions between EB and excipients. FT-IR spectra of EB, soy lecithin, cholesterol, glycerol, their physical mixture, and the optimized EB-loaded GLSM formulation were performed under a scanning range of 4,000–400 cm−1.
X-Ray Diffraction
The crystalline behavior of pure drug and the formulation were analyzed using the powder X-ray diffraction (XRD) technique. The analysis was executed with a PANalytical X’Pert PRO diffractometer (The Netherlands) under the following conditions: voltage of 40 kV, current of 30 mA, and a scanning diffraction angle ranging from 0° to 80°, using monochromatic Cu Kα radiation.
Entrapment Efficiency
The entrapped EB within the GLSM vesicles was evaluated by determining the amount of unencapsulated (free) EB in the dispersion. The EB-loaded GLSMs were transferred into Eppendorf tubes and centrifuged at 8,385 g for 15 min at 4°C using a cooling centrifuge (Remi R8C Laboratory Centrifuge). The supernatant was appropriately diluted with methanol, and the absorbance was measured using a UV–visible spectrophotometer over a range of 200–400 nm. The concentration of free EB was determined using a pre-established standard calibration curve. The EE% was calculated using the following formula24,40:

Drug Release and Kinetic Models
EB release profile from EB-loaded GLSMs was evaluated and compared with an aqueous EB suspension using the dialysis membrane method (molecular weight cutoff: 12,000–14,000 Da). 32 The EB-loaded GLSMs and drug suspension equivalent to 40 mg of EB were placed in activated dialysis membranes, which were sealed at both ends with thread. Each dialysis bag was suspended in 900 mL of release medium: initially 0.1 N HCl for 2 h, followed by phosphate buffer (pH 6.8) for up to 24 h. The setup was maintained at 37°C and stirred at 0.063 g.
Aliquots of 5 mL were withdrawn at preset intervals (0.5, 1, 2, 4, 6, 8, 10, 12, and 24 h), and the same volume of dissolution medium was replenished each time. The drug concentration was measured using a UV–visible spectrophotometer in the 200–400 nm range. The EB content in each sample was determined using a standard calibration curve.41,42 Release profiles were fitted to different kinetic models, with the best-fitting model identified by the highest R2 value, indicating the strongest correlation.
MTT Assay
HepG2 cells (ATCC® HB-8065™; NCCS Cell, Pune, India; passages 12–20) were cultured in DMEM supplemented with 10% FBS, 1% penicillin–streptomycin at 37°C, 5% CO2, 95% humidity. Cells were subcultured at 80% confluency using 0.25% trypsin-EDTA (HiMedia TCC030, India), counted via a hemocytometer (Neubauer chamber, Marienfeld, Germany), and seeded at 5 × 10⁴ cells/well in 96-well flat-bottom plates. The cytotoxic effects of EB-loaded GLSMs, EB suspension, and placebo were evaluated using the MTT assay in HEPG2 cells. Fresh viable cells (5 × 10⁴ cells/well) were grown in 96-well flat-bottom plates. After 24 h of attachment, the culture medium was removed, and the cells were treated with varying concentrations (0.20, 0.40, 0.80, 1.6, 3.2, and 6.4 µM) of EB-loaded GLSMs, EB suspension, and placebo. After a 24-h incubation, 250 µL of MTT reagent was added to each well and incubated for 2 h at 37°C under humidified conditions. Subsequently, to dissolve the formazan crystals, 150 µL of DMSO was added to each well, enabling quantification of viable cells. Absorbance was measured at 550 nm using a microplate reader (Winooski, VT, USA), and cell viability (%) was calculated accordingly.
39
The study was performed in triplicate (n = 3). The cell viability was measured as follows:

In Vivo Pharmacokinetic Studies
Chromatographic condition
The HPLC method for the analysis of EB in plasma samples used a C18 HPLC column (250 × 4.6 mm, 5 µm particle size) as the stationary phase. The mobile phase consisted of mobile phase A (0.1% phosphoric acid in methanol) and mobile phase B (0.1% phosphoric acid in water), run in isocratic mode at a 90:10 ratio. The flow rate ranged 0.6–1.4 mL/min. The column temperature was varied between 25°C and 30°C. UV detection was performed at 270–290 nm, with a constant injection volume of 30 µL. Before sample injection, the column was equilibrated with the mobile phase for at least 60 min. 43
Animals
In this study, 36 male albino Wistar rats (5–10 weeks old, 180–200 g) were used. The animals were procured from the Faculty of Pharmacy, DIT University (Dehradun, Uttarakhand), and housed in the university’s animal care facility using polycarbonate cages under controlled lighting (12:12-h light–dark cycle) and environmental conditions (22°C ± 2°C with 40%–60% relative humidity). The animals were provided with unrestricted access to food ad libitum and filtered water. The study protocol, including drug administration and sample collection procedures, was approved by the Institutional Animal Ethics Committee (IAEC) of DIT University (Ref. No. DITU/IAEC/07/02). All the experimental procedures were carried out adhering to the guidelines of the Committee for the Purpose of Control and Supervision of Experiments on Animals. Food and water intake were monitored daily for 28 days to determine the average dietary consumption, and body weight was recorded weekly. The nesting materials or paper strips were provided to enrich the environmental condition, and cage elements were rearranged periodically to stimulate exploratory behavior.
Pharmacokinetic study
Healthy male Wistar rats were randomly assigned to two groups (n = 3 per group). One group received an aqueous suspension of EB, while the other group received EB-loaded GLSMs. The aqueous suspension was prepared by dispersing EB in deionized water. Before administration, animals were fasted for 12 h but had free access to water.
A single oral dose of EB (40 mg/kg) was supplied to each rat via gavage using a bulb-tipped needle. Venous blood samples (100 µL) were collected from the tail vein into EDTA-coated tubes at predetermined intervals: 60, 90, 120, 180, 240, 360, 480, and 720 min postdose. Preemptive analgesia with meloxicam (1 mg/kg, subcutaneous) was administered 30 min before the procedure to reduce pain and discomfort. Blood samples were collected from the rats under anesthesia (2%–3% isoflurane in oxygen) to reduce stress and movement. The samples were centrifuged at 1,370 g for 10 min to separate plasma, which was then stored at −80°C until analysis.
Plasma extraction of EB was performed by adding 1 mL of ethyl acetate to each sample, followed by vortexing and centrifugation at 8,395 g for 10 min. The resulting supernatant was collected, and the solvent was evaporated under vacuum using a rotary evaporator. The residue was reconstituted in 200 µL of ethanol, vortexed for 3 min, sonicated, and centrifuged. The final supernatant was filtered through a 0.22-µm membrane filter and analyzed by HPLC. Plasma drug concentrations at each time point were used to construct a concentration–time profile.44–47 Pharmacokinetic parameters were calculated using PK SOLVER software.
Pharmacodynamic Study
Male albino Wistar rats were used in this study. Animals were divided into five groups: normal control, disease control, standard drug, test formulation, and placebo, with six rats per group. All treated groups received an equivalent oral dose of EB (40 mg/kg) daily.
In the hyperlipidemia model, rats received 0.9% NaCl solution as the vehicle control. The normal control group was fed a standard diet, while the remaining groups were fed a HFD (45% nonalcoholic fatty liver diet). After a 4-week acclimation period and a 12-h fasting period, treatment with either aqueous EB suspension or EB-loaded GLSMs was initiated and continued for 21 consecutive days.
At the end of the study, animals were deeply anesthetized using 5% isoflurane in an induction chamber, followed by cervical dislocation to ensure euthanasia. Throughout the study, no animals met the predefined criteria for early euthanasia. All animals were carefully monitored and remained healthy until the planned experimental endpoint, with no signs of distress or impaired mobility. No formal inclusion or exclusion criteria were established for animals or data points in this study. All animals and data collected were included in the final analysis. Cage positions were rotated weekly to minimize location-based environmental bias (light, airflow, and temperature gradient). All the procedures were conducted by the same personnel to reduce variability. Group allocation was done independently, with experimenters, assessors, and analysts blinded to group identities until final analysis. Blood samples were then collected via enucleation or retro-orbital puncture, ensuring minimal distress. Liver tissue was rapidly dissected, with one portion frozen immediately and the other fixed in 10% neutral buffered formalin (NBF) containing ∼4% formaldehyde, because commercial formalin is 37%–40% formaldehyde and is diluted 1:10. To assess hepatic lipid accumulation, histological staining with hematoxylin and eosin (H&E) was performed.
Serum Biochemistry Analysis
Blood samples were incubated at 37°C for 2 h and then centrifuged at 187 g for 10 min to obtain the serum. Biochemical parameters, including triglycerides (TGs) and liver function markers, were measured using commercial diagnostic kits. Colorimetric detection was performed using an automated biochemical analyzer.
Histopathology
Liver tissues were fixed in 10% NBF containing approximately 4% formaldehyde, as commercial formalin (37%–40% formaldehyde) was diluted to 1:10. This tissue was fixed for 24 h, embedded in paraffin, and thin tissue sections were mounted on the glass slides. These sections were stained with H&E for microscopic examination of histopathological changes, particularly lipid accumulation and hepatic architecture.
Stability Study
In line with ICH guidelines, the stability of the EB-loaded GLSMs was assessed over 1 and 3 months. Samples were stored in glass vials under two different conditions: refrigerated (2°C–8°C) and room temperature (25°C ± 2°C, 60% ± 5% relative humidity). At the end of each storage period (1 and 3 months), samples were withdrawn and analyzed for physical appearance and percentage drug entrapment to assess formulation stability. 48
Statistical Analysis
Data were analyzed using ANOVA followed by Tukey’s multiple comparison tests, performed with GraphPad Prism version 7.00. The data are expressed as mean ± standard deviation (n = 3). The level of significance was considered at p < 0.05.
RESULTS AND DISCUSSION
Preparation of EB-Loaded GLSMs
The present study aimed to evaluate the potential of novel nanovesicles, that is, GLSM-based lipidic microstructures, to encapsulate EB to enhance its solubility and bioavailability. GLSM vesicles were formulated using soy lecithin with varying concentrations of glycerol. In this formulation, glycerol and cholesterol served as stabilizers, with glycerol also acting as an edge activator. GLSMs were composed of biocompatible and FDA-approved (or otherwise recognized as safe) materials, offering the advantage of safe application in medical treatments.
The effects of different concentrations of glycerol, soy lecithin, and cholesterol on vesicle characteristics were investigated. In addition, the impact of vesicle size reduction techniques was assessed. Key physicochemical properties, including particle size and percentage drug entrapment, were characterized for the EB-loaded GLSMs.
Optimization of EB-Loaded GLSMs
Response surface plots are widely used in the optimization of nanoformulations. Among various experimental design-based optimization techniques, the Box–Behnken design is considered one of the most efficient and is frequently used alongside conventional optimization methods. It was selected for this study due to its ability to reduce the number of experimental runs while still providing robust data within a practical time frame.
The initial screening study provided essential insights that guided the selection of formulation variables and their impact on the response outcomes during product development. Based on these preliminary findings, three critical parameters—the amount of soy lecithin, the amount of glycerol, and the number of probe sonication cycles—were found to significantly influence key formulation characteristics, including physical appearance, percentage drug entrapment, vesicle size, and PDI of the EB-loaded GLSMs. The composition of the EB-loaded GLSMs as per the Box–Behnken design is presented in Table 2.
Composition of Embelin-Loaded Glycerosomes as per the Box–Behnken Design
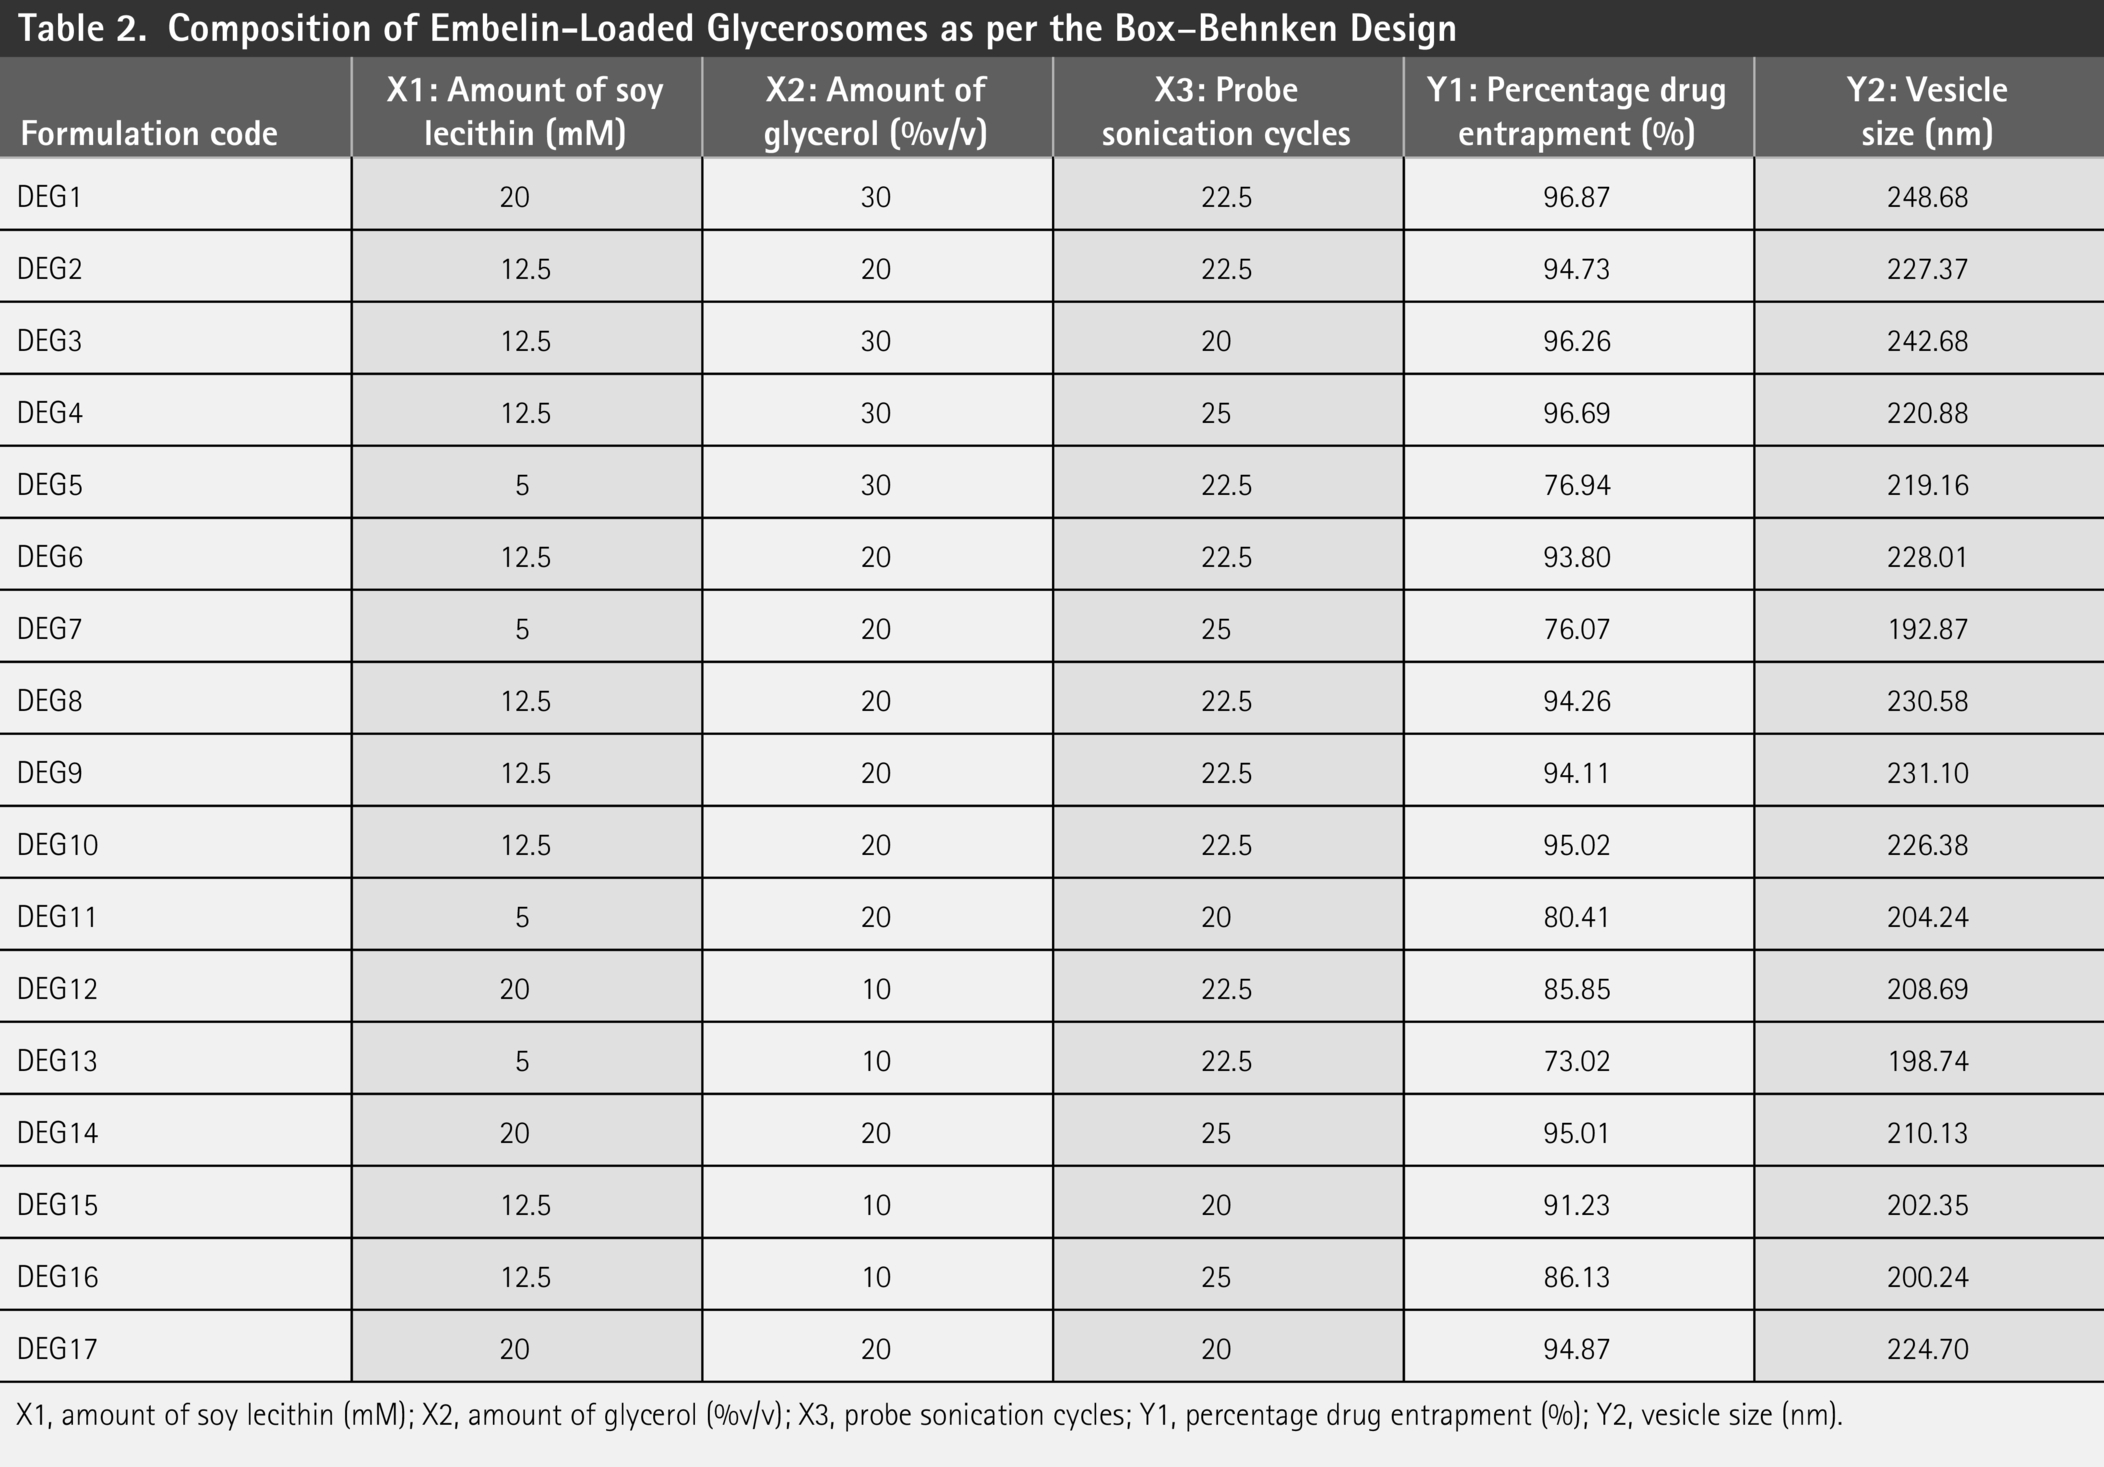
X1, amount of soy lecithin (mM); X2, amount of glycerol (%v/v); X3, probe sonication cycles; Y1, percentage drug entrapment (%); Y2, vesicle size (nm).
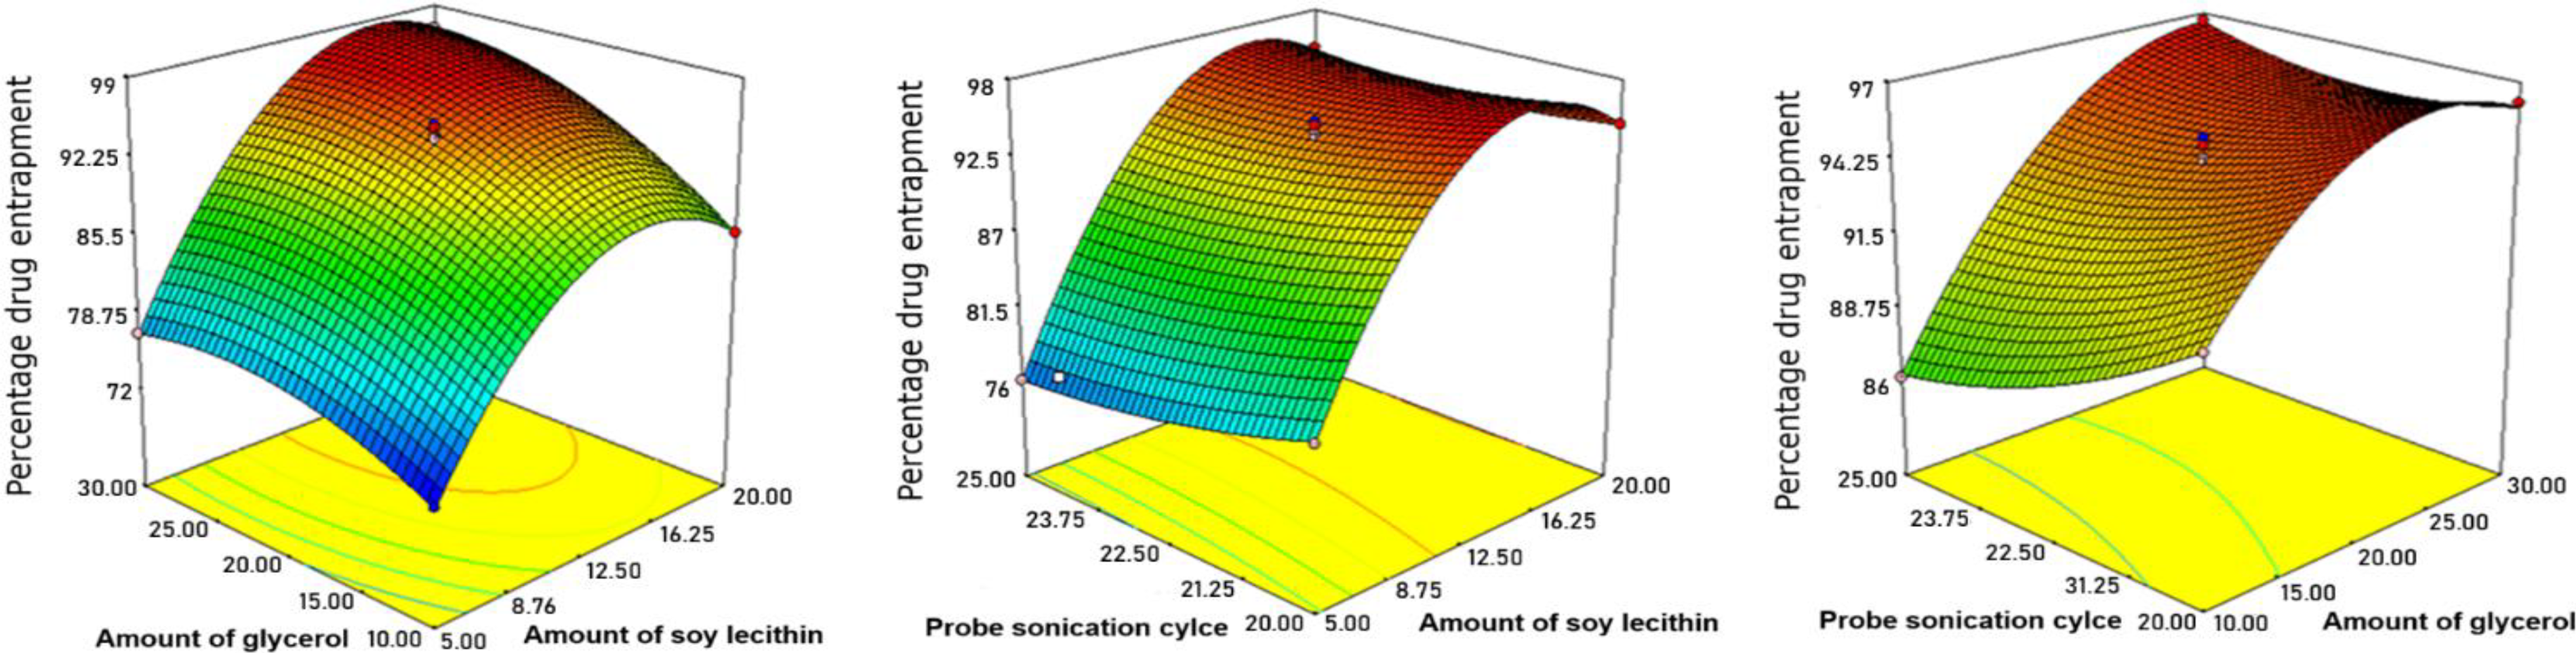
Numerical model fit analysis was performed on the dependent variables to assess the various effects. Among the investigated models, the quadratic models have been shown to have the best fit. Based on the desirable criteria, the optimal values of various responses were noted, including vesicle size and percentage of EE. Table 3 illustrates the results of the quadratic model fitting regression analysis of the responses, percentage drug entrapment (Y1), vesicle size (Y2), amount of soy lecithin (mM) (X1), amount of glycerol (X2), and probe sonication cycles (X3). The 3D response surface curves in Figures 2 and 3 illustrate the relative impacts of the independent factors on the Y1 and Y2 responses.
Effect of the amount of glycerol (%v/v), amount of soy lecithin (mM), and amplitude on drug entrapment.
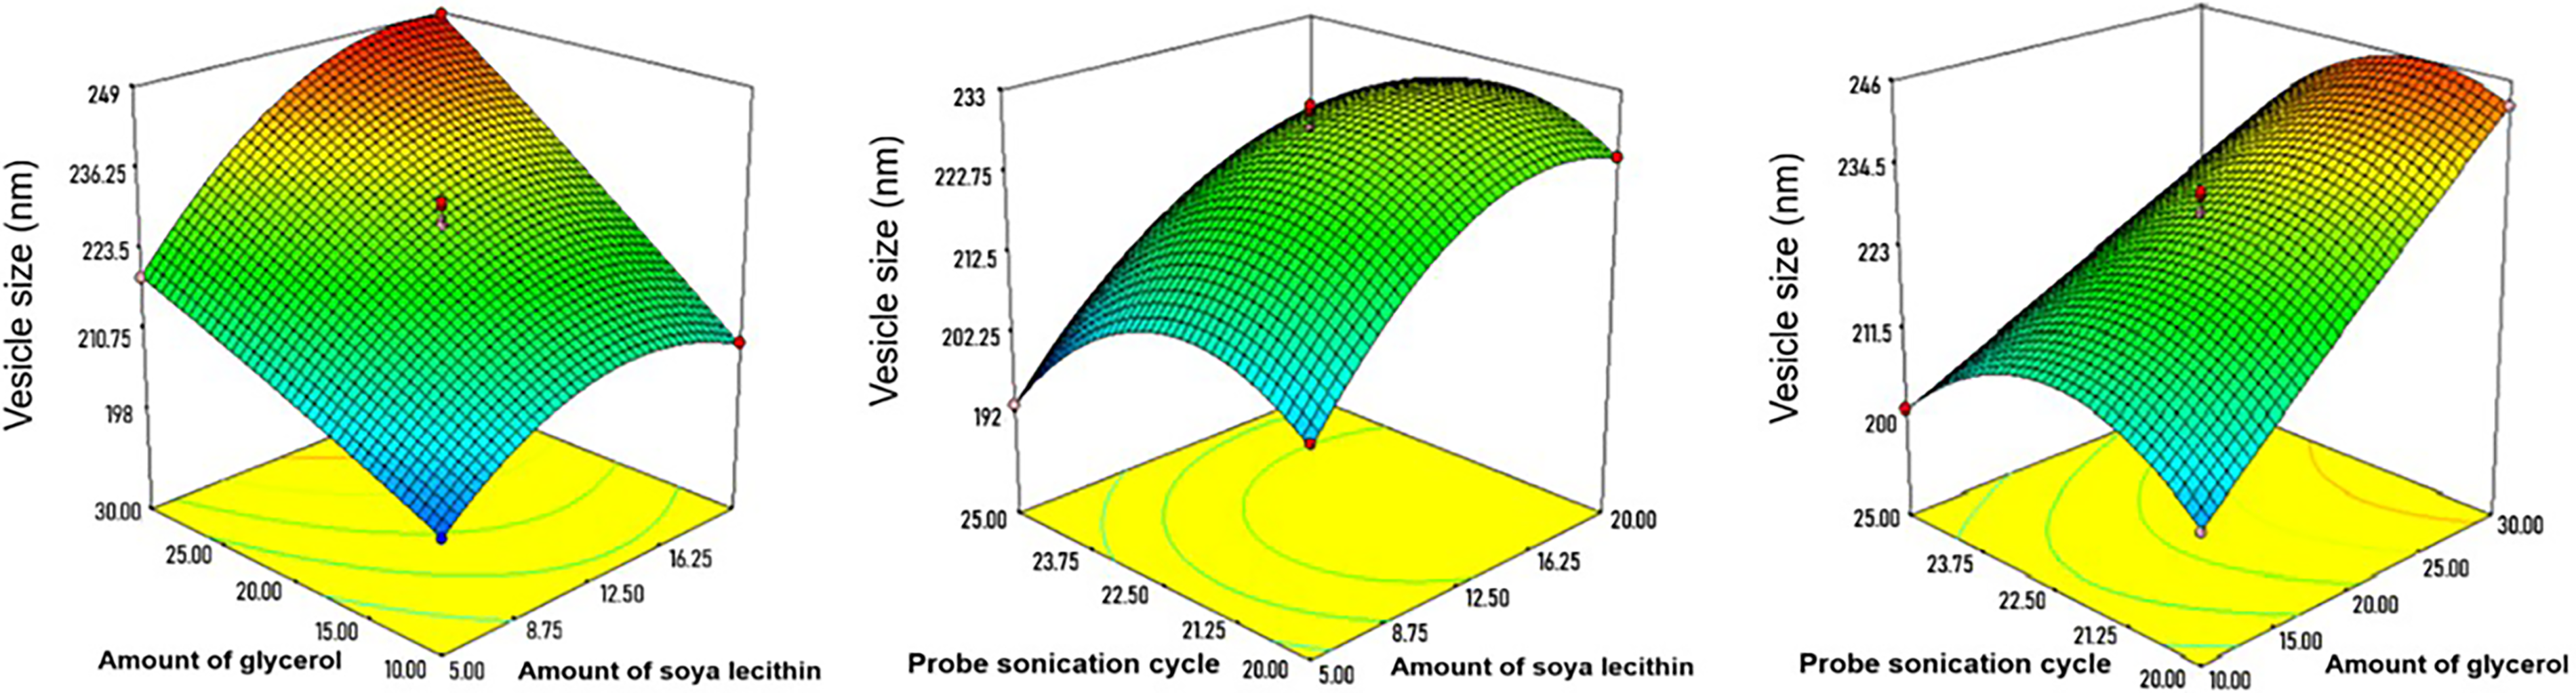
Effect of the amount of glycerol (%v/v), amount of soy lecithin (mM), and probe sonication cycle on the vesicle size.
Regression Analysis Summary of Independent Factors on the Y1 and Y2 Responses
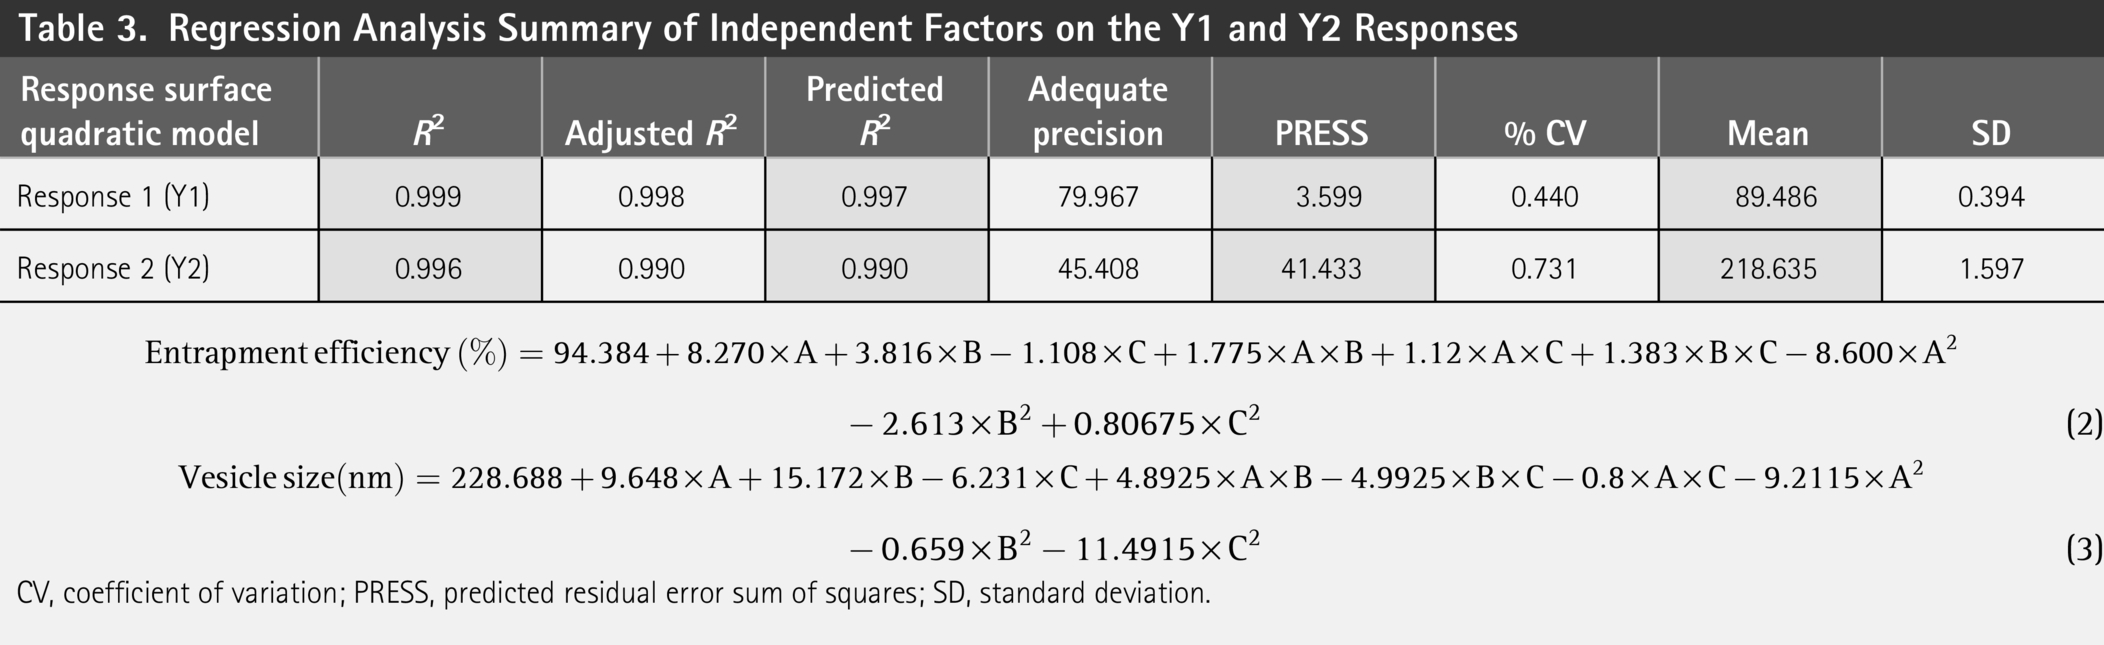


CV, coefficient of variation; PRESS, predicted residual error sum of squares; SD, standard deviation.
Impact of Input Variables on Percentage Drug Entrapment (%) (Response Y1)
Table 3 presents a quadratic polynomial equation that explains the influence of the amount of soy lecithin (mM), the amount of glycerol (%v/v), and the probe sonication cycle on the percentage drug entrapment. The current investigation demonstrates a model F-value of 751.10, thereby indicating that the selected model was significant.
The quadratic equation (2) demonstrates the combined influence of the independent variables on the EE% of EB-loaded GLSMs.
The positive sign indicates that increasing the soy lecithin concentrations from 5 to 20 mM would enhance the encapsulation efficiency of EB into the GLSM vesicles. As the concentration of soy lecithin is increased while retaining the amount of cholesterol and other parameters, the multilayered structure of the GLSM vesicles facilitates the higher encapsulation of a large volume of the drug for encapsulation. 49 Increasing the amount of soy lecithin adds more lipid components to the vesicles and provides a higher surface area for the encapsulation of drug moiety. EB is a lipophilic drug and is therefore easily integrated into the lipid bilayer of vesicles, which leads to augmented drug loading capacity.50–52
In addition to the amount of soy lecithin, the positive coefficient term demonstrates that glycerol levels between 10% and 20% increase the encapsulation percentage of EB into GLSM vesicles. However, with further enhancement in the amount of glycerol from 20% to 30% (v/v), the percentage encapsulation of EB in GLSM vesicles decreases. As glycerol concentration augments, EB becomes more soluble in the intervesicle glycerol medium, which may lead to the seeping of EB from the vesicles and a decline in EB encapsulation in the GLSMs. Our findings align with previously published literature.23,32
In addition, the negative coefficient term of the number of probe sonication cycles demonstrates that a slight decline in the percentage drug entrapment occurs as the number of probe sonication cycles increases. The 3D graph revealed similar findings. The Box–Behnken design’s 3D graphs (Fig. 2) demonstrate the influence of independent factors on EE.
Impact of Input Variables on Vesicle Size (nm) (Response Y2)
The impact of formulation variables on the vesicle size response of EB-loaded GLSMs is described by the quadratic equation (Eq. 3). A positive coefficient in the quadratic equation indicated that increasing the amount of soy lecithin from 5 to 20 mM led to an increase in vesicle size. This observation across various EB-loaded GLSM batches may be attributed to the proportional relationship between soy lecithin concentration and vesicle size.
This result was expected, as a greater number of lipid molecules within a given volume led to increased viscosity. The elevated viscosity, in turn, reduced the efficiency of size reduction by probe sonication, thereby resulting in larger vesicle sizes. 53
In addition to the amount of lecithin, the positive coefficient of the second independent variable indicated that elevating the glycerol content from 10% to 30% (v/v) causes a subsequent increase in the vesicle size of the EB-loaded GLSMs. At higher glycerol concentrations, the viscous and adhesive nature of glycerol promotes the formation of larger vesicles. 54 Moreover, elevated glycerol levels increase the viscosity of the dispersion, which in turn reduces the efficiency of size reduction during probe sonication, resulting in larger GLSM vesicles. In addition, a higher glycerol content disrupts the curvature of the lipid bilayer by loosening its molecular packing, further contributing to the formation of larger vesicles.23,32
Moreover, the negative coefficient associated with the number of probe sonication cycles indicates that an increase in sonication cycles leads to a slight reduction in vesicle size. This trend was also evident in the 3D response surface plots. The 3D graphs generated from the Box–Behnken design (Fig. 3) further illustrate the impact of formulation variables on EE. According to the software-generated optimization, the ideal formulation comprised 17.9% (v/v) glycerol, 25 probe sonication cycles, and 16.21 mM soy lecithin, yielding an overall desirability score of 0.799.
Characterization of EB-Loaded GLSMs
Size, surface charge, PDI, and drug entrapment
The software-predicted versus experimentally observed values for the optimized formulation DEG18 were 95.23% versus 94.74% ± 0.056% for EE (Y1), and 210.397 nm versus 214.41 ± 2.12 nm for vesicle size (Y2), respectively. The percentage errors between the observed and predicted values for vesicle size and EE were 1.874% and −0.518%, respectively—both within the acceptable range (Table 4). Previous work on GLSMs demonstrated enhanced delivery of hydrophobic drugs. For instance, Alam and coworker 38 reported QbD-optimized rutin GLSMs with 82.81% EE using the Box–Behnken design methodology. Patil et al. 48 reported that atorvastatin glycerosomal patches recorded 86.41% ± 2.95% EE and 32.53 µg/cm2/h flux over 24 h. Our EB-loaded GLSMs demonstrated high entrapment, among previous glycerosomal systems alongside 2.5-fold cytotoxicity enhancement in HepG2 cells.
Analysis of the Optimal Embelin-Loaded Glycerosomes Formulation (DEG18) with Respect to Experimental and Predicted Values
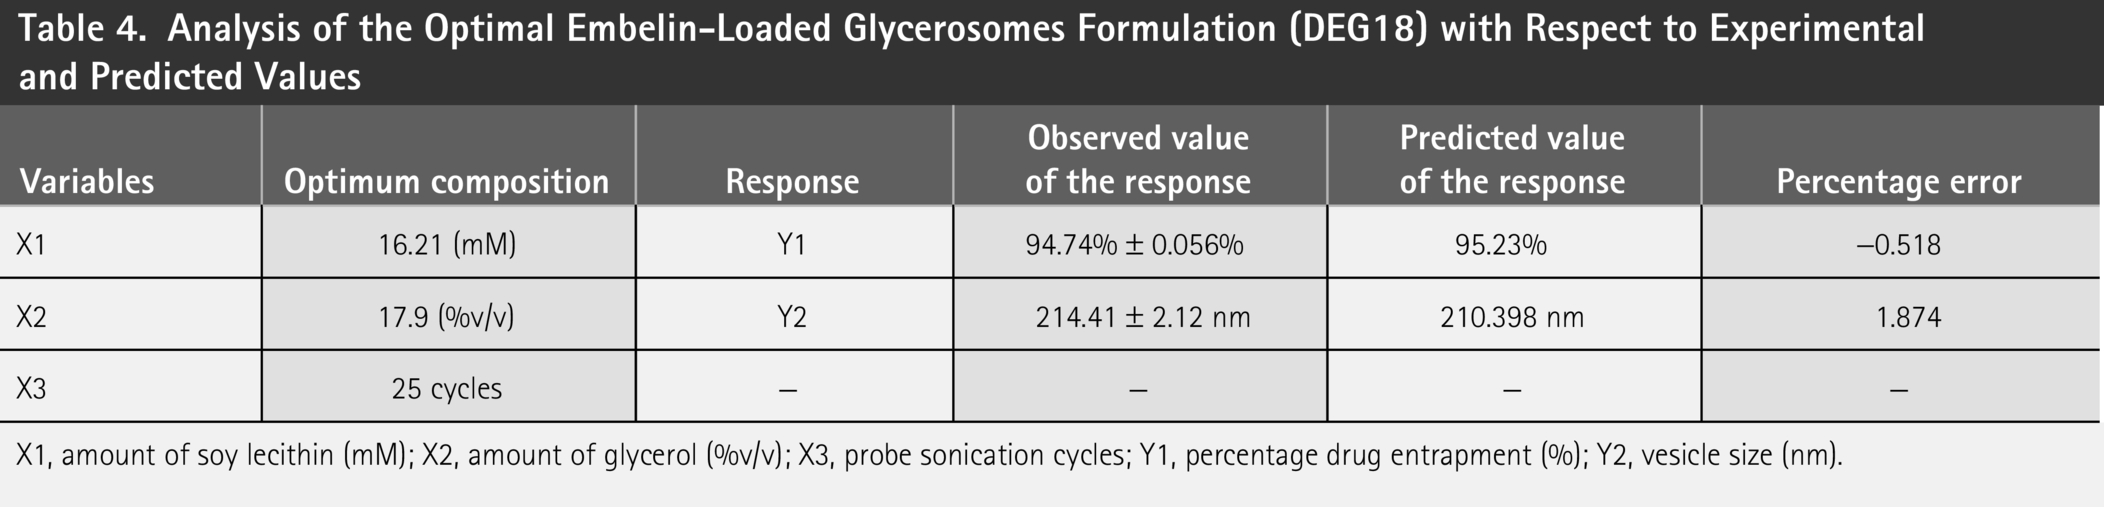
X1, amount of soy lecithin (mM); X2, amount of glycerol (%v/v); X3, probe sonication cycles; Y1, percentage drug entrapment (%); Y2, vesicle size (nm).
In addition, the optimized formulation exhibited a zeta potential of −30 ± 1.14 mV and a PDI of 0.145 ± 0.02 (Fig. 4). The low PDI value indicated a homogeneous and uniform vesicle size distribution. Zeta potential analysis confirmed a negative surface charge on the vesicles, which is primarily attributed to the presence of an anionic lipid component such as soya lecithin in the formulation. This negative surface charge helps prevent vesicle aggregation through electrostatic repulsion and also enhances the biostability of the nanovesicles. 39
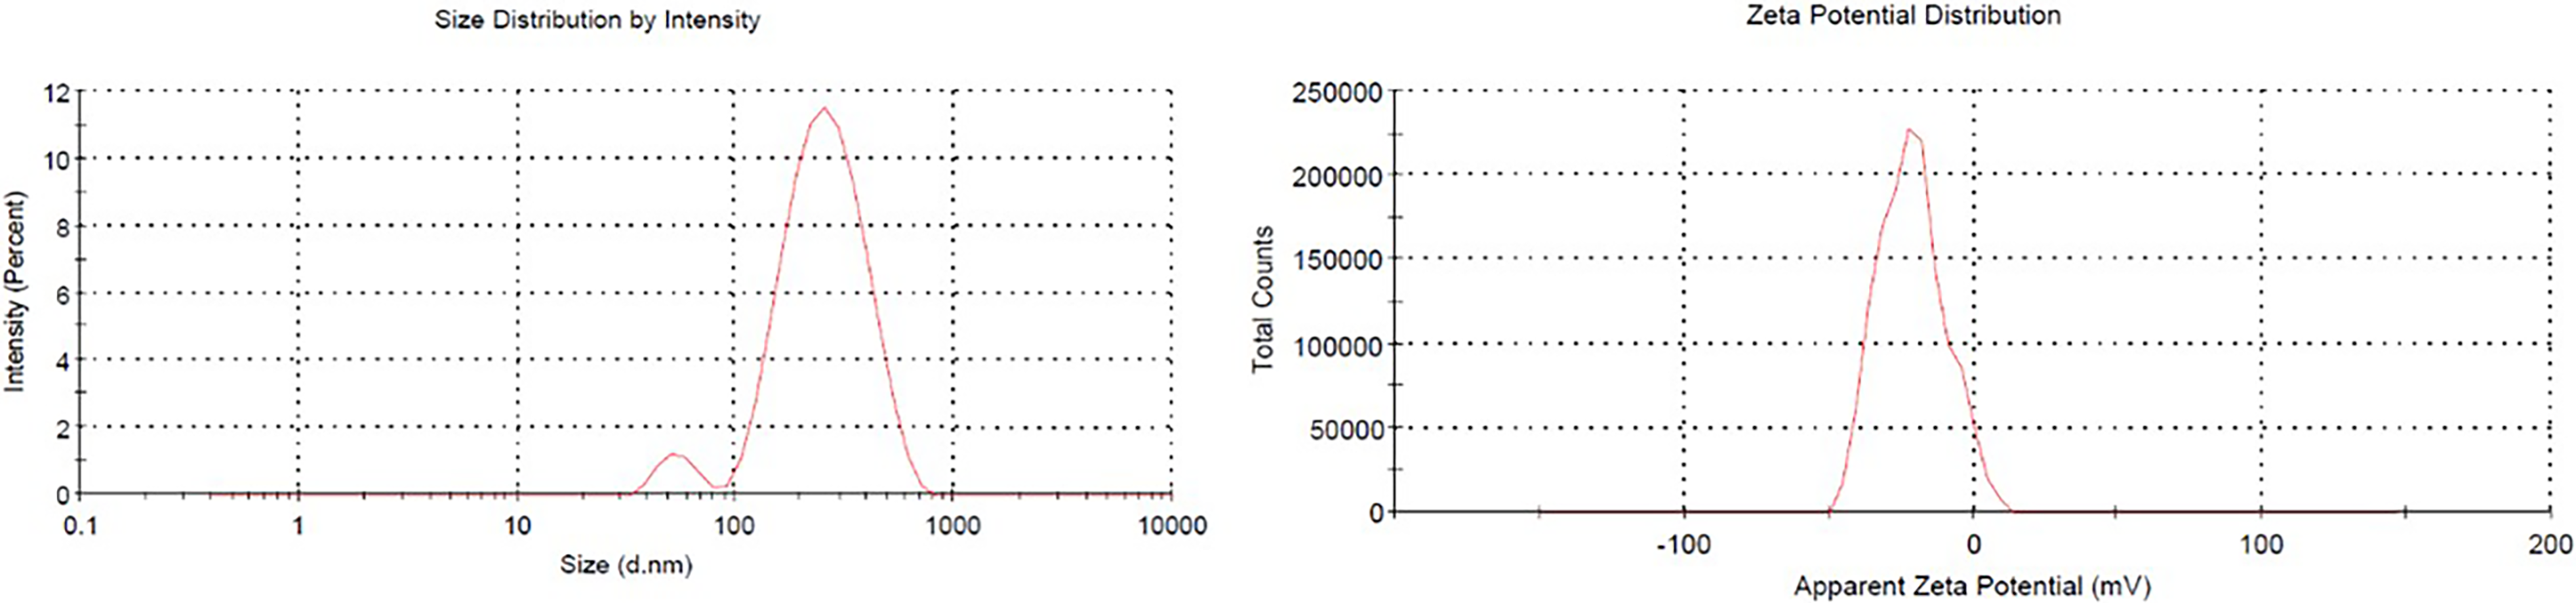
Zeta potential and vesicle size of the embelin-loaded glycerosomes formulation (DEG18).
High-resolution transmission electron microscopy
As illustrated in Figure 5, the TEM images revealed uniformly spherical vesicles. Minimal or no aggregation was observed, which can be attributed to the strong negative zeta potential on the vesicle surfaces. This surface charge induces electrostatic repulsion between adjacent EB-loaded GLSMs (DEG18), thereby indicating good physical stability of the dispersion. 55
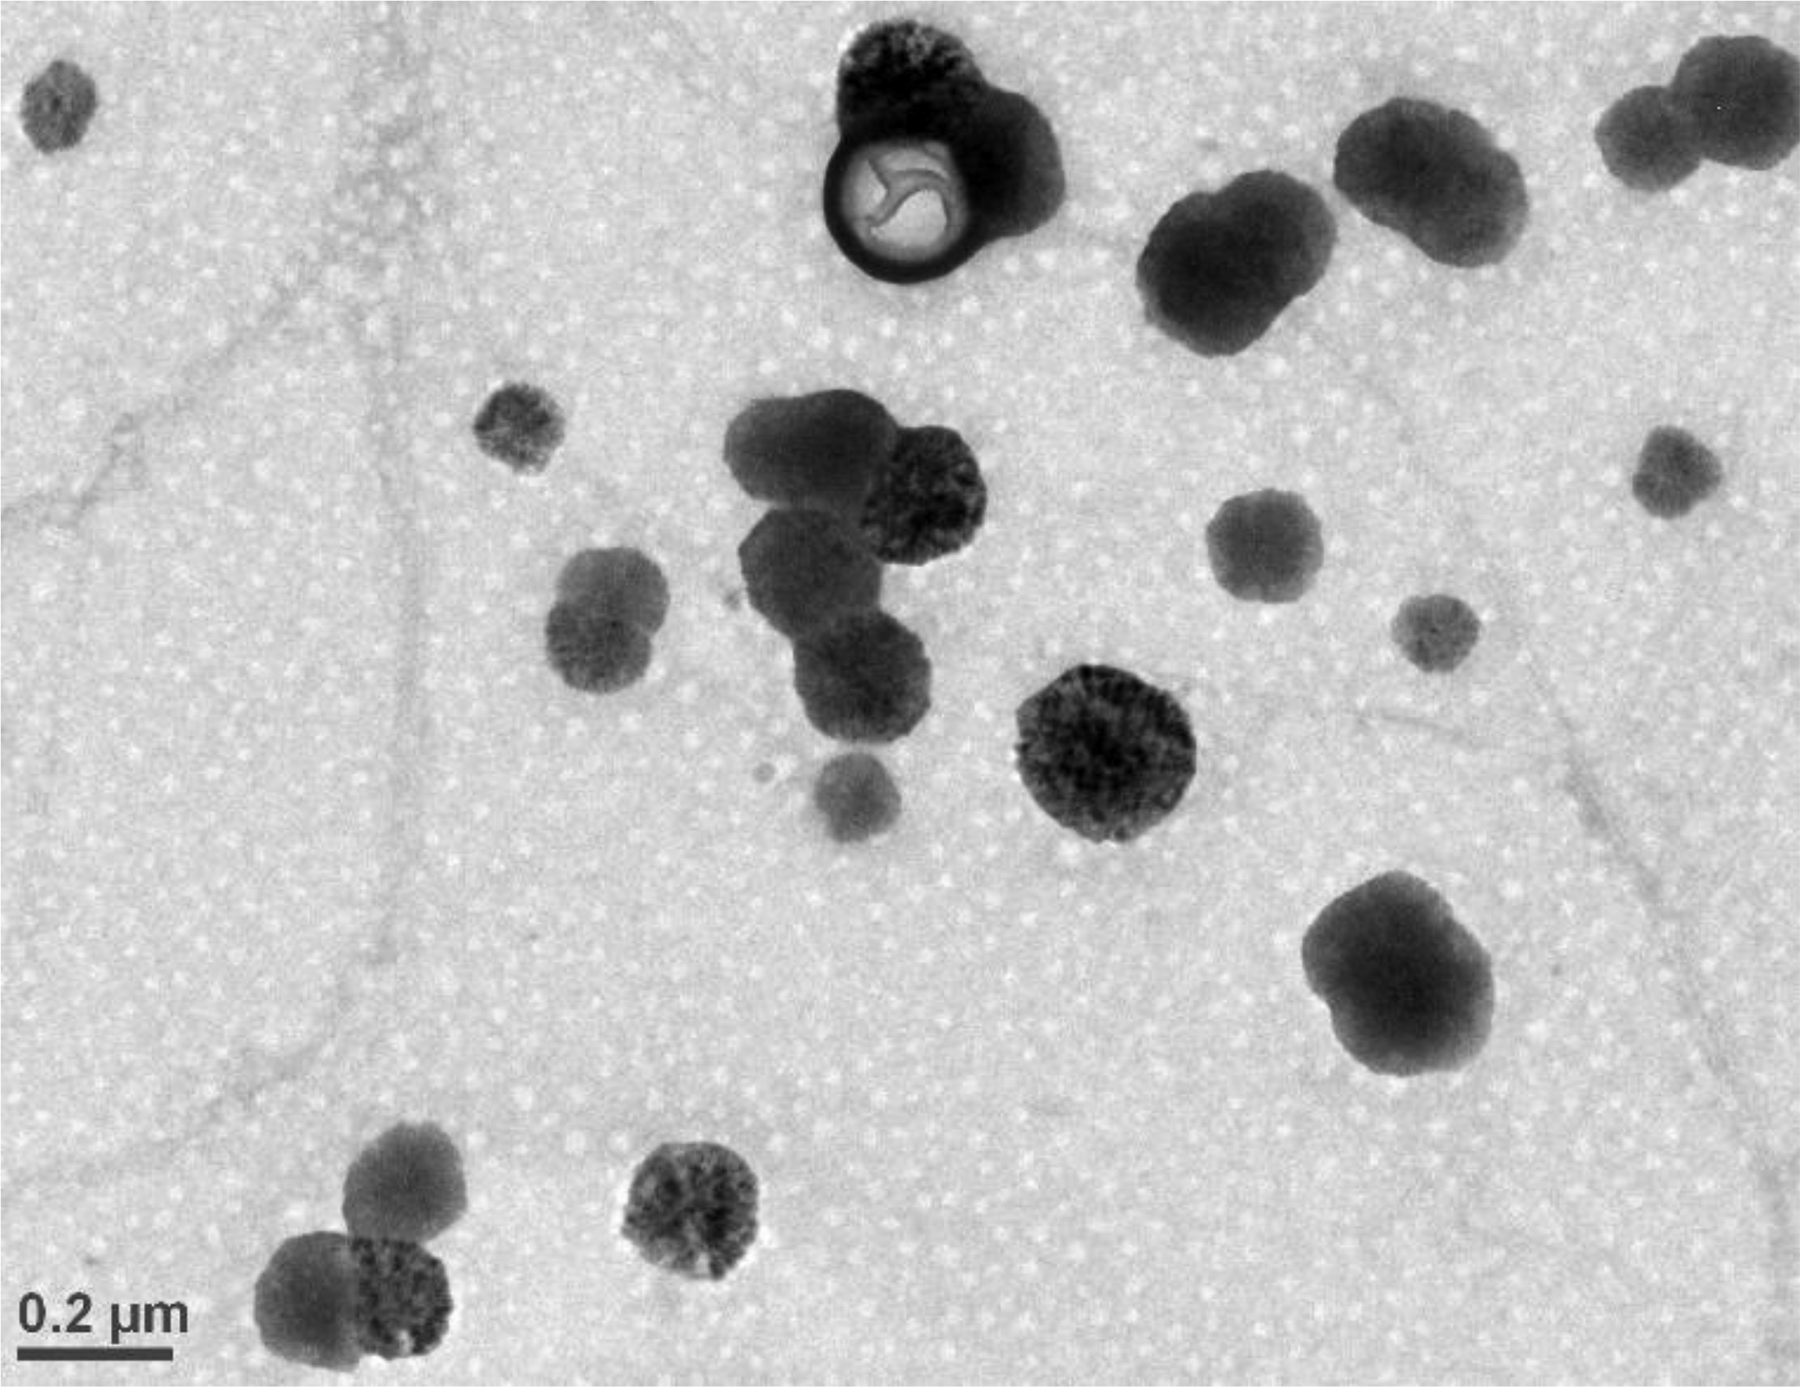
Transmission electron micrograph of the optimal embelin-loaded glycerosomes.
Fourier transform-infrared
This study is meant to determine possible interactions among the components in the formulation. The FT-IR spectrum of pure EB exhibited a strong absorption peak at 3,304.7 cm−1, attributed to the –OH group. Peaks observed at 2,847.94 cm−1 corresponded to C–H stretching, while the peak at 1,642.81 cm−1 was due to the C = O group. 56 The drug and excipient mixture showed characteristic EB peaks, including a C–H stretching absorption at 2,853.36 cm−1. In addition, two C–O stretching peaks at 1,464.57 cm−1 and 1,172.22 cm−1, associated with alcohol groups, were present, indicating the absence of significant drug–excipient interactions. 56
In contrast, the FT-IR spectrum of the optimized EB-loaded GLSM formulation revealed shifts in the characteristic peaks and the appearance of peaks with markedly reduced intensity compared with those of the pure drug and the physical mixture (Fig. 6). These shifts are likely due to weak intermolecular forces involving the polar functional groups of the drug and excipients, such as dipole interactions, Van der Waals forces, or hydrogen bonding. Furthermore, the disappearance of EB’s distinctive peaks and the presence of only a few low-intensity peaks suggest successful encapsulation and uniform distribution of EB within the glycerosomal vesicles. 32
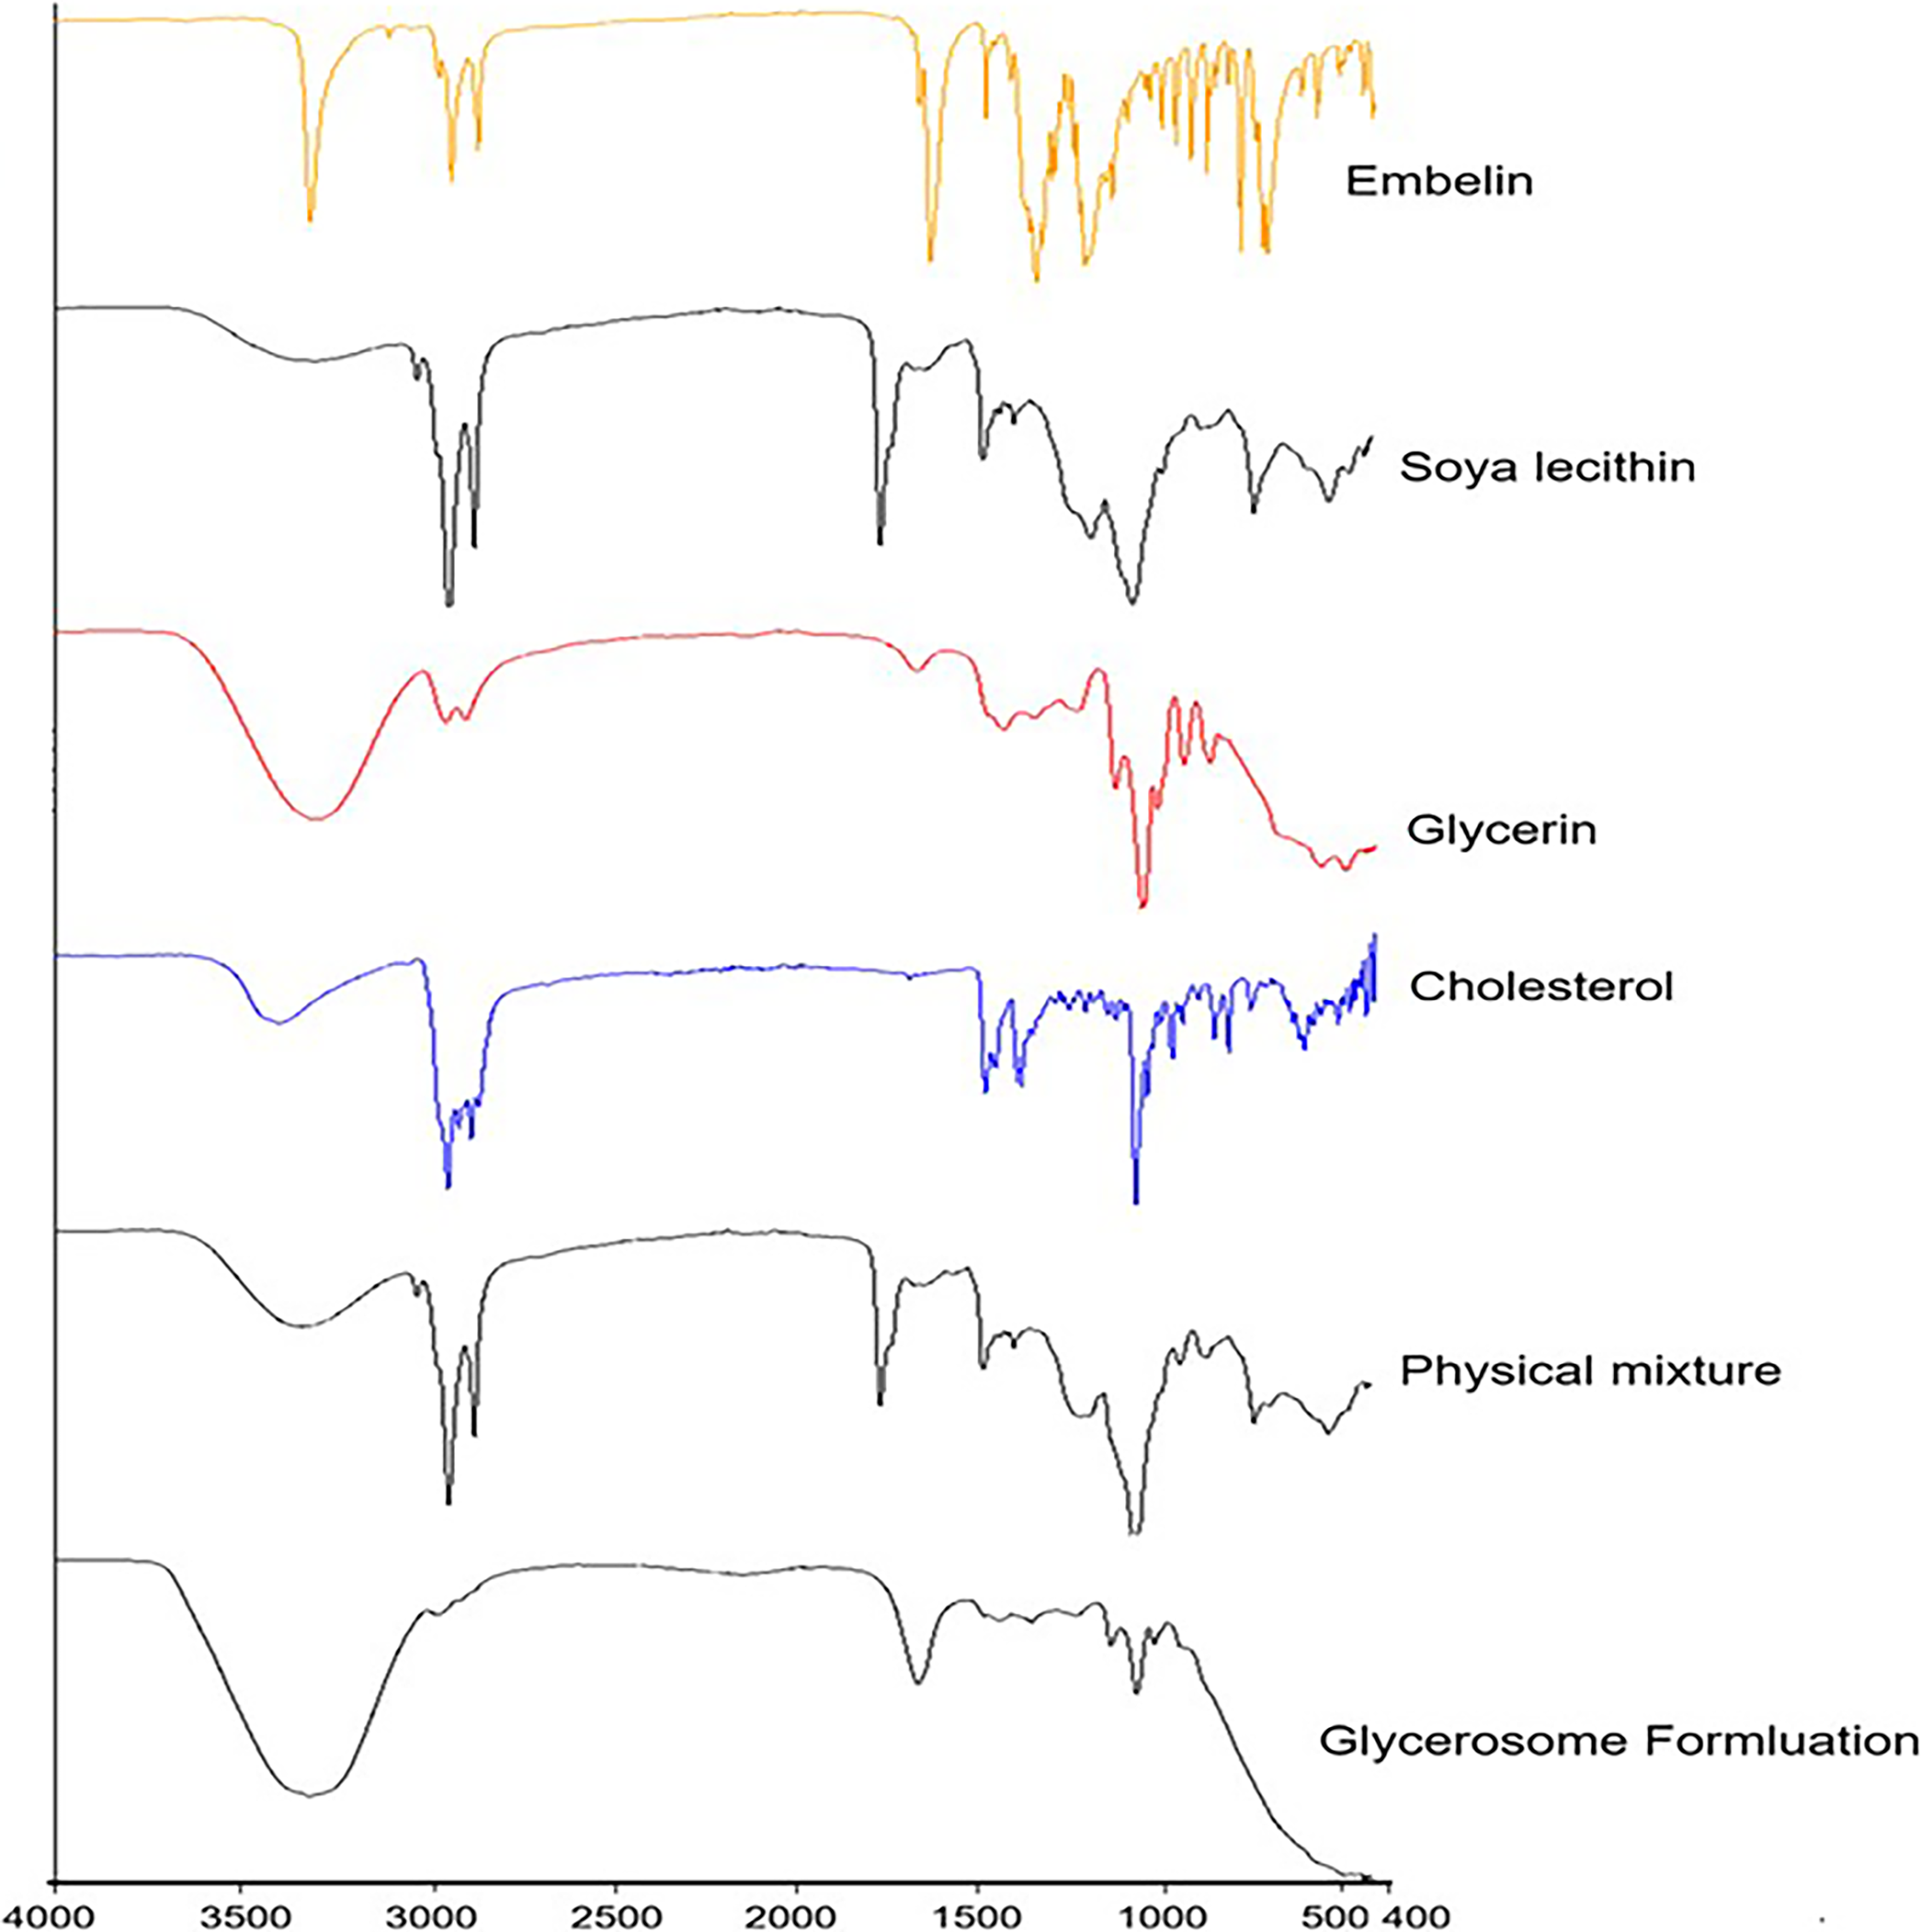
Fourier transform-infrared spectrum of embelin, soy lecithin, glycerin, cholesterol, physical mixture, and glycerosome formulation (embelin-loaded glycerosomes).
X-ray diffraction
The amorphization of the drug molecule upon encapsulation in the EB-loaded GLSM formulation was further demonstrated by XRD analysis. XRD was used to confirm the physicochemical behavior of the drug following its incorporation into the nanocarrier. The XRD spectra of pure EB and the optimized formulation are shown in Figure 7. The spectrum of pure EB displayed characteristic diffraction peaks at 12.74°, 15.38°, 18.07°, 20.26°, 33.04°, and 36.33°, confirming its crystalline nature (Fig. 7A). However, these characteristic peaks completely disappeared in the optimized EB-loaded GLSM formulation (Fig. 7B), indicating the drug’s amorphous state within the nanovesicles. This disappearance likely results from the complete entrapment of the drug inside the GLSM nanovesicles. The diffraction pattern suggests that the crystalline state of EB was significantly diminished due to its transition into a molecularly dispersed phase within the formulation. 41
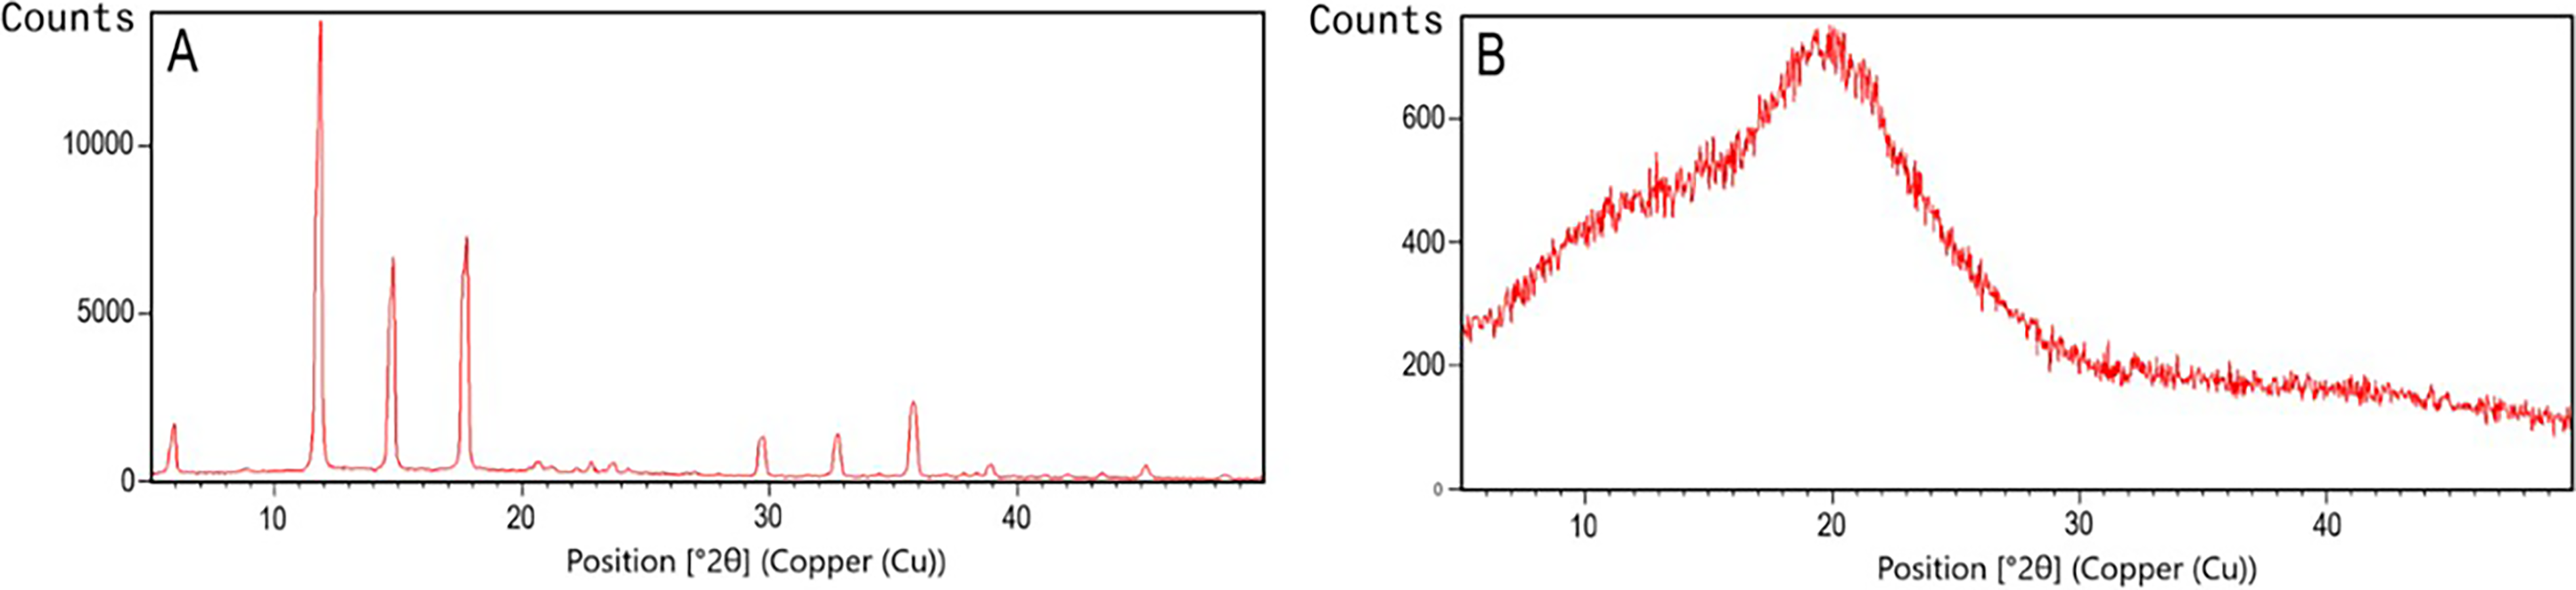
X-ray diffraction analyses of embelin (EB)
Drug Release and Kinetic Experiment
The optimized EB-loaded GLSMs exhibited a sustained release of EB rather than an immediate release. This behavior may be attributed to the amphiphilic nature of phosphatidylcholine, which is a key component in the development of GLSMs. 32 In addition, drug release could be influenced by the vesicle size of the GLSMs. In the DEG18, smaller vesicles demonstrated a higher release of EB compared with larger vesicles, 32 indicating that the GLSMs significantly enhance drug release. 32
Significant differences (p < 0.0001) were observed between the drug release profiles of the EB-loaded GLSM formulation (DEG18) and the pure EB drug suspension. The sustained release characteristics of the GLSMs were evident, as 99% of EB was released from the pure drug suspension within 2 h, whereas the same amount was released from the EB-loaded GLSMs (DEG18) only after 12 h (Fig. 8). Among the kinetic models evaluated (Fig. 9), the Higuchi model provided the best fit for the EB-loaded GLSMs, with an R2 value of 0.9455. 57
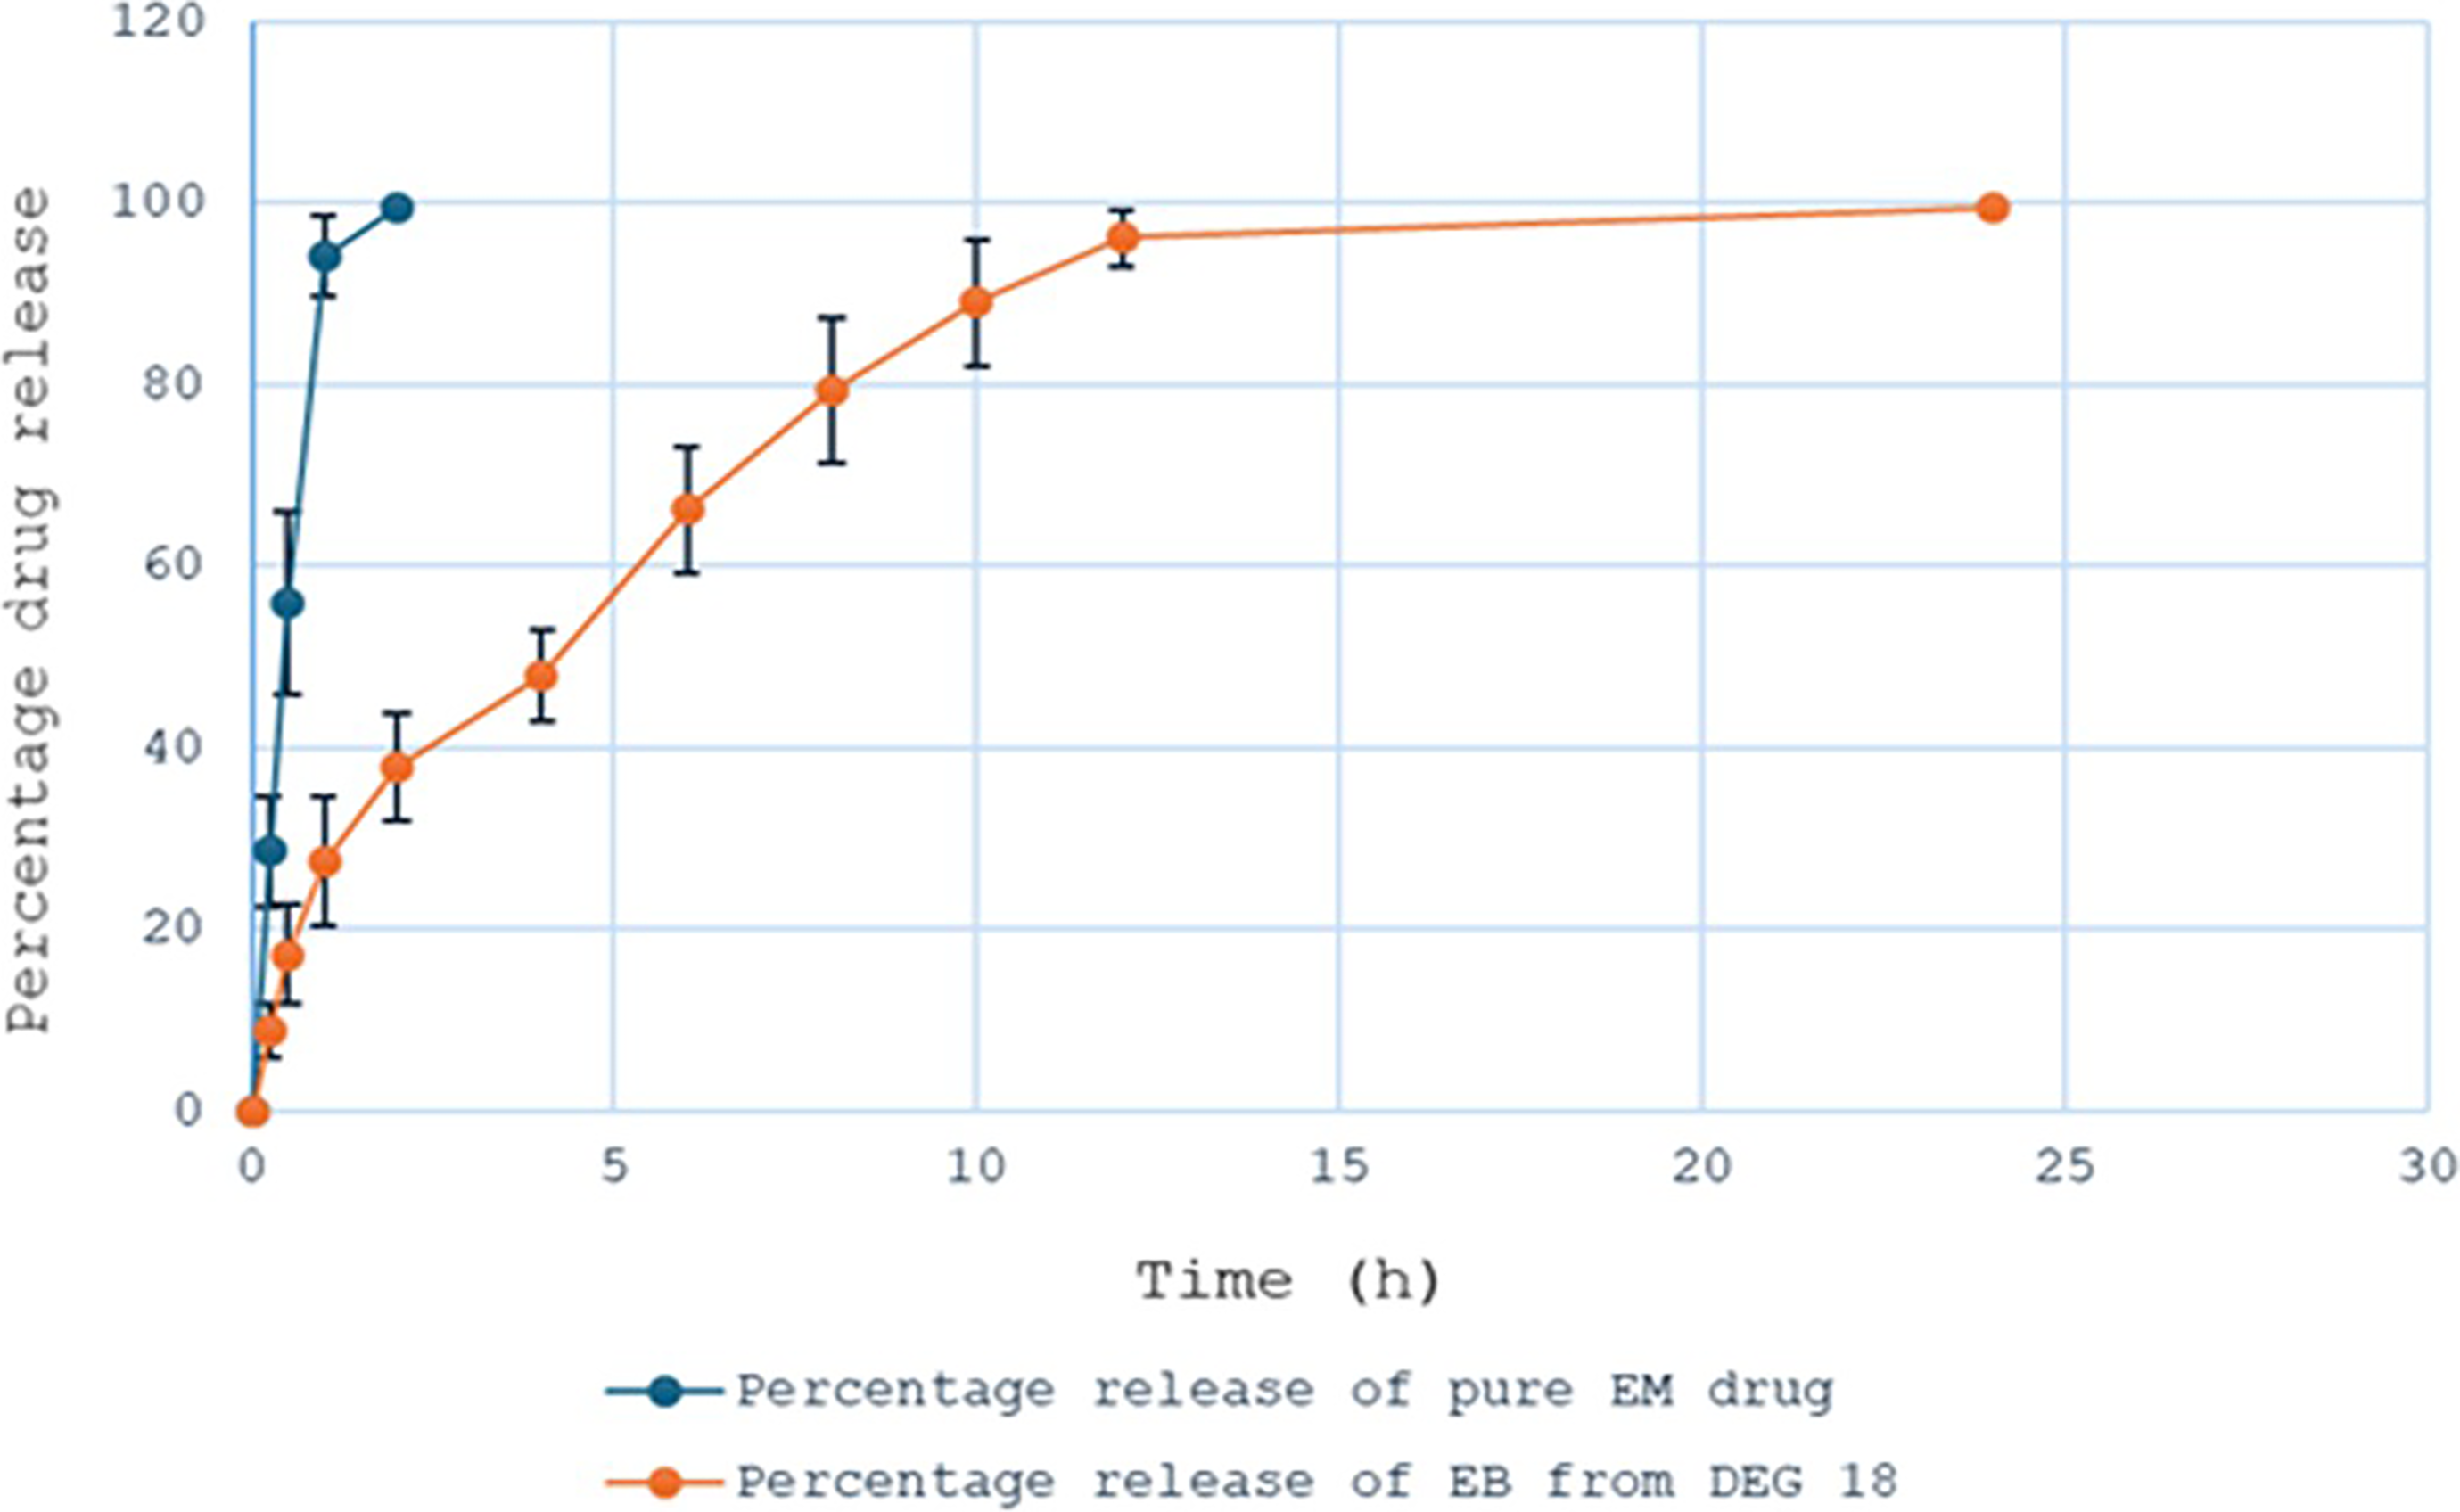
Percent drug release of EB from the pure EB drug and EB-loaded glycerosomes.
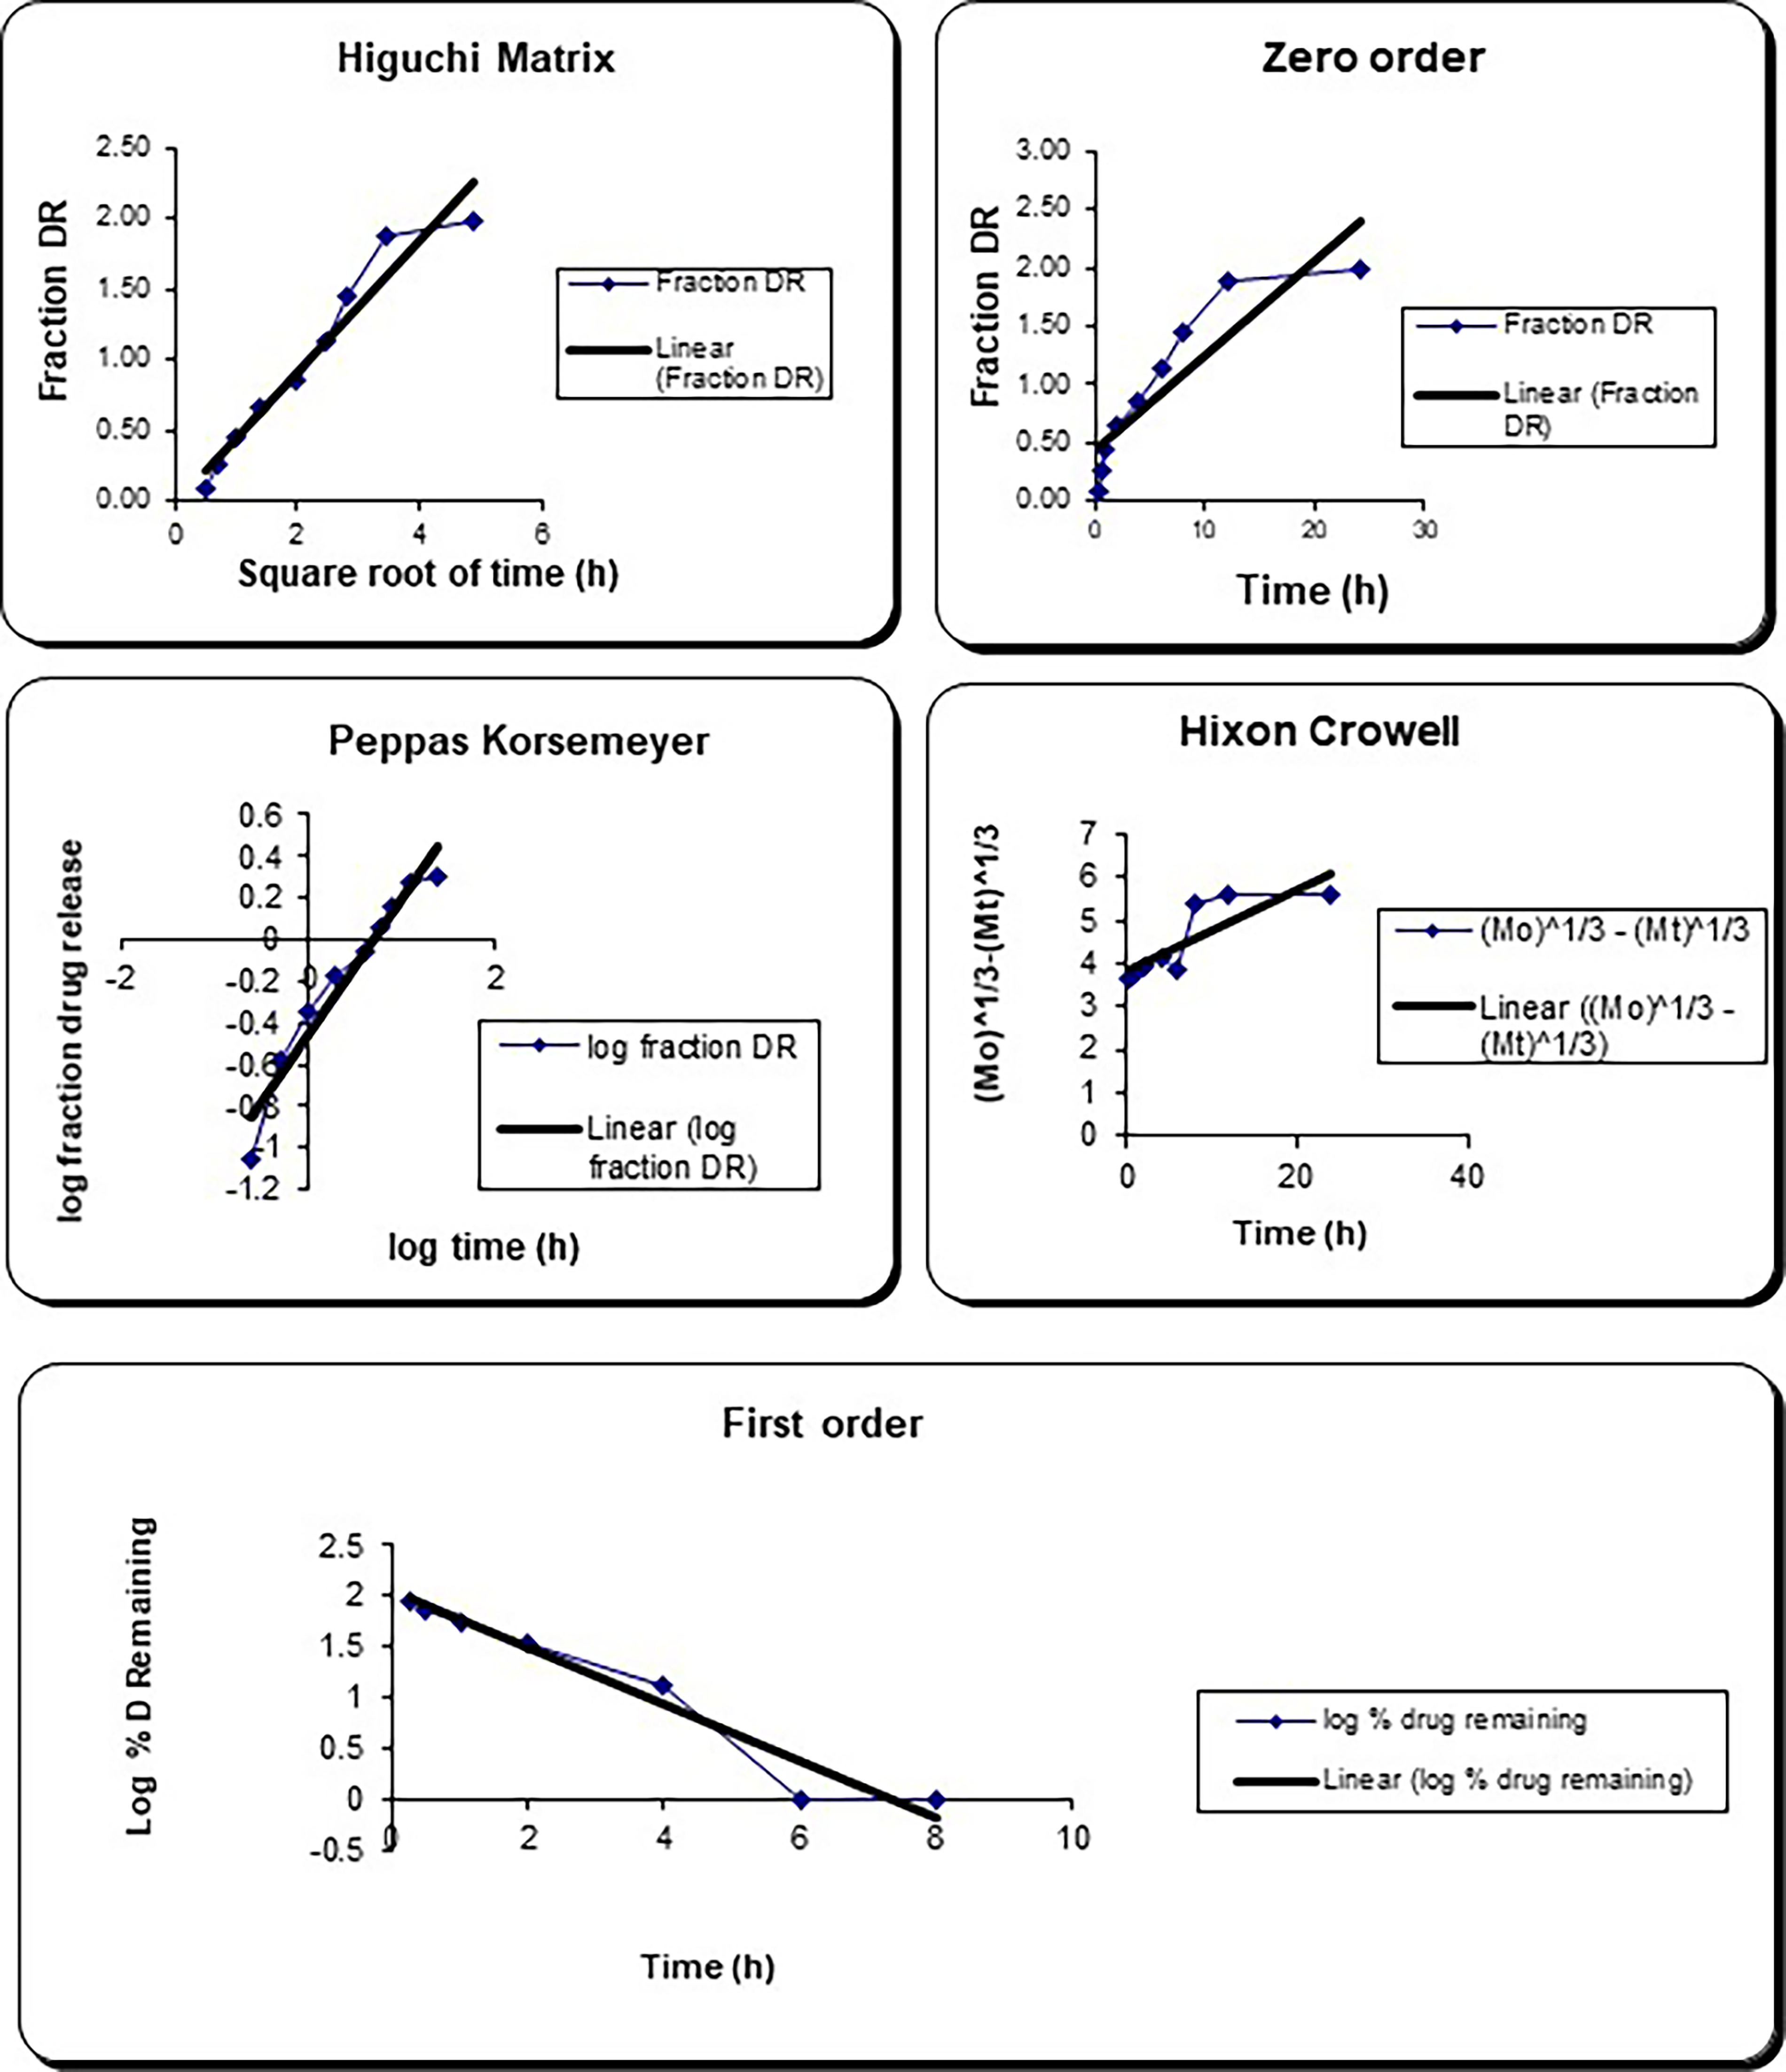
The drug release kinetic models.
MTT Assay
The cytotoxic effects of EB suspension, placebo, and EB-loaded GLSMs on HepG2 cell lines at varying concentrations (0.20–6.4 µM) are shown in Figure 10. The MTT assay results indicated that the reduction in cell viability was both concentration and time dependent after 24 h of exposure to the formulation and drug suspension. After 24 h of incubation with the formulation, cell viability decreased to 41.07% ± 6.9%, whereas treatment with the EB suspension resulted in 70% ± 12.53% of viable cells. The reduction in viability caused by the EB-loaded GLSMs was significantly greater than that caused by the EB suspension after 24 h of incubation (p < 0.01). Furthermore, the IC50 value of the EB-loaded GLSM formulation was 5.96 µM, compared with 15 µM for the EB suspension, after 24 h in the HepG2 cell line. These results suggest that the optimized EB-loaded GLSM formulation exhibited significantly higher cytotoxicity against HepG2 cells compared with the EB suspension (p < 0.01). The EB-loaded GLSMs exhibited higher cytotoxicity in HepG2 cells compared with the EB suspension due to its nanosized vesicular structure, which enhances cellular uptake and membrane penetration. In addition, encapsulation of EB in GLSMs improves drug solubility, stability, and intracellular delivery, leading to increased bioavailability and enhanced cytotoxic effects compared with the plain EB suspension.
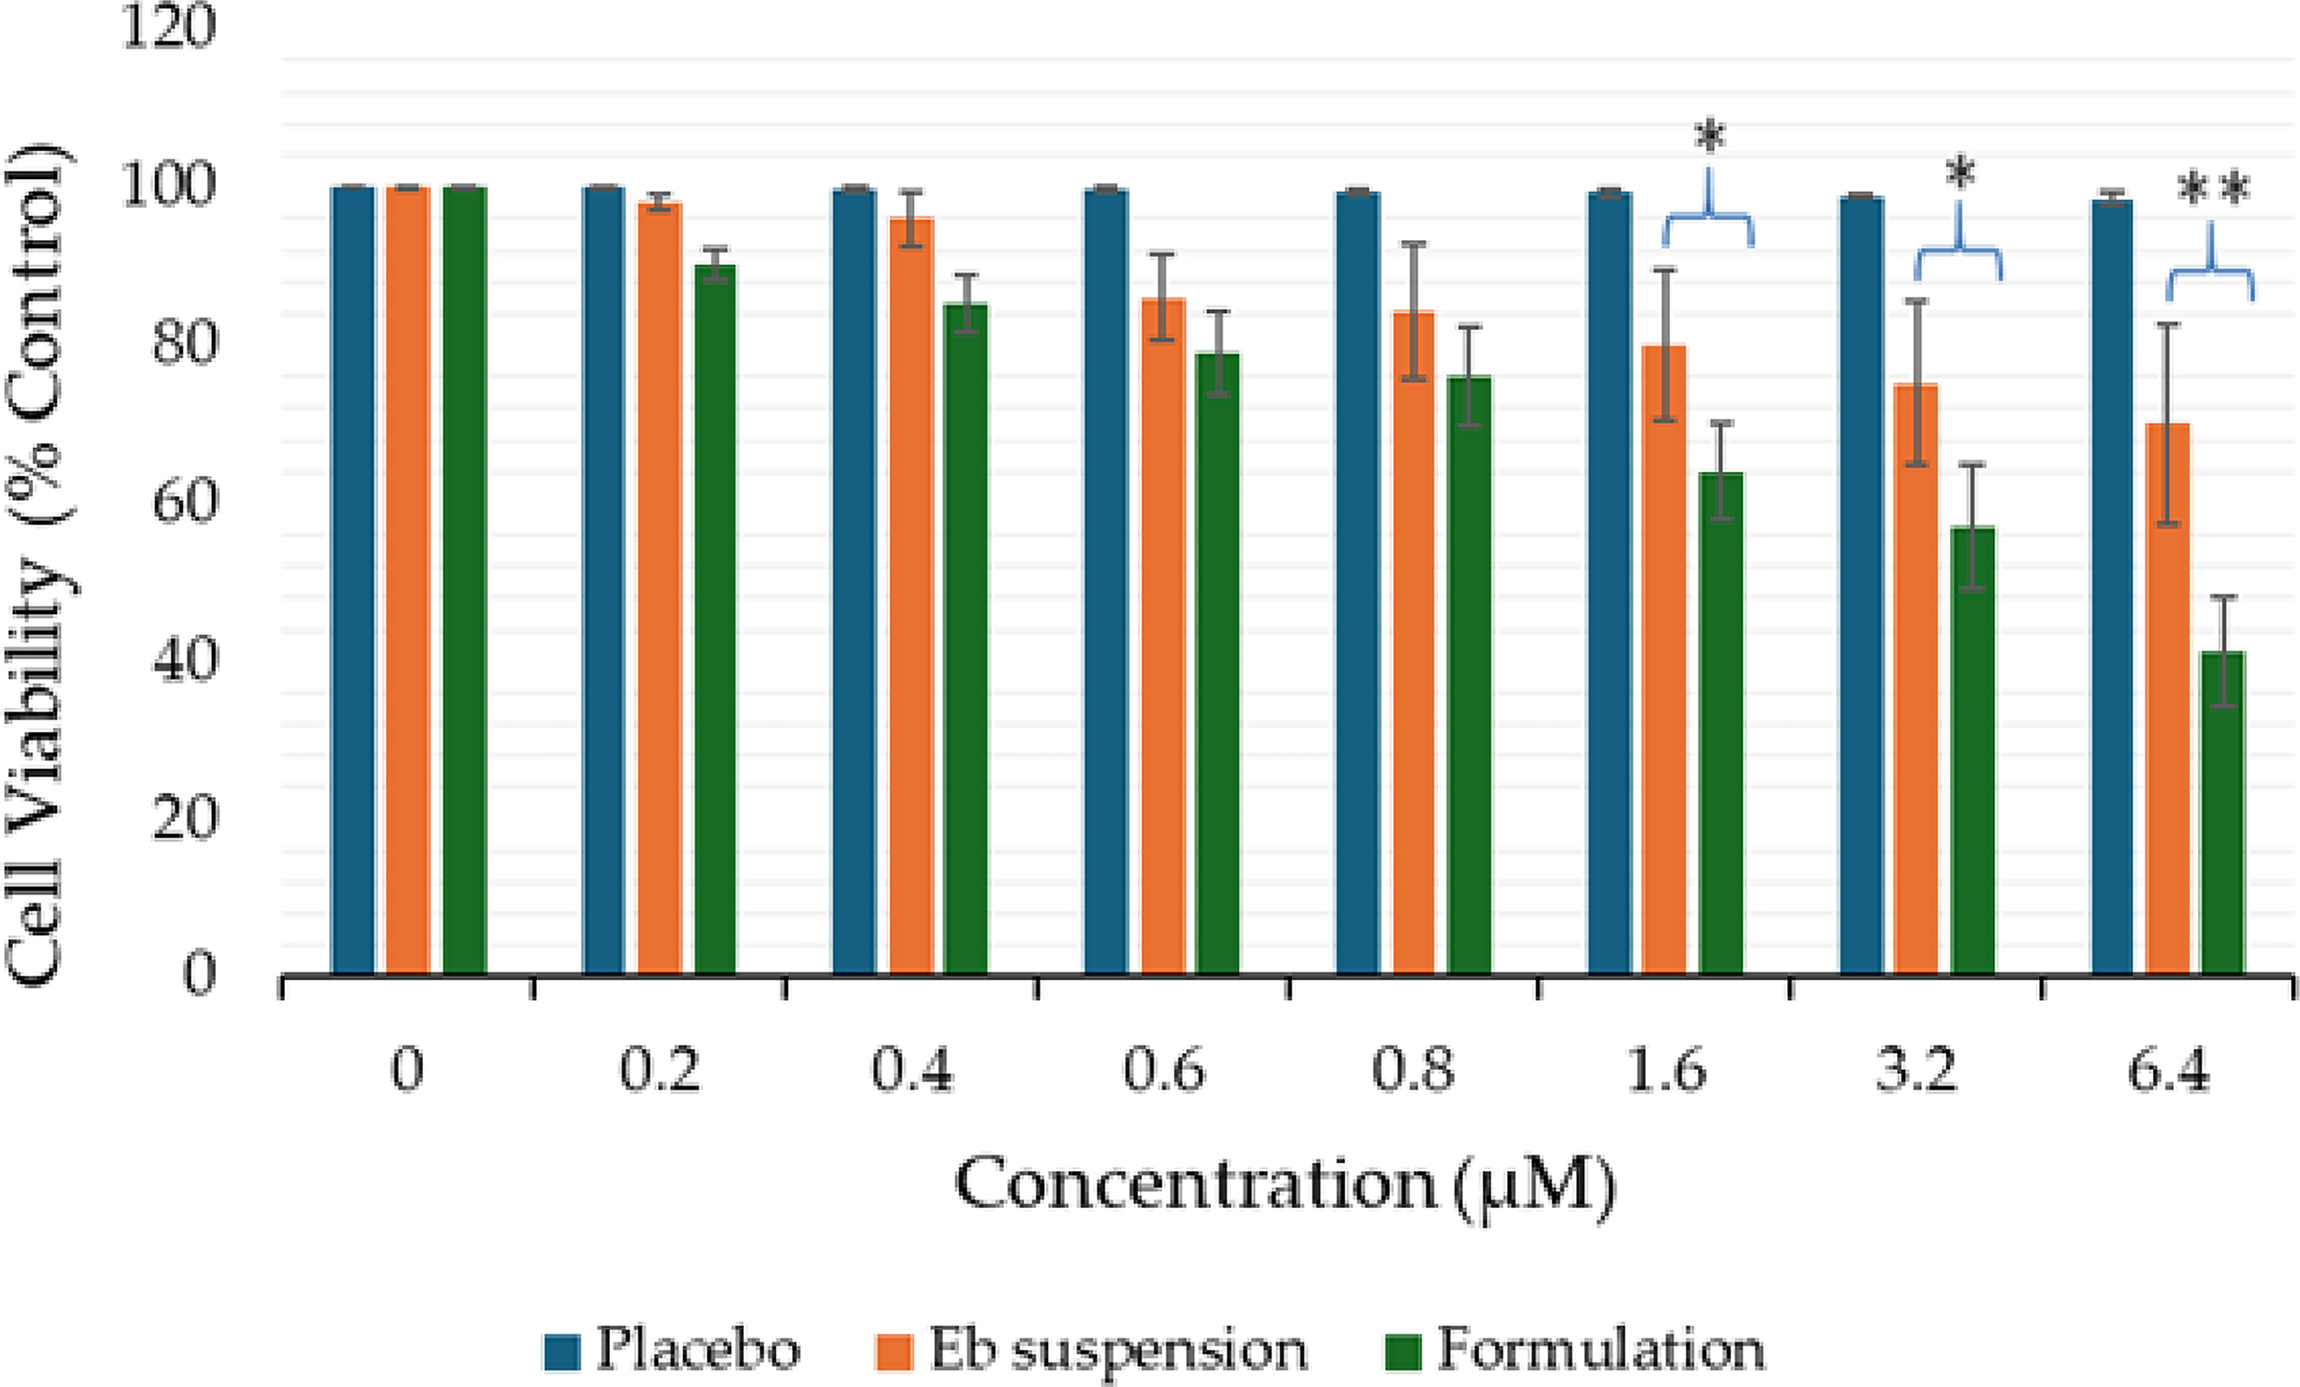
Cell viability assessment of HepG2 cells treated with EB-loaded glycerosomes, EB suspension, and placebo at a concentration from 0.2 to 6.4 µM for 24 h. Data were expressed as mean ± standard deviation.
Pharmacokinetic Study
Figure 11 displays the mean concentrations of EB in the plasma after oral administration of a single dose of EB-loaded GLSM (DEG18) formulation and the aqueous EB suspension. The optimized EB-loaded GLSM formulation demonstrated a significantly higher plasma EB concentration than the EB aqueous suspension (p < 0.01). The optimized EB-loaded GLSM formulation demonstrated considerably greater plasma Cmax, AUC0–t, and AUC0–∞ values compared with the aqueous EB suspension (p < 0.01) (Table 5). The EB-loaded GLSM formulation demonstrated a plasma bioavailability approximately 2.5-fold greater than that of the EB aqueous suspension. These results demonstrate the ability of the optimized EB-loaded GLSMs (DEG18) to enhance the oral bioavailability of EB, likely due to the protective nature of the GLSMs encapsulating the solubilized EB, which reduces first-pass metabolism.58,59
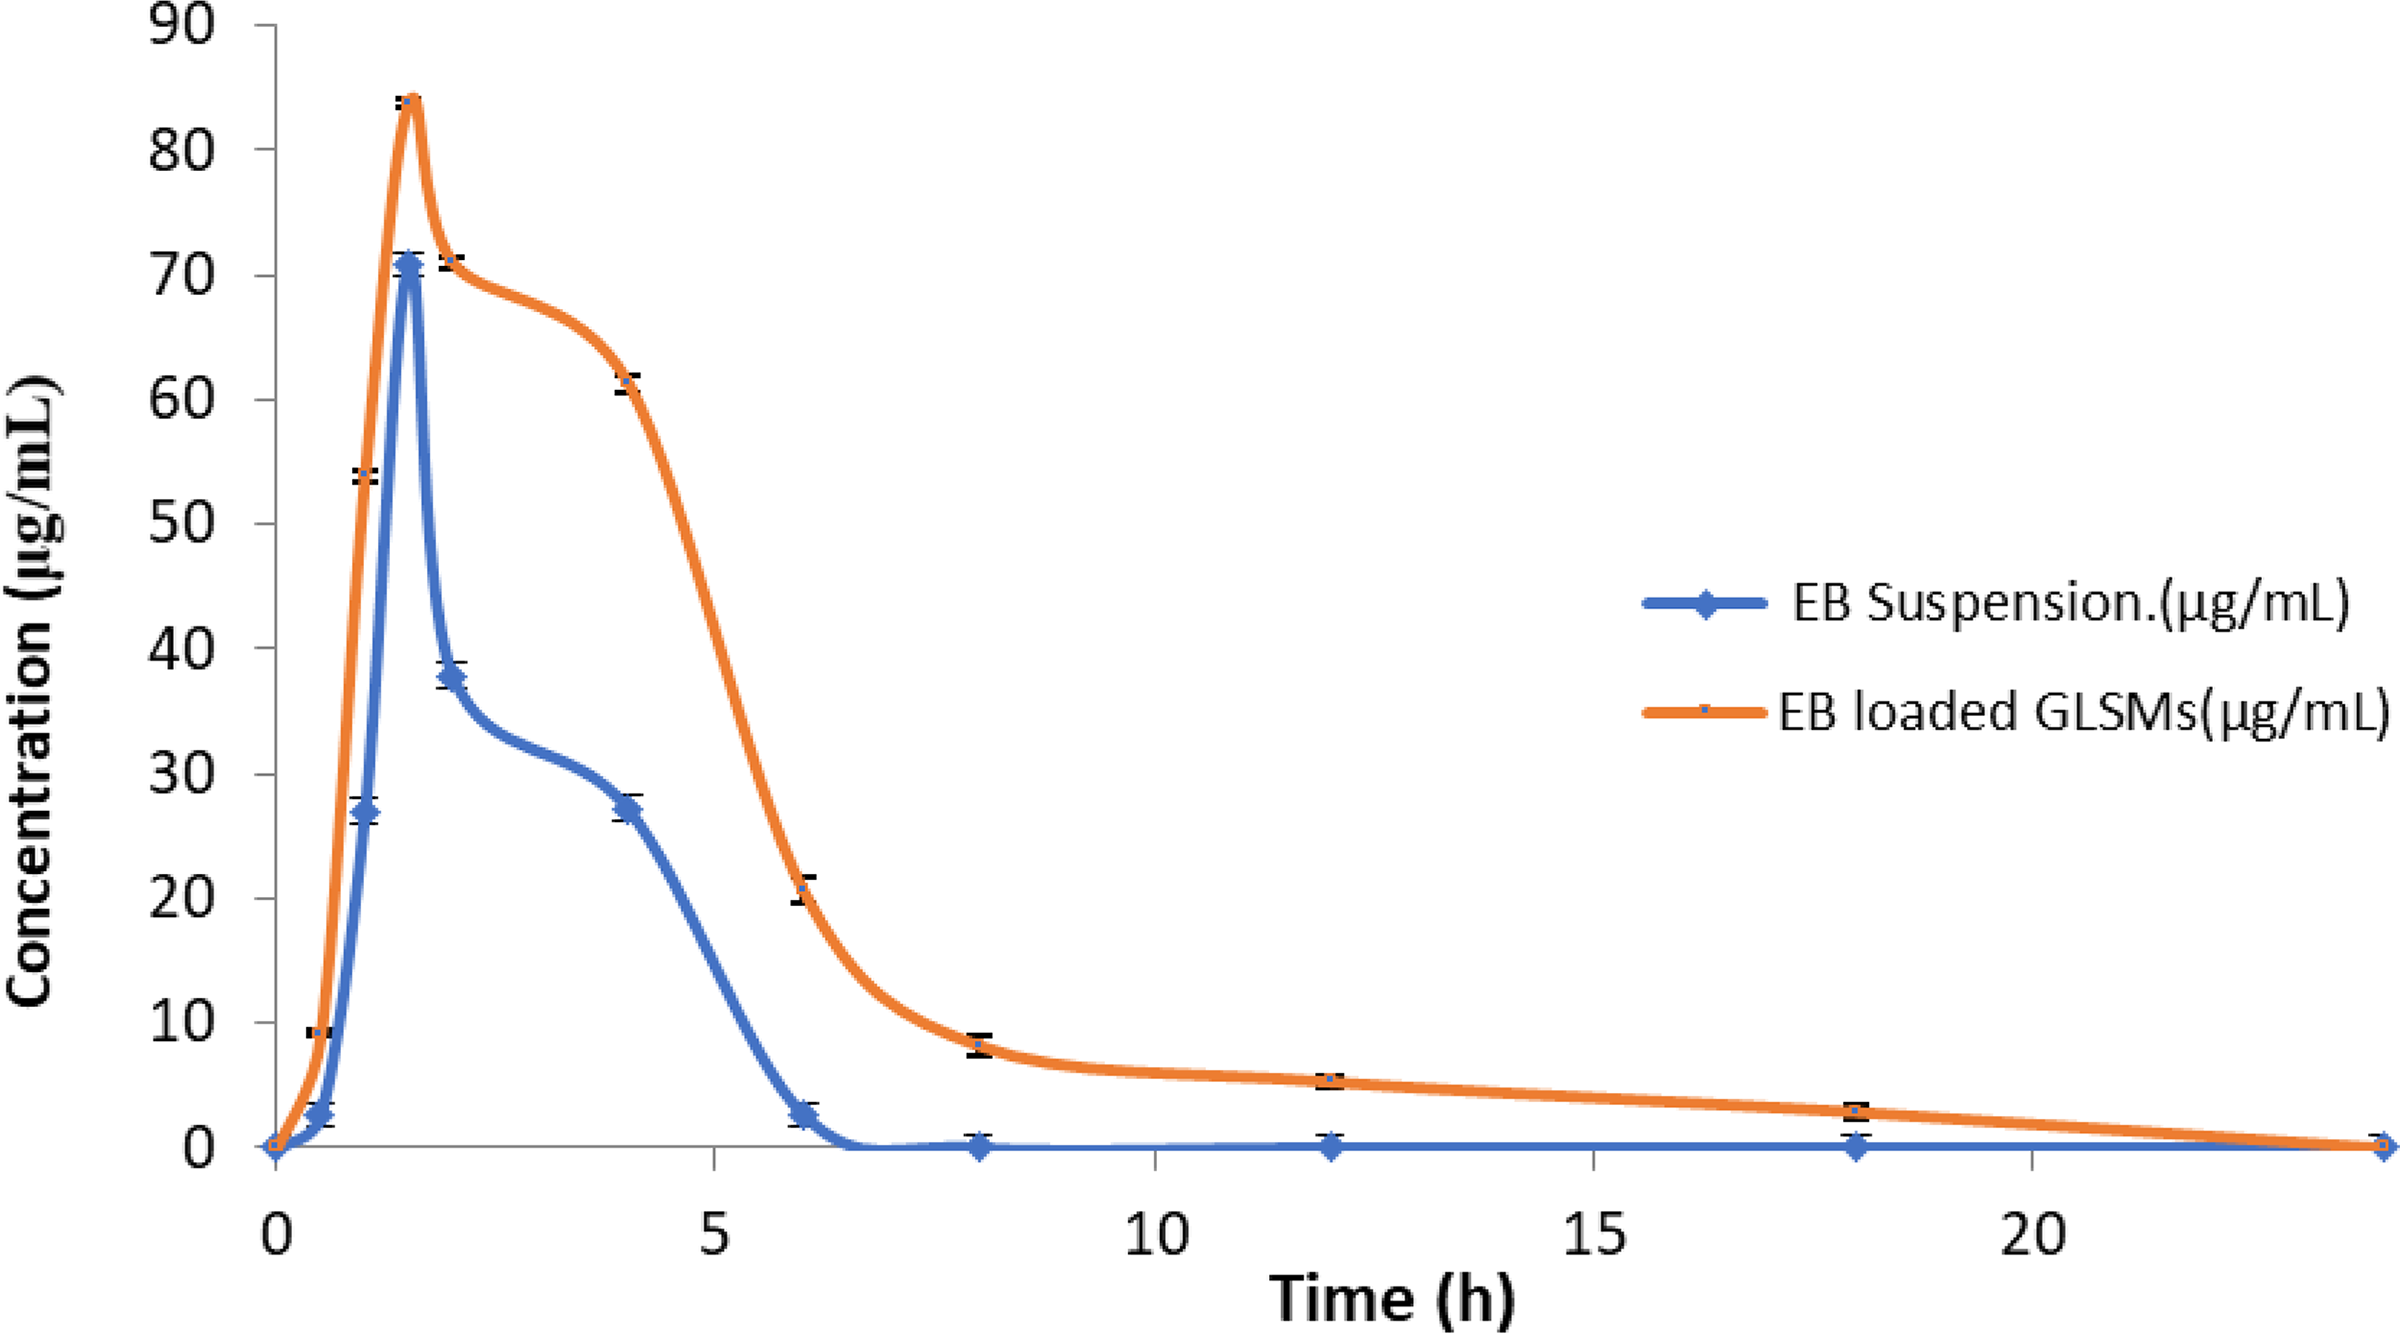
Plasma concentration–time curve of EB aqueous suspension and EB-loaded glycerosomes. Data were expressed as mean ± standard deviation.
Pharmacokinetics of the Embelin Aqueous Suspension and Embelin-Loaded Glycerosome Formulation (DEG18)
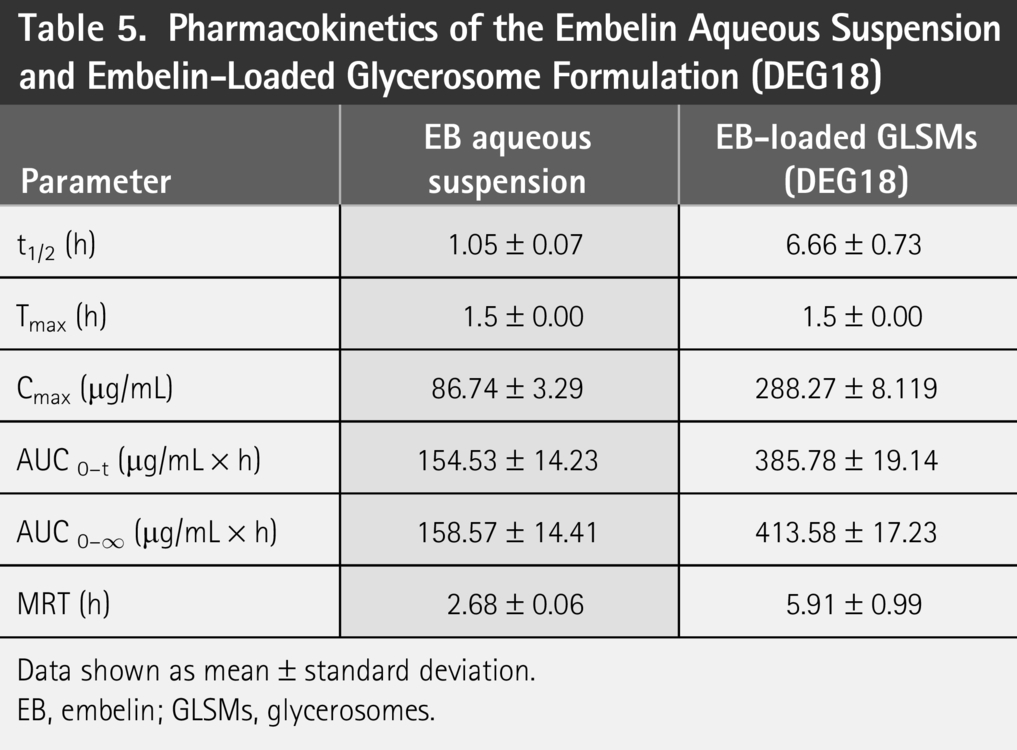
Data shown as mean ± standard deviation.
EB, embelin; GLSMs, glycerosomes.
Pharmacodynamic Study
The hepatoprotective and antihyperlipidemic effects of the optimized EB-loaded GLSM (DEG18), particularly relevant for MASLD, were evaluated in Wistar rats. Figure 12 shows the changes in liver function markers and blood lipid profiles. Liver function was assessed by measuring the serum levels of aspartate transaminase (AST) and alanine transaminase (ALT). These enzymes were significantly elevated in the disease control group compared with the normal diet control group (Fig. 12). Treatment with the optimized EB-loaded GLSM (DEG18) resulted in a marked reduction in serum AST and ALT levels compared with the disease control group.
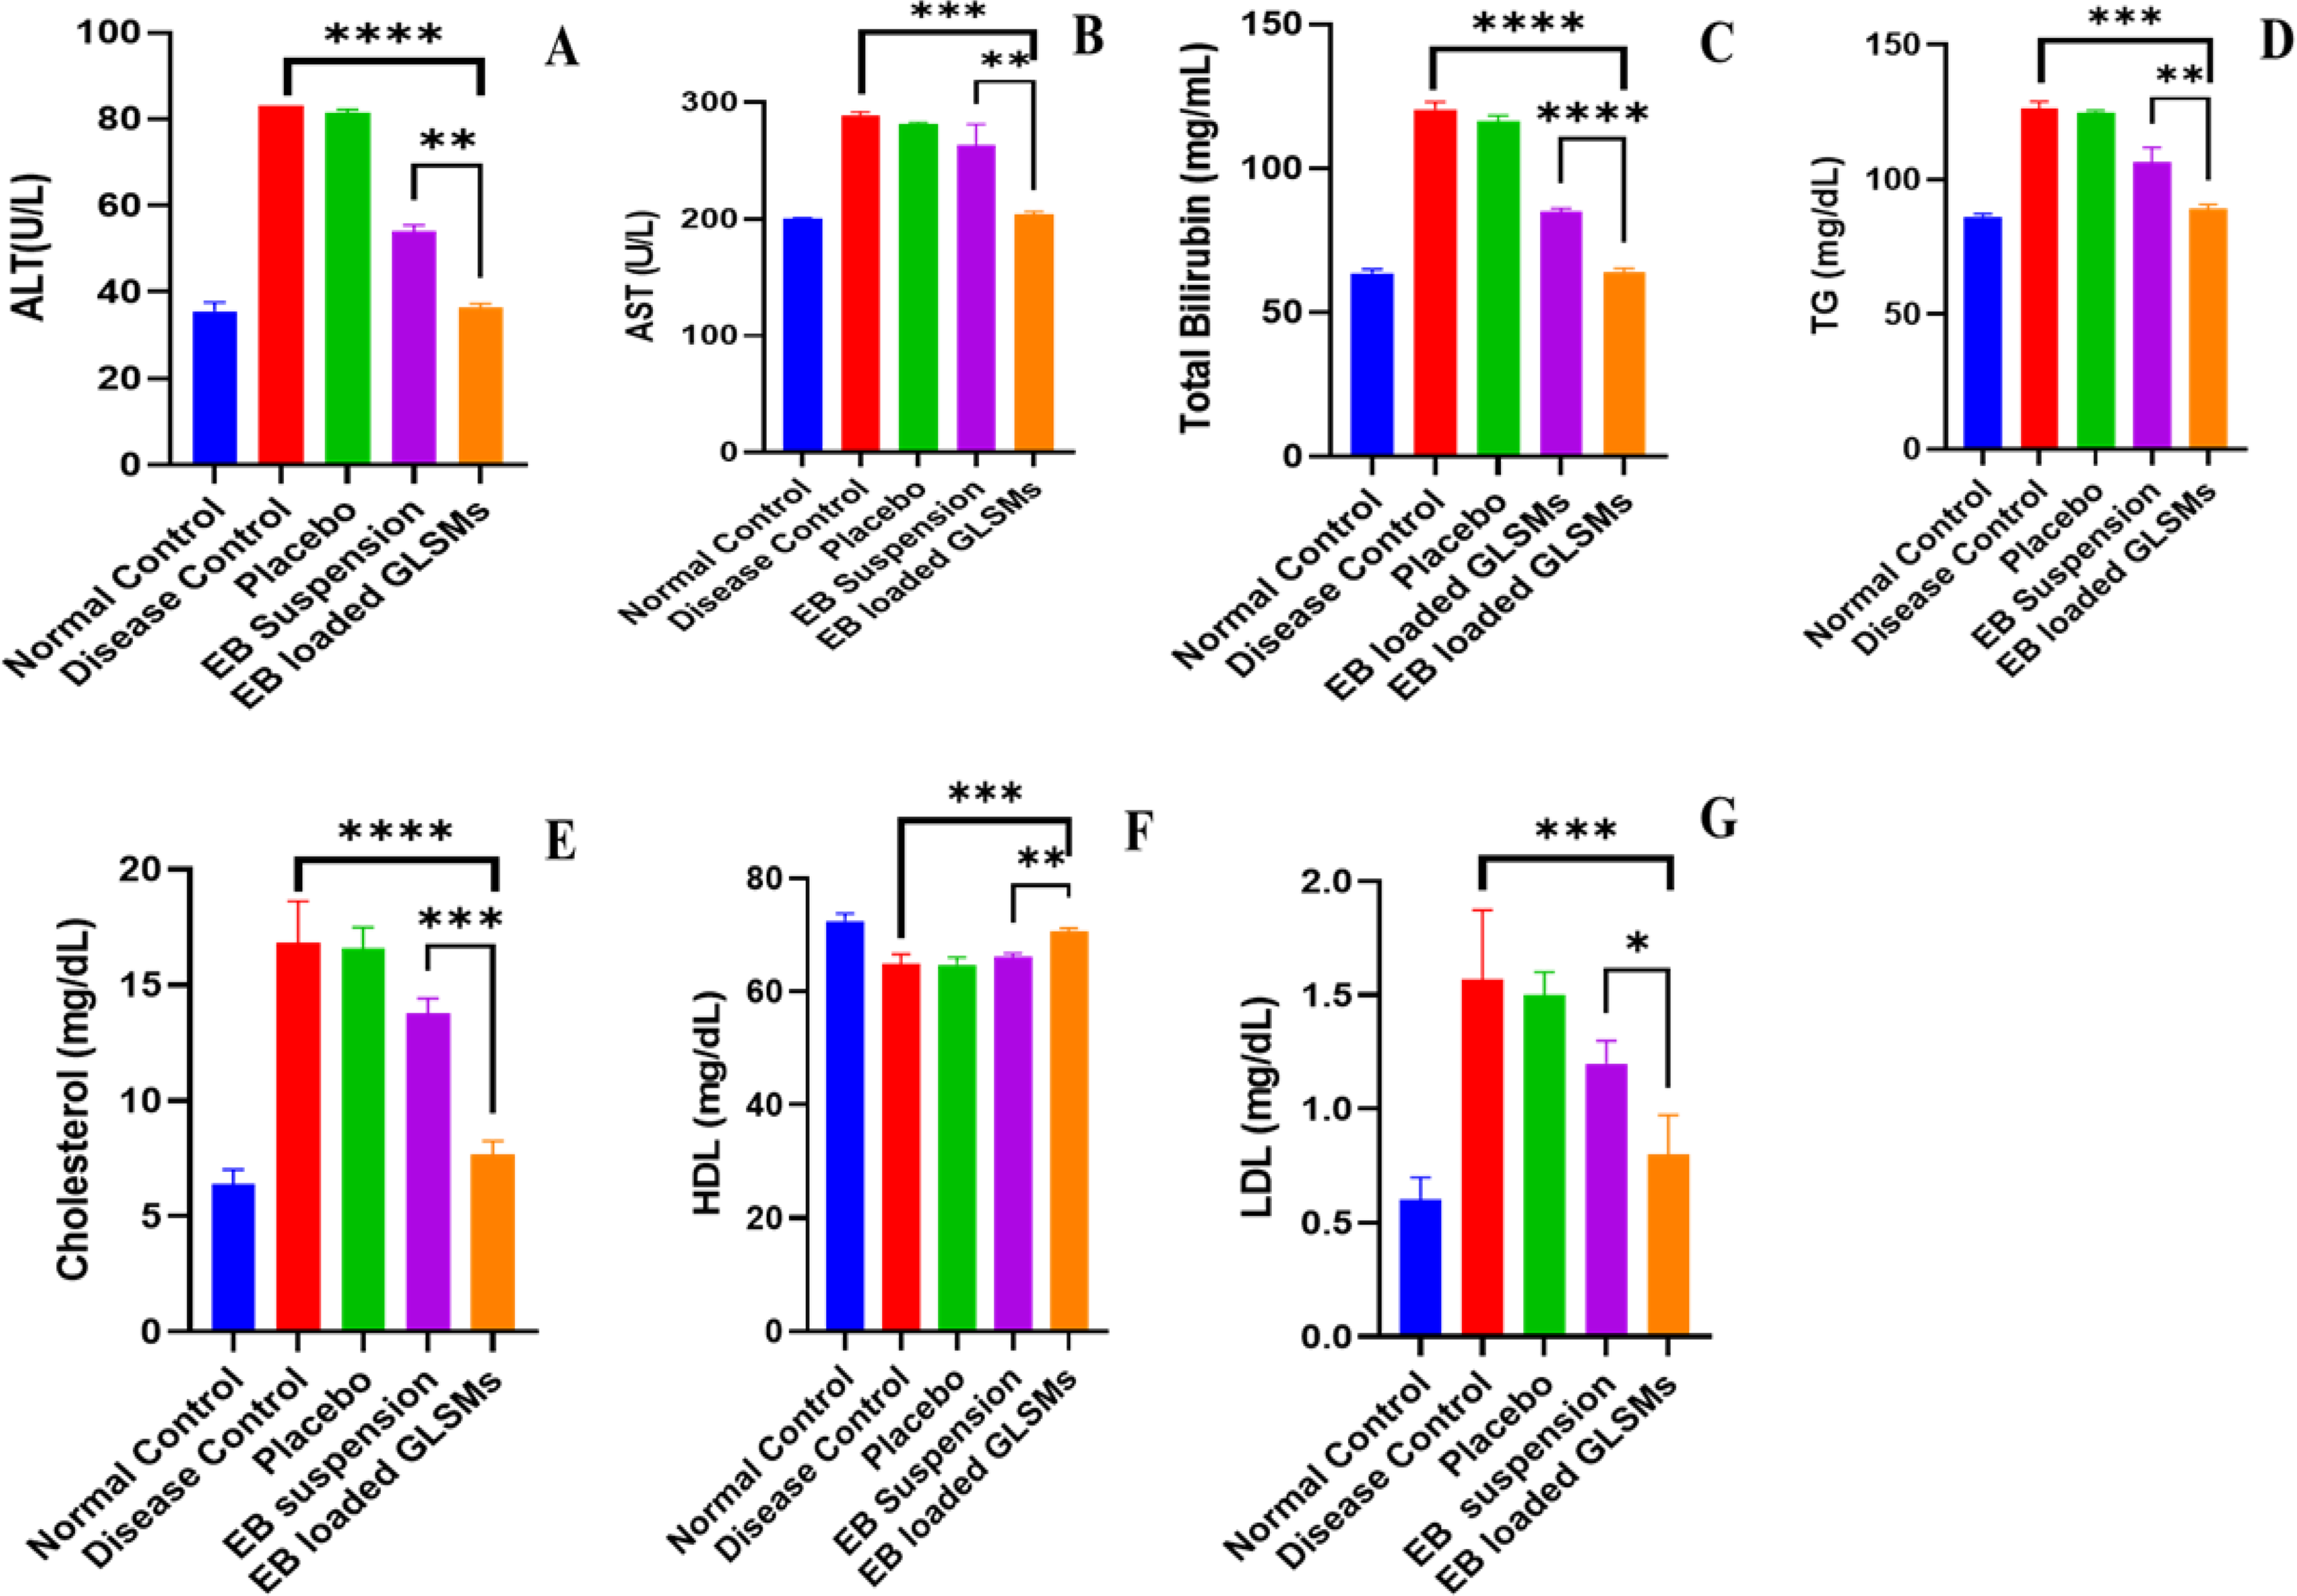
Serum
Histological analysis using H&E staining revealed abnormal liver tissue morphology in the disease control group, including hepatocyte ballooning and macrovesicular steatosis (Fig. 12). In contrast, rats treated with the optimized EB-loaded GLSMs (DEG18) showed a significant attenuation of macrovesicular steatosis compared with those treated with the aqueous EB suspension, indicating a protective effect against hepatic steatosis.
Since hepatic lipid accumulation is a key issue in MASLD, blood lipid levels were measured to assess the lipid-lowering potential of the optimized formulation. The disease control group exhibited elevated serum TG and TC levels compared with the normal diet group. Treatment with the optimized EB-loaded GLSMs (DEG18) significantly lowered serum TG and TC levels compared with the EB suspension. Moreover, low-density lipoprotein (LDL) cholesterol levels were significantly reduced, while high-density lipoprotein (HDL) cholesterol levels were significantly increased in animals treated with the EB-loaded GLSMs.
Histopathology
Liver tissues harvested from Wistar rats were preserved in 10% NBF containing ∼4% formaldehyde, because commercial formalin is 37%–40% formaldehyde and is diluted 1:10 and paraffin-embedded for 24 h. After sectioning, the liver samples were stained with H&E and placed onto a glass microscope slide for histological analysis. Normal liver histology showed well-arranged hepatocytes and polygonal cells separated by sinusoids, with a central vein in each lobule and peripheral portal triads (Fig. 13A).

In contrast, the liver histopathology of HFD-treated or disease control rats revealed numerous small-to-large mononuclear cell infiltrates and abundant pyknotic nuclei, indicating liver cell injury. In addition, the central vein exhibited some ruptured endothelial cells compared with the placebo or vehicle-treated group (Fig. 13B). The placebo-treated group displayed swollen, ballooning hepatocytes and cytoplasmic swelling (Fig. 13C). The drug suspension-treated group showed partial improvement, with mild reductions in macrovesicular steatosis, hepatocyte ballooning, and inflammation (Fig. 13D).
Rats treated with EB-loaded GLSMs alongside the HFD demonstrated significant protection against MASLD, as evidenced by the preservation of hepatic cord formation and the absence of necrosis and vacuoles in liver cells (Fig. 13E).
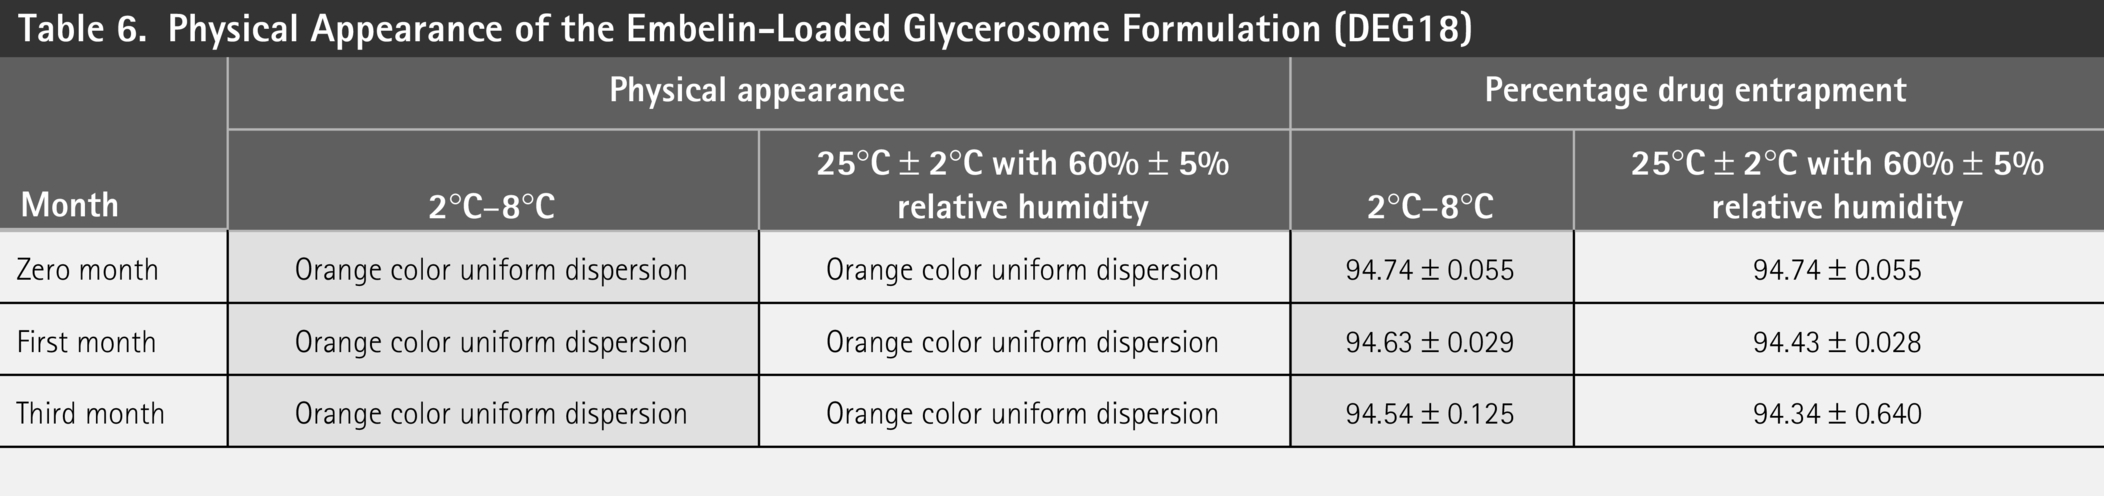
Stability Study
The EB-loaded GLSMs (DEG18) were stored at two conditions: 2°C–8°C and 25°C ± 2°C with 60% ± 5% relative humidity. Samples were withdrawn at 1 and 3 months for analysis. The physical characteristics and percentage drug entrapment of the withdrawn samples are summarized in Table 6. No significant changes were observed in the percentage drug entrapment of EB, indicating that the developed formulation remained stable over the tested period.
Physical Appearance of the Embelin-Loaded Glycerosome Formulation (DEG18)
CONCLUSIONS
EB-loaded GLSMs were successfully developed and compared with an aqueous EB suspension. The ultradeformable GLSM vesicles were prepared using the thin-film hydration technique with a rotary evaporator, which involved dissolving a precise amount of EB in a mixture of organic solvents followed by sonication. This process resulted in the formation of a hydrated thin film of EB-loaded GLSMs. The influence of independent variables on the properties of the GLSMs was systematically studied using a Box–Behnken statistical design. The optimized formulation exhibited a significantly higher drug EE, smaller vesicle size, and sustained EB release profile. In vivo pharmacokinetic studies demonstrated that the GLSMs significantly enhanced the oral bioavailability of EB compared with the aqueous suspension. In addition, the optimized EB-loaded GLSM effectively reduced serum levels of AST, ALT, and LDL, while increasing HDL levels, underscoring its therapeutic potential against MASLD. Stability testing showed no significant changes in the percentage drug entrapment over 3 months, confirming the formulation’s stability. Based on the findings, EB-loaded GLSMs may be effectively translated for use in clinical settings.
DATA AVAILABILITY STATEMENT
The data that support the findings of this study are available upon reasonable request from the authors.
Authors’ contributions
Conceptualization: M.D. and M.H.A. Methodology: M.H.A. and M.D. Software: M.H.A., M.D. and M.A. Validation: M.H.A., M.D. and M.A. Formal analysis: M.H.A., M.D. and M.A. Investigation: M.H.A., M.D. and M.A. Resources: M.H.A. Data curation: M.H.A., M.D. and M.A. Writing—original draft preparation: M.D. Writing—review and editing: M.H.A. and M.D. Visualization: M.H.A. and M.A. Supervision: M.H.A. Project administration: M.H.A. Funding acquisition: M.A. All the authors have read and agreed to the published version of the article.
Footnotes
ACKNOWLEDGMENTS
The authors extend their appreciation to Princess Nourah bint Abdulrahman University Researchers Supporting Project number (PNURSP2026R736), Princess Nourah bint Abdulrahman University, Riyadh, Saudi Arabia.
DISCLOSURE STATEMENT
The authors declare that they have no competing interests.
FUNDING INFORMATION
No funding was received for this article.