




Abstract
This study was designed to examine whether the shift in juvenile justice policy toward punitive sanctioning disproportionately impacted racial and ethnic minority boys. Using a nationally representative sample derived from the National Longitudinal Surveys of Youth 1979 and 1997 (NLSY79, NLSY97), this study examines 1980–2000 differences in contact with the justice system, controlling for self-reported delinquency. Results confirmed that boys in 2000 were significantly more likely than those in 1980 to report being charged with a crime. Once charged, they were less likely to be diverted and more likely to be convicted and placed in a correctional institution. Consideration of interaction effects revealed these effects were magnified for Black and Hispanic males. These findings provide evidence of a general trend toward more punitive treatment of boys in the juvenile justice system, especially racial and ethnic minority boys.
In 2010, there were more than 1.6 million estimated arrests of juveniles in the United States (Puzzanchera & Kang, 2013a) and nearly 1.4 million delinquency cases processed in juvenile courts (Puzzanchera & Kang, 2013b). Although juvenile arrest rates have been steadily decreasing since a peak during the mid-1990s, there appears to be a trend toward increased court intervention for youth. For instance, in 2010, of the approximately 1.4 million delinquency cases processed in juvenile courts, 54% were handled formally and petitioned, compared to only 45% of cases in 1985 (Puzzanchera & Kang, 2013b).
Historically and currently, critics of the juvenile justice system have identified minority overrepresentation as a problem. Indeed, of youth arrested, approximately 34% are racial or ethnic minority youth, and Black youth are more than twice as likely as White youth have been arrested (Puzzanchera & Kang, 2013a). In 2010, for example, the arrest rate (ages 10 through 17) for Black youth was 9,140 per 100,000 youth, compared to only 4,243 per 100,000 for White youth. Furthermore, although arrest rates for White and Black youth have been steadily decreasing since their peaks during the mid-1990s (1996 and 1995, respectively), arrest rates for White youth have been decreasing at a faster pace than for Black youth. The arrest rate for White juveniles, for example, dropped to pre-1980 levels only four years following its peak (in the year 2000), whereas the arrest rate for Black juveniles dropped to pre-1980 levels 15 years following its peak (in the year 2010; Puzzanchera & Kang, 2013a).
Studies of disproportionate minority contact with the justice system generally attribute minority overrepresentation to either differences in the frequency and severity of offending (see, e.g., Beaver et al., 2013; Tracy, 2002) or to racial and ethnic bias with the justice system (see, e.g., Leiber, Johnson, Fox, & Lacks, 2007). Studies spread over decades reveal that at least in some parts of the country in some periods, biased decisions led to harsher justice system responses to minority youth (Bishop, 2005; Engen, Steen, & Bridges, 2002; Leiber, 2002; Paternoster & Iovanni, 1989). The present research is not in the tradition of studies on predictors of the decision choices made by agents of the justice system (e.g., police, judges). However, we extend upon the existing disproportionate minority contact literature by highlighting the importance of determining whether the trend toward increased intervention for delinquent youth has disproportionately impacted some demographic groups more than others. The consistent evidence of bias, along with the evidence from Uniform Crime Report (UCR), National Crime Victimization Survey (NCVS), juvenile court, and self-report research, directed our interest to whether any 1980–2000 differences in the probabilities of arrest and subsequent points of court involvement net of effects of delinquency, were uniquely pronounced for Black or Hispanic boys, two groups that have been overrepresented in the juvenile justice system for decades (HACER, 2005; National Council on Crime and Delinquency, 2007).
Changes in Youths’ Arrests, Court Involvement, and Behavior
Government reports that compare 1980 with a period two decades later—before and after key “get tough” reforms in police, school, and justice system responses to youth—provide an aggregate-level picture of whether youth entered and penetrated the justice system at different population-based rates. In a comparison of 1980 and 1999 arrests indicated by UCR data, for most types of delinquency (e.g., a composite of violent offenses, a composite of property offenses, and separate measures of murder, forcible rape, and robbery), after a period of increase, decreases resulted in about the same or lower arrest rates for boys in 1999 as in 1980 (Snyder, 2001).
Police do not refer all arrested youth to juvenile court, and juvenile courts divert some referred youth. Suggesting some decrease in diversionary practices, despite declines in arrest rates for all but simple assaults, youth delinquency court case rates increased from 1985 to 2000 (this and subsequent 1985 vs. 2000 comparisons in court statistics are from Puzzanchera, Stahl, Finnegan, Tierney, & Snyder, 2004). For boys, the delinquency case rate grew from 43.3 cases per 1,000 youth in 1985 to 53.2 cases per 1,000 youth in 2000. The increase was greatest for drug offenses (126%), moderate for person offenses (78%), and nonexistent (a 17% decrease) for property offenses. For boys coming to court attention, the proportion handled formally (i.e., not diverted or warned) jumped from 48% in 1985 to 60% in 2000. The war on drugs may account for much of boys’ influx into the courts; every year starting in 1988, drug cases were the type most likely to be handled formally.
Once before the court, boys were equally likely to be adjudicated delinquent in 1985 and 2000. After adjudication, the chances of probation increased somewhat from 1985 to 2000 (56% vs. 62%), and decreased somewhat for residential placement (30% vs. 25%). Boys’ increased penetration into the juvenile courts seemed to occur most substantially at the “front end” of the process: arrest, delinquency petition, and orders of probation.
Black youth deviate from the general trends, with a disproportionately large shift to increased court intervention. Starting in 1985, the proportion of cases for Black youth grew from 23% to 26%. By the year 2000, Black youth had a case rate twice that for White juveniles (95.6 vs. 46.3 per 1,000 youth). In both years, juvenile courts more often handled Black youths’ cases formally. For example, in 2000, 64% of all Black youths’ delinquency cases were handled formally, compared to 55% of White youths’ delinquency cases. Counter to the general decline in the use of out-of-home placement, the likelihood of out-of-home placement for drug offense cases involving Black juveniles adjudicated delinquent was greater in 2000 (31%) than in 1985 (28%). These trends signal Black youths’ growing overrepresentation in the justice system, often for drug-related offenses; but these data cannot explain whether the change is fully or partly due to Black youths’ disproportionate increase in drug use.
The study, Monitoring the Future, is the only U.S. data collection effort to generate reports with comparative statistics on drug use (or other forms of delinquency) for a representative sample of youth in 1980 and 2000. The drug use focus is relevant to the present article, since drug offenses dominate the increase in the rate of juvenile court cases. These data show that for every year in the two decades beginning in 1980, Black 12th graders reported the lowest prevalence of marijuana and cocaine use (Johnston, O’Malley, & Bachman, 2001). Hispanics’ prevalence rates were closer to but generally lower than those of Whites in each year. For all groups, prevalence was lower in 2000 than in 1980. At least for youth in school during the 12th grade (the Monitoring the Future sample), racial/ethnic drug use differences do not appear to explain higher court involvement of Black youth in 2000 than in 1980.
To examine the possibility that higher levels of serious delinquency led to both the higher arrest rates and changes in juvenile court responses, after excluding simple assaults from the data, Lynch (2002) compared UCR violent crime arrest rates with NCVS violent victimization rates. Confirming arrest data findings, victim reports of youth violence decreased from the early 1980s to about 1988, increased sharply until 1994, and then decreased by 1998 (Lynch, 2002). Between 1980 and 1998, Blacks were overrepresented in both arrest and NCVS data. The overrepresentation decreased more for data collected from victims (NCVS) than from the police (UCR). The discrepancy may occur because, over time, unrelated to changes in actual violence, police more often arrested Black youth. Alternatively, simple assaults or property offenses, which Lynch did not study, may account for Black youths’ higher arrest rates relative to rates based on victim reports.
Each of the various sources of data cited above has limitations for determining whether shifts toward punitive sanctioning of juveniles have disproportionately impacted racial and ethnic minority youth. First, the UCR data generated from police department reporting reflect the most serious of multiple incidents and are not representative of all police departments, since some do not participate. Like other government data sources, statistics are rarely reported separately for Hispanics, leaving the degree to which youth of color are overrepresented in the system underreported (National Council on Crime and Delinquency, 2007). Second, although Monitoring the Future data can be used to determine trends in youth participation in delinquent behavior and drug use, it does not include information on youth contact with the justice system. Also, because it is a school-based sample, it likely cannot be generalized to the most seriously troubled youth. It may be that the most delinquent youth are not in school, and racial/ethnic differences in delinquency among school dropouts may explain Black youths’ high arrest and court case rates. Finally, the NCVS is of a representative sample of the population aged 12 and over who are asked to report on victimization experience. Although the NCVS yields an indicator of juvenile violence that is unaffected by police response or by victim reporting, it relies on victim perception of the racial/ethnic group of offenders. Although study participants either know or estimate the characteristics of violent offenders, they rarely know the age, sex, or race of property offenders.
The Current Study
Our individual-level study of youths’ justice system penetration complements prior research that examined changes in aggregate arrest and court contact rates alongside statistics indicating either victim-reported rates of youth violence and/or youth self-reported delinquency. These prior comparisons revealed a general trend toward more punitive treatment of youth in the juvenile justice system between 1980 and 2000, especially for Black youth, despite decreasing illegal activity. However, no study to date has assessed trends in youth likelihood of arrest and court involvement controlling for delinquency using nationally representative, individual-level data. We hope to shed additional light on trends in the sanctioning of youth with the analysis of nationally representative data that include detailed information on the connection of youth demographics with justice system contact and court processing, net of the effects of self-reported delinquent behavior.
To determine whether racial or ethnic minority youth have been disproportionately affected by the trend toward more punitive treatment of youth in the justice system, we compare boys’ probabilities of arrest and justice system penetration for two years (1980 and 2000), one before and the other after major transformations in U.S. justice policies. We study boys separately from girls because different offenses bring them into conflict with the law (Steffensmeier, Schwartz, Zhong, & Ackerman, 2005), and each gender group may experience unique gender-related responses by the justice system (Andersen, Morash, & Chesney-Lind, 2011). The present research assesses whether any differences in justice system penetration for 1980 and 2000 are equivalent for males who are and who are not Black or Hispanic.
The present study uses an alternative to examining studies of changes in youths’ behavior (measured with the NCVS or self-report) alongside population-based rates of arrest and juvenile court contact. It addresses three questions with one individual-level data set. Do boys’ likelihoods of being charged with an offense and three types of court involvement (diversion, conviction, and correctional placement) differ for 1980 and 2000, net of the effects of age and self-reports of delinquency? For both years, are probabilities of justice system interventions affected by being Black or Hispanic? Are any 1980–2000 differences in these probabilities greater for Black and Hispanic boys than for boys in other demographic groups?
Method
Data are from two cohorts of the National Longitudinal Surveys: youth interviewed in the 1980 wave of the National Longitudinal Survey of Youth 1979 (NLSY79) and the 2000 wave of the NLSY97. The NLSY79 and NLSY97 use a multistage stratified random sample design. These data are particularly suited to the research questions because they are nationally representative surveys that were designed to support cross-cohort research and because they include a number of measures necessary to address our specific research questions. Both have a similar questionnaire design, a sample based on birth year using similar sampling methods, and an oversampling of Black and Hispanic youth to allow for reliable statistical analysis for these subgroups. 1
The NLSY79 and NLSY97 were launched to enable researchers to examine the life-course experiences of representative samples of men and women born in the United States. Although the main purpose of the surveys is to examine youth transitions from school into the labor market, the NLSY also collects extensive information on youths’ personal characteristics, background, educational experiences, and risky and delinquent behaviors. In the field of criminology, the NLSY has been used recently to examine self-control theory (Hay & Forrest, 2008), parental assistance to offending offspring (Siennick, 2011), the relationship between gang membership and drug use (Bjerregaard, 2010), and the effects of dropping out of school (Sweeten, Bushway, & Paternoster, 2009) and youth employment (Apel et al., 2007) on delinquency. Recently, the NLSY79 and NLSY97 samples have been pooled to compare patterns of self-employment (Abe, Betesh, & Datta, 2010), earnings (Castex & Dechter, 2012), and labor union membership (Booth, Budd, & Munday, 2010) between the two cohorts.
The NLSY79 and NLSY97 include sampling weights which account for the biases created by oversampling, probability of selection into the original sample, and nonrandom attrition. After weighting, each sample is representative of its own target population. The NLSY79 sample is representative of the U.S. population born from 1957 to 1964. The initial 1979 data collection wave included 12,686 youth aged 14–22 as of December 31, 1978. Although youth were interviewed annually, they were only asked about delinquent behavior and justice system contact in 1980. Thus, we analyzed data collected that year, when 12,141 youth (95.7% from the original sample) participated. After weighting, the NLSY97 sample is representative of the U.S. population born between 1980 and 1984. The initial wave of respondents included 8,984 youth aged 12–16 on December 31, 1996. We selected the 2000 wave for analyses because its participants had the closest match to ages of the 1980 youth. The 2000 wave of the NLSY97 included 8,080 youth (89.9%) from the original sample.
Not all respondents to the NLSY were included in our analyses. First, we restricted our analyses to boys. We were unable to test our hypotheses on girls due to a zero-cell count problem; no Hispanic girls in 1980 reported being sentenced to a correctional institution. Second, we limited our analyses to youths aged 15–18. Given our interest in juveniles and because the survey elicits information about the previous year’s experiences, it seemed appropriate to limit our analyses to respondents who had been under the jurisdiction of the juvenile court. Third, respondents missing information on the outcome variables indicating criminal justice contact were dropped from the analyses. This was a relatively small number of cases (roughly 0.01% of the eligible sample). 2 Thus, the final sample consisted of 5,175 boys.
Measures
There are four outcomes of interest in this research. The outcomes of interest were whether boys had been (1) charged with a crime, (2) diverted from the court into counseling or programming, (3) convicted of a crime, or (4) placed in a correctional facility. The decision-making research also demonstrates the importance of studying multiple decision points. In a phenomenon known as cumulative disadvantage or bias amplification, having prior arrests and sanctions increases the likelihood of subsequent formal sanctioning (Bishop & Frazier, 1996; Dannefer & Schutt, 1982; Farrell & Swigert, 1978; Liska & Tausig, 1979; O’Neill, 2002; Rodriguez, 2010; Zatz, 1984). Thus, bias (and its product, overrepresentation) often accumulates and becomes more pronounced as minorities move deeper into the juvenile justice system (Bishop, 2005).
In the NLSY, youth were asked if they had ever been booked or charged by either the police or someone connected to the courts for a crime other than a minor traffic offense. Being charged was a dichotomous variable (for all dichotomous variables, 1 = yes, 0 = no). In 1980, all youth were asked if they had ever been referred to court-related counseling or a diversion program. In 2000, this question was only asked of youth who reported that they had either been charged with a crime but not sent to court or had been sent to court but not convicted. After restriction of the 1980 question to match that of the 2000 universe, a dichotomous variable indicated whether youth were diverted. The NLSY refers to a court finding of delinquency as a conviction. A dichotomous variable reflected whether a youth reported ever having a conviction or pleading guilty for anything other than a minor traffic offense. The final court-related dichotomous variable captured convicted youths’ responses to a question about whether they had ever been sentenced to spend time in a correctional institution or a youth institution.
Boys interviewed in the NLSY79 self-reported their lifetime experience with the justice system in 1980. Boys interviewed in the NLSY97 self-reported their experiences each year from 1997 through 2000; the combined reports indicated their lifetime experiences. Since some youth are waived out of juvenile court and are tried as adults, and because the age of juvenile jurisdiction varies by state, we included information that study participants gave about adult as well as juvenile courts in the outcome variables.
Self-reported delinquency was an index, which we centered on its grand mean, consisting of the number of times youth destroyed property, stole anything, attacked someone, or sold drugs in the last 12 months. Since delinquency in one year is strongly correlated with delinquency in another (Herrenkohl et al., 2000; Jolliffe et al., 2003; Kosterman, Graham, Hawkins, Catalano, & Herrenkohl, 2001; Park, Morash, & Andersen, 2010), the self-report for 12 months was considered to reflect prior delinquent involvement. For 1980, possible responses to the questions capturing participation in delinquent activities were 0, 1, 2, 3–5, 6–10, 11–50, and more than 50 times. For 2000, we collapsed the NLSY97 responses (the actual number of times) into ranges to match those of NLSY79 and coded each range at its midpoint value, censored at 50 or more times.
The 1980 and 2000 interviews differed in how they qualified the questions that tapped two offenses, attacks on other people and drug sales. In 1980, youth were asked if they had attacked someone with the idea of seriously hurting or killing them. In 2000, youth were asked if they had attacked someone with the idea of seriously hurting them or had a situation end up in a serious fight or assault of some kind. The 1980 wording may capture only the most serious attacks. This would mean that the observed decrease in the prevalence of youths reporting attacking someone from 1980 to 2000 (described below) is a conservative estimate of the actual decrease in attacking behavior. If youths included more minor offenses in 2000, the different wording also may explain the finding of no significant decrease in a comparison of 1980 and 2000 in the incidence of youth attacking someone in the year since the date of the last interview.
In 1980, youth were asked if they had sold marijuana, hashish, or hard drugs. In 2000, they were asked whether they had sold or helped to sell marijuana, hashish, or other hard drugs, which may overestimate drug-selling activity in 2000. The observed decrease in the proportion of youth selling drugs in 2000 may be a conservative estimate of the actual decrease and may explain the observation of no decrease in the number of times youth reported selling drugs.
The coding of the remaining variables was straightforward. Interview year was a dichotomous variable (1 = NLSY97 2000 interview, 0 = NLSY79 1980 interview). Age was the youth’s age at the time of the interview (centered on its grand mean). The NLSY questions about race (e.g., Black, White) are distinct from questions about whether youth are Hispanic or not. Consistent with our interest in Black and Hispanic youth, racial/ethnic group was coded as Black, Hispanic, or White (the omitted category in analysis). 3
Statistical Analyses
All analyses were conducted with weighted data in the software SAS, which has the capacity to generate accurate parameter estimates, standard errors, and tests of significance for complex sample designs. 4 We corrected for the stratified and clustered nature of the NLSY sample by adjusting standard errors for design effects using the Taylor series linearization method (Binder, 1983; Wolter, 2007; Woodruff, 1971). The Taylor series linearization method is a well-established technique for generating unbiased standard errors for complex statistics from sample surveys with cluster-correlated data. Failing to account for the design effects of complex sample surveys generally results in underestimation of the true standard errors and leads to test statistics with inflated Type I errors.
To estimate the effects of predictor variables on contacts with the justice system, we fitted survey-weighted logit models. For decisions points after being charged, this type of analysis was chosen after examination of the possibility of sample selection biases using probit with sample selection modeling. For each dependent variable, the correlation between the error terms in the sample selection and estimation equations was not statistically different from zero, reflecting an absence of selection bias.
Our strategy for each outcome variable was to begin with a model regressing contact with the criminal justice system on interview year, age (grand mean centered), racial/ethnic group, and self-reported delinquency (grand mean centered; Models 1 of Tables 2–4). 5 For each outcome variable, the Chow test analog (Allison, 1999) for logistic regression was used to examine whether the regressor effects significantly differed for each survey cohort (1980 vs. 2000). In each case, the chi-square test statistic was statistically significant, indicating that the effects of the regressors differ for 1980 and 2000 youth. To examine variable-specific interaction effects, we next added the cross products of survey cohort with age, racial/ethnic group, and delinquency to test whether the effect of passage of time (i.e., 1980 vs. 2000) depended on demographic characteristics or delinquency. Logistic regression models for each outcome variable allowing survey cohort to interact with youth characteristics and delinquency in their effects on contact with the criminal justice system are shown in Models 2 of Tables 2 and 4. Results revealing no significant interaction effects are not shown but are available on request.
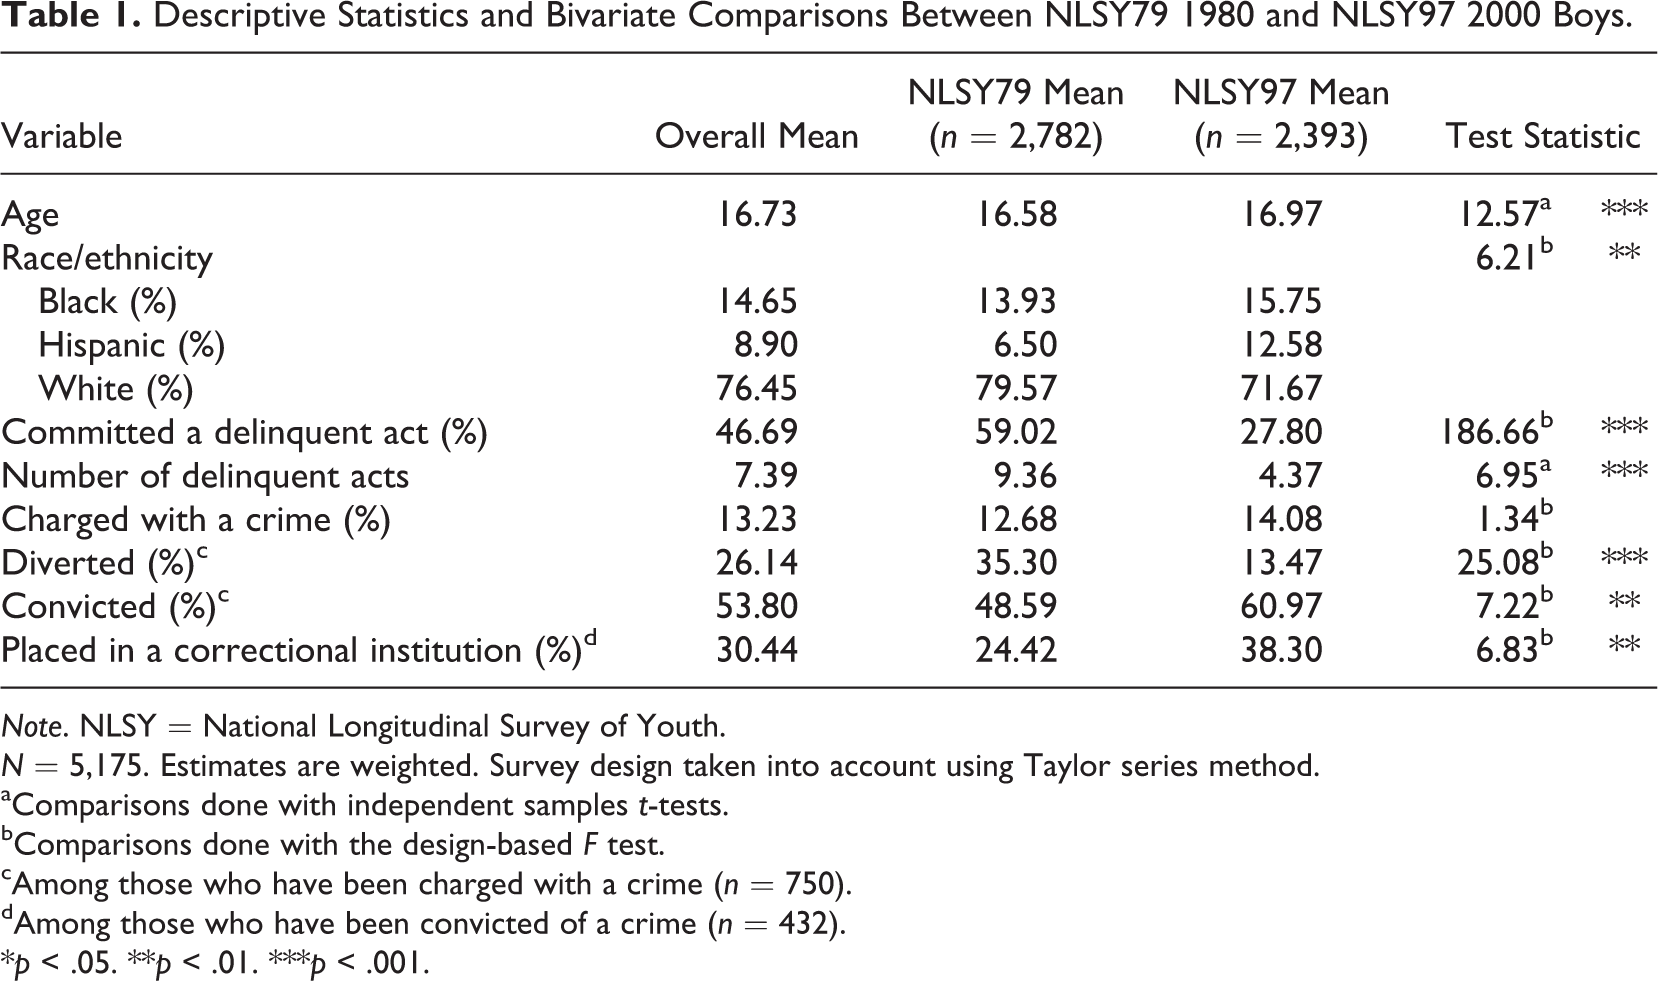
Descriptive Statistics and Bivariate Comparisons Between NLSY79 1980 and NLSY97 2000 Boys.
Note. NLSY = National Longitudinal Survey of Youth.
N = 5,175. Estimates are weighted. Survey design taken into account using Taylor series method.
aComparisons done with independent samples t-tests. bComparisons done with the design-based F test. cAmong those who have been charged with a crime (n = 750). dAmong those who have been convicted of a crime (n = 432).
*p < .05. **p < .01. ***p < .001.
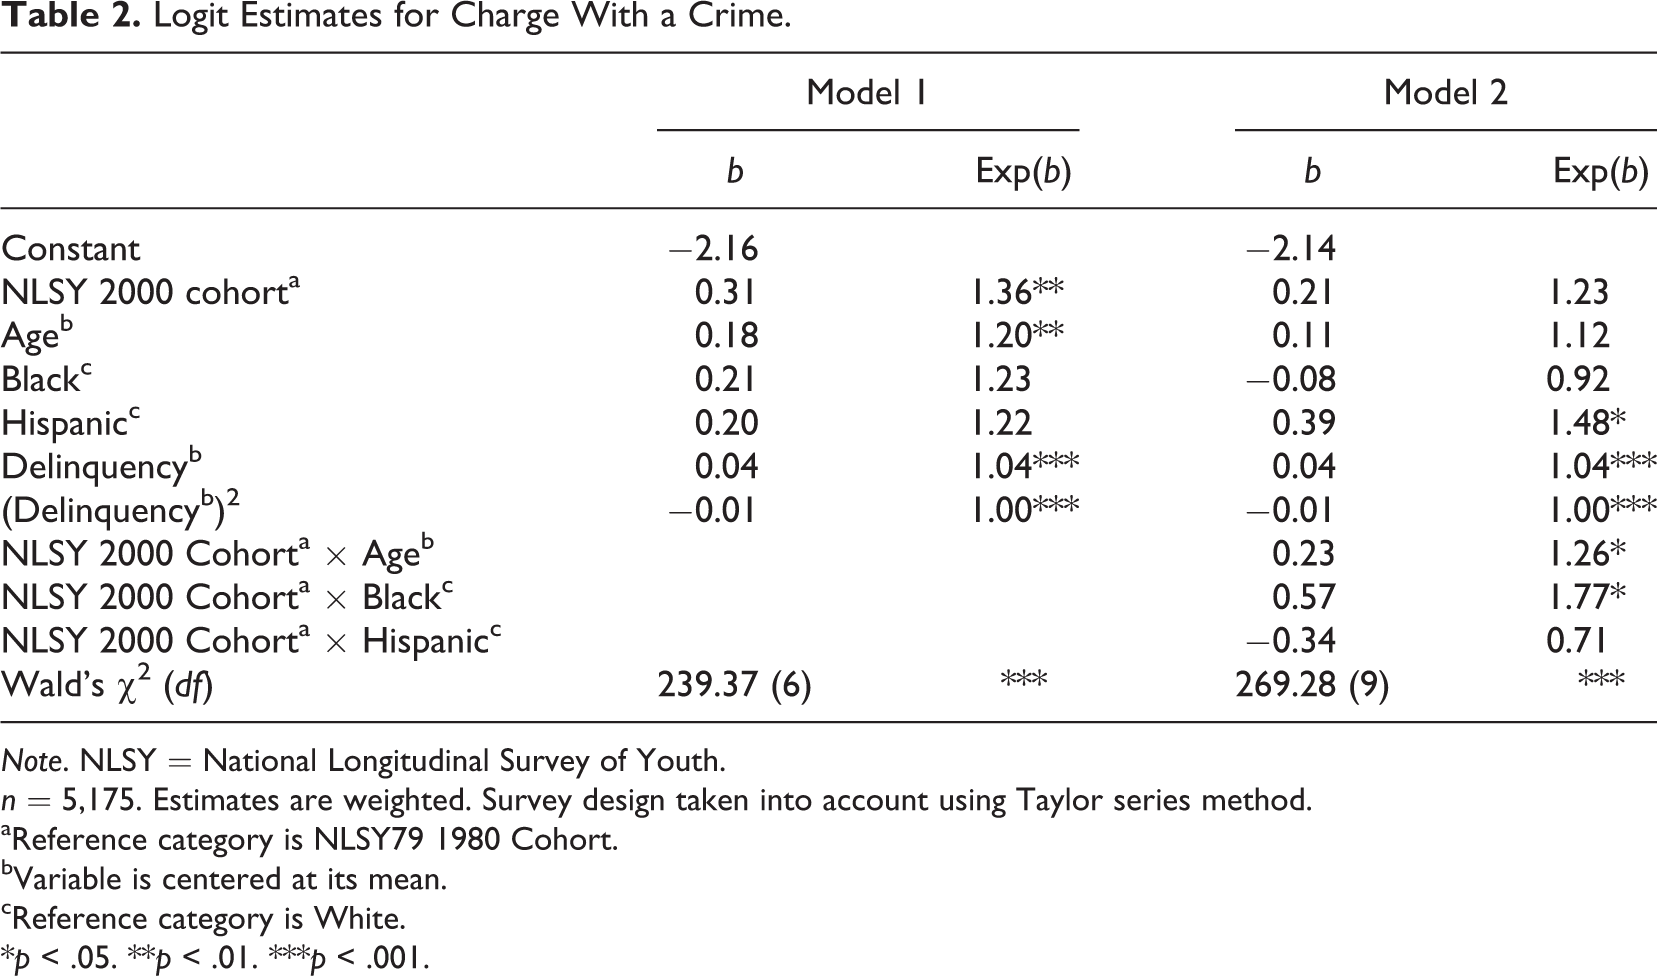
Logit Estimates for Charge With a Crime.
Note. NLSY = National Longitudinal Survey of Youth.
n = 5,175. Estimates are weighted. Survey design taken into account using Taylor series method.
aReference category is NLSY79 1980 Cohort. bVariable is centered at its mean. cReference category is White.
*p < .05. **p < .01. ***p < .001.
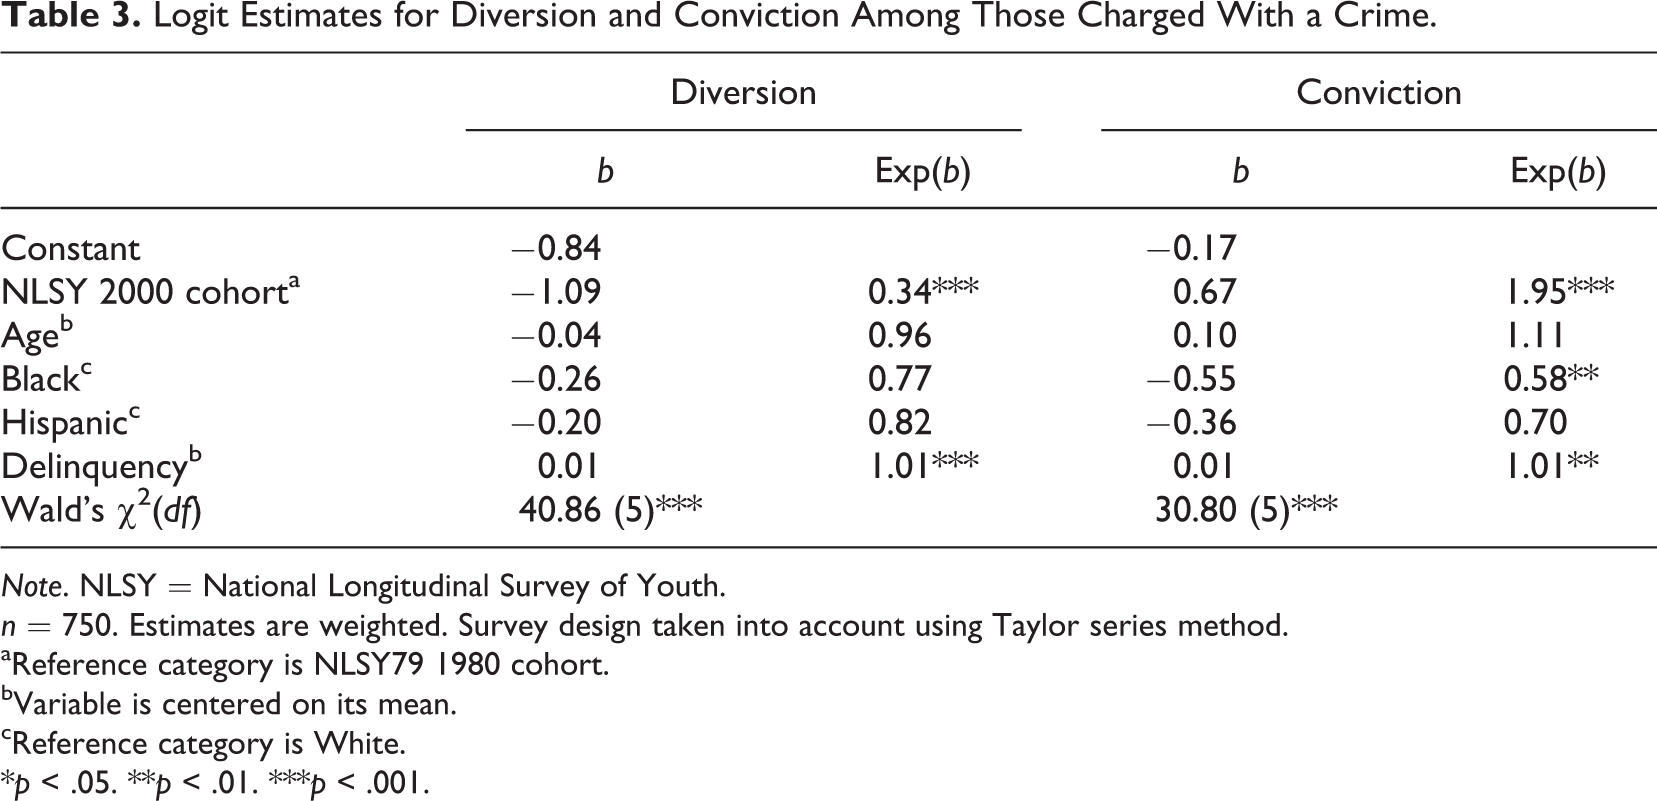
Logit Estimates for Diversion and Conviction Among Those Charged With a Crime.
Note. NLSY = National Longitudinal Survey of Youth.
n = 750. Estimates are weighted. Survey design taken into account using Taylor series method.
aReference category is NLSY79 1980 cohort. bVariable is centered on its mean. cReference category is White.
*p < .05. **p < .01. ***p < .001.
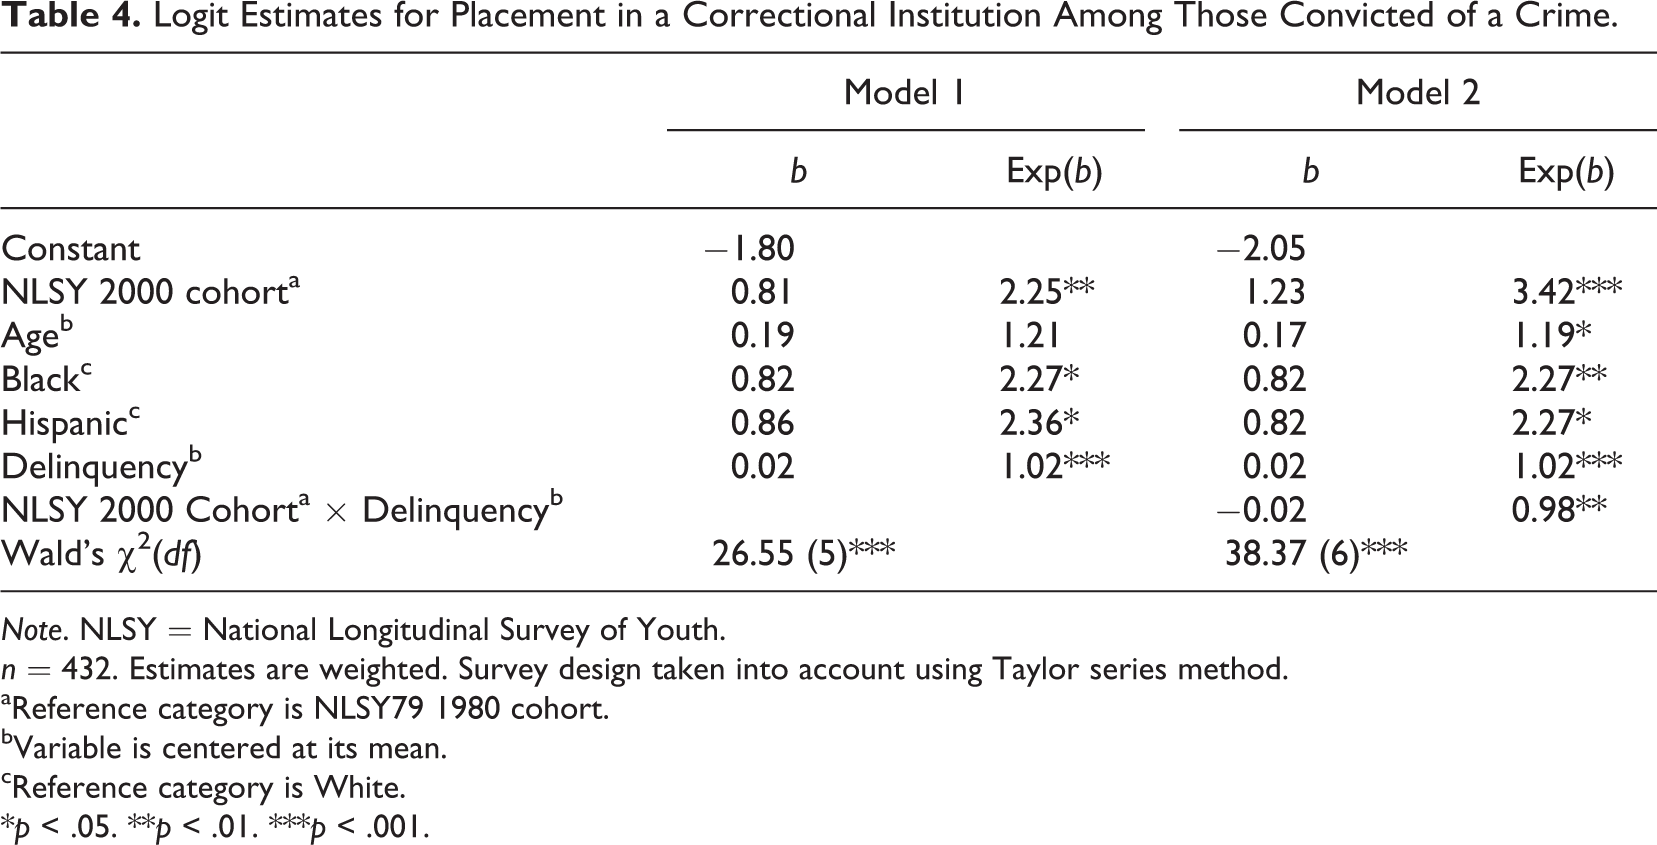
Logit Estimates for Placement in a Correctional Institution Among Those Convicted of a Crime.
Note. NLSY = National Longitudinal Survey of Youth.
n = 432. Estimates are weighted. Survey design taken into account using Taylor series method.
aReference category is NLSY79 1980 cohort. bVariable is centered at its mean. cReference category is White.
*p < .05. **p < .01. ***p < .001.
Results
The first column of Table 1 presents descriptive information for all variables in the analysis. The boys were on average 17 years old. Approximately 15% of the boys were Black, 9% were Hispanic, and the remaining 76% were White. Participation in delinquent behavior was not an unusual event. Nearly one half of the boys in the sample reported that they had committed at least one delinquent act in the one-year period since the prior interview, and, on average, boys reported committing seven delinquent acts in the last year. Slightly more than one in eight boys (13.23%) reported being charged with a crime in their lifetime. Of those charged, about one quarter (26.14%) were diverted into precourt programming or counseling, and slightly more than half (53.80%) reported a conviction. Of the convicted boys, almost one third (30.44%) said they were placed in a correctional facility.
There were several statistically significant differences between the 1980 and 2000 boys (Table 1, columns 2, 3, and 4). The 2000 boys were slightly older than those interviewed in 1980 (16.99 compared to 16.58 years, respectively). The 2000 group included a greater proportion of Black and Hispanic boys than the 1980 group. The racial distributions are consistent with U.S. Census population estimates, which document the increasing proportion of the Black and Hispanic population in the United States (U.S. Census Bureau, 1996, 2004). Overall, less than half as many boys in 2000 as in 1980 reported that they had committed any delinquent acts in the past year. Approximately 28% of boys in 2000 reported committed at least one delinquent act, compared to approximately 59% of those in 1980. Similarly, the 2000 boys reported committing approximately half as many delinquent acts as those in 1980 (4.37 acts compared to 9.37 acts, respectively). There were also several significant differences in lifetime contact with the justice system for 1980 and 2000. Although there were no significant differences in the proportions of boys charged with a crime, compared to 1980 boys, once charged the 2000 boys were much less likely to experience diversion into precourt programming or counseling (13.47% compared to 35.30%, respectively) and much more likely to experience conviction (60.97% compared to 48.59%, respectively). The 2000 boys with convictions were also much more likely than their 1980 counterparts to report that they had been placed in a correctional facility (38.30% compared to 24.42%, respectively).
Multivariate Analysis
Table 2 shows the effects of the model parameters on likelihood of a criminal charge. Model 1 includes only survey cohort, demographic characteristics, and delinquency. Model 2 adds the cross products of survey cohort with age, racial/ethnic group, and delinquency to discern whether the effect of passage of time (1980 vs. 2000) depends on youth characteristics. Compared to the 1980 boys, boys in 2000 were significantly more likely to report being charged with a crime regardless of their self-reported delinquency (Table 2, Model 1). Net of self-reported delinquency, boys in 2000 had odds of being charged with a crime that were 36% (100[exp(0.31) − 1]) higher than their 1980 counterparts. Although not the focus of the present study, youth likelihood of having been charged with a crime also significantly increased with age and the number of delinquent acts. Interestingly, we found that the relationship between self-reported delinquency and the log odds of charge was nonlinear. What this implies is that delinquent behavior increases the log odds of charge, but at a decreasing rate the more delinquent behavior reported. The significant interaction effects in Model 2 of Table 2 show that the effects of survey cohort depend on age and racial/ethnic group. In particular, the positive effect of being in the 2000 group was magnified as age increased. For Black boys of average age, belonging to the 2000 survey cohort raised the odds of having been charged with a crime by 118%. For Hispanic boys of average age, belonging to the 2000 survey cohort lowered the odds of charge by approximately 12% (100[exp(0.21 − 0.34) − 1]).
To illustrate the interaction effects of year with race and ethnicity, we calculated estimated predicted probabilities for having been charged with a crime by substituting the logit coefficients (β) in Table 2 and individual characteristics (xi
) into the following equation:
where β k is the estimated coefficient for xk . We calculated the predicted probabilities using the sample mean value of age (16.75 years). Having calculated the probabilities for Black, Hispanic, and White boys of varying levels of delinquent behavior, we then determined differences in the probabilities of having been charged with a crime across interview years. The outcomes of this analysis are presented in Figure 1, a graph of the probability of having been charged with a crime at each level of delinquent behavior (from two standard deviations [SDs] below the mean to two SDs above the mean) by race and ethnicity and interview year.

Predicted probabilities of having been charged with a crime in any court (calculated using the sample mean value of age).
Regardless of racial/ethnic group, boys in 2000 had a higher probability of a charge than boys in 1980. This is shown by gray lines (representing boys in 2000) being higher than the black lines (representing boys in 1980). In 2000, Black boys had the highest probability of being charged with a crime, regardless of self-reported offending. In 1980, Black boys had the lowest probability of a charge at nearly all levels of self-reported delinquency. These findings contrast sharply with the situation for Hispanic and White youth. Although belonging to the 2000 survey cohort significantly decreased Hispanic boys’ probability of charge, substantively, this difference was very small. For White youth, the effect of belonging to the 2000 survey cohort was nonsignificant.
Table 3 presents the results of logistic regression of diversion and conviction on survey cohort, age, racial/ethnic group, and delinquency for boys who have been charged with a crime. For both outcome variables, there were no significant interaction effects between year and age, racial/ethnic group, or delinquency. Thus, the effects of year (1980 vs. 2000) on likelihoods of both diversion and conviction did not depend on age, racial/ethnic group, or delinquency.
Both interview year and self-reported delinquency were significantly related to boys’ probabilities of diversion and conviction. Boys in 2000 had an approximately 209% lower odds of diversion (100[exp(−1.09) − 1]) and a 95% (100[exp(0.67) − 1]) greater odds of conviction than those in 1980. In addition, as self-reported delinquency increased, the likelihoods of diversion and conviction increased. Racial/ethnic group was not significantly related to boys’ likelihood of diversion. However, once charged with a crime, compared to White boys, Black boys had an estimated 42% (100[exp(−0.55) − 1]) lower odds of conviction. Controlling for survey year, racial/ethnic group, and delinquent behavior, age was not related to boys’ likelihoods of diversion or conviction.
Table 4 presents the logit estimates for the regression of placement in a correctional institution for boys with conviction histories. In Model 1, survey cohort, racial/ethnic group, and self-reported delinquency were significant predictors of placement. Regardless of self-reported delinquency, boys in 2000 had a greater odds of placement in a correctional institution than their 1980 counterparts. Black and Hispanic boys were also more likely than others to have been placed in a correctional institution. Boys’ likelihood of placement also increased, as their self-reported delinquency increased. However, the significant interaction effect in Model 2 indicates that the effect of survey year depends on boys’ self-reported delinquency.
An examination of the graphed estimated predicted probabilities for correctional institution placement (Figure 2) for the different racial groups and levels of delinquency suggests that for each racial/ethnic group, boys in 2000 had a higher odds of placement in a correctional institution than those in 1980. Specifically, boys of average delinquency in 2000 had 242% greater odds of placement in a correctional institution than their 1980 counterparts. Additionally, for each survey cohort, Black and Hispanic boys were more likely to be placed in a correctional institution than White boys, regardless of whether they self-reported low, medium, or high involvement in delinquency. Finally, the significant interaction between survey cohort and delinquency suggests that the effect of belonging to the 2000 cohort is exacerbated, as boys report increasing delinquent behavior. This is illustrated in Figure 2 by the gaps between probabilities of placement in 2000 versus 1980 increasing for each racial/ethnic group as self-reported delinquency increases.
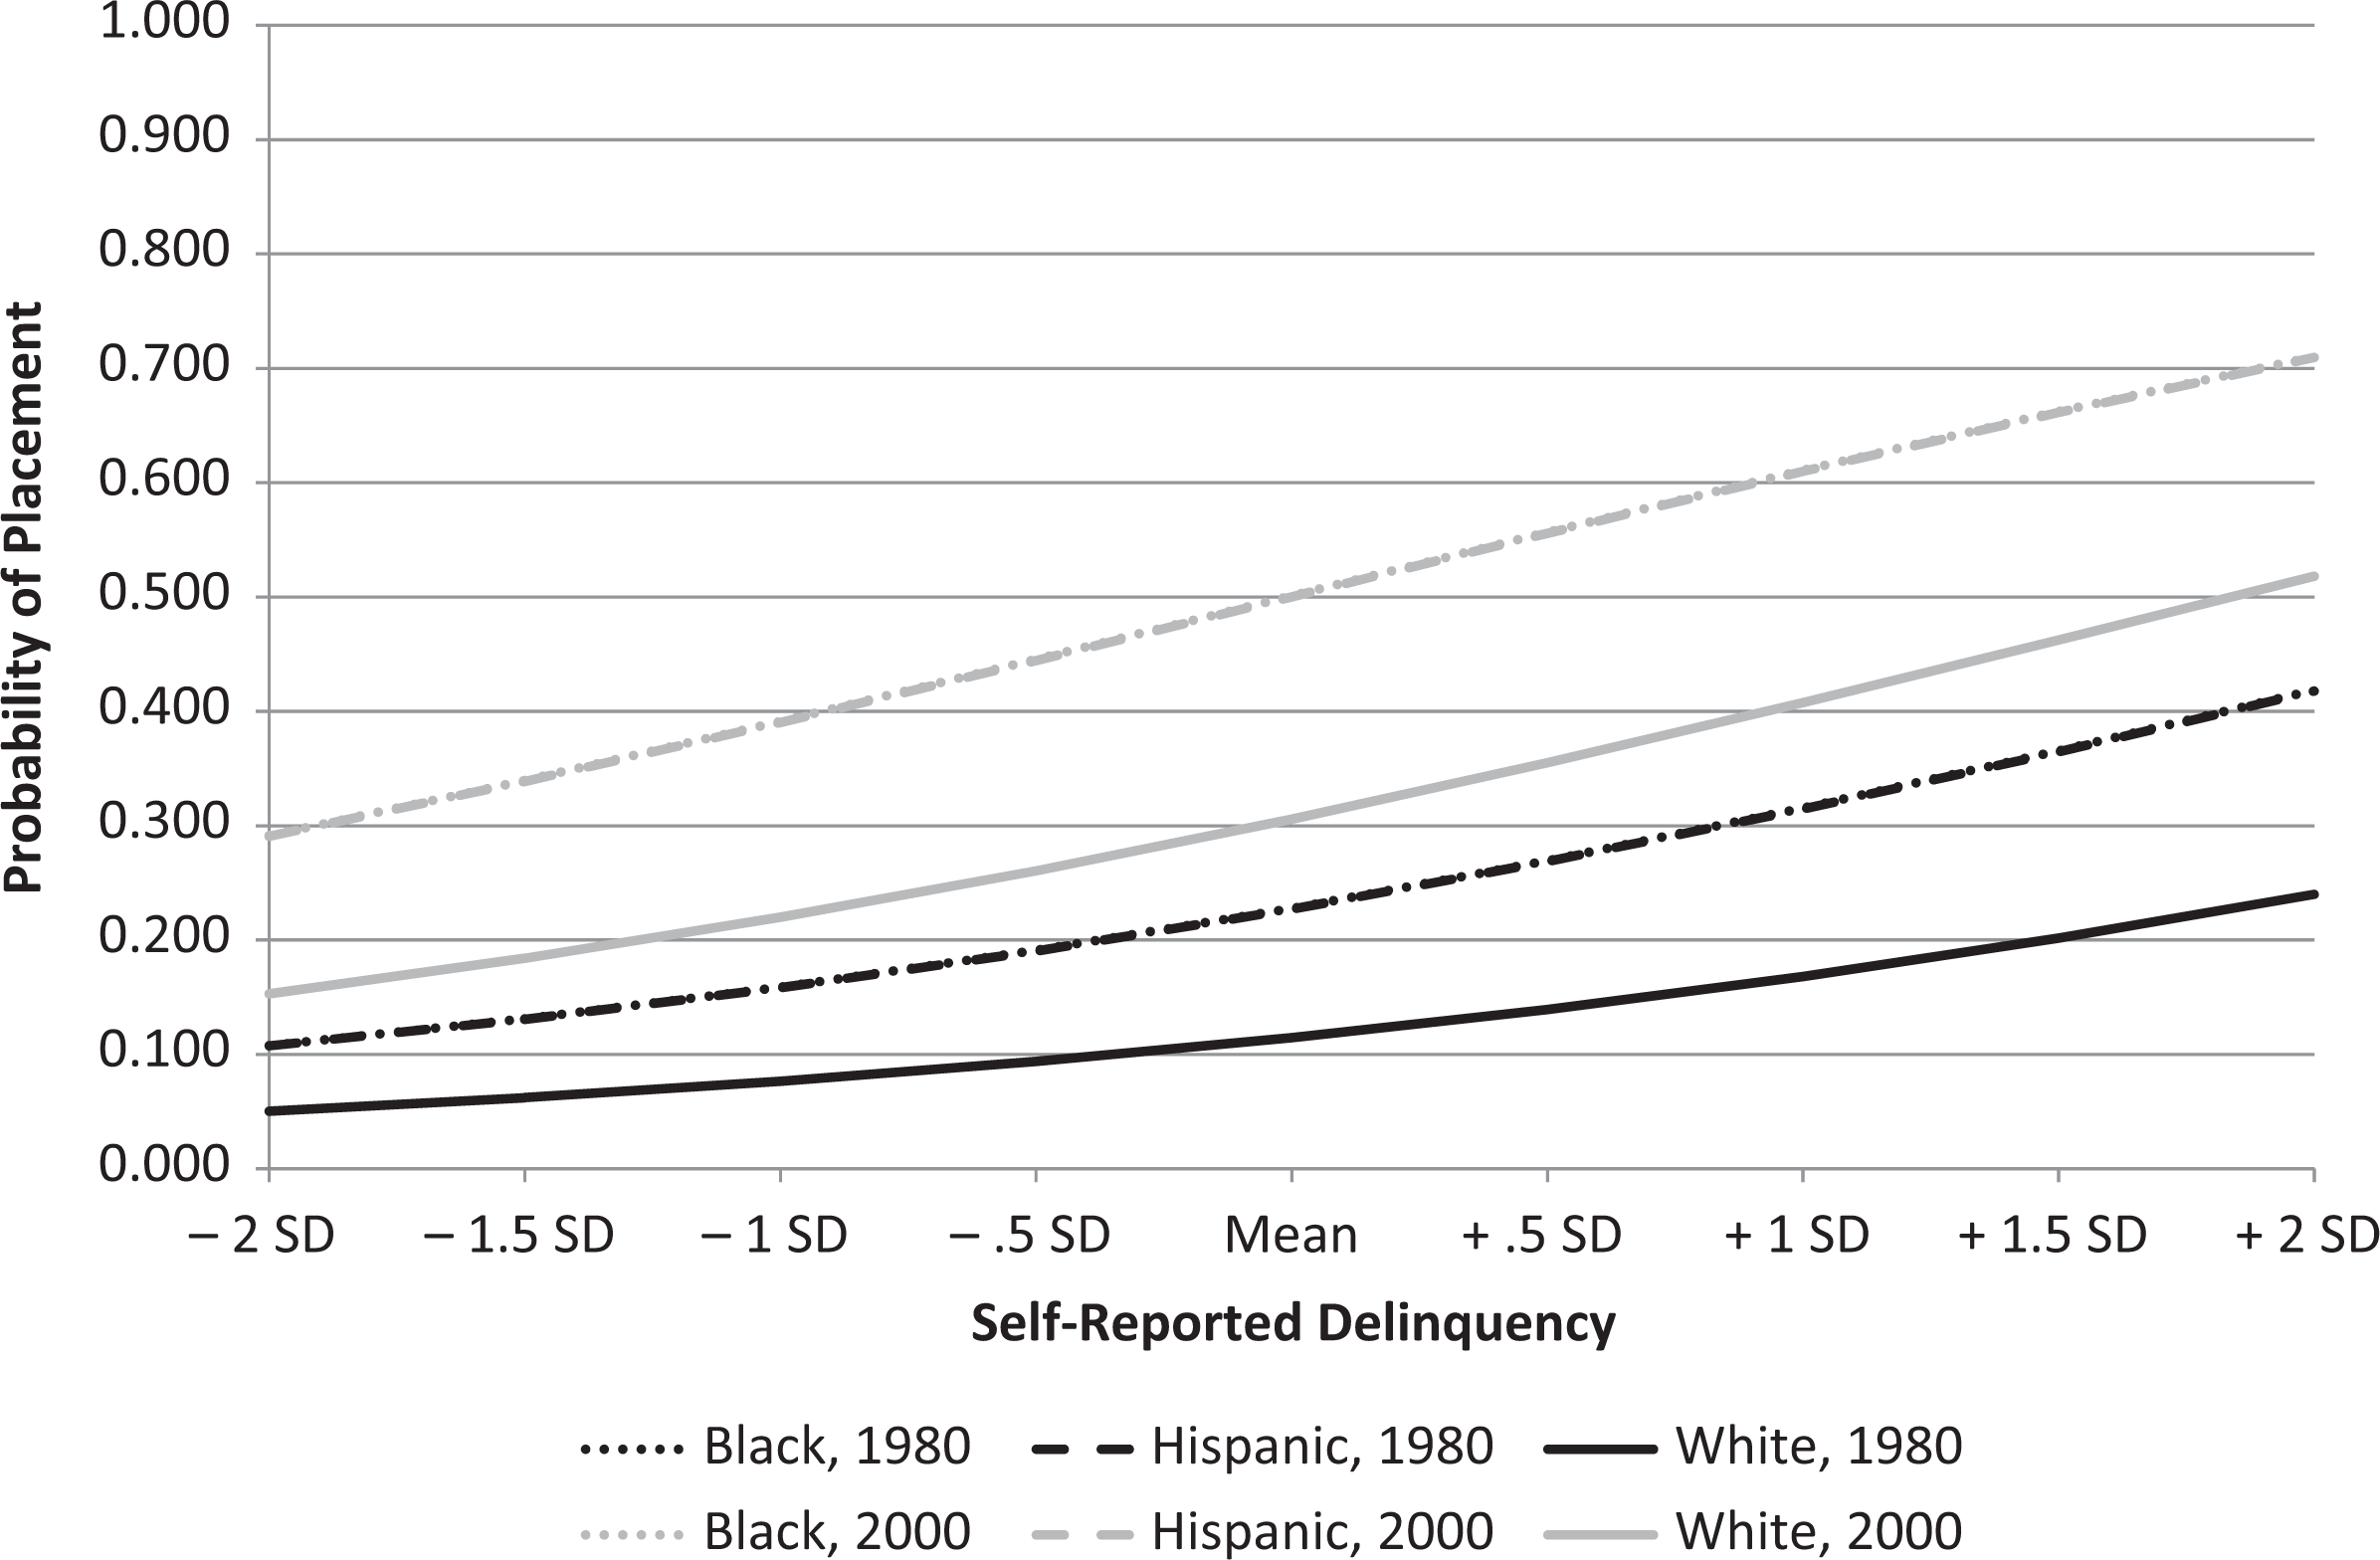
Predicted probabilities of placement in any institution (calculated using the sample mean value of age).
Comments on the Data
Although the NLSY was not primarily designed for research on delinquency, crime, or the justice system, the inclusion of items on these topics across two cohorts created a unique and valuable data set for the field of criminology. Ideally, available data would have provided multiple years of self-reported delinquency not just for the 1997 cohort, but also for the 1979 cohort, an official source of data on justice system contact as well as the self-report, and exactly the same interview questions for the two cohorts.
It is possible that the 2000 youth self-reported more lifetime court contact because they were asked about this each year, whereas the 1980 youth were asked about their lifetime contact just in 1980. If this were the case, we would expect that self-reported delinquency would be greater in 2000 than in 1980. However, we found substantially lower self-reports of delinquency in 1980, which gives us some confidence that the different constructions of measures of self-reported justice system contact did not severely distort the data.
Serendipitously, as noted in the description of variables, the change in question wording provided conservative evidence of decreased delinquency in 2000. This increased our confidence that higher levels of delinquency in 2000 did not account for the increased justice system involvement. The one-year (1980) measure of self-reported delinquency gave us a less reliable indicator of past delinquency than would a multiyear measure. Despite these drawbacks, after weighing the deficits against the positive features of the NLSY—the large representative sample, adequate numbers of Black and Hispanic youth, repeat of nearly the same questions in 1980 and 2000, and data on both delinquent activity and justice system contact—we concluded that the data analysis could make a meaningful contribution to the literature. The consistency of our findings with results of above-reviewed comparisons of various rates and self-reports lends some credence to the validity of our findings.
Concerns about the validity of self-report delinquency data for comparisons of demographic groups pose another challenge to data quality. Early research (Hindelang, Hirschi, & Weis, 1981; Huizinga & Elliot, 1986) found that Black males less often self-reported their delinquent acts than did other youth. For a group reaching late adolescence in 1993, Jolliffe et al. (2003) found the opposite, that Black youth made the most accurate self-reports, and more importantly, all males self-reported the vast majority of their known offenses. These findings have suggested that although some caution is warranted in comparing across groups, there is a reason to assume a reasonable level of validity in these measures.
Summary and Discussion
Bivariate analysis of individual-level NLSY data revealed that although boys self-reported less delinquent behavior in 2000 than in 1980, the proportion charged remained the same, and those charged were less likely to be diverted and more likely to be convicted. Judges did not stem the influx of boys into the system. In fact, they were much more likely to send convicted boys to correctional placement in 2000 than in 1980. If the probability of placement had been less in 2000 than 1980, we might have concluded that judges at least partly counteracted earlier stage increases in justice system involvement.
The multivariate analyses revealed the clearest race-related changes for youth at the stage of being charged with an offense, when arrests and other means (e.g., parent complaint, school referrals) bring youth to court. Consideration of interaction effects clarified that the change from 1980 to 2000 in increased probability of a charge was most dramatic for Black boys. Being able to control for a measure of self-reported delinquency that reflected a fairly wide range of delinquent acts adds weight to the conclusion that among boys, those who are Black have most been affected by increased severity in justice system responses.
Regardless of racial–ethnic group, 2000 youth were less often diverted into precourt counseling and programming and were more often convicted. Being Black also was significantly predictive of lowered likelihoods of conviction. Dannefer and Schutt (1982; see also Rodriguez, 2007, 2010) found less evidence of racial bias in court disposition decision (dismissal, incarceration, or other sanction) than the arrest decision. They additionally discovered that in urban areas, Black youth received more favorable court dispositions than White youth, suggesting that in some locales, judges may attempt to undo biases at the police level. In our research and in the other cited studies, evidence for conviction may be less sufficient for Black boys before the court, or judges may try to counteract the influx of Black youth into the courts. Context-specific research is needed to sort out occasional findings of this apparent break in a pattern of harsher treatment of Black youth.
Similarly, the 1980–2000 multivariate comparisons showed dramatic differences in the probability of convicted boys being placed in a correctional facility. The cumulative effects of racial/ethnic minority status and time period on youths’ increased likelihoods of placement in a correctional institution meant that ultimately, despite Black youths’ lower likelihoods of conviction once charged with a crime, racial/ethnic minority boys in 2000 were more likely to make it into correctional placements, holding delinquency constant. This was especially the case for boys reporting relatively low levels of delinquent activity.
Feld (1999b) identified the 1990s as the culmination of a lengthy period when there was a politicalization of justice policies and a resulting crackdown on crime. After Reagan assumed the U.S. presidency in 1981, federal, state, and local policy makers waged a war on crime, and more specifically a war on drugs (Hagan, 2010). Scholars view these “wars” as a key cause young Black males inundating the justice system (e.g., Chambliss, 1995; Mauer, 1990; Tonry, 1994). For juveniles, a peak in gun violence in the late 1980s and the early 1990s intensified the shift toward formal intervention and punishment that disproportionately fell on Black youth. The shift meant that justice system practices moved away from an emphasis on informal handling and rehabilitation, which decades before marked the initial separation of the juvenile court from courts for adults (Feld, 1999a).
In addition to justice system changes, between 1980 and 2000, some school jurisdictions instituted policies that increased student involvement with police and courts. In the 1990s, eligibility for selected federal funding programs required that schools adopt zero-tolerance policies for drug- and gang-related incidents. Over time, some schools widened the net of incident types and began to refer many youth to police for minor infractions previously handled by school personnel. Confirming this pattern, one study showed that at least between 1995 and 2004, for four of the five states considered, the percentage of court referrals originating in schools increased (Krezmien, Leone, Zablocki, & Wells, 2010).
The advocacy group, Advancement Project (2010; also Casella, 2001, 2003), produced several studies that identified numerous districts where contemporary schools refer disproportionately minority and disadvantaged youth to police, who arrest and send them on to courts. Nolan’s (2007, 2008, 2009) ethnographic research at an urban school serving disadvantaged, minority youth showed how this dynamic can work. The school augmented zero tolerance with high-tech security, heavy police presence, and a policing style intended to repress even the least serious school rules violations. A recurrent pattern of interaction resulted. Police approached youth they suspected of breaking the rules. They accused them of transgressions such as disorderly conduct, failing to produce identification, or various signs of disrespect. When youth became upset or tried to explain they had not broken any rules, police handcuffed them, took them into custody, transported them to the police station, and charged them with offenses like disorderly conduct or resisting arrest. Once this process began, even school officials who disapproved avoided intervening with what they now viewed as a “police matter.” Because police are most often present in schools attended by disadvantaged, minority youth (Hirschfield, 2008b; Kaufman et al., 1998), minority youth have the greatest likelihood of traveling the schoolhouse to jailhouse tract (Hirschfield, 2008a; Reynolds et al., 2006).
The schoolhouse to jailhouse track may contribute to increased charges that are concentrated on minority youth. Additionally, the National Council on Crime and Delinquency (2007, p. 6) pointed to several other possible causes of growing minority overrepresentation at the arrest stage: “police policies and practices (targeting patrols in certain low-income neighborhoods, policies requiring immediate release to biological parents, group arrest procedures); location of offenses (youth of color using or selling drugs on street corners, white youth using or selling drugs in homes);…differential reactions of victims to offenses committed by white and youth of color (whether white victims of crimes disproportionately perceive the offenders to be youth of color); or racial bias within the justice system.” There is a need for future research to document the dynamics and extent of the connection of specific policies in particular locations to increased charging of minority youth for illegal behavior.
The design of the research described previously precludes inference that any particular justice system or school policy accounts for the degree to which youth penetrate the juvenile justice system. However, the differing policy environments in 1980 and 2000 provide the context for examining police and court responses to juveniles. Our findings of race- and ethnic group–related changes in boys’ justice system penetration suggest the need for future research to link specific policies, as implemented in various jurisdictions, to alternative handling of youths’ deviance. They also point to the need for further study of negative and positive results of changes in intervention.
How specific policies and practices affect youths’ increased probabilities of justice system penetration is not only of historical interest. Nationally, juvenile arrest and court statistics document a persistent though somewhat varying amount of overrepresentation of Black males in the justice system between 1985 and 2007 (Puzzanchera, Adams, & Sickmund, 2010). Extending the period another year, Puzzanchera (2009) found that from 2004 to 2008 the racial disparity in arrests increased, reaching 5 to 1; during the period, the Black rate increased (24%) and the White rate declined (3%). The forces behind the NLSY findings for racial and ethnic group and being charged with a crime in 1980 and 2000, or perhaps other newly implemented policies, apparently continue to drive up especially Black youths’ penetration of the justice system. If differences between those with families varying in origins (e.g., Mexico, Spain) were taken into account, some Hispanic subgroups in some parts of the United States may stand out as having even higher probabilities of being drawn into the justice system than we have shown.
It is fundamentally unjust to arrest youth who are less delinquent than others at a higher rate and move them through a system that in many locales focuses more on punishment than on rehabilitation. The injustice is intertwined with bias due to race and ethnicity when Black and Hispanic youth are most caught up in this trend.
Some evidence suggests that increased entry into and movement through the justice system causes collateral damage. Arrest, conviction, and placement may reduce youths’ legitimate opportunities (Sampson & Laub, 1997). For instance, Hirschfield (2009) described several studies preceding and supporting his own research findings that in Chicago, arrest contributed to high school dropout, which subsequently decreased labor market success. Justice system involvement often exposes youth to other youth who are alienated from school and who are prone to illegal activity at the same time that it separates them from youth who avoid lawbreaking (Hjalmarsson, 2008). Further demonstrating collateral damages, Rios’s (2009) qualitative study documented how policing, probation, and incarceration shaped Black and Latino young men’s masculinities toward hypermasculinity, which involved the use of force and domination over others, and thereby limited the men’s already compromised futures.
A second sort of collateral damage is production of views of the justice system as unjust and its agents as delegitimized. Recognizing that perceptions of the justice system develop early and often persist through adulthood, Hagan, Shedd, and Payne (2005) examined the connection of police contact to adolescents’ perceptions of injustice. Youth with the most police contact (African Americans and Latinos in their study) tended to have the most negative views of the justice system. In a similar example, Chambliss’ (1999) observed that the intense surveillance of Black neighborhoods, especially when compared to limited police presence in White areas, reinforces perceptions of the system as racist. Solis, Portillos, and Brunson (2009) documented that Latino and Latina youth viewed aggressive policing tactics in their communities as efforts to restrict and criminalize their use of public space, again suggesting that concentrated arrests of minorities convinces youth of bias and unjustness of the justice system.
Of course, not all juvenile court involvement brings negative outcomes. Demands that youth are held accountable for their actions and the use of punishment may have some deterrent effect. However, despite the legislation of “get tough” reforms aimed at juvenile offenders many juvenile courts have continued to give much emphasis to rehabilitation or restorative justice rather than punishment (Mears, 2000). Delinquency prevention and rehabilitation programs such as family-based interventions, cognitive behavior therapy, and interpersonal skills training have demonstrated effectiveness in reducing delinquency and recidivism (Farrington & Welsh, 2003; Landenberger & Lipsey, 2005; Lipsey, Wilson, & Cothern, 1992; Scott & Steinberg, 2008; Zimring, 2005). Comprehensive research on the effects of moving increased numbers of especially minority boys into the justice system should consider both the intended effects of justice system responses and the unintended effects, both positive and negative, which may arise in particular court systems and demographic groups.
Footnotes
Declaration of Conflicting Interests
The author(s) declared no potential conflicts of interest with respect to the research, authorship, and/or publication of this article.
Funding
The author(s) received no financial support for the research, authorship, and/or publication of this article.