
Abstract
The goal of this study was to identify distinct and meaningful profiles of the seven criminogenic risk and need domains included on the Ohio Youth Assessment System—Disposition Tool (OYAS-DIS). This goal was accomplished by conducting a latent profile analysis (LPA) on a sample of 4,383 formally processed justice-involved youth assessed by the OYAS-DIS. The LPA determined there were six distinct profiles: (1) Low risk and need, (2) Low/moderate risk and need, (3) Low risk/need with high juvenile justice history, (4) Academic, mental health, and substance use needs, (5) Prosocial skills and decision making, and (6) High risk and need. Results may help juvenile justice practitioners to identify and address specific intervention needs of adjudicated youth.
Juvenile justice actors must make adjudication and disposition decisions in a limited timeframe. These decisions may have a drastic impact on a youth’s life. For example, at the disposition stage, a judge must determine the intensity of interventions and the type of custody most suitable for the youth. More specifically, judges must determine if probation, diversion, residential treatment, community-oriented programs, or other services are necessary for reducing recidivism. When making this decision, judges rely on various information, including written and oral recommendations from probation officers, defense attorneys, and prosecutors (National Juvenile Defender Center, n.d.). More recently, the emergence of structured risk assessment tools has played a critical role in helping practitioners gather information about a youth’s risks and needs (Baglivio et al., 2015; Latessa & Lovins, 2010). To date, many court jurisdictions rely on juvenile risk assessment tools to inform court decisions (Baird et al., 2013).
The Risk-Need-Responsivity (RNR) model informs most modern-day risks and needs assessment tools used in courts and corrections. The RNR model helps agencies identify whom to target with services, which needs to target, and how to target these needs (Bonta & Andrews, 2016). The RNR model has aided juvenile justice agencies by improving their decision-making processes by drawing their attention to key predictors of delinquency (Singh et al., 2014; Vincent, Guy et al., 2012). Through the RNR model implementation, juvenile justice actors tailor treatment, case planning, and disposition decisions to youths’ unique needs (Latessa & Lovins, 2010; Schwalbe, 2007).
Although risk assessments have become standard practice in the juvenile justice system, translating their results into practice remains inconsistent (Peterson-Baldi et al., 2015; Singh et al., 2014; Sullivan et al., 2019). This issue may arise for many reasons, including confusion about how to use the results of risk assessment (Sullivan et al., 2019; Vincent et al., 2018) and the complexity of trying to determine how to prioritize eight criminogenic risks and needs areas (Haqanee et al., 2015; Taxman & Caudy, 2015). Since court practitioners have little information on how risks and needs work together, one solution is to provide courts with more information on groupings of juveniles based on patterns of criminogenic risks and needs (Campbell, Miller et al., 2019; Vincent, Guy et al., 2012). This study aimed to determine whether or not a population of adjudicated youth have specific risk and need profiles, as identified by the Ohio Youth Assessment System—Disposition Tool (OYAS-DIS; Lovins & Latessa, 2013). This goal was accomplished by conducting a person-centered analytic technique, known as a latent profile analysis (LPA).
Implication of the RNR Model
Much of the research on the RNR model has focused on the measure of risks and needs. Court practitioners measure youth’s risks and needs by focusing on eight criminogenic static (i.e., stable) and dynamic (i.e., malleable) areas. These areas are: (1) criminal history, (2) antisocial peers, (3) antisocial attitudes, values, and beliefs, (4) antisocial personality, (5) employment/education, (6) family, (7) substance use, and (8) leisure activities (Bonta & Andrews, 2016), with criminal history functioning as they only static factor (Andrews et al., 2006). Although the measurement of risks and needs is a critical step in informing treatment, practitioners have limited information about the RNR model’s final R, which represents the Responsivity principle.
The third—and least-researched component of the RNR model—is responsivity (Bonta & Andrews, 2016). Responsivity identifies “how” to provide services to youth. There are two types of responsivity: general and specific. The general responsivity principle states that cognitive-behavioral interventions and prosocial skill building are the most effective intervention strategies to promote behavior change in offending populations (Bonta & Andrew, 2016; Greenwood, 2008; Landenberger & Lipsey, 2005; Latessa et al., 2020). Specific responsivity directs services to consider factors (e.g., race, sex, mental health, and transportation needs) that may hinder or promote treatment success (Bonta & Andrews, 2016; Latessa et al., 2020). Through accurate assessments and interpretations of risks and needs, court practitioners can understand some of the factors critical to measuring responsivity.
Juvenile Risk Assessment and Their Use
The RNR model’s lynchpin is the ability of agencies to effectively evaluate the risks and needs of each justice-involved individual (Andrews et al., 2006). The RNR model recommends that agencies use validated risk assessment tools to evaluate the eight criminogenic risk and need factors. Many juvenile risk assessments have demonstrated significant predictive validity (Andrews et al., 2006; Lovins & Latessa, 2013; Schmidt et al., 2005; Schwalbe, 2007). Additionally, these tools have been validated to predict recidivism for males and females (Pusch & Holtfreter, 2018; Schwalbe, 2008) and various races and ethnicities (Olver et al., 2009; Vincent et al., 2011). This is also true for predicting both violent and general recidivism (Catchpole & Gretton, 2003). Although risk assessments provide agencies with information on whether a youth is low, moderate, or high risk to recidivate, these classifications provide limited information about which types of services youth should receive most often.
Prior research has found that justice actors are inconsistent about implementing the results of risk and need assessments into practice (Haqanee et al., 2015; Luong & Wormith, 2011; Peterson-Badali et al., 2015; Shook & Sarri, 2007; Viglione, 2019; Viglione et al., 2015). For example, in a sample of 148 youth supervised under a juvenile court, Peterson-Badali and colleagues (2015) found that 40% of youth were provided with services that matched none of their criminogenic needs. Among the specific needs, antisocial attitudes were the least matched criminogenic need (15% of the time), while education was the highest met need in only 42% of cases. Additional research has found that justice actors tend to misinterpret risk assessments’ results by identifying certain factors as needs despite a low risk and need score (Luong & Wormith, 2011). Finally, research has demonstrated that many court actors simply ignore the results of risk assessment in their decision-making process (Shook & Sarri, 2007; Viglione et al., 2015)
One explanation for these findings is the complexity of risk assessments. Translating the results from the overall assessment, as well as the eight criminogenic risk and need domains, may be difficult for actors, as surveys have found that some justice actors report the results of these assessments to be challenging to convert into practice (Sullivan et al., 2019; Vincent, Pavia-Salisbury et al., 2012; Vincent et al., 2018). Attempting to identify appropriate services based on the results of eight separate risk and need domains may be complicated for practitioners (Taxman & Caudy, 2015). Therefore, to help justice system practitioners more effectively translate the results, it may be helpful to identify alternative interpretation strategies for the risk and need factors of justice-involved youth.
Criminogenic Risk and Needs
The RNR model has identified the central eight risks and needs based on decades of research on understanding factors associated with recidivism (Andrews et al., 1990; Bonta & Andrews, 2016; Dowden & Andrews, 1999; Smith et al., 2009). Bonta and Andrews (2016) initially separated the eight domains into the “big four” risk factors and the “moderate four” risk factors. The “big four” risk factors consisted of antisocial attitudes, personality, and associates, as well as criminal history, while the “moderate four” consisted of education/employment, family, substance use, and leisure activities. These two categories were created because the “big four” were the strongest predictors of recidivism (Andrews et al., 1990, 2006; Bonta & Andrew, 2016). However, recent research has started to uncover that these eight factors may not be separated into these two categories (Grieger & Hosser, 2014; Gutierrez et al., 2013; Olver et al., 2014; Papp et al., 2016; Wilpert et al., 2018; Wooditch et al., 2014).
This research has determined that the “big four” do not consistently separate themselves as the strongest predictors of recidivism. For example, Grieger and Hosser (2014) found that, in a sample of male juveniles, the “moderate four” and the “big four” had similar area under the curve (AUC) values for predicting recidivism (AUC = .65 for the big four; AUC = .66 for the moderate four) and education emerged as the most consistent predictor. In a sample of drug offenders, Wooditch and colleagues (2014) found that family, employment, and substance use were most notable for predicting general reoffending, while leisure activities emerged as a significant predictor for future substance use. Finally, evidence has found that the strength of criminogenic risk factors may differ across location (e.g., countries or neighborhoods; Olver et al., 2014; Onifade et al., 2011), age (Wilpert et al., 2018), and gender or race/ethnicity (Baglivio & Jackowski, 2013; Guitterez et al., 2013; Schwalbe et al., 2006). These recent findings highlight the fact that the most important criminogenic risks and needs may not be limited to the “big four,” but rather, they may differ depending on various circumstances (Bonta & Andrews, 2016; Grieger & Hosser, 2014; Taxman & Caudy, 2015). The growing support for this idea has led Bonta and Andrews (2016) to denounce the separation of the “big” and “moderate” four and indicate all eight risk factors can be among the strongest predictors of recidivism under varying circumstances.
Latent Profile Analysis
Given that the importance of criminogenic risks and needs may differ by subgroup, it may be useful for practitioners to identify when certain risks and needs are essential for diverse subgroups of youth. One way in which research can uncover the importance of specific risk and need factors across groups is to examine how they coincide with one another in a real-world setting (Campbell, Miller et al., 2019; Onifade et al., 2008; Schwalbe et al., 2008; Taxman & Caudy, 2015). For example, although two youth may have substance misuse needs, one may align with his or her lack of prosocial leisure activities and the other may align with exposure to delinquent peers. Identifying these differences can provide vital information for practitioners on how they could intervene with each youth (Latessa, 2011).
One analytic strategy that has been used to assess criminogenic risk and need patterns across justice-involved youth is a latent profile analysis (LPA). Latent profile analysis is a person-centered approach that allows individuals to be classified based on a chosen set of parameters. This can help identify whether specific risk and need patterns exist for different types of youth (Schwalbe et al., 2008). Latent profile analyses with a risk assessment takes the information provided by the assessment and uses a data-driven approach to identify distinct patterns of risks and needs based on the domains from the assessment (Campbell, Miller et al., 2019). Thus, LPA allows for a potential categorization of risk and need domains that expands the understanding of youths’ criminogenic risk and needs beyond the classifications typically provided by risk and need assessments (Onifade et al., 2008).
Latent profile analyses have helped researchers and practitioners identify patterns of individuals in various areas, including justice-involved youths’ psychiatric symptoms and substance abuse issues (Vaughn et al., 2007), parenting behaviors (Ayón et al., 2015), truancy (Maynard et al., 2012) and general mental health issues (Ballard et al., 2015; Kircanski et al., 2017). Over the past decade, researchers have started using LPAs to help identify criminogenic risk and need patterns of justice-involved youth (Campbell, Miller et al., 2019; Onifade et al., 2008; Schwalbe et al., 2008; Walker et al., 2016). For example, using an LPA on the Juvenile Risk Matrix (JRM; Schwalbe et al., 2007), Schwalbe and colleagues (2008) identified five classifications of youth. These classifications included a low risk group, a serious school problem group, a hostility inattention group, a high risk and family history group, and a substance abuse and peer delinquency group. In an analysis of the Youth Level of Service/Case Management Inventory (YLS/CMI; Hodge & Andrews, 2006), Campbell, Miller and colleagues (2019) identified three distinct classifications. These classifications included a minimal intervention need profile, a social behavior and social bond profile, and a maximum intervention need profile. The results of the LPAs conducted on justice-involved youth have identified youth who exhibited patterns of low risk and need and high risk and need, as well as youth who presented patterns of need in specific criminogenic risk and need domains (Campbell, Miller et al., 2019; Onifade et al., 2008; Schwalbe et al., 2008).
The goal of the current study was to extend research surrounding the identification of risk and need patterns. This goal is accomplished through conducting an LPA on a sample of adjudicated justice-involved youth assessed using the OYAS-DIS. Further, this study was the first to conduct an LPA on the widely used OYAS-DIS. The current paper sought to answer the following research questions: (1) what are the criminogenic risk and need profiles, determined by an LPA, observed in this OYAS-DIS sample? (2) How do demographic factors differ across these various profiles?
Method
Data in this study were collected from archival records stored in an electronic database at one juvenile county court in the Midwest between January 1, 2010 and December 31, 2016. The sample included 4,383 youth that received a court petition who were subsequently assessed with the OYAS-DIS during the field period. The first OYAS-DIS assessment the youth received was used in this study. In addition to assessment data, recidivism data and demographic characteristics was gathered. The data collected to track recidivism was extended to October 2017 to increase the proportion of youth with 2-year recidivism data.
Table 1 presents descriptive statistics for the 4,383 youths included in the current study. As shown in Table 1, most youths were male (79%) and Black (66%). The average age was 15.59 years old, and about one-third of youths had been charged with violent crimes. Concerning the OYAS-DIS, the average score was 12.04, which constitutes a low or moderate risk level.
Descriptive Statistics (N = 4,383).
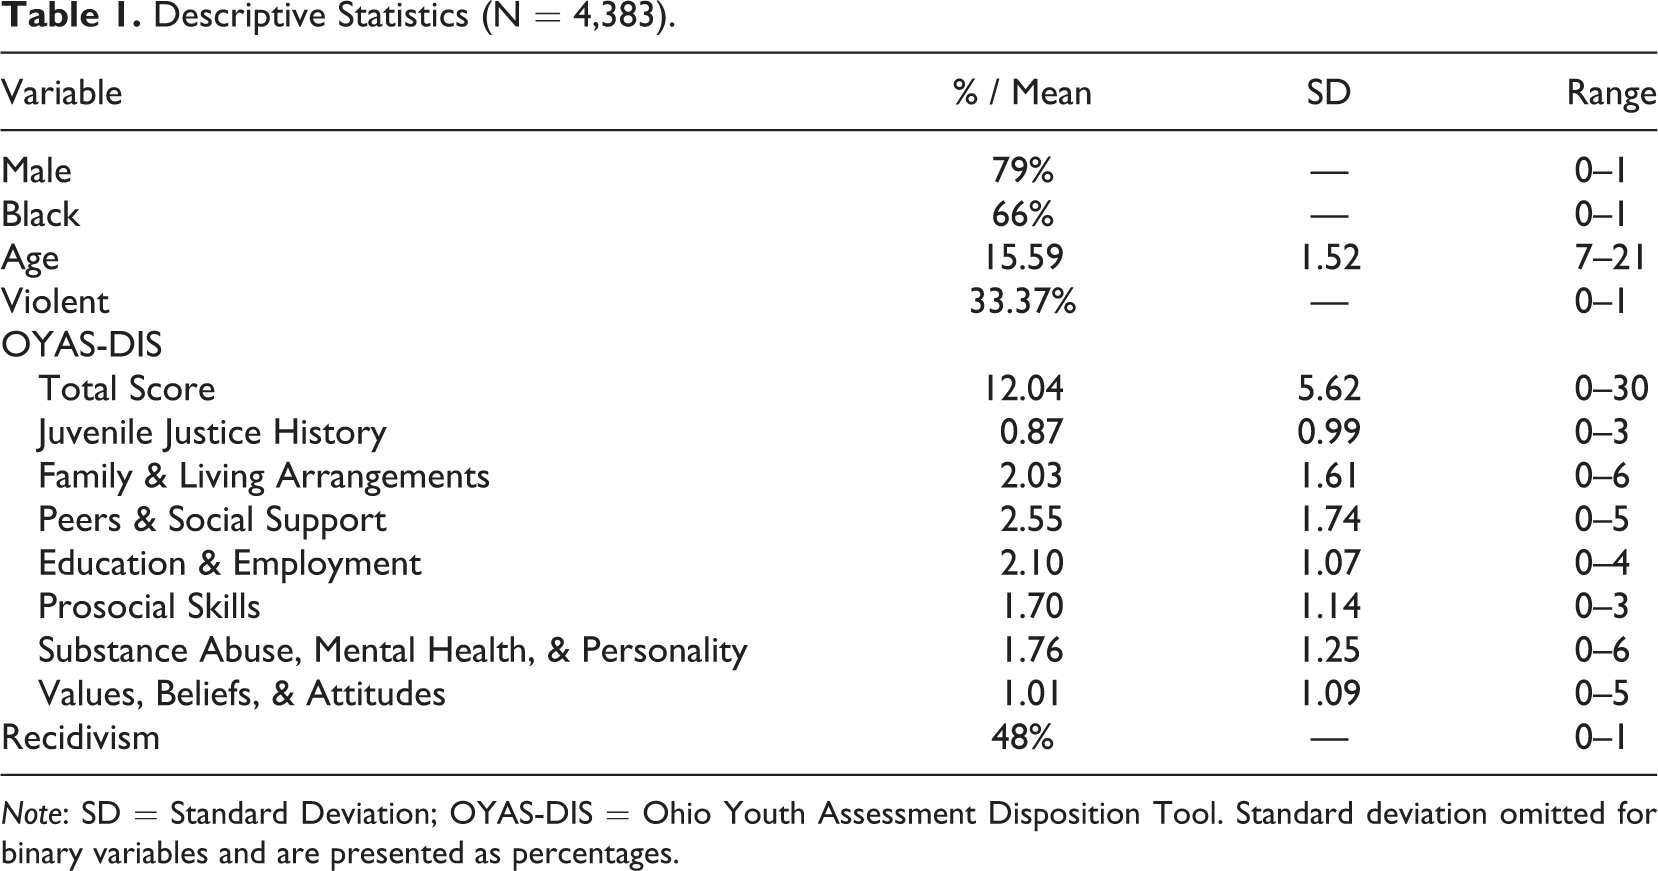
Note: SD = Standard Deviation; OYAS-DIS = Ohio Youth Assessment Disposition Tool. Standard deviation omitted for binary variables and are presented as percentages.
Measures
OYAS-DIS
The OYAS-DIS is a widely used actuarial risk assessment tool designed to predict criminogenic risks and needs at the disposition stage. The tool comprises 32 items that each measure one of seven domains. The domains on the OYAS-DIS are as follows: 1) Juvenile Justice History (2 items scored between 0 and 3); 2) Family and Living Arrangements (six items scored between 0 and 6; 3) Peers and Social Support Network (six items scored between 0 and 6); 4) Education and Employment (four items scored between 0 and 4); 5) Prosocial Skills (three items scored between 0 and 3); 6) Substance Abuse, Mental Health, and Personality (six items scored between 0 and 6); and 7) Values, Beliefs, and Attitudes (five items scored between 0 and 5). The only item not scored dichotomously on tool is one item from the juvenile justice history domain, which is scored as a 0, 1, or 2 (see Appendix Table A1 for a list of items under each domain). Each youth assessed by the OYAS-DIS is given a risk score within each domain, which is determined by adding together the domain items, and a total risk score, which is calculated by adding together all 32 items. The total score categorizes a youth as low, moderate, or high risk. Males are considered low risk if they score between 0 and 11 on the tool, moderate risk if they score between 12 and 18, and high risk if they score between 19 and 33. Females are low risk if they score between 0 and 12, moderate risk if they score between 13 and 18, and high risk if they score between 19 and 33. The cut-off scores for each risk level were created using separate crosstabulations (one for male and one for females) between risk score and recidivism rates as well as correlations between risk level and recidivism rates (see Lovins & Latessa, 2013). Additionally, the risk scores within each of the seven domains categorize each youth as low, moderate, or high risk within each domain (see Appendix Table B1).
Each youth in the jurisdiction under study had their risks and needs assessed by certified practitioners. In order for a court practitioner to be certified to administer the OYAS-DIS, they were required to complete a 2-day training program in which they learned evidence-based practices, the RNR model, and how to score each item on the tool. Each practitioner was required to pass a final exam at the end of training, which tested their knowledge about the tool and assessed their ability to score the tool. The OYAS-DIS is scored by collecting information using semi-structured face-to-face interviews with each youth. Additional information is gathered in a self-report questionnaire and collateral information provided by parents and teachers. The OYAS-DIS has been identified as a valid and reliable predictor of recidivism (Campbell, D’Amato, Papp, 2019; Lovins & Latessa, 2013).
Youth demographics
Demographic information regarding race and sex were collected at the outset of each assessment. Youths were asked to self-report their race and sex to the court actor conducting the assessment. Individual youth were categorized as Black or White. Age was calculated based on the court record, which included the date of birth and the date of the assessment.
Offense type
There were two steps taken to code offense type. First, a youth’s most serious charge was chosen out of the petition filed against them that was connected to their OYAS-DIS assessment. This was done because many youths had several on a single petition. Second, the most serious charge for each youth was categorized as a violent or non-violent offense. Violent offenses included any acts that caused, or had the intent to cause, physical harm. 1
Recidivism
Recidivism was measured in this study as the occurrence of a new court petition within 2 years of a youth’s OYAS-DIS assessment date. Any youth who did not have a full 2-year follow-up period were given a missing value for recidivism. It was determined to use 2 years as the cut-off point to create a measure with an acceptable amount of missing data while still following recommendations of prior research (Lovins & Latessa, 2013). 2
Analytic Strategy
The first step of the analytic strategy included conducting latent profile analyses (LPA) in order to determine the ideal number of profiles within the sample under study. In this study, the seven domains of the OYAS-DIS were used as covariates to identify youth’s latent profiles in this sample. Notably, youth demographics, offense type, and recidivism were not used as covariates in the formation of profiles. Two methods were used in order to determine the ideal number of profiles. First, fit-statistics were used to determine the ideal number of profiles based on a set of analyses that were conducted from single to seven-profile solutions. The most statistically justifiable profile solution was determined based on AIC, BIC, entropy, and Vuong-Lo-Mendell Rubin (VLMRT) statistics (Collins & Lanza, 2013; Everitt et al., 2001). Improved model fit of a profile solution over another is indicated by lesser AIC and BIC statistics, a higher entropy value, and a significant VLMR test (Collins & Lanza, 2013). Second, we took the findings from the statistical analysis and retrospectively interpreted the nature of the profiles in order to ensure that the identified profiles were meaningful. Therefore, the profiles were chosen based on a combination of statistical evidence and substantive meaning.
The second step of the analysis was to determine whether significant and substantive differences emerged across the six profiles as well as between each pair of profiles. This step was completed in a three part process. First, an analysis of variance (ANOVA) test was conducted in order to determine whether significant differences emerged between the criminogenic risk domains, as well as youth demographics across the various profiles. Second, an effect size, omega-squared, was calculated to determine the strength of these associations. Omega-squared was used because it has been identified as a less-biased and more conservative measure in comparison to other effect size measures (e.g., Eta-squared; Yigit & Mendes, 2018; Weisburd & Britt, 2014). Third, Bonferroni’s p-value correction post-hoc test was conducted in order to correct for multiple comparisons and determine how the profiles differed across risk profiles and demographic characteristics (Weisburd & Britt, 2014). These three steps were used to form meaningful labels for each of the various profiles.
Results
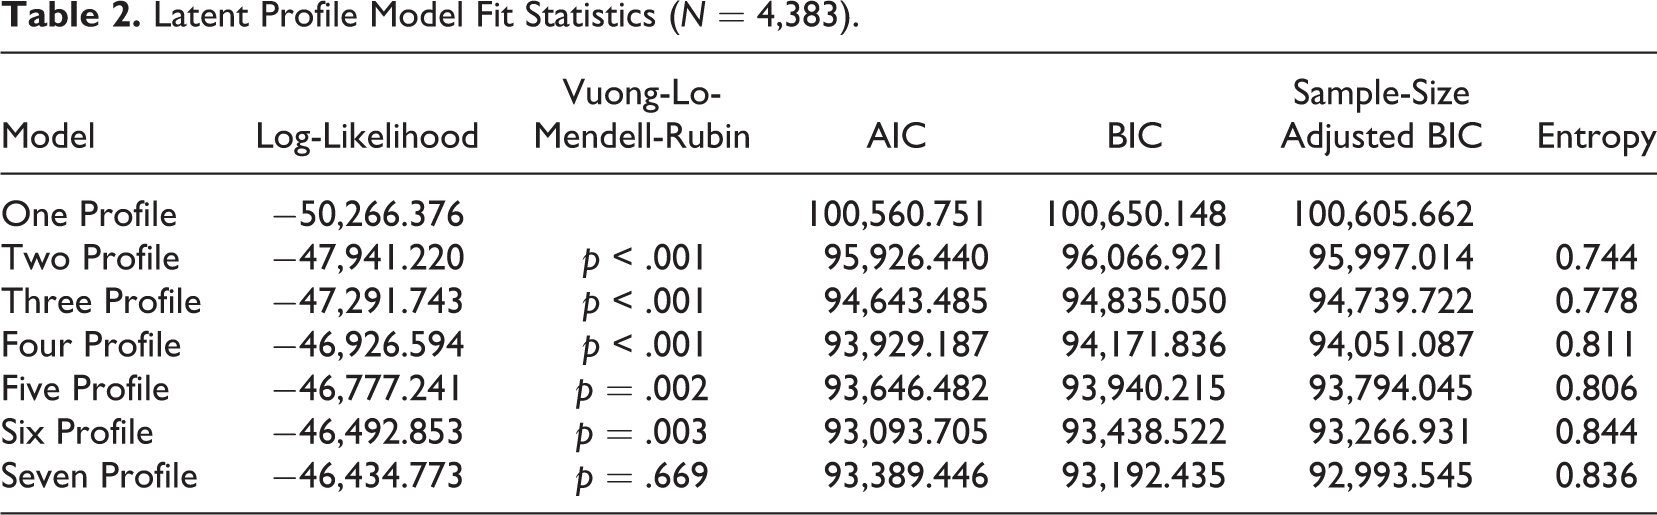
The results of the LPA are presented in Table 2. Based on the fit statistics in this table, it was determined that a six-profile solution was the most statistically justifiable profile solution. This solution was chosen based on several criteria: First, the entropy value for the six-profile solution (.844) was an improvement over the five-profile solution (.806), while the entropy value for the seven-profile solution (.836) was smaller than the six-profile solution. Second, the VLMR test indicated that the six-profile solution significantly improved model fit over the five-profile solution (p = .003). However, the same test indicates that the seven-profile solution is not a significantly better fit to these data than the six-class solution (p = .669). Finally, with the six profile solution identified as the statistically most justifiable solution, we retrospectively interpreted this solution and determined that the profiles also had substantive meaning. Had the six profile solution not provided substantive meaning, we would have gone back to investigate other profile solutions (Collins & Lanza, 2013).
Latent Profile Model Fit Statistics (N = 4,383).
With the six-profile solution identified, the next step was to conduct a substantive comparison of the six classes to determine how to label each profile. Table 3 compares the six classes according to the total risk score as well as the seven criminogenic risk and need scales, while Table 4 compares the profiles across demographic characteristics, offense type, and recidivism. The last column in these tables present the results of the ANOVA analyses. A label of “n.s” reveals a non-significant result for the ANOVA analyses. When numbers appear in the last column, it indicates that the ANOVA was statistically significant at a p < .05 level or less. The greater than symbol (“>”) between profile numbers represents statistically significant differences (at a p < .05 level or less) between specific profiles as identified by Bonferroni’s post-hoc correction test.
Mean Values of Latent Profile Risk and Need Domains.
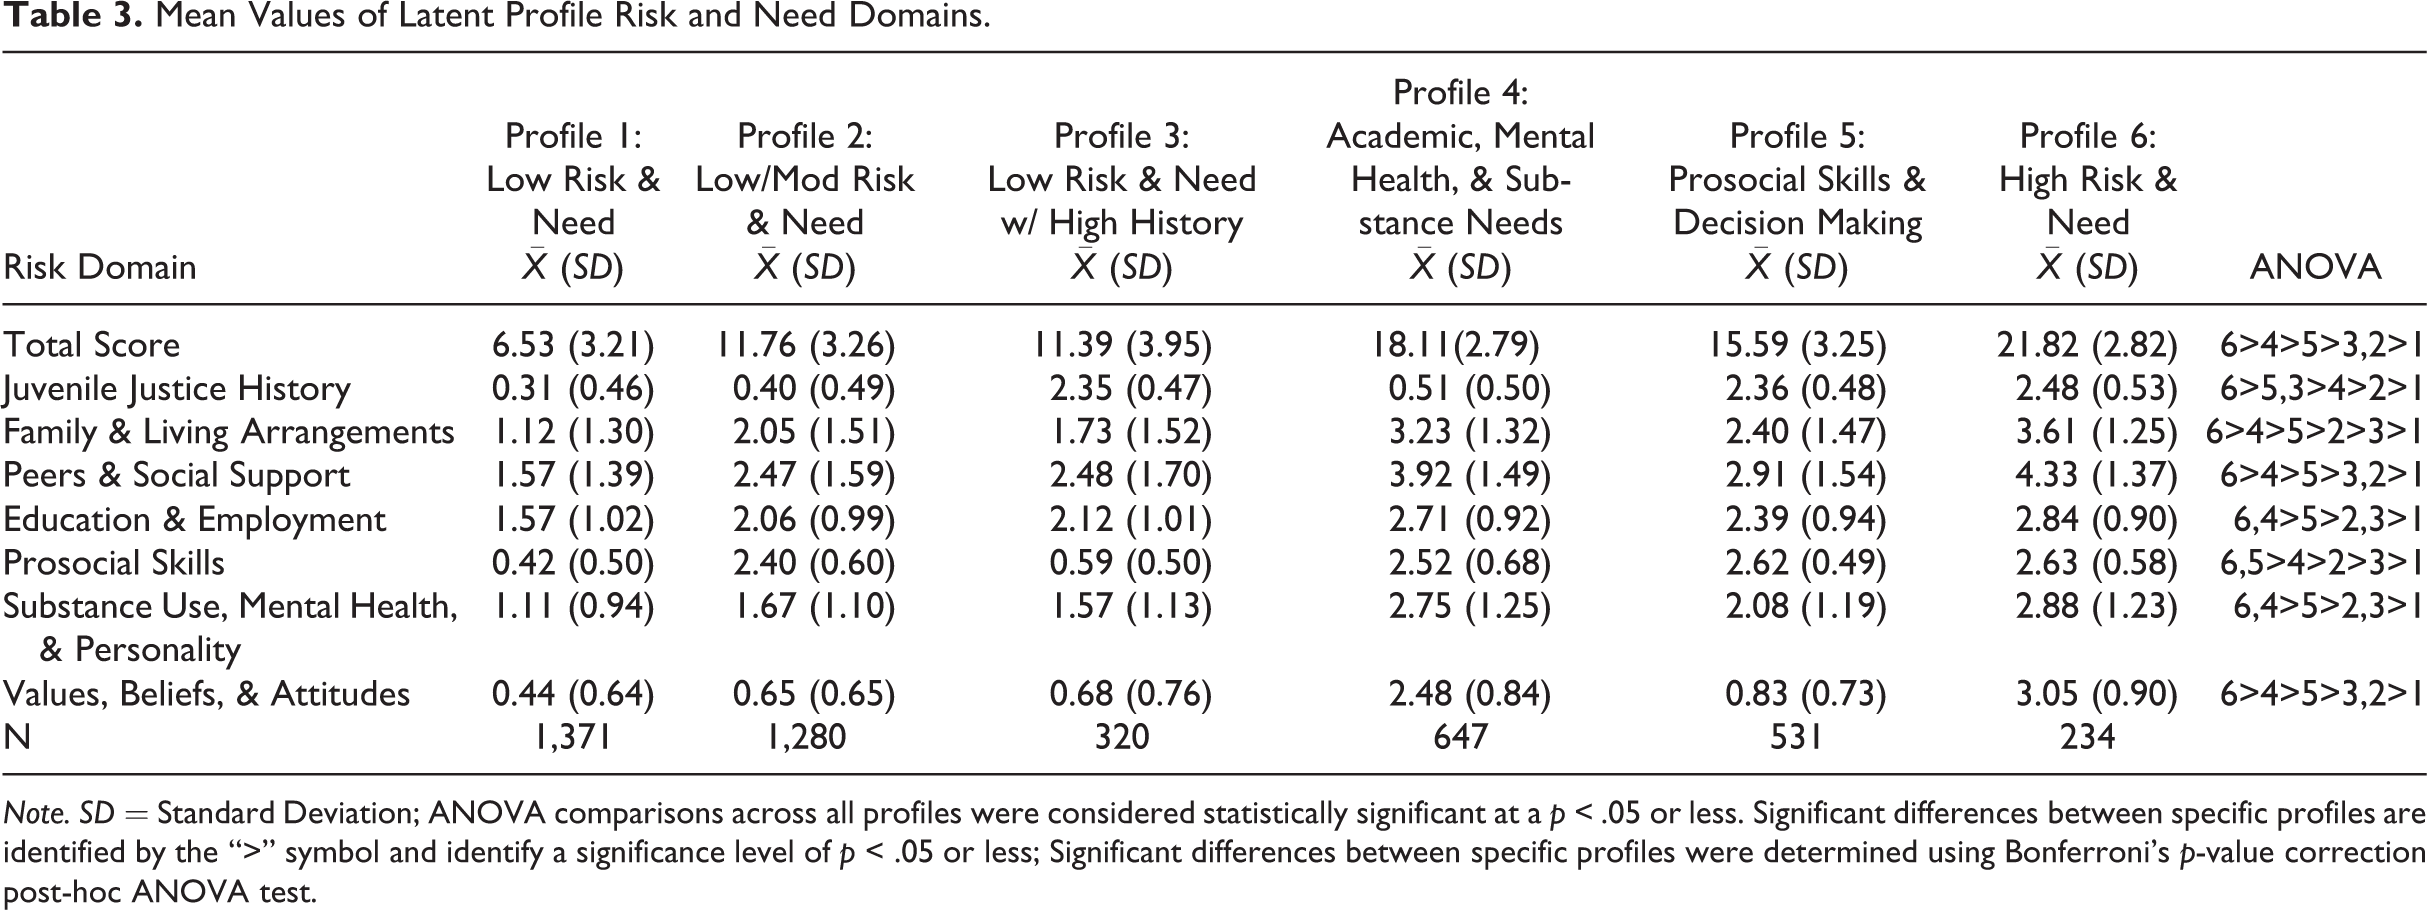
Note. SD = Standard Deviation; ANOVA comparisons across all profiles were considered statistically significant at a p < .05 or less. Significant differences between specific profiles are identified by the “>” symbol and identify a significance level of p < .05 or less; Significant differences between specific profiles were determined using Bonferroni’s p-value correction post-hoc ANOVA test.
Comparison of Demographics, Crime Type, and Recidivism Across Profiles.
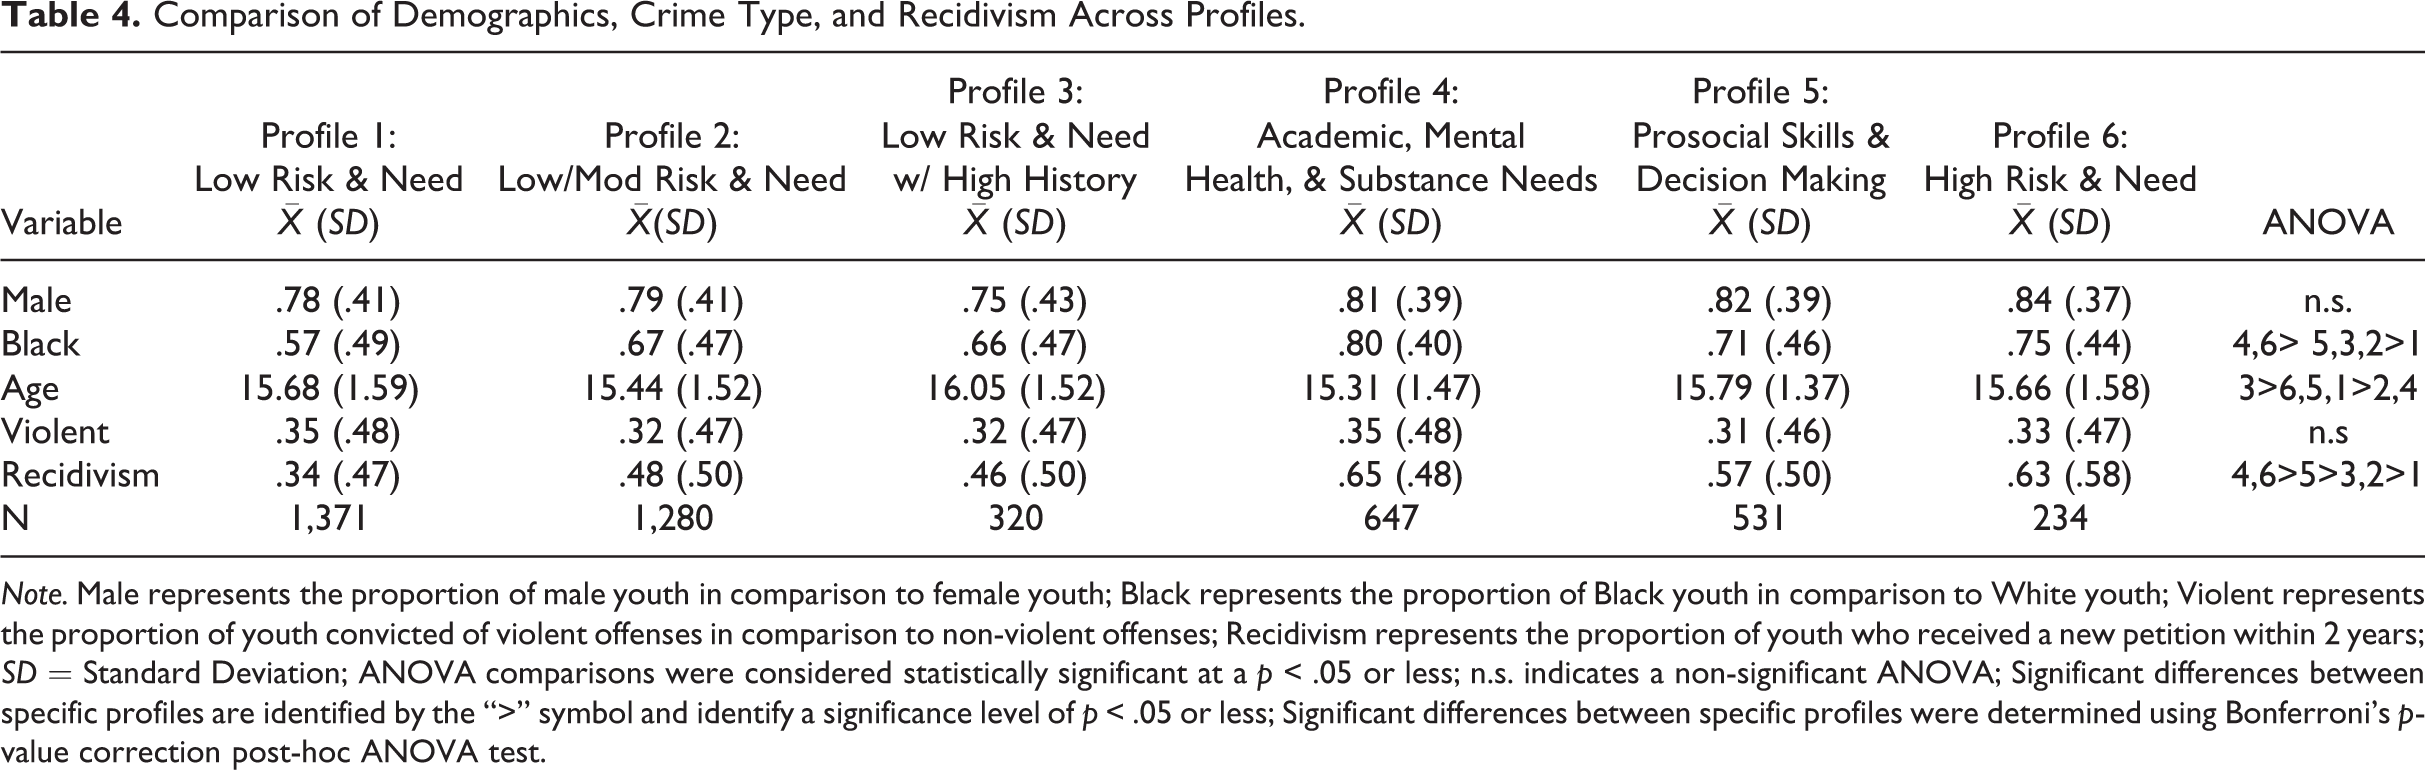
Note. Male represents the proportion of male youth in comparison to female youth; Black represents the proportion of Black youth in comparison to White youth; Violent represents the proportion of youth convicted of violent offenses in comparison to non-violent offenses; Recidivism represents the proportion of youth who received a new petition within 2 years; SD = Standard Deviation; ANOVA comparisons were considered statistically significant at a p < .05 or less; n.s. indicates a non-significant ANOVA; Significant differences between specific profiles are identified by the “>” symbol and identify a significance level of p < .05 or less; Significant differences between specific profiles were determined using Bonferroni’s p-value correction post-hoc ANOVA test.
ANOVA analyses presented in Table 3 revealed statistically significant differences in total risk/need score and all seven domains, while examination of effect sizes revealed varying strengths of association. Omega-squared (ω2 provides effect sizes between 0 and 1, where values closer to one represent larger effect sizes. The effect size value identifies the amount of variation in risk and need domains that is explained by the various profiles (Weisburd & Britt, 2014). Of the seven domains and the total score, four ANOVAs revealed effect sizes greater than .50 while four ANOVAs revealed effect sizes of less than 0.50. Explicitly, the four analyses with effect sizes of greater than .50 were the total score (F = 1836.39; p < .001; ω2 = .67), the Juvenile Justice History domain (F = 2802.17; p < .001; ω2 = .76), the Prosocial Skills domain (F = 2729.66; p < .001; ω2 = .76), and the Values, Attitudes, and Beliefs domain (F = 1200.19; p < .001; ω2 = .58). The four domains that revealed smaller effect sizes were the Family and Living Arrangements domain (F = 280.30; p < .001; ω2 = .24), Peers and Social Support domain (F = 295.84; p < .001; = .25), the Education and Employment domain (F = 165.56; p < .001; ω2 = .16), and the Substance Abuse, Mental Health, and Personality domain (F = 264.68; p < .001; ω2 = .23).
Table 4 compares the six classes across demographics, offense type, and recidivism rates. ANOVAs revealed that there were statistically significant differences, with relatively weak effect sizes, in the proportion of Black youth in profiles (F = 23.37; p < .001; ω2 = .03), as well as youth’s age (F = 15.29; p < .001; ω2 = .02) and recidivism rates (F = 39.63; p < .001; ω2 = .05). There were no significant differences across profiles in the proportion of male youth (F = 2.14; p = .058) or violent offenses (F = 0.94; p = .451).
With ANOVAs and effect sizes examined, the next step was to conduct Bonferroni’s post-hoc correction test between profiles and risk/need domains, and profiles and demographic characteristics. The results of this post-hoc test and the ANOVA and effect size results were used to provide labels to the six profiles. Explanations of the labels are provided below, alongside a description of the results of the Bonferroni’s post-hoc test.
Profile 1: Low Risk and Need
Examining the results of the Bonferroni’s test from Tables 3 and 4 provides profile 1 with a label of low risk and need justice-involved youth. Across all seven criminogenic risk and need domains, as well as the total risk score, youth under this profile scored the lowest, on average, of any of the six profiles, with p-values of less than .001 for all comparisons. Table 4 provides a few other notable descriptions of this profile. Youth in this group were the least likely to be Black (57%; p < .001 for all comparisons) and the least likely to recidivate (34%; p < .001 for all comparisons).
Profile 2: Low/Moderate Risk and Need
Youth in profile 2 had an average total risk score of 11.76, which identifies females as low risk, and falls on the cut-off score for males being considered as low or moderate risk for recidivism. Further, youth scored as low or moderate risk, on average, on all seven of the criminogenic risk and need domains. Bonferroni’s test indicated that profile 2 scored significantly higher (p < .001) on all domains than the low risk and need profile, but significantly lower than all other groups outside of profile 3. Therefore, this profile was given a label of low/moderate risk and need. The post-hoc test also identified that youth in this profile were also among the youngest profiles of youth (15.44 years old) and 48% of youth in this profile recidivated.
Profile 3: Low Risk/Need With High Juvenile Justice History
Profile three was defined by youth with low risk and need scores across most of the criminogenic needs areas. Bonferroni’s test found that, outside of the low risk and need group, profile 3 scored among the lowest in all domains. The one exception of this was the Juvenile Justice History domain (M = 2.35), where youth under this profile scored in the moderate to high range and scored significantly higher than all profiles besides profiles 5 and 6, which will be described in more detail below. This score on the Juvenile History Domain increased the youths’ total scores from low risk to close to moderate risk. Thus, this profile was assigned the label of low risk/need with high juvenile justice history. Youth under this profile were also the oldest youth (16.05 years old) on average, and 46% recidivated.
Profile 4: Academic, Mental Health, and Substance Use Needs
The average risk score of youth in profile four was 18.11, which places youth in the moderate to high risk score on the OYAS-DIS. Notably, youth in this domain scored significantly higher on the Education/Employment domain and the Substance Use, Mental Health, and Personality domain than all of the other profiles except the high risk and need group (see below). Given the prominence of the two domains—Education and Employment and Substance Use, Mental Health, and Personality—this profile was assigned a label of academic, mental health, and substance use needs. Youth in this domain were among the most likely to be Black (80%), were among the youngest profiles of youth (15.31 years old), and recidivated at the highest rate (65%).
Profile 5: Prosocial Skills and Decision Making
The fifth profile was defined as moderate risk youth (M = 15.59) who scored in the higher-risk range of the Prosocial Skills risk and need domain. Except for the high risk and need group, this profile scored significantly higher in the Prosocial Skills domain than the other profiles. The items in this domain are largely concerned with a youth’s ability to make prosocial decisions and avoid and manage risky situations; therefore, this profile was given a label of prosocial skills and decision making. 57% of youth under this profile recidivated.
Profile 6: High Risk and Need
Youth under the sixth profile had the highest overall risk score (M = 21.82) of the six profiles. Additionally, across all seven domains, this profile scored significantly higher, or as high, on each of the seven risk and need domains than the other profiles. Based on the significantly higher risk and need scores, this profile was assigned the label of high risk and need. Youth under this profile were among the most likely to be Black (75%) and among the most likely to recidivate (63%).
Discussion
Risk assessments are ubiquitous in the juvenile justice system. These assessments typically assess justice-involved youth on the eight criminogenic risk and need domains identified by the RNR model. Although these eight risk and need domains have been vital for helping juvenile agencies tailor services to youth, research has indicated that juvenile justice agencies are inconsistent at translating the results of these assessments into practice (Peterson-Badali et al., 2015; Singh et al., 2014). One reason for this issue is that justice practitioners are unsure of how to match services they provide to a youth’s need areas (Hanaqee et al., 2015; Vincent et al., 2018). Finding alternative strategies to categorize youth based on these risk and need assessments may provide more useful information on how to best deliver services to youth (Campbell, Miller et al., 2019). The goal of the current study was to identify distinct and meaningful profiles of the seven criminogenic risk and need domains identified by the OYAS-DIS.
The results revealed six distinct profiles of youth based on the criminogenic risk and need domains on the OYAS-DIS. Three of the profiles appeared to fall into general categories of risk and need level. The other three profiles were characterized by specific criminogenic risks and needs. Each of these domains provides valuable information that can help researchers and practitioners further understand the importance of how risks and needs cluster together.
Low Risk and Need, Low/Moderate Risk and Need, and High Risk and Need
The low risk and need, low/moderate risk and need, and high risk and need profiles aligned with general risk and need levels typically identified by risk assessment (i.e., low, moderate, or high risk; Andrews & Hoge, 2006; Lovins & Latessa, 2013). Within each of these groups, the risk level remained consistent across all seven of the domains. For example, for the high risk and need profile, all seven domains scored in the higher risk and need range of each domain. Other studies using similar cluster analyses on juvenile risk assessments have also identified profiles of youth that emerge as low risk and need or high risk and need across various criminogenic risks and needs (Campbell, Miller et al., 2019; Onifade et al., 2008; Schwalbe et al., 2008). The consistency of these results indicate there is a portion of youth within the system that emerge as relatively low or high risk and need across all domains. In practice, juvenile justice actors should provide the lower risk youth with minimal intervention (e.g., dismissal, diversion, or informal probation) to conserve court resources and avoid potential iatrogenic or labeling effects (Bernburg et al., 2006; Lowenkamp & Latessa, 2004; Lowenkamp et al., 2006). The higher risk and need youth will need intensive rehabilitative services that target multiple high need areas. Only services that focus on multiple criminogenic need areas will have a substantial impact on reducing recidivism for these youth (Dowden & Andrews, 1999; Lipsey, 2009; Smith et al., 2009).
One other important finding emerged for the low risk and need and high risk and need profiles. Specifically, Black youth were the least likely to be classified in the low risk and need profile and most likely to be classified in the high risk and need profile. Past research on the OYAS-DIS has identified that while it is a valid predictor of recidivism for all youth, it is a slightly stronger predictor of recidivism for White youth as opposed to Black youth, especially Black males (Campbell, D’Amato, Papp, 2019). Therefore, it is possible that the OYAS-DIS is unable to assess nuanced differences between racial subgroups that may result in increased risk or need scores for Black youth. Another potential explanation of this finding is that racial minorities may be subjected to differential treatment by various juvenile and criminal justice actors. Some research has suggested that minority youth are subjected to increased surveillance by law enforcement and increased supervision by the juvenile court (Sharlein & Engstrom, 2018), which may cause minority youth to experience increases in risk score in comparison to White youth. If the increase in risk score is the result of differential treatment, then more research and policy changes are needed to identify how to fairly evaluate justice-involved youths’ risks and needs. Furthermore, more research is needed to understand why racial differences may emerge in risk assessment.
Low Risk and Need With High Juvenile Justice History
Youth in the low risk and need with high juvenile justice history profile were characterized as relatively low risk and need across all the domains but were separated by the fact that they were a higher risk in the Juvenile Justice History domain. Moreover, despite the overall low risk and need of these youth, they had a noticeably higher recidivism rate (48%) than the low risk and need profile of youth (34%). This indicates that despite their overall low risk, many youths come into contact with the juvenile justice system on a relatively consistent basis. One potential explanation is unmeasured ecological factors that may influence the likelihood of contact with the system (Campbell et al., 2020; Onifade et al., 2011). For example, youth within this domain may often come from disadvantaged neighborhoods, which may increase the chance that individuals come into contact with the justice system. Further, evidence has uncovered that youth in disadvantaged neighborhoods may be exposed to additional surveillance by law enforcement (Sharlein & Engstrom, 2018). Practitioners should focus on treating these youth as other lower risk youth, even though the history domain pushes the average score of these youth toward moderate risk to avoid the potential iatrogenic or labeling effects of the juvenile justice system (Bernberg et al., 2006; Lowenkamp & Latessa, 2004).
Academic, Mental Health, and Substance Use Needs
The academic, mental health, and substance use needs profile was characterized by moderate to high risk youth who scored among the highest in the Education/Employment domain and the Substance Abuse, Mental Health, and Personality domain. Youth within this profile likely had behavioral issues in school and poor relationships with school personnel or their employers. Furthermore, they had issues with drugs, alcohol, and mental health (Lovins & Latessa, 2013). Based on these results, these youths will need interventions that specifically address behavioral problems in school and relationships at school and work. Moreover, programs should pay attention to responsivity and tailor these services to provide support around any mental health or substance abuse issues that youth may possess. Without addressing these specific responsivity issues, programs (e.g., cognitive behavioral therapy) will likely be ineffective at reducing recidivism (Bonta & Andrews, 2016; Latessa et al., 2020).
Prosocial Skills and Decision Making
The final profile of youth that emerged from the OYAS-DIS was a group that scored higher risk and need on the Prosocial Skills domain than all groups besides the high risk and need group. Youth in this domain have trouble identifying high risk situations, weighing the positives and negatives of a situation, and are overall poor prosocial decision-makers (Lovins & Latessa, 2013). The justice-involved youth in this profile appear to be in special need of these skills. Cognitive behavioral programs such as Thinking for a Change (T4C) may be especially beneficial for these youth. Thinking for a Change is cognitive behavioral program focused on developing social skills and problem solving skills in a deliberate step-by-step manner (Golden et al., 2006). Although not the sole option for addressing prosocial skills and decision making, T4C is one example of an existing rehabilitative program that may help youth under this profile avoid recidivism.
The low risk and needs with high juvenile justice history, the academic, mental health, and substance use needs, and the prosocial skills and decision making profiles discussed above identify three profiles of youth in which unique patterns of criminogenic risk and need emerge. The finding of various patterns of risk and need profiles within a population of youth is consistent with past LPA analyses that have identified other unique typologies of youth (Campbell, Miller et al., 2019; Onifade et al., 2008; Schwalbe et al., 2008). As seen in the results of the current study, as well as past research (e.g., Campbell, Miller et al., 2019), in some instances individual youth’s criminogenic risk and needs pattern together in general categories of low, moderate, or high risk and need. However, the consistency of findings displaying that other youth’s risk and needs present together in meaningful and unique ways demonstrates the importance of identifying specific patterns of risk and need (Schwalbe et al., 2008).
Implications
Beyond the discussion provided above, this study’s results identify three other important implications for research and policy. First there is a growing body of evidence to indicate that criminogenic risk and need domains may differ in importance depending on the individual and other circumstances and that no domains consistently emerge as the most important predictor of recidivism (see Geiger & Hosser, 2014). The results of this study found that prosocial skills, education/employment, and substance use emerged as essential need domains for certain youth. This provides further evidence that different domains may emerge as salient for youth. Future research is needed to understand the factors that determine which risk and need domains are the most salient for specific groups. Understanding this may provide essential knowledge on how to advance the use of risk assessment in the rehabilitation of justice-involved youth.
Second, the results of the ANOVAs indicate that analyses such as LPAs may provide salient information on how risks and needs may pattern across groups of youth. The effect sizes of the ANOVAs suggest that there were not only significant differences between profiles across the risk and need domains, but substantive differences (Weisburd & Britt, 2014). In fact, the total OYAS-DIS score and three of the domains—Juvenile Justice History, Prosocial Skills, and Values, Attitudes, and Beliefs—revealed large effect sizes (ω2 ranging between .58 and .76), suggesting that a large amount of the variation in risk and need domains is explained by the different profiles. As for the other four domains—Education and Employment, Peers and Social Network, Family and Living Arrangement, and Substance Abuse, Mental Health, and Personality—the effect sizes, while notably smaller (ω2 ranging between .16 and .25), still provide indication that the differences across profiles are both significant and substantive. These effect sizes highlight that meaningful differences between the six profiles exist across the domains. Therefore, separating youth into groups, such as those identified by the LPA, may allow researchers and practitioners to better identify how to intervene with different youth in the most effective and efficient manner possible.
This second implications brings about a discussion of reification, which is the process of treating certain abstract constructs as real, meaningful objects. The process of reification is a concern from both a labeling perspective, as well as a scientific perspective (see Duster, 2005; Pasman, 2011). From a labeling perspective, there is a concern of assigning an individual a label (e.g., offender, criminal, felon, delinquent) that does not truly belong to that individual, as it may result in the individual taking on the label and experiencing negative outcomes (e.g., lowering of self-esteem; Pasmnan, 2011). From a scientific perspective, there is concern that if abstract constructs are treated as real objects then incorrect decisions may be made around these constructs either due to (1) the overgeneralization of these constructs or (2) the tendency to ignore other relevant information (York & Clark, 2007).
Reification is a notable concern for the profiles identified in the current analysis. Importantly, however, we are not advocating for youth to be assigned the labels determined by our analysis. Instead, the substantive differences observed across risk and need domains between the profiles suggest that there may be a need for more detailed labels of juveniles’ patterns of risk and need beyond the traditional low, moderate, or high risk and need assigned by risk assessments. In order for more detailed labels to actually be determined, it would be necessary for research to replicate patterns of risks and needs across multiple risk assessments, settings, and/or types of youth.
As discussed above, the results of this study did partially align with past studies using LPA, or similar analyses, to identify patterns of risks and needs. There appears to be a consistent finding that across jurisdictions and risk assessment tools some youth will group together as low risk and need across various domains, while other youth will group together as high risk and need across various domains. Further, there appears to be a consistent finding that other youth will group together across patterns of specific risk and need domains (Campbell, Miller et al., 2019; Onifade et al., 2008; Schwalbe et al., 2008). For example, in this study, two patterns of risk/need emerged under the academic, mental health, and substance use needs profile and the prosocial skills and decision making profile. To illustrate profiles from other studies, Schwalbe and colleagues (2008) identified a substance abuse and peer delinquency group while Campbell, Miller et al. (2019) identified a social behavior and social bond group. Therefore, the findings across these studies identify that risks and needs pattern together; however, there has yet to be consistency in the exact patterns that have emerged across studies. Hence, if future research continues to employ profile analyses, or other clustering analyses, and are able to identify consistent patterns of risk and need domains across risk assessments, settings, and/or types of youth, then this would provide salient information that juvenile justice agencies could utilize to best intervene with youth. If research is unable to identify consistent profiles across risk assessments or samples, the knowledge gained from these analyses can still be beneficial for specific jurisdictions. Explicitly, the jurisdiction in which the analysis is conducted could use profiles to make intervention decisions as the profiles would be directly formed from the youth in their jurisdiction. However, in this instance, these profiles should not be transferred to other jurisdictions.
The final, and potentially most important, implication of this study is that the profiles identified stress the importance of creating meaningful treatment packages that can address multiple need domains. By recognizing the vital need areas of youth, these profiles can help court practitioners better translate the results of the risk assessment into practice (Campbell, Miller et al., 2019). Knowing the specific profiles could help practitioners identify whether youths have needs in certain areas (e.g., prosocial skills or education), all areas (the higher risk and need youth), or have few needs (e.g., low risk and need youth). While replication is needed in order for these six profiles to be specifically used to form packages, they do provide an example of how profile analyses can be used to identify suitable treatment packages for youth. For example, the prosocial skills and decision making profile identified youth who (1) struggle to identify risky situations and (2) lack the skills necessary to make prosocial decisions in those risky situations. With this knowledge, practitioners could create case plans around those youth explicitly aimed at improving the youth’s ability to identify risky situations (e.g., a cognitive behavioral intervention) and increasing youth’s prosocial skills, through a program such as T4C (Golden et al., 2006).
As for the academic, mental health, and substance use needs profile, a treatment package for these youth would likely need to focus on youth’s educational issues while providing treatment to substance abuse and mental health problems. Specifically, juvenile justice agencies could work with treatment providers to implement a rehabilitative program that focuses on education and substance abuse issues. Further, this program could work with mental health professionals to help these youth overcome any mental health challenges that may inhibit them from completing the program. Without addressing each of these domains, it is unlikely these youth will experience decreases in recidivism (Bonta & Andrews, 2016). A current real-world example of a treatment package designed to target multiple criminogenic needs is Cognitive Behavioral Interventions for Substance Abusers (CBI-SA) developed by the University of Cincinnati Corrections Institute (UCCI). This program focuses on delivering cognitive-behavioral interventions to high need substance users. However, the program also uses skill-building to teach individuals how to become prosocial thinkers and prosocial decision-makers (University of Cincinnati Corrections Institute, 2010). While CBI-SA may not fit the profiles identified by our analyses, it does provide an example of how treatment packages can be designed with multiple criminogenic risks and needs in mind. Overall, although the calculation of LPAs may be more complicated than traditional risk assessment, once complete, they may provide jurisdictions with more valuable information on how to identify and target the most pertinent need areas for youth.
Limitations
Although the results provide valuable information for research and policy, there are some limitations of the current study. First, the profiles in the analysis are based on the items and domains included in the OYAS-DIS. Although this limits the generalizability of the profiles identified, the OYAS-DIS is a popular juvenile risk assessment tool adopted and adapted in many jurisdictions across the country (Juvenile Justice Services, 2017). Therefore, future research should seek to conduct LPAs on the OYAS-DIS and other juvenile risk assessments to determine whether certain profiles of youth emerge across settings and risk domains/items. Second, the current study was limited to examining profiles across Black and White youth. Furthermore, the profiles may not extend to special populations, such as sex offenders. Therefore, future research should aim to conduct LPAs on diverse samples. Third, intervention data was not included in the study. The profiles were based on individuals’ risks and needs measured at intake into the juvenile court. Interventions and services youth experience during their supervision can influence individuals’ risks and needs and ultimately influence their recidivism (Bonta & Andrews, 2016). Future research should aim to identify whether the types of interventions youth receive influences the relationship between profiles and recidivism. If research can identify that an individual’s recidivism decreases when the risks and needs embedded within the profiles are matched to services, this would provide insight into these profiles’ utility to inform juvenile justice services. Fourth, a common criticism of actuarial tools (e.g., risk assessment) is that they apply categorizations to individuals based on group statistics. These categorizations can misrepresent individuals and cause decisions to be made based on group statistics instead of individual characteristics (see Netter, 2006). While this is a concern that remains with LPAs, extant literature identifies that actuarial measures of risk, as opposed to structured decision making, are often superior (Andrews et al., 2006). However, future research must continue to examine how individual differences may interact with and influence actuarial measures. With these limitations in mind, the findings of the current study provide a strong starting point in understanding patterns of criminogenic risks and needs, as measured by the OYAS-DIS.
Conclusion
By continuing to use analyses such as LPAs on risk assessments, research has begun to uncover that risk and need domains present together in distinct and meaningful patterns. The six profiles identified in this study are another example of such patterns. If research can continue to expand upon and replicate the extant literature on the patterns of risks and needs, then it will be possible to identify meaningful groupings of youth that can lead to more informed policies in the juvenile court. At the forefront of these policies would the ability to design meaningful treatment packages that can effectively and efficiently target multiple need areas. The profiles identified in the present study provide a steppingstone for the creation of treatment packages that can effectively service youth.
Footnotes
Appendix A
OYAS-DIS Risk Domains and Risk Items.
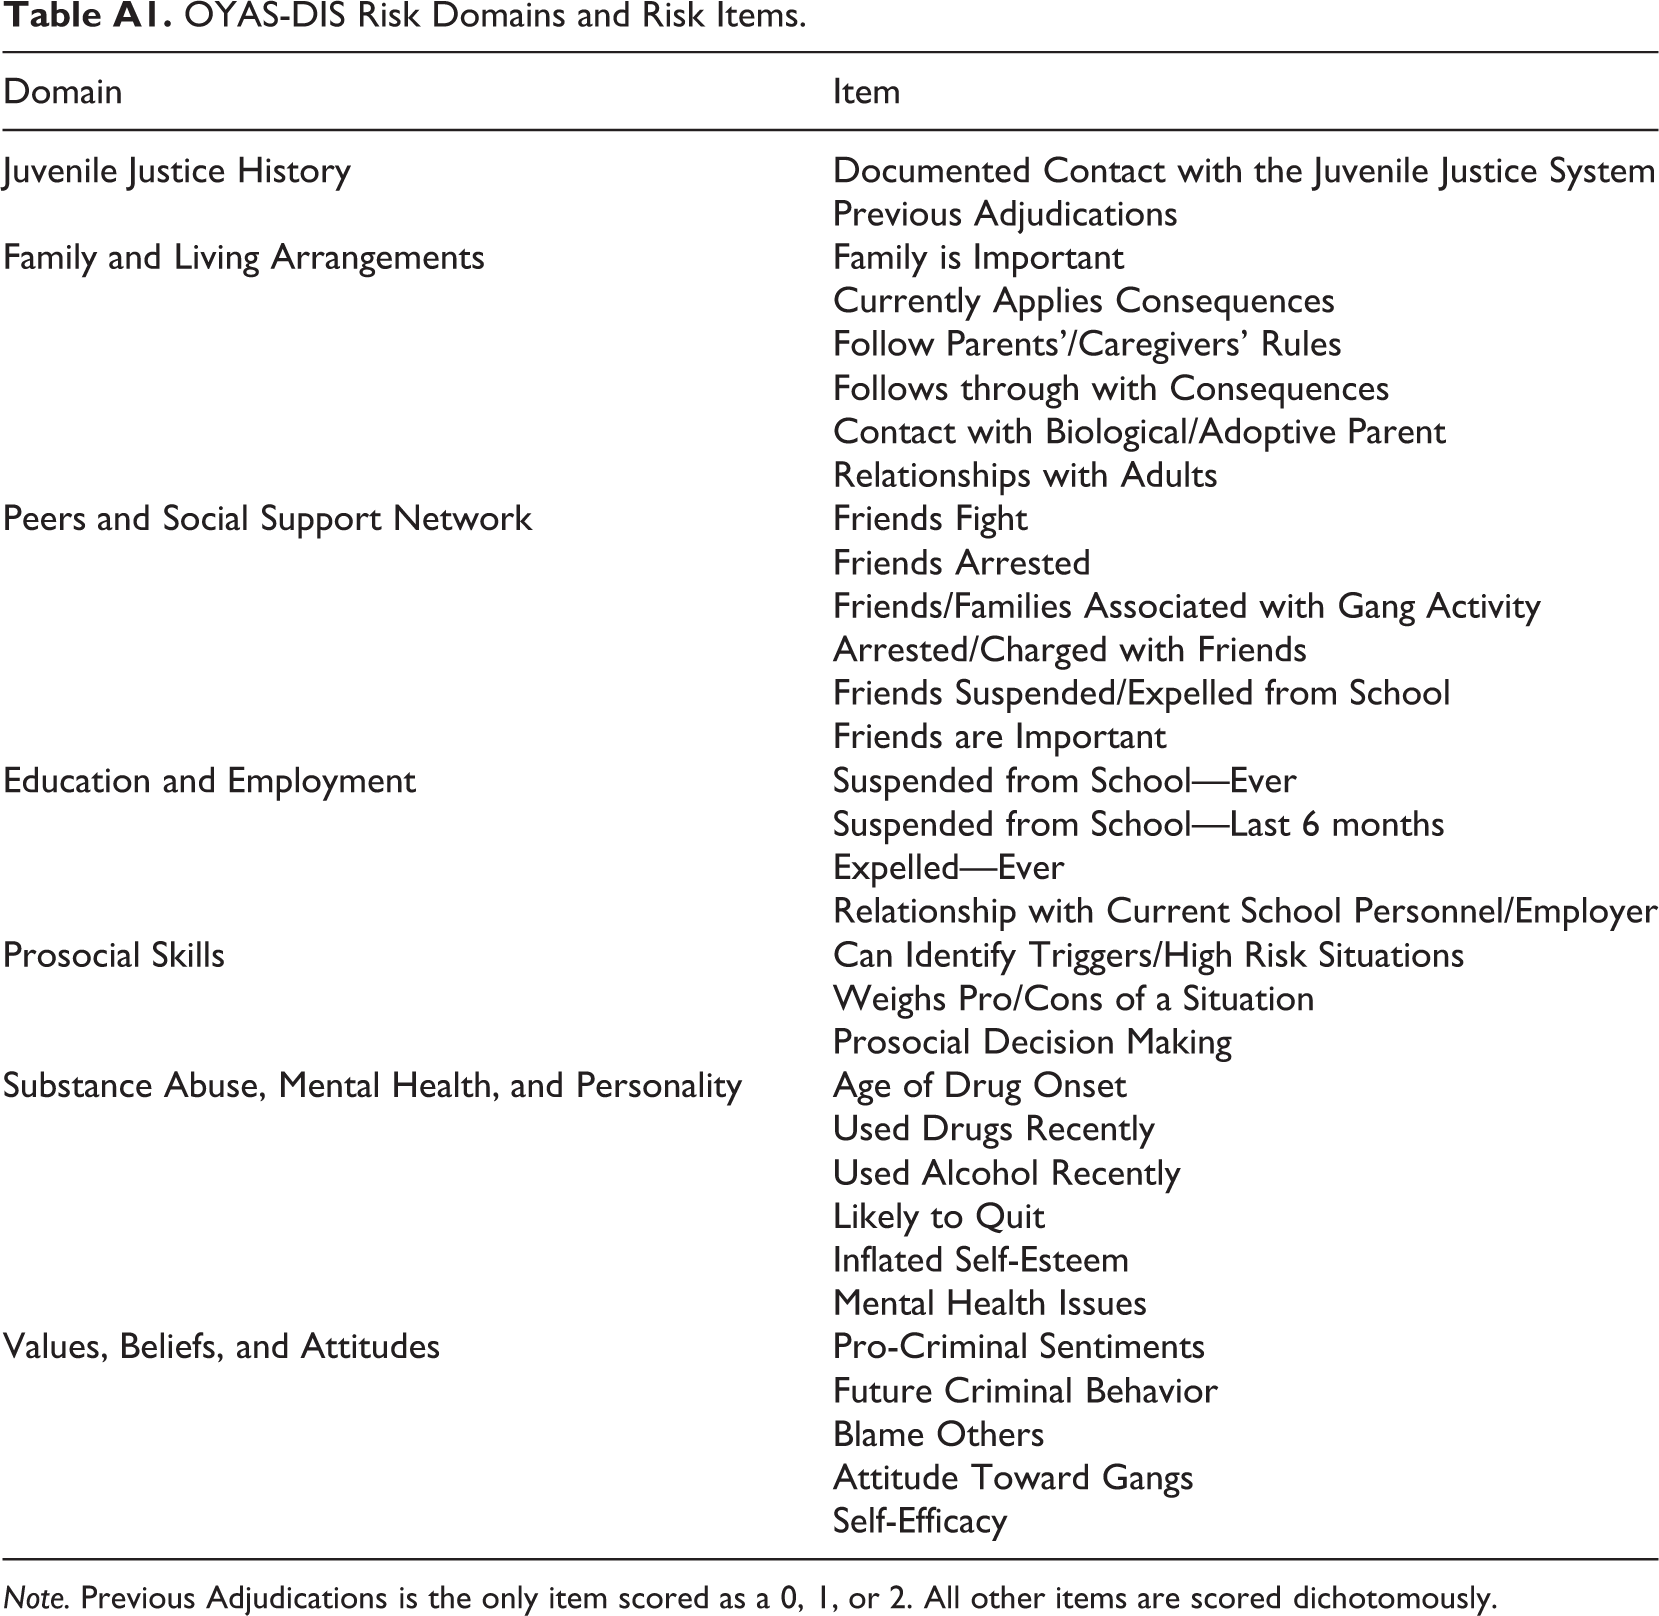
| Domain | Item |
|---|---|
| Juvenile Justice History | Documented Contact with the Juvenile Justice System |
| Previous Adjudications | |
| Family and Living Arrangements | Family is Important |
| Currently Applies Consequences | |
| Follow Parents’/Caregivers’ Rules | |
| Follows through with Consequences | |
| Contact with Biological/Adoptive Parent | |
| Relationships with Adults | |
| Peers and Social Support Network | Friends Fight |
| Friends Arrested | |
| Friends/Families Associated with Gang Activity | |
| Arrested/Charged with Friends | |
| Friends Suspended/Expelled from School | |
| Friends are Important | |
| Education and Employment | Suspended from School—Ever |
| Suspended from School—Last 6 months | |
| Expelled—Ever | |
| Relationship with Current School Personnel/Employer | |
| Prosocial Skills | Can Identify Triggers/High Risk Situations |
| Weighs Pro/Cons of a Situation | |
| Prosocial Decision Making | |
| Substance Abuse, Mental Health, and Personality | Age of Drug Onset |
| Used Drugs Recently | |
| Used Alcohol Recently | |
| Likely to Quit | |
| Inflated Self-Esteem | |
| Mental Health Issues | |
| Values, Beliefs, and Attitudes | Pro-Criminal Sentiments |
| Future Criminal Behavior | |
| Blame Others | |
| Attitude Toward Gangs | |
| Self-Efficacy |
Note. Previous Adjudications is the only item scored as a 0, 1, or 2. All other items are scored dichotomously.
Appendix B
Ohio Youth Assessment System Disposition (OYAS-DIS) Tool Risk/Need Level Within Each Domain.
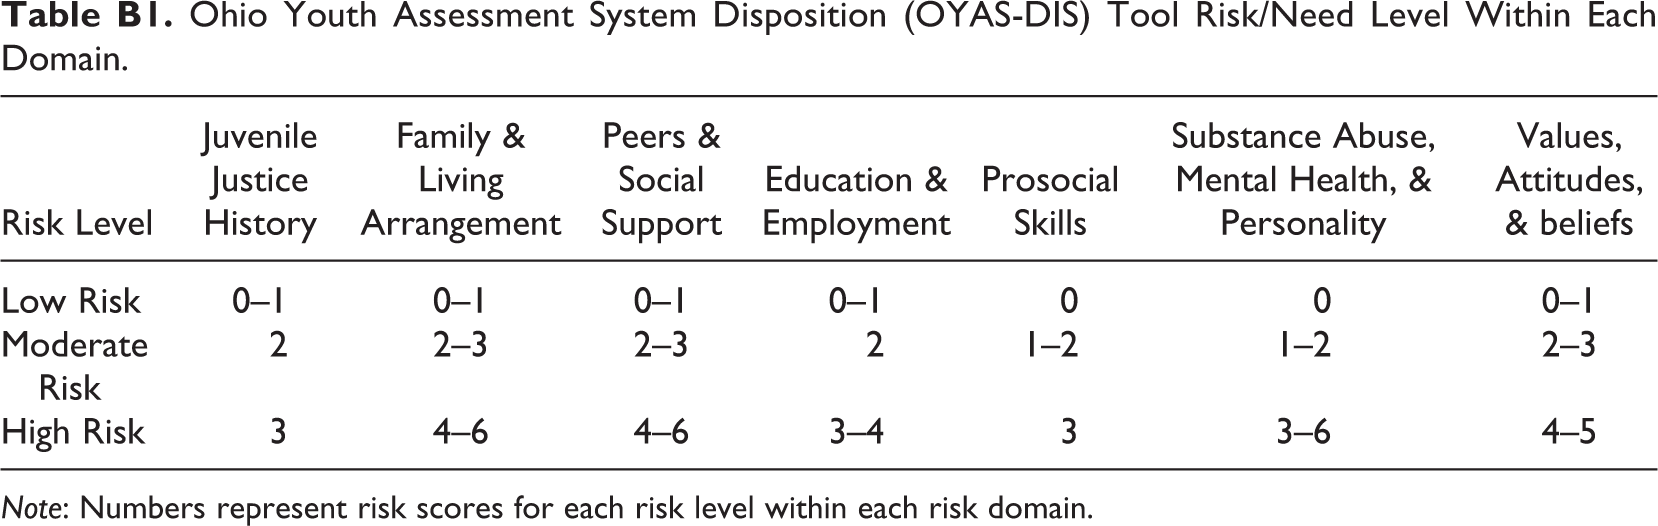
| Risk Level | Juvenile Justice History | Family & Living Arrangement | Peers & Social Support | Education & Employment | Prosocial Skills | Substance Abuse, Mental Health, & Personality | Values, Attitudes, & beliefs |
|---|---|---|---|---|---|---|---|
| Low Risk | 0–1 | 0–1 | 0–1 | 0–1 | 0 | 0 | 0–1 |
| Moderate Risk | 2 | 2–3 | 2–3 | 2 | 1–2 | 1–2 | 2–3 |
| High Risk | 3 | 4–6 | 4–6 | 3–4 | 3 | 3–6 | 4–5 |
Note: Numbers represent risk scores for each risk level within each risk domain.
Acknowledgments
This project was supported by Award No. 2016-R2-CX-0045, awarded by the National Institute of Justice, Office of Justice Programs, U.S. Department of Justice. The opinions, findings, and conclusions or recommendations expressed in this publication/program/exhibition are those of the author(s) and do not necessarily reflect those of the Department of Justice.
Declaration of Conflicting Interests
The author(s) declared no potential conflicts of interest with respect to the research, authorship, and/or publication of this article.
Funding
The author(s) disclosed receipt of the following financial support for the research and/or authorship of this article: This work was supported by National Institute of Justice (2016-R2-CS-0045).