
Abstract
The Ohio Youth Assessment System-Disposition Tool (OYAS-DIS) is a juvenile risk assessment that is used in numerous states and jurisdictions to assess criminogenic risk of juvenile offenders. Still, there is little published research on the predictive validity of the tool. The purpose of the current study was to examine the predictive validity of OYAS-DIS, with a specific focus on understanding prediction of recidivism across racial and gender subgroups. The sample consisted of 4,383 youth that received a court petition in a single large Midwestern county juvenile court. The findings indicated that the OYAS-DIS was a statistically significant predictor of recidivism across all racial and gender subgroups. However, there was statistically significant variation in predictive validity across subgroups. For instance, the tool was a statistically significantly better predictor of recidivism for White males as compared to Black male youth. There was also statistically significant variation in the predictive validity of certain domains (e.g., juvenile justice history) on the OYAS-DIS across racial and gender subgroups. Implications of research favor the use of the OYAS-DIS to predict recidivism for adjudicated juveniles.
Keywords
Juvenile offending has significantly decreased in last two decades; yet, there remain disparities across gender and racial groups in the arrest rates and processing practices of the juvenile justice system (Cochran & Mears, 2015; Office of Juvenile Justice and Delinquency Prevention [OJJDP], 2019). In fact, current reports suggest that the number of delinquency cases has decreased by 53% yet issues of racial disproportionality remains (OJJDP, 2016). For instance, Black individuals comprise roughly 16% of the youth population but 29% of delinquency caseloads in juvenile justice (Onifade, Davidson, & Campbell, 2009). Further, justice-involved female youth represent the fastest growing group of juvenile offenders (Chesney-Lind & Sheldon, 2004). Female youth accounted for roughly 20% of juvenile arrests in 1992, while recent research estimates this number is currently around 29% (Pusch & Holtfreter, 2018). Finally, there is also empirical evidence that suggests that there are disparities in the allocation of programs and services. Cochran & Mears (2015) found that justice-involved White male youth are more likely to receive rehabilitative services than female and minority youth. These findings point to a need to examine evidence-based strategies that address race and gender disparities that exist throughout juvenile justice system.
A common strategy juvenile justice agencies use to address disproportionality is incorporating modern juvenile risk assessment tools into their practices. In fact, some researchers have gone as far as saying that agencies who do not use risk assessments are unprofessional, unethical, or biased (Grove & Meehl, 1996; Quincey, Harris, Rice, & Cormier, 1998). This is because risk assessment tools serve many different functions for juvenile justice agencies and practitioners. For instance, risk assessments help replace the use of professional/clinical judgments by standardizing decision-making, informing agencies of potential risks and needs of youth, and assisting juvenile justice actors with making evidence-based program recommendations for the youth offenders (Bonta & Andrews, 2017). Most importantly, risk assessments have increased the ability for court actors to predict which youth offenders have the highest probability of recidivating. As a result, practitioners are better able to focus court resources on juveniles who are highest risk of future crime and exhibit the greatest level of intervention needs (Bonta & Andrews, 2017; Olver, Stockdale, & Wormith, 2009).
A current debate that continues is the extent to which risk assessments improve disparities that remain in the justice system. Overall, research is promising and suggests that the adoption of decision-making tools, like juvenile risk assessments, have potential to reduce disparities present in (or that occur as the result of) juvenile justice decision-making processes (Schwalbe, Fraser, Day, & Cooley, 2006). Modern day risk assessments that capture dynamic risks and needs have shifted practitioners’ focus from crime type to eight central factors or treatment areas (i.e., antisocial behavior, antisocial personality; cognition, peers, family, education, leisure recreation, and substance abuse) that reduce the likelihood of future delinquency. If risk assessments are fair and valid, risk assessment tools should reduce racial, ethnic, and gender biases that may occur in juvenile justice by increasing the reliability and consistency of assessing the risk of offenders through a standardized process (Schwalbe et al., 2006). The hope is that these instruments will correctly classify offenders by risk across all subgroups. However, evidence suggests that ethnic minorities and girls consistently experience disproportionality as the result of several policies and practices that may increase criminogenic risk (Liska, 1992; Schwalbe et al., 2006). Thus, it is through validation studies where theories can be expanded concerning how social factors, treatment decisions, and policies may threaten the validity of risk assessment tools.
Prior research has suggested that differences in social experiences of diverse populations may lead to differences in risk assessment score and predictive validity. As result, static factors related to criminal history or certain family characteristics may be both associated with certain subgroups and, in some cases, arbitrarily increase certain juveniles risk level (Moore & Padavic, 2011). Research has suggested that many juvenile risk assessment instruments do not take into account items that may uniquely impact girls or specific ethnic groups. In fact, studies have questioned the effect of trauma or abuse histories, poverty, potential neighborhood bias, school policies, education, policing practices, and depression on youth’s risk level (see Shepherd, Luebbers, & Dolan, 2013; Van Voorhis, Peiler, Presser, Spiropoulis, & Sutherland, 2001). Given there are several social factors that may impact recidivism beyond items measured by these tools, more research is needed to examine predictive validity across subgroups.
Predictive Validity of Risk Assessment by Race and Gender
Proponents of standardized risk tools believe that risk assessments should work in a race neutral manner (Bonta & Andrews, 2017; Latessa, Listwan, & Koetzle, 2014). However, there remain concerns about the extent to which these tools are a measure of racial inequities. For example, researchers have questioned the impact of surveillance and differential treatment on risk factors measured on assessment tools (e.g., criminal history). Studies have hypothesized that racial disparities, like disproportionate minority contact, are the result of racial minorities being targeted in ways that lead to increased reporting, arrests, referrals to the court, and biased case management practices (C. Campbell, Papp, Barnes, Onifade, & Anderson, 2018; Harcourt, 2015; Ryan, Williams, & Courtney, 2013). These mechanisms of differential treatment can exacerbate rates of recidivism and increase risk score, which can consequently reduce the validity of risk assessment tools.
A study conducted by C. Campbell, Papp, Barnes, Onifade, and Anderson (2018) found that the Youth Level of Service/Case Management Inventory (YLS/CMI) was slightly stronger predictor of recidivism for White youth probationers as compared to Black youth probationers, although there were no differences in criminogenic risk scores of White and Black probationers. Although the YLS/CMI was a significant predictor of recidivism over and above chance across both racial groups, some differences remained concerning the tools ability to differentiate across low-, moderate-, and high-risk Black offenders (C. Campbell et al., 2018). Furthermore, Onifade, Davidson, and Campbell (2009) found that while the YLS/CMI moderately predicted recidivism across a diverse sample of juvenile probationers (Black and White male and females), the tool demonstrated better predictive validity for White juveniles than Black juveniles. According to Schwalbe, Fraser, Day, and Cooley (2006), risk assessments have the potential to underestimate intervention needs as well across race. Schwalbe et al. (2006) found that when using the North Carolina Assessment of Risk (NCAR), Black youth scored and recidivated at significantly higher rates than White youth. Further, while NCAR predicted recidivism (measured as new adjudication) moderately well for both Black and White youth, it underpredicted Black youths’ recidivism. Conversely, studies conducted by Barnes et al. (2015) on the YLS/CMI and Baglivio and Jackowski (2012) on the Positive Change Achievement Tool found no substantive differences in the predictive validity of a juvenile receiving a new petition across race classifications. Thus, based on previous research, there appears to be some inconsistencies concerning the extent to which risk assessments can remain equitable across racial groups.
Similar to race, there has been mixed findings in regard to the predictive validity of risk assessment across male and female offenders. Some studies have demonstrated that certain risk domains commonly included in risk assessment differentially affect females compared to males. For example, Anderson et al. (2016) found that all domains in the YLS/CMI significantly predicted recidivism for males, while only family and personality significantly predicted recidivism for females. Similarly, Schwalbe et al. (2006) found the NCAR predicted recidivism better for males than females. Further, the C. Campbell et al. (2018) found significant interactions between gender and risk score, such that Black males were at increased risk of recidivism, although there were no differences in criminogenic risk of Black and White males. On the other hand, there still remains studies that are promising concerning the extent to which risk assessments can remain gender neutral and equitable across male and female offenders. For example, studies have found no substantial differences in the predictive validity of risk assessments across gender (Baglivio & Jackowski, 2012; Barnes et al., 2015). In fact, two recent meta-analyses suggest that risk assessments are significant measure of recidivism regardless of gender (Pusch & Holtfreter, 2018; Schwalbe, 2008). However, given the potential interaction of sociodemographic factors, the current study will examine validity of the Ohio Youth Assessment System (OYAS) accounting for both race and gender classifications.
The OYAS
One juvenile risk assessment tool that has attempted to address racial and gender disparities is the OYAS. Before the introduction of the OYAS, 77 different assessment tools were used across the 88 counties in Ohio. Now, some 39 counties across the state of Ohio use the OYAS. The OYAS was created based on the risk–need–responsivity (RNR) model as well as research that informed the creation of the YLS/CMI risk assessment tool (see Bonta & Andrews, 2017; Gendreau, Little, & Goggin, 1996; Schmidt, Hoge, & Gomes, 2005). However, the OYAS is unique in that it was designed to improve decision-making at various points of the juvenile court process. As result, the development of the OYAS involves five unique assessments, which were designed to assess youth at different stages of the juvenile justice system (Latessa, Lovins, & Ostrowski, 2009). These five tools are the OYAS-Diversion, OYAS-Detention, OYAS-Reentry, OYAS-Residential, and the OYAS-Disposition (OYAS-DIS). The OYAS-DIS tool is the focus of the current study.
While the OYAS-DIS is used by juvenile justice courts in its birthplace, Ohio, its use is quickly expanding. Presently, the OYAS has been adopted and adapted by juvenile jurisdictions in Indiana, Kentucky, Arizona, Texas, and California. The OYAS-DIS is administered to youth offenders after they have been adjudicated by a juvenile court (Lovins & Latessa, 2013). To assess the risk of recidivism, it uses a mix of empirically validated static and dynamic risk and need factors that can be used to match each youth to individually appropriate interventions. Although the OYAS-DIS has increased the juvenile justice systems’ ability to predict recidivism through the manner of identifying empirically linked risk and need factors of youth, questions remain concerning if the OYAS can identify risks and needs equally across race and gender (McCafferty, 2016). Given the widespread nature of its use, and the fact that interest in the OYAS-DIS is increasing, investigation of these issues is of great importance.
If the OYAS-DIS does not accurately consider all factors that may influence the likelihood of recidivism for different races and genders, then it may over- or underestimate the chance of recidivism for specific subgroups. This issue would be quite problematic, as the inability of the OYAS-DIS to account for potential gender or racial differences would indicate the tool is not successful in achieving an important goal of risk assessment—standardization. Further, if the OYAS-DIS were found to be inaccurately assessing the risk of certain youth, then this would indicate issues with the consistency and reliability of the tool’s estimates of each youth’s risk. Moreover, if gender or racial differences in classification are present, then it could mean that use of the OYAS-DIS has the potential to perpetuate disparities in the justice system by consistently inflating the risk of certain subgroups. Conversely, this tool could also improve or reduce disparities commonly observed across race and gender. For example, these tools can reduce the ability of practitioners to exhibit implicit or explicit biases during decision-making processes. The limited understanding of this tool in this context creates a need to examine the predictive validity of the OYAS-DIS across a diverse population of youth.
There is some promising research on the predictive validity of the OYAS-DIS based on some initial validation studies (Lovins & Latessa, 2013). Further, a revalidation of the OYAS-DIS found that the tool can predict recidivism moderately well across different types of samples and counties (McCafferty, 2013, 2016). McCafferty (2018) conducted a preliminary examination of its predictive validity across race and found that the tool predicted recidivism similarly for both Black and White youth. However, the study also found that the tool had slightly higher prediction error for Black juveniles than for White juveniles. Therefore, McCafferty (2018) concluded that these results indicated the potential for some, but limited, racial disparities existing within the OYAS-DIS.
Overall, the OYAS-DIS is an understudied juvenile risk assessment measure compared to other youth assessment tools, such as the YLS/CMI, NCAR, Arizona Risk/Needs Assessment, and the Structured Assessment of Violence Risk, which have been examined in many individual studies as well as meta-analyses (Olver et al., 2009; Pusch & Holtfreter, 2018; Schwalbe, 2008). While McCafferty (2018) took a preliminary look at this tool, it is vitally important to continue to understand how well this tool is working for youth across both race and gender. The current study examined a sample of Black and White male and female youth who were assessed by the OYAS-DIS during adjudication to examine whether the tool predicts recidivism consistently across juveniles and whether there were significant differences in the risk–recidivism relationship.
The present study answers the following questions: (1) How do the OYAS-DIS criminogenic risk total score and domain scores differ across race and gender?
(2) How well does the OYAS-DIS predict recidivism across race and gender, and how do the risk–recidivism relationships between the racial and gender subgroups differ?
Method
Participants
Data were collected from a sample of youth in the delinquency division of a juvenile county court in the Midwest. Table 1 presents the descriptive statistics of the 4,363 youth that were included in this study. Just over half of the sample was Black males (50.9%). The next largest demographic group was White males, which made up about 23.9% of the sample. Black females comprised 13.2% of the sample, while White females comprised the smallest portion of the sample at 6.9%. In addition, the average age of the sample was 15.59 years (SD = 1.53). Across demographic subgroups, there was a substantively small (albeit statistically significant) amount of variation across age (p < .01). About .31 years separated White males were the oldest youth in the sample by about 3.5 months. White males had an average age of 15.71. Black females were the youngest subgroup of juveniles in the sample. Black females had an average age of 15.40.
Descriptive Statistics for Total Sample and Across Race and Gender.
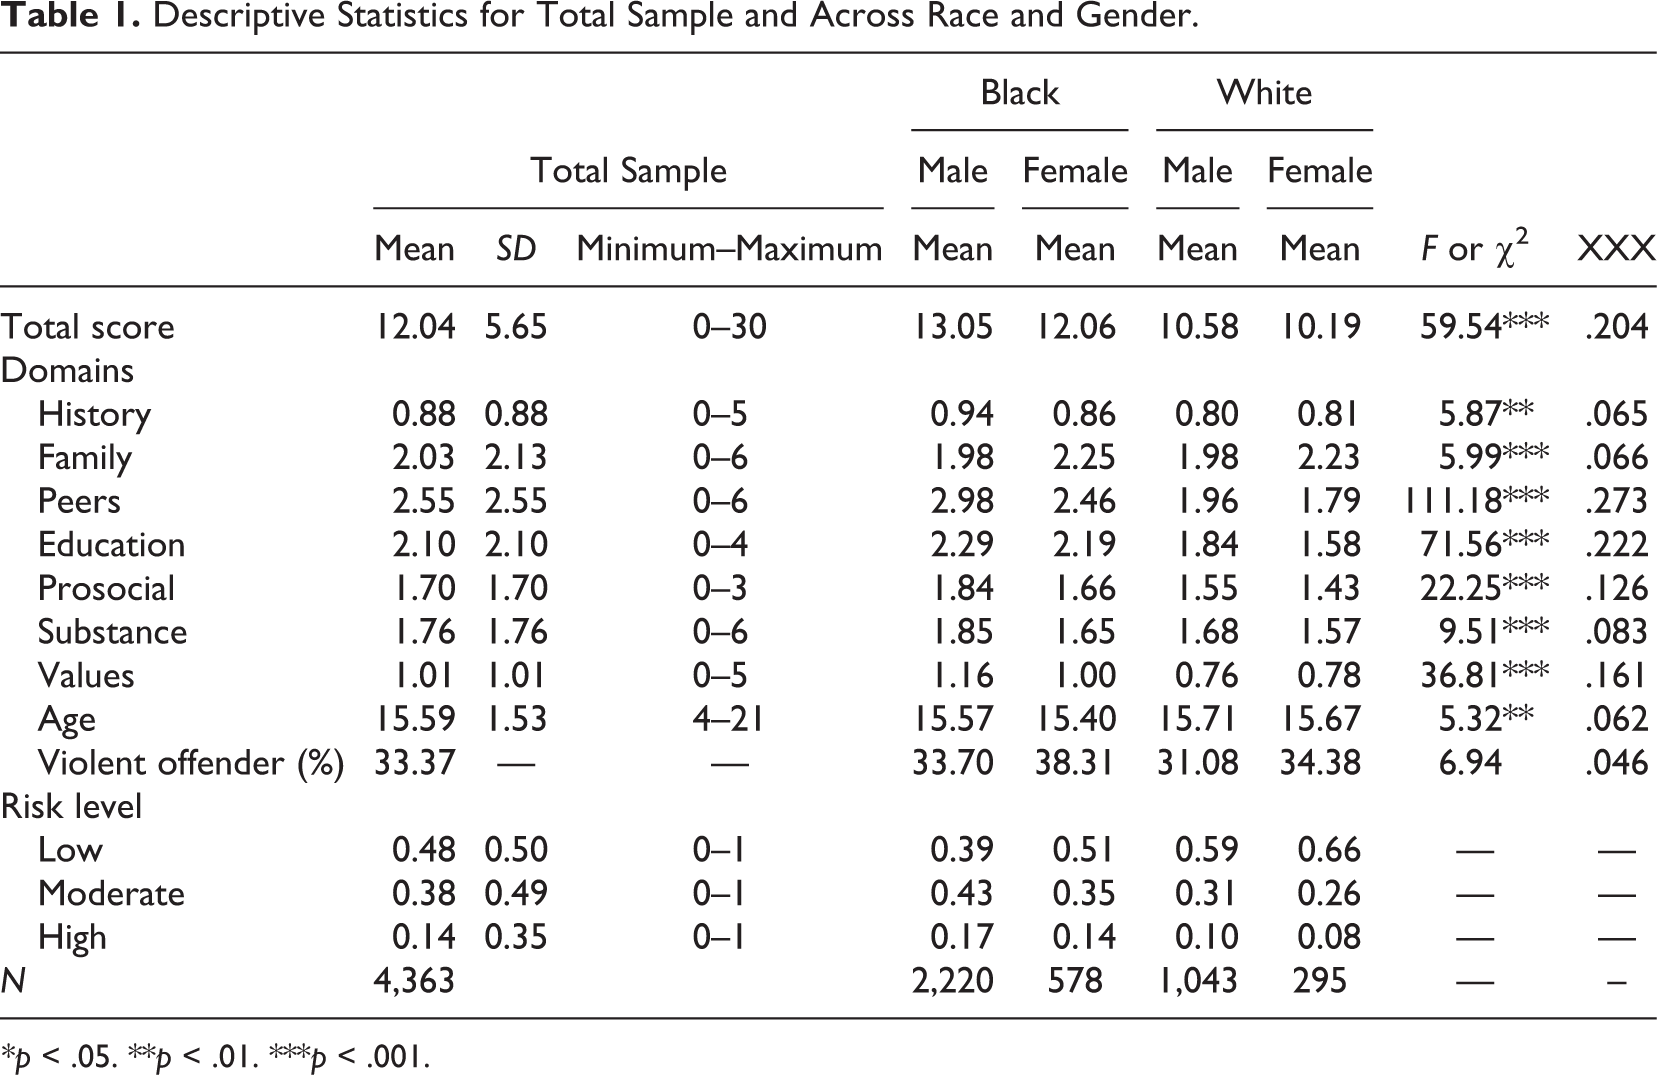
*p < .05. **p < .01. ***p < .001.
It is also important to point out that based on the risk level of the OYAS-DIS; this sample was a relatively low-risk group of youth. This is evidenced by the fact that nearly half (48%) of the sample fell into the low-risk category of the OYAS-DIS, while 38% fell into moderate risk, and only 14% fell into high risk. Finally, it is worth noting that there was no statistically significant variation across demographic subgroups in terms of violent offenders (χ2 = 6.94; p = .09); the rate of youth charged with violent offenses was distributed evenly across race/gender subgroups.
Measurement
Dependent variable
Recidivism
An advantage of the current study is that recidivism was operationalized in two ways: (1) a new court petition within 2 years of the OYAS-DIS assessment and (2) a new adjudication within 2 years of the OYAS-DIS assessment (each measured as a dichotomy). This is advantageous due to existing debate regarding the best way of defining recidivism (Harris, Lockwood, & Branch, 2011). A petition is a written document that is filed in court seeking intervention or action into some matter. Therefore, court petitions charge youth of committing a crime in juvenile court. Various individuals can initiate a petition with this county. Court petitions can take place as result of a prosecutor, police officer, school official, family member, or victim. A court petition becomes a conviction if a youth is adjudicated delinquent by a juvenile court. These two events constitute two separate variables measuring recidivism in this study one for a new petition and one for a new adjudication.
The determination to use a 2-year follow-up period was based on information relating to the overall length of the study and missing data. Youth in this study had varying follow-up periods due to the fact that they came into the study at different times. Making a cutoff point to measure recidivism was necessary to create an even follow-up period for all youth. Two years was chosen as the cutoff because this created a tolerable amount of missing data on recidivism (<10%) while also maintaining a period of time lengthy enough to capture a substantial portion of most recidivism (Latessa et al., 2013).
The advantage of having multiple measures of recidivism is that it allows for results to be compared and contrasted across the different forms of measurement. If all of the findings converge on the same general conclusion, then it greatly increases confidence in the results. The specific benefit of measuring recidivism as a new petition and as a new adjudication is that these capture offending behavior recorded at different stages of the juvenile justice system. For instance, the filing of a new petition is an event that occurs upstream in the juvenile justice system relative to an adjudication. This means that there are more likely to be false positives for new petition. For instance, a court petition is only an allegation of a crime. This can create false positives where it appears as though a youth reoffended, when they actually did not. Conversely, there are more likely to be false negatives for new adjudication. Measuring recidivism as a new adjudication filters out crimes that occurred but were never formally adjudicated. With the limitations of each of these measures of recidivism in mind, the findings from examining these measures separately greatly improve our understanding of the relationship between the variables of interest and reoffending behavior.
Independent variables
Youth demographics
Court personnel collected demographic information for the present study at the outset of the assessment. This usually included the officer who conducted the OYAS-DIS assessment. Specifically, court personnel collected self-reported information relating to age, race/ethnicity, and gender. Youth reported their race (Black, White, Asian, American Indian, and Other), ethnicity (Hispanic or non-Hispanic), and gender (not their biological sex).
Violent offense
A youth’s committing offense that led to their assessment was coded as violent or nonviolent for descriptive purposes. Violent offenses included any acts against another person that were violent in nature, meaning they caused, or had the intent to cause, physical harm to the victim. All other offenses were classified as nonviolent. It is also important to note that multiple charges were filed against some youth. In these cases, the offense coded for the purposes of this variable was the most serious offense that a youth committed.
OYAS-DIS
The OYAS-DIS is an actuarial risk assessment tool that was designed to be used postadjudication in juvenile court. For the jurisdiction in question, a trained juvenile probation officer administers the OYAS-DIS. All practitioners who use the OYAS-DIS are required to attend a 2-day training program, at the end of which they must pass a final exam in order to be certified. This exam tests their knowledge about the tool and risk assessment more generally as well as their ability to successfully score the OYAS-DIS after watching an interview with a fictitious offender.
The OYAS-DIS is scored using multiple sources of information. These include a face-to-face interview (based on a structured interview guide supplied by the creators of the tool), a self-report survey that is filled out by the interviewee, and a review of file information available from the court (or another agency). The self-report questionnaire asks youth information that is relevant for scoring all of the items in all of the domains on the OYAS-DIS. This is done to add to the information that is gathered during the face-to-face interview and allows users of the OYAS-DIS to cross-check the information gathered from these different sources. The self-report questionnaire can also be used to fill in any information or clear up uncertainties that remain after the face-to-face interview.
The OYAS-DIS is comprised of 32 items that assess criminogenic risk across seven domains. All but 1 of these 32 items is scored dichotomously (the one that is not is a trichotomy). The seven domains include (1) juvenile justice history; (2) family and living arrangements; (3) peers and social support network; (4) education and employment; (5) prosocial skills; (6) substance abuse, mental health, and personality; and (7) values, beliefs, and attitudes. The primary purpose of the tool is to assess criminogenic risk of reoffending and to identify needs areas, which can be targeted through intervention. Once all items are scored, they are summed to create a total score as well as individual domain scores. The total score is used to determine the risk level assigned to each youth. Cutoff scores categorize the total score into one of three categories: low, moderate, or high risk. Cutoffs for the total score differ for males and females. The cutoffs for males are low risk = 0–11, moderate risk = 12–18, and high risk = 19–33. In comparison, the cutoffs for females are low risk = 0–12, moderate risk = 13–18, and high risk = 19–33.
Procedure
Archival risk assessment and recidivism data were used from a single large Midwestern urban county juvenile court. Records collected by the court between January 1, 2010, and December 31, 2016, were included in the current study for all youth that received a petition in court during that field period and subsequently were assessed using the OYAS-DIS. It should also be noted that the current study includes only records from a youth’s first contact with the court during the study period. Any follow-up assessments were excluded.
For this project, all court records were collected that related to youth demographics, OYAS-DIS risk assessment data, charges filed against youth, court dispositions, and recidivism. Data were deidentified and all study procedures were approved by the authors’ institutional review board, which provided oversight in the protection of participants.
Results
First, a series of analysis of variance (ANOVA) and χ2 analyses were used to examine variation in the OYAS-DIS total score, each of the seven domains, age, and the proportion of violent offenders across the interaction of race and gender. Race and gender were combined to create an interaction term with the following subgroups: Black males, White males, Black females, and White females. Therefore, the ANOVAs and χ2 presented in Table 1 examine the bivariate relationship between race/gender and all of the other variables in the table. The results in Table 1 show that statistically significant variation is present across the total score, all seven domains, and age (all at least at p < .01). However, there is no substantial variation in the proportion of violent offenders across race and gender. In addition, the final column of Table 1 presents
It is important to note that beyond this point only the results in terms of recidivism measured as a new petition will be discussed. The findings for recidivism measured as a new adjudication are also provided in Tables 2 –4. To summarize, the general conclusion that can be made from the results on new adjudications is that the interpretation of the findings as compared to the findings for new petitions do not change. Therefore, these results are provided as evidence of confirmation of what will be discussed.
Proportion of Recidivists Across Risk Level by Race and Gender.
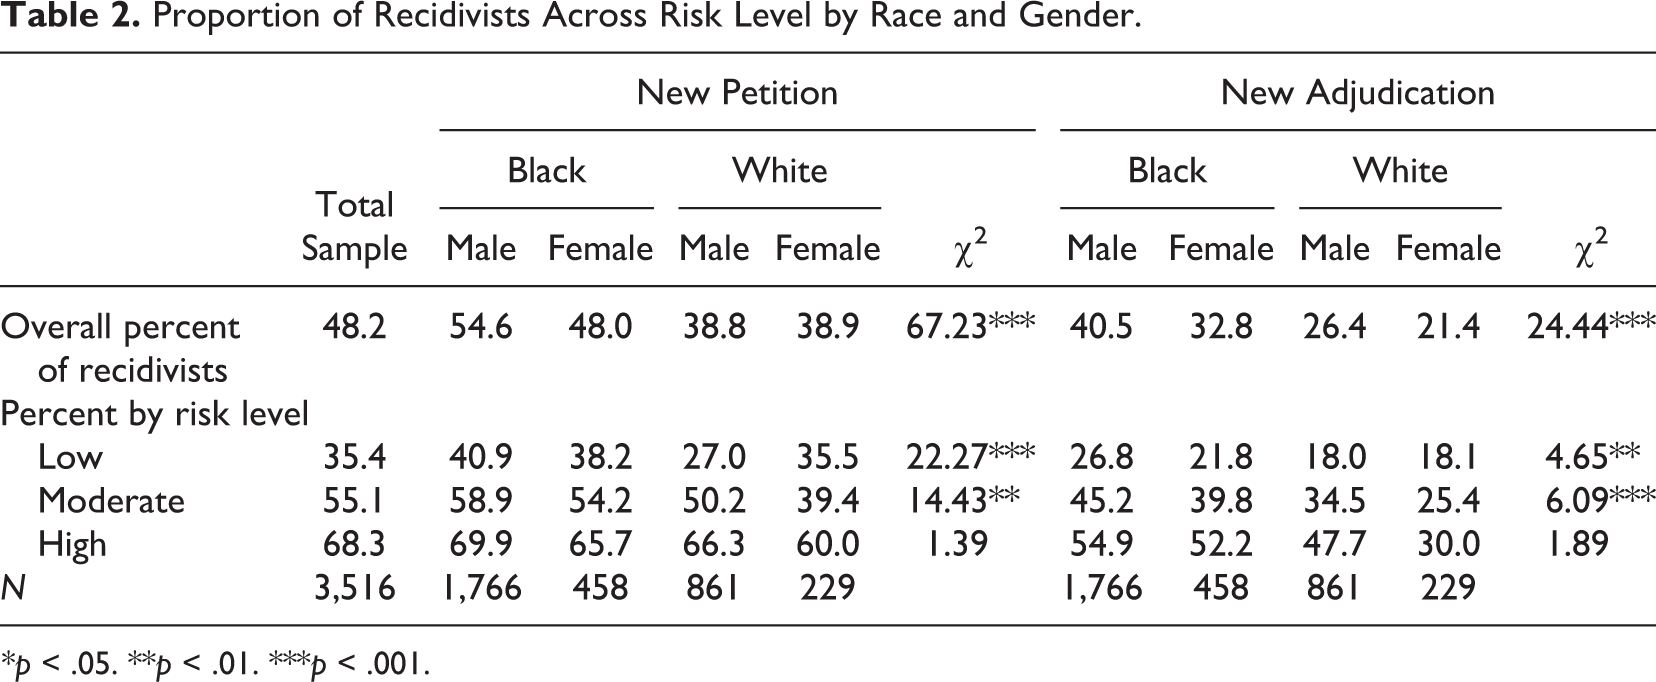
*p < .05. **p < .01. ***p < .001.
Area Under the Curve (AUC) Statistics for Total Sample.

Note. AUC = area under the curve; CI = confidence interval.
All values are significant at a p < .001.
AUC Statistics for Subgroups of Race and Gender by New Adjudication.
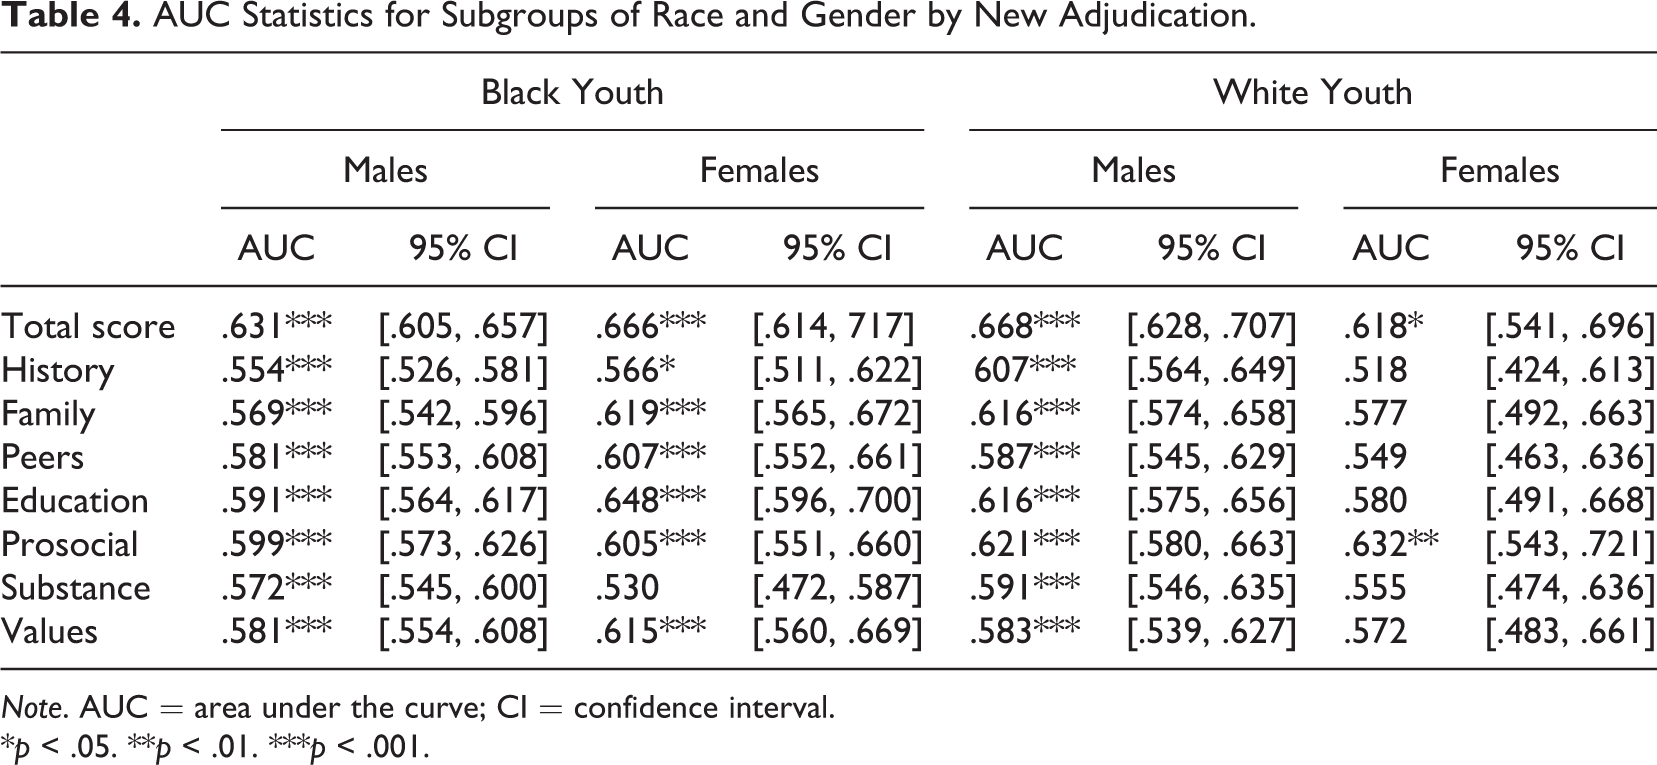
Note. AUC = area under the curve; CI = confidence interval.
*p < .05. **p < .01. ***p < .001.
The data in Table 2 present the recidivism rates across risk levels of the OYAS-DIS by race and gender and for the total sample. As can be seen from the first row of results in this table, 48.2% of youth in the sample received a new court petition within 2 years of their initial offense. When examining new petition rates by race/gender, Black males were the most likely to receive a new petition (54.6%), while White males were the least likely (38.8%). White females fell just above White males (38.9%) and Black females (48.0%) above White females. Inspection of new petition rates across risk level tell a similar story, with Black males having the highest recidivism rate across all three risk levels (40.9% for low risk, 58.9% for moderate risk, and 69.9% for high risk). In addition, White females had the lowest new petition rates within the moderate- (39.4%) and high-risk (60.0%) categories, whereas White males had the lowest new petition rate for the low-risk category (27.0%). What is more, the χ2 results in the last column of this table show that there was statistically significant variation in the proportion of recidivists across racial and gender subgroups. For instance, there was statistically significant variation when examining the overall proportion of recidivist (χ2 = 67.23; p < .001), low-risk subsample (χ2 = 22.27; p < .001), and moderate-risk subsample (χ2 = 14.43; p < .01).
As shown in Table 3, a series of area under the curve (AUC) statistics were estimated to understand the general predictive validity of the OYAS-DIS. The AUC statistic of .655 suggests that the predictive validity of the OYAS-DIS is on par with other widely used juvenile risk assessment tools (Olver et al., 2009; Schwalbe, 2008). This statistic can be interpreted to mean 65.5% of random draws of a recidivist and a nonrecidivist in the sample, the recidivist will score higher on the OYAS-DIS. Among the individual domains of the OYAS-DIS, the education domain shared the strongest association with new petition (AUC = .634), while the juvenile justice history domain shared the weakest association (AUC = .562).
Table 5 presents a set of AUC statistics that were estimated to examine differences in the predictive validity of the OYAS-DIS across race and gender. The results in this table show that the OYAS-DIS was best at predicting a new petition for White males (AUC = .682) and worst for White females (AUC = .623), with Black males (AUC = .630) and Black females (AUC = .632) falling just above White females. While there is variation in the AUC scores between subgroups, there is significant overlap in the 95% confidence intervals (CIs) between subgroups. This suggests that the variation between AUC scores is not large (Cortes & Mohri, 2005), such that the tool had relatively equal predictive validity across all subgroups. To further explore these differences, a series of Z-statistics were estimated to examine whether there were statistically significant differences in point estimates across race/gender subgroups. These analyses indicated the total score shared a statistically significantly stronger relationship with receiving a new petition for White males than for Black males (p < .05). The Z statistics were also estimated for new adjudications. The results returned no statistically significant differences, but the difference between Black and White males approached statistical significance (p = .06). Finally, examining the AUCs by OYAS-DIS domain showed that there is some variation in predictive validity across race/gender. For instance, the domains of juvenile history, peers, and substance use were statistically significantly better predictors for White males as compared to Black males (p < .05). Also, juvenile justice history was a statistically significantly better predictor for White males as compared to Black and White females.
AUC Statistics for Subgroups of Race and Gender by New Petition.
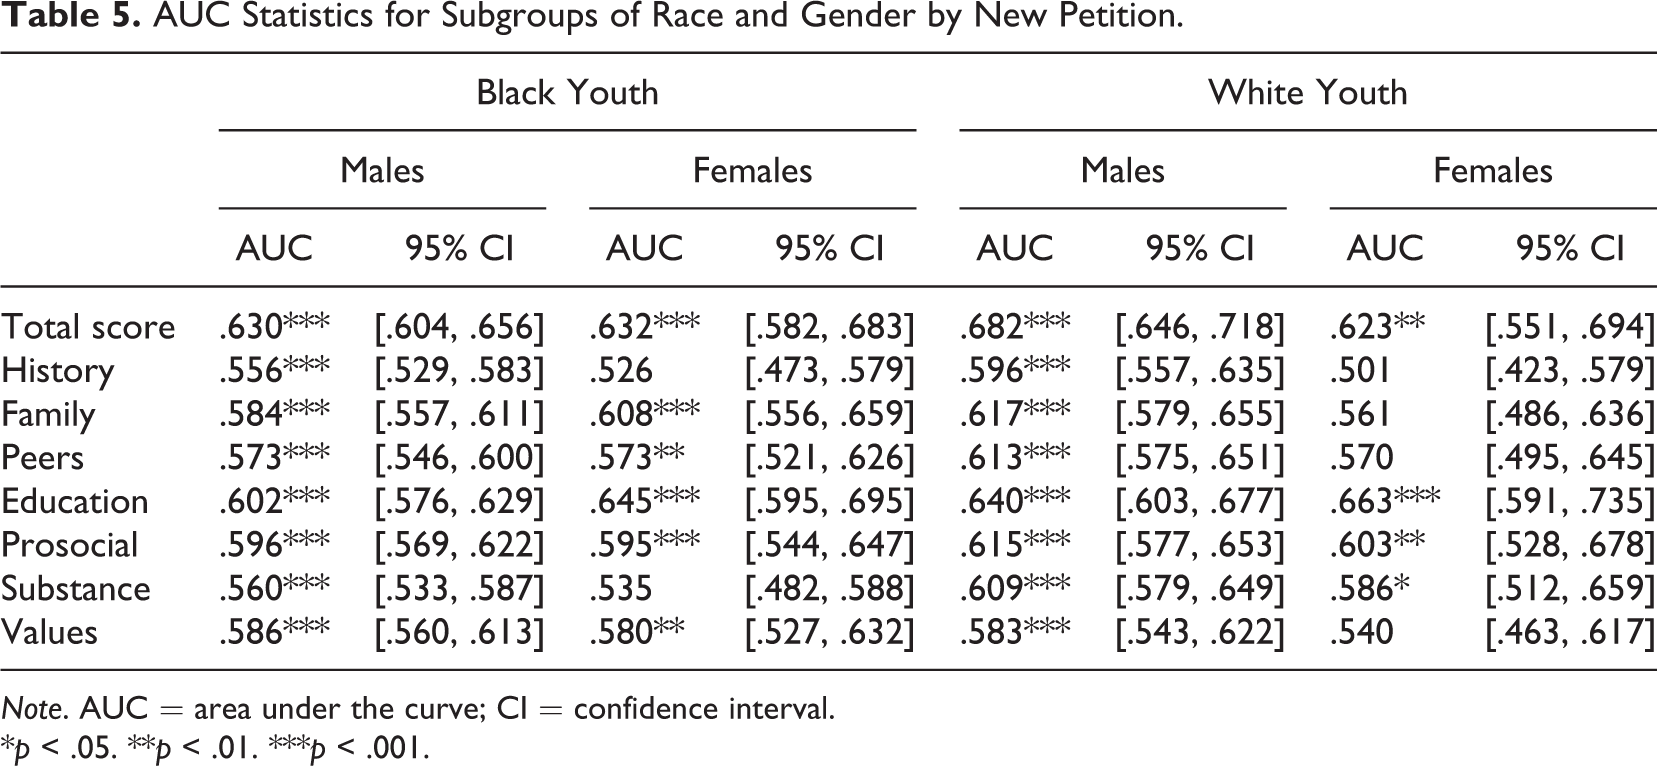
Note. AUC = area under the curve; CI = confidence interval.
*p < .05. **p < .01. ***p < .001.
Table 5 also shows important findings related to the predictive validity of each individual domain. These findings show that many of the items share a weak association (less than .6) with recidivism. In fact, for some subgroups, several domains are not statistically significantly predictive of recidivism. For instance, criminal history and substance abuse were not statistically significant predictors of recidivism for Black females. In addition, criminal history, family, peers, and values were not statistically significant predictors of recidivism for White females. These relatively weak relationships are consistent with past risk assessment research which shows that in isolation, these predictors are often found to only provide modest predictive validity, but their ability to predict is improved when combined with other known risk factors, such as in the case of creating a total score (Bonta & Andrews, 2017).
Discussion
The purpose of the present study was to (1) explore criminogenic risk profiles as measured by the OYAS-DIS across gender and racial subgroups of youth and (2) examine the predictive validity of the OYAS-DIS across race and gender. Based on findings from past research, it was hypothesized that (1) there would be statistically significant variation in criminogenic risk profiles and (2) predictive validity would vary across race and gender (C. Campbell et al., 2018).
OYAS Criminogenic Risk Profiles Across Subgroups
Several findings support the first hypothesis. For instance, average score of the total score and all domains of the OYAS-DIS varied statistically significantly across racial and gender subgroups. The largest difference observed was between Black males and White females. Moreover, the results demonstrated that Black male youth in this sample were most likely to reoffend at all risk levels, while White males were least likely to recidivate at the low-risk level and White females were the least likely to recidivate at the moderate- and high-risk levels. In general, findings suggest that there are some variation level of intervention needs across subgroups examined.
These findings are similar to studies conducted by Onifade and colleagues (2009) and Schwalbe and colleagues (2006), as these studies also found statistically significant differences in risk scores and recidivism rates among subgroups of race and/or gender. These differences raise the obvious question of the sources of these differences. C. Campbell and colleagues (2018) suggested several explanations for such differences. First, ecological factors that go unmeasured on most risk assessments could contribute to differences in criminogenic risk. Second, differential supervision by law enforcement may lead to higher recidivism rates for minorities because of increased opportunity to detect crime. Third, severity of adjudication decisions or different dispositions provided in court could potentially moderate predictive validity by systematically increasing a certain group of youth’s involvement with the justice system.
OYAS Predictive Validity Across Subgroups
The second research hypothesis (i.e., differential predictive validity) was also supported. The total score of the OYAS-DIS was a statistically significant predictor of recidivism for all subgroups of youth (AUC = .655; p < .001), indicating that the tool predicted all youth’s risk of recidivism significantly better than chance. Further, looking at the subgroups of race and gender separately, the total score of the OYAS-DIS remained a statistically significant predictor recidivism for all subgroups. However, variation in the tools validity across subgroups did appear, as the rank order of AUC scores indicated the validity of the tool was highest for White males (AUC = .682; p < .001) and lowest for White females (AUC = .623; p < .01), with Black male (AUC = .630; p < .01) and Black female (AUC = .632; p < .001) youth falling in between. However, the substantial nature of this variation was minor. The CIs of the AUC scores overlapped for all subgroups, indicating the tools predicted recidivism relatively equally across all four subgroups. However, Z scores did indicate a statistically significant difference (p < .05) in AUC scores between Black and White males, indicating the tool predicted recidivism better for White males than it did Black Males. Thus, the tool predicted recidivism relatively equally for White males, Black females, and White females. However, there was a statistically significant difference in predictive validity between Black and White males, but the difference appears to be a moderate one. On one hand, this is encouraging for the tools ability to predict risk across racial and gender subgroups, demonstrating that the OYAS-DIS is accounting for potential differences between subgroups moderately well. On the other hand, the statistically significant differences between Black and White males cannot be all together ignored, especially if differences are in part due to differential treatment. Although differential treatment in sanctions and case management was within the scope of the current study, examining such nuances may expand our understanding of risk assessment algorithms. Most importantly, this study supports the implementation of risk assessment tools and the utilization of such tools to further track and evaluate possible subgroup biases that may remain within courts.
These findings are consistent with prior research, as there seems to be moderately significant difference in the risk–recidivism relationship with total score for White males as compared to Black males in this sample (C. Campbell et al., 2018). These differences are potentially due to the fact that the majority of studies used to form risk assessments were based on samples of White males and early risk assessment theories and tools were not necessarily created with girls and/or ethnic minorities in mind (Smith & Campbell, 2018). Additionally, the present findings may indicate that certain risk factors may differentially predict recidivism across Black and White males or that the OYAS-DIS is missing risk factors that would improve equitability of prediction. For example, environmental factors, such as family income or neighborhood characteristics, may change how certain risk factors affect a youth’s likelihood of recidivism. Another potential reason for these differences is that some research has suggested youth from different backgrounds experience different pathways toward delinquency (Shepherd et al., 2013). Future research should examine environmental factors, policies, practices, and programming that may interact with risk factors identified on the OYAS-DIS.
As stated above, the variation in the predictive validity of the tool between subgroups, specifically Black and White males, cannot be ignored altogether. The rank order of the AUC scores as well as the statistically significant Z score do indicate some variation between subgroups. Examining the results more closely, this variation appears to form from the low- and moderate-risk youth. There is significant variation among the recidivism rates for the low- (χ2 = 22.27; p < .001) and moderate-risk youth (χ2 = 14.43; p < .01) in this sample, but not for the high-risk youth (χ2 = 1.39; p > .05). Thus, it appears as if the OYAS-DIS does not have issues with subgroup disparity in predicting recidivism for high-risk youth but may have issues with subgroup disparity in predicting recidivism for low- and moderate-risk youth. Thus, the variation that is observed in AUC scores may be attributed to some nuanced differences between racial and gender subgroups that the OYAS-DIS cannot account for when it comes to predicting recidivism for low- and moderate-risk youth.
The results further indicated variation in the predictive validity across certain domains as well as differences in the predictive validity across subgroups. For example, the education domain provided the strongest predictive validity of the domains (AUC = .632), and juvenile history provided the weakest predictive validity of the domains (AUC = .562). It is not surprising that education was one of the strongest predictors of future recidivism. The OYAS-DIS educational items focus on behavioral risk factors (e.g., behaviors that may lead to suspicion or expulsion) and the quality of relationships and interactions with teachers and school personnel. These findings are not surprising given research on the school to prison pipeline suggests that policies that involve or lead to expulsion and suspension has played a significant role in the school to prison pipeline (Wilson, 2014). Studies have found aggression or behavioral items to have the strongest impact on recidivism (Anderson et al., 2016; McCafferty, 2016). However, it is important to consider the role structural and evironmental factors play in behavior and social experiences. Moreover, C. Campbell et al.(2014) did a study on creating a short-form version of the YLS/CMI by removing items deemed extraneous to prediction. Education items were identified among the most important predictors of recidivism for this abbreviated version of the YLS/CMI. Similarly, the YLS/CMI education domain also focuses on behavior in school and relationships with teachers and peers (e.g., behavior problems in the classroom, poor relationship with teachers and peers). Given the quality of student-teacher relationships and how teachers respond to students are critical for reducing court involvement, it is important to examine ways teachers may be effective in helping reduce recidivism.
The juvenile history domain is showing the weakest association with recidivism and is consistent with past research which has also found that factors like arrest history exacerbate the rate of recidivism for minority offenders (Harcourt, 2015; Kempf-Leonard, 2007; Starr, 2014). The present study found that predictive validity of the juvenile justice history domain varied across racial and gender subgroups. The history domain predicted recidivism best for White males (AUC = .596; p < .001) and worst for White females (AUC = .501; p > .05), with Black males (AUC = .556; p < .001) and Black females (AUC = .526; p > .05) falling in between. This may be the case because of differential sanctions minority youth receive in court or increased supervision by law enforcement. This could bias recidivism data in a manner that would reduce the ability of criminal histories to predict reoffending (C. Campbell et al., 2018).
Looking across the domains, one could determine that only the prosocial skills and education/employment domain appear to consistently predict recidivism across the racial and gender subgroups. This potentially indicates that the majority of the tools predictive power is derived from those two domains. However, the rest of the tool cannot be ignored when examining the risk and needs profile of the youth for several reasons. First, the total score of the domains is often the best predictor of a youth’s risk of recidivism. Even when a specific domain displays better predictive ability than the total score, ignoring the rest of the domains reduces our knowledge of the rest of the individual’s criminogenic profile. Second, the tool is a risk and needs assessment tool and is based on the RNR model. Therefore, even if a specific domain does not significantly predict a juvenile’s risk of recidivism in a significant manner, it still informs practitioners of their needs and potential ways in which they may need to respond to the youth’s profile. Finally, only accounting for one or two domains in a risk assessment could potentially increase biases. For example, if one only focuses on the education domain, this may disproportionately target youth from low socioeconomic areas.
The current study added much needed research on the OYAS-DIS by examining its predictive validity across Black and White male and female juveniles. The tool was a statistically significant predictor of recidivism for all subgroups of youth, and its ability to predict recidivism is on par with other widely used juvenile risk assessment tools (Olver et al., 2009). The important finding of this study was the OYAS-DIS is a valid predictor of recidivism with some variation across race and gender. These variations suggest the need for a closer examination into factor that contributes to this variation, which is a step toward improving potential disparities that may exist in the juvenile justice system. By examining these processes, researchers and court officials could better determine whether differences in the risk–recidivism relationship is more attributed to differential offending patterns or differential treatment and/or biases that occur in the juvenile justice system. The use of risk assessments is foundation to enhancing evaluation and assessment research.
Another important observation was that majority of the youth were classified as low risk (48%) according to the OYAS-DIS. This observation reemphasizes that only a small proportion of juvenile offenders become perpetual recidivists. In fact, having a large proportion of low-risk youth, in part, represents the nature of delinquency. Many youth who will be involved with the court will have minimal criminogenic risk and/or will participate in a delinquent act once before aging out and adapting to more prosocial activities. It is the implementation of risk assessment that provides court practitioners with the opportunity to identify who are the low-risk youth, a subgroup that potentially has minimal/limited resource or service needs.
Limitations
The methodology of this study had many strengths, but a few limitations also need to be discussed. First, this study used initial risk scores assigned to each youth to predict recidivism. Therefore, there is no way to know how changes in risk score over time affected a youth’s likelihood of recidivating. Second, this study only included two racial groups. While there were some youth from other racial and ethnic groups, there were too few of these youths to conduct stable analyses. This prevents generalization beyond Black and White youth. Third, while this study addresses potential limitations by using two separate measures of recidivism, there is still information not gathered from these measures that cause limitations. Neither new petition nor new adjudication indicates the type of charge a youth receives, the severity of their reoffense, or their time to reoffense. It is possible that the OYAS-DIS predicts certain outcomes better than others do. Finally, the large sample size of the study provides a potential issue when it comes to the substantial meaning of the significant results. For example, the statistically significant difference found in AUC scores between Black and White males may be a result of large sample size rather than an indication of a meaningful difference. This is a possibility, but the authors believe the statistically significant difference is still worth reporting. Past research on risk assessment instruments have found significant differences between racial and gender subgroups, indicating this may be a potential pattern across studies and types of juvenile risk assessments (see Campbell et al., 2018; Onifade et al., 2009).
Conclusions and Future Research
The limitations in this study open up important avenues for future research that would provide important contributions to this topical area. Future research should continue to explore the ability of the OYAS to predict recidivism by including factors such as programing type, dosage, and severity. This may uncover differences across racial and gender subgroups which may be moderating the predictive validity of risk assessment. Further, the examination of exit risk scores, or postprograming risk scores, could be used to examine the predictive validity of the tool at different stages of the juvenile justice system. Cochran and Mears (2015) found that minority youth are less likely to receive rehabilitative services, which would mean that they would be less likely to have reductions in criminogenic risk over time. This would have the effect of biasing initial risk scores. Moreover, researchers should focus on tracking the activities of youth during their time in the juvenile justice system to identify whether differential treatment of youth is occurring during their time in the system. Finally, future research should continue to examine potential risks and strengths that may improve and enhance models of prediction across race or gender subgroups. Doing so may ameliorate disparities found in risk assessment and provide opportunities for court practitioners to better match youth with appropriate interventions.
Footnotes
Declaration of Conflicting Interests
The author(s) declared no potential conflicts of interest with respect to the research, authorship, and/or publication of this article.
Funding
The author(s) disclosed receipt of the following financial support for the research, authorship, and/or publication of this article: National Institute of Justice (2016-R2-CX-0045).