
Abstract
The study of skeletal muscle disorders in patients with mitochondrial diseases is crucial for gaining insights into disease physiology; however, their molecular mechanisms have not been fully elucidated. We previously established human-induced pluripotent stem (iPS) cells in two patients with the mitochondrial DNA (mtDNA) A3243G mutation and isolated iPS cell clones with either undetectable or high levels of mutations. In the present study, we established skeletal muscle cells from iPS cells with mutation-high and mutation-undetectable clones and comparatively analyzed their mitochondrial functions. Fluorescence immunostaining, fusion index, and qRT-PCR revealed no differences in the morphology, differentiation efficiency, or expression levels of skeletal muscle markers between the mutation-high and mutation-undetectable clones. However, the basal oxygen consumption rate, an indicator of mitochondrial respiration, and adenosine triphosphate (ATP) production were reduced in the mutation-high clones of patients 1 and 2. In addition, the extracellular acidification rate, an indicator of glycolytic activity, was reduced in mutation-high clones of patient 2, who exhibited a more severe clinical phenotype. In the mutation-high clones of both patients, mitochondrial Complex I activity and mtDNA copy number were also reduced, whereas the expression levels of peroxisome proliferator-activated receptor gamma coactivator 1α and glucose transporter type 4 were upregulated, indicating compensation for ATP deficiency. These findings reveal the effects of mitochondrial disorders on energy metabolism in skeletal muscles and provide novel insights into skeletal muscle dysfunction in patients with mitochondrial diseases.
Introduction
Mitochondria are essential organelles that regulate cellular energy metabolism by metabolizing glucose and fatty acids through aerobic reactions in the mitochondrial respiratory chain supercomplexes, thereby generating adenosine triphosphate (ATP). 1 Mitochondria have their own genome, mitochondrial DNA (mtDNA), which differs from nuclear DNA (nDNA). While most mitochondrial proteins are encoded by nDNA, mtDNA encodes 13 respiratory chain subunit proteins, 2 ribosomal RNAs, and 22 tRNAs. 2 Pathogenic mtDNA mutations, including point mutations, deletions, and duplications, cause mitochondrial dysfunction, leading to disorders in energy-dependent organs, such as the brain, skeletal muscles, heart, and pancreatic beta cells. 3 –6 The adenine (A) to guanine (G) transition at nucleotide position 3243(A3242G) in the mitochondrial tRNAleu(UUR) gene (MT-TL1) is one of the most frequent pathogenic mutations in mitochondrial diseases, causing mitochondrial encephalomyopathy, lactic acidosis, and stroke-like episodes (MELAS), myopathy, deafness, and diabetes mellitus. 7 –13 This mutation causes a defect in the taurine modification of tRNAleu(UUR), which decreases the activity of the respiratory chain protein Complex I, ultimately inducing mitochondrial dysfunction. 14 –16
Although both mtDNA and nDNA regulate mitochondrial function, it is difficult to analyze mtDNA mutations in isolation while keeping nDNA constant. Recently, disease-specific human-induced pluripotent stem (iPS) cell technology has revolutionized pathological studies. 17 –19 We previously established iPS cell lines from two independent patients with mtDNA A3243G mutation. 20 One patient had diabetes mellitus, and the other had diabetes mellitus and MELAS. In mitochondrial diseases, cells and tissues harbor both wild-type and mutant mtDNA, a condition known as heteroplasmy. Leveraging heteroplasmy, we successfully established two types of iPS clones from the same patient: one with most mitochondria carrying the A3243G mutation and the other with an undetectable mutation. Given that the two clones had the same nDNA background, comparative analysis enabled us to evaluate the function of mitochondria harboring the A3243G mutation, independent of nDNA.
Skeletal muscles are among the most affected by A3243G mutation. 21,22 However, the detailed nature of aberrant energy metabolism in the skeletal muscles of patients with mitochondrial disease, as well as the underlying molecular mechanisms, remains poorly understood. To investigate the effects of the A3243G mutation in skeletal muscle independent of the host nDNA background, we generated skeletal muscle cells from iPS clones harboring either high or undetectable A3243G mutation from the same patients and conducted a comparative analysis.
Materials and Methods
Human iPS cell lines
Human iPS cell lines were generated from two mitochondrial patients with diabetes (Pt1 and Pt2) with mtDNA A3243G mutation. 20 From Pt1, mutation-undetectable subclones (Mt1-1low and Mt1-2low) and mutation-high clones (Mt1-3high and Mt1-4high) were selected. Likewise, Pt2-derived iPS cells were categorized into mutation-undetectable subclones (Mt2-1low and Mt2-2low) and mutation-high clones (Mt2-5high and Mt2-9high).
Cell culture
The iPS cells were cultured in StemFit AK02 medium (Reprocell, Kanagawa, Japan), with medium changes every 2 days. Laminin-coated plates with 4.8 μg/well of iMatrix-511 (Nippi, Tokyo, Japan) were prepared for passaging, and the cells were dissociated with TrypLE™ Select Enzyme (Thermo Fisher Scientific, Waltham, MA, USA) every 7 days. Single cells were seeded in dishes containing StemFit AK02 supplemented with Y-27632 (Nacalai Tesque, Kyoto, Japan) to promote their survival.
Differentiation of iPS cells into skeletal muscle cells
Mitochondrial diabetes-specific iPS cells were electroporated with Plasmids PB200-MyoD and pCAG-PBase at 190 V and 950 μM using the Gene Pulser Xcell (Bio-Rad, Hercules, CA, USA). 23,24 After electroporation, cells were cultured in StemFit AK02 medium with 10 µM Y-27632 and later treated with 0.5 μg/mL puromycin. 25 Single colonies were expanded on laminin-coated plates for 7–10 days before seeding on Matrigel-coated plates. From day 2, cells were transitioned to primate ES medium (ReproCELL) containing 0.3 μg/mL doxycycline (DOX). On day 4, cells were dispersed with TrypLE-Select and cultured in 2% HS/αMEM (200 µM 2-ME, 4.5 g/L glucose, 10 µg/mL insulin, 5 µM SB431542, 20 nM retinoic acid, 20 ng/mL thyroid hormone, and 3 µM Y-27632). From day 6, 1 μg/mL DOX was added, and media changes continued until day 10. 26,27
PCR-Invader assay
The probe solution (Supplementary Table S1) was mixed with standard plasmid (104–108 copies of DNA) of wild-type and mutant forms of mitochondrial gene 3243 or sample DNA and denatured at 95°C for 10 min. The analysis was performed according to the method described by Hall et al. 25 The mutation rate was calculated as the ratio of mutant DNA to total mtDNA.
Immunohistochemistry
Cells were fixed in 4% paraformaldehyde in PBS. Immunocytochemistry for myosin heavy chain (MHC) and muscle-type creatine kinase (CKM) was performed using primary and secondary antibodies listed in Supplementary Table S2. 24 Cells were observed using an all-in-one fluorescence microscope (KEYENCE, Osaka, Japan). The fusion index was calculated as [(nuclei in multinucleated cells)/(total nuclei)] × 100 (%) and measured.
Reverse transcription-quantitative PCR
Real-time qRT-PCR was performed using the ABI 7500 (Thermo Fisher Scientific) with the following PCR conditions: 45 cycles of 20 s at 95°C, 3 s at 95°C, and 30 s at 60°C, targeting the MHC, CKM, Myogenin, peroxisome proliferator-activated receptor gamma coactivator 1α (PGC-1α), and glucose transporter type 4 (GLUT4) genes. The data were analyzed using the 2−ΔΔCq (Livak) method with β-actin as the reference. The primers listed in Supplementary Table S1 were used.
Mitochondrial function assessment
Mitochondrial function was assessed on day 10 of differentiation using the Seahorse XF Cell Mito Stress Test Kit (Agilent Technologies, Santa Clara, CA, USA) and Seahorse XF Cell Energy Phenotype Test Kit (Agilent Technologies). The oxygen consumption rate (OCR), extracellular acidification rate (ECAR), ATP production, and cellular energy phenotype were measured using an XFe24 extracellular flux analyzer (Agilent Technologies) according to the manufacturer’s protocol. OCR, ECAR, and ATP production values were normalized to the total cell count per well. Analysis was performed using Wave v2.6.3 software (Agilent Technologies). 28
Complex I enzyme activity assay
Complex I activity on day 10 of differentiation was measured using an enzyme activity microplate assay kit (ab109721; Abcam, Cambridge, UK) according to the manufacturer’s protocol.
mtDNA copy number determination
The mtDNA copy number was assessed using qRT-PCR by comparing mtDNA with nDNA. qRT-PCR was performed using SYBR Green under the following conditions: 2 min at 50°C, 10 min at 95°C, followed by 40 cycles of 15 s at 95°C and 60 s at 62°C (ABI 7500). Data analysis determined mtDNA from Ct values of mtDNA and nDNA 29,30 (see Supplementary Table S1 for the primers used). 31
Statistical analysis
Statistical analyses were performed using R (v. 4.2.1; R Development Core Team, Vienna, Austria). Comparisons among groups were performed using one-way analysis of variance with Tukey–Kramer correction for multiple comparisons. Results are expressed as mean ± standard error of the mean, with a significance level set at P < 0.05.
Ethical approval
This study was approved by the ethics committee of Kyoto University (R0091/G259) and St. Marianna University School of Medicine (#5002). All methods were performed in accordance with the relevant guidelines and regulations. Written informed consent was obtained from all patients.
Results
Patient information
Skin biopsies were performed on two Japanese patients with the mtDNA A3243G (Table 1). Pt1, a 38-year-old male with diabetes, developed thirst, polyuria, and weight loss at 31. His symptoms worsened, with malaise and muscle weakness. Blood tests showed a plasma glucose level of 692 mg/dL and HbA1c of 14.3%. Despite the symptoms, he maintained a normal lifestyle. Pt2, a 46-year-old female with diabetes and MELAS, was diagnosed with gestational diabetes at 24. At 31, she was hospitalized for diabetic ketoacidosis and found to have the A3243G mutation. She had seizures, epilepsy, and muscle weakness, required a cane, and had reduced activities of daily living. Blood tests showed a plasma glucose of 114 mg/dL and HbA1c of 7.0%. Both patients’ mothers also had diabetes mellitus.
Patient Information
BMI, body mass index.
Induction of skeletal muscles from iPS cell clones
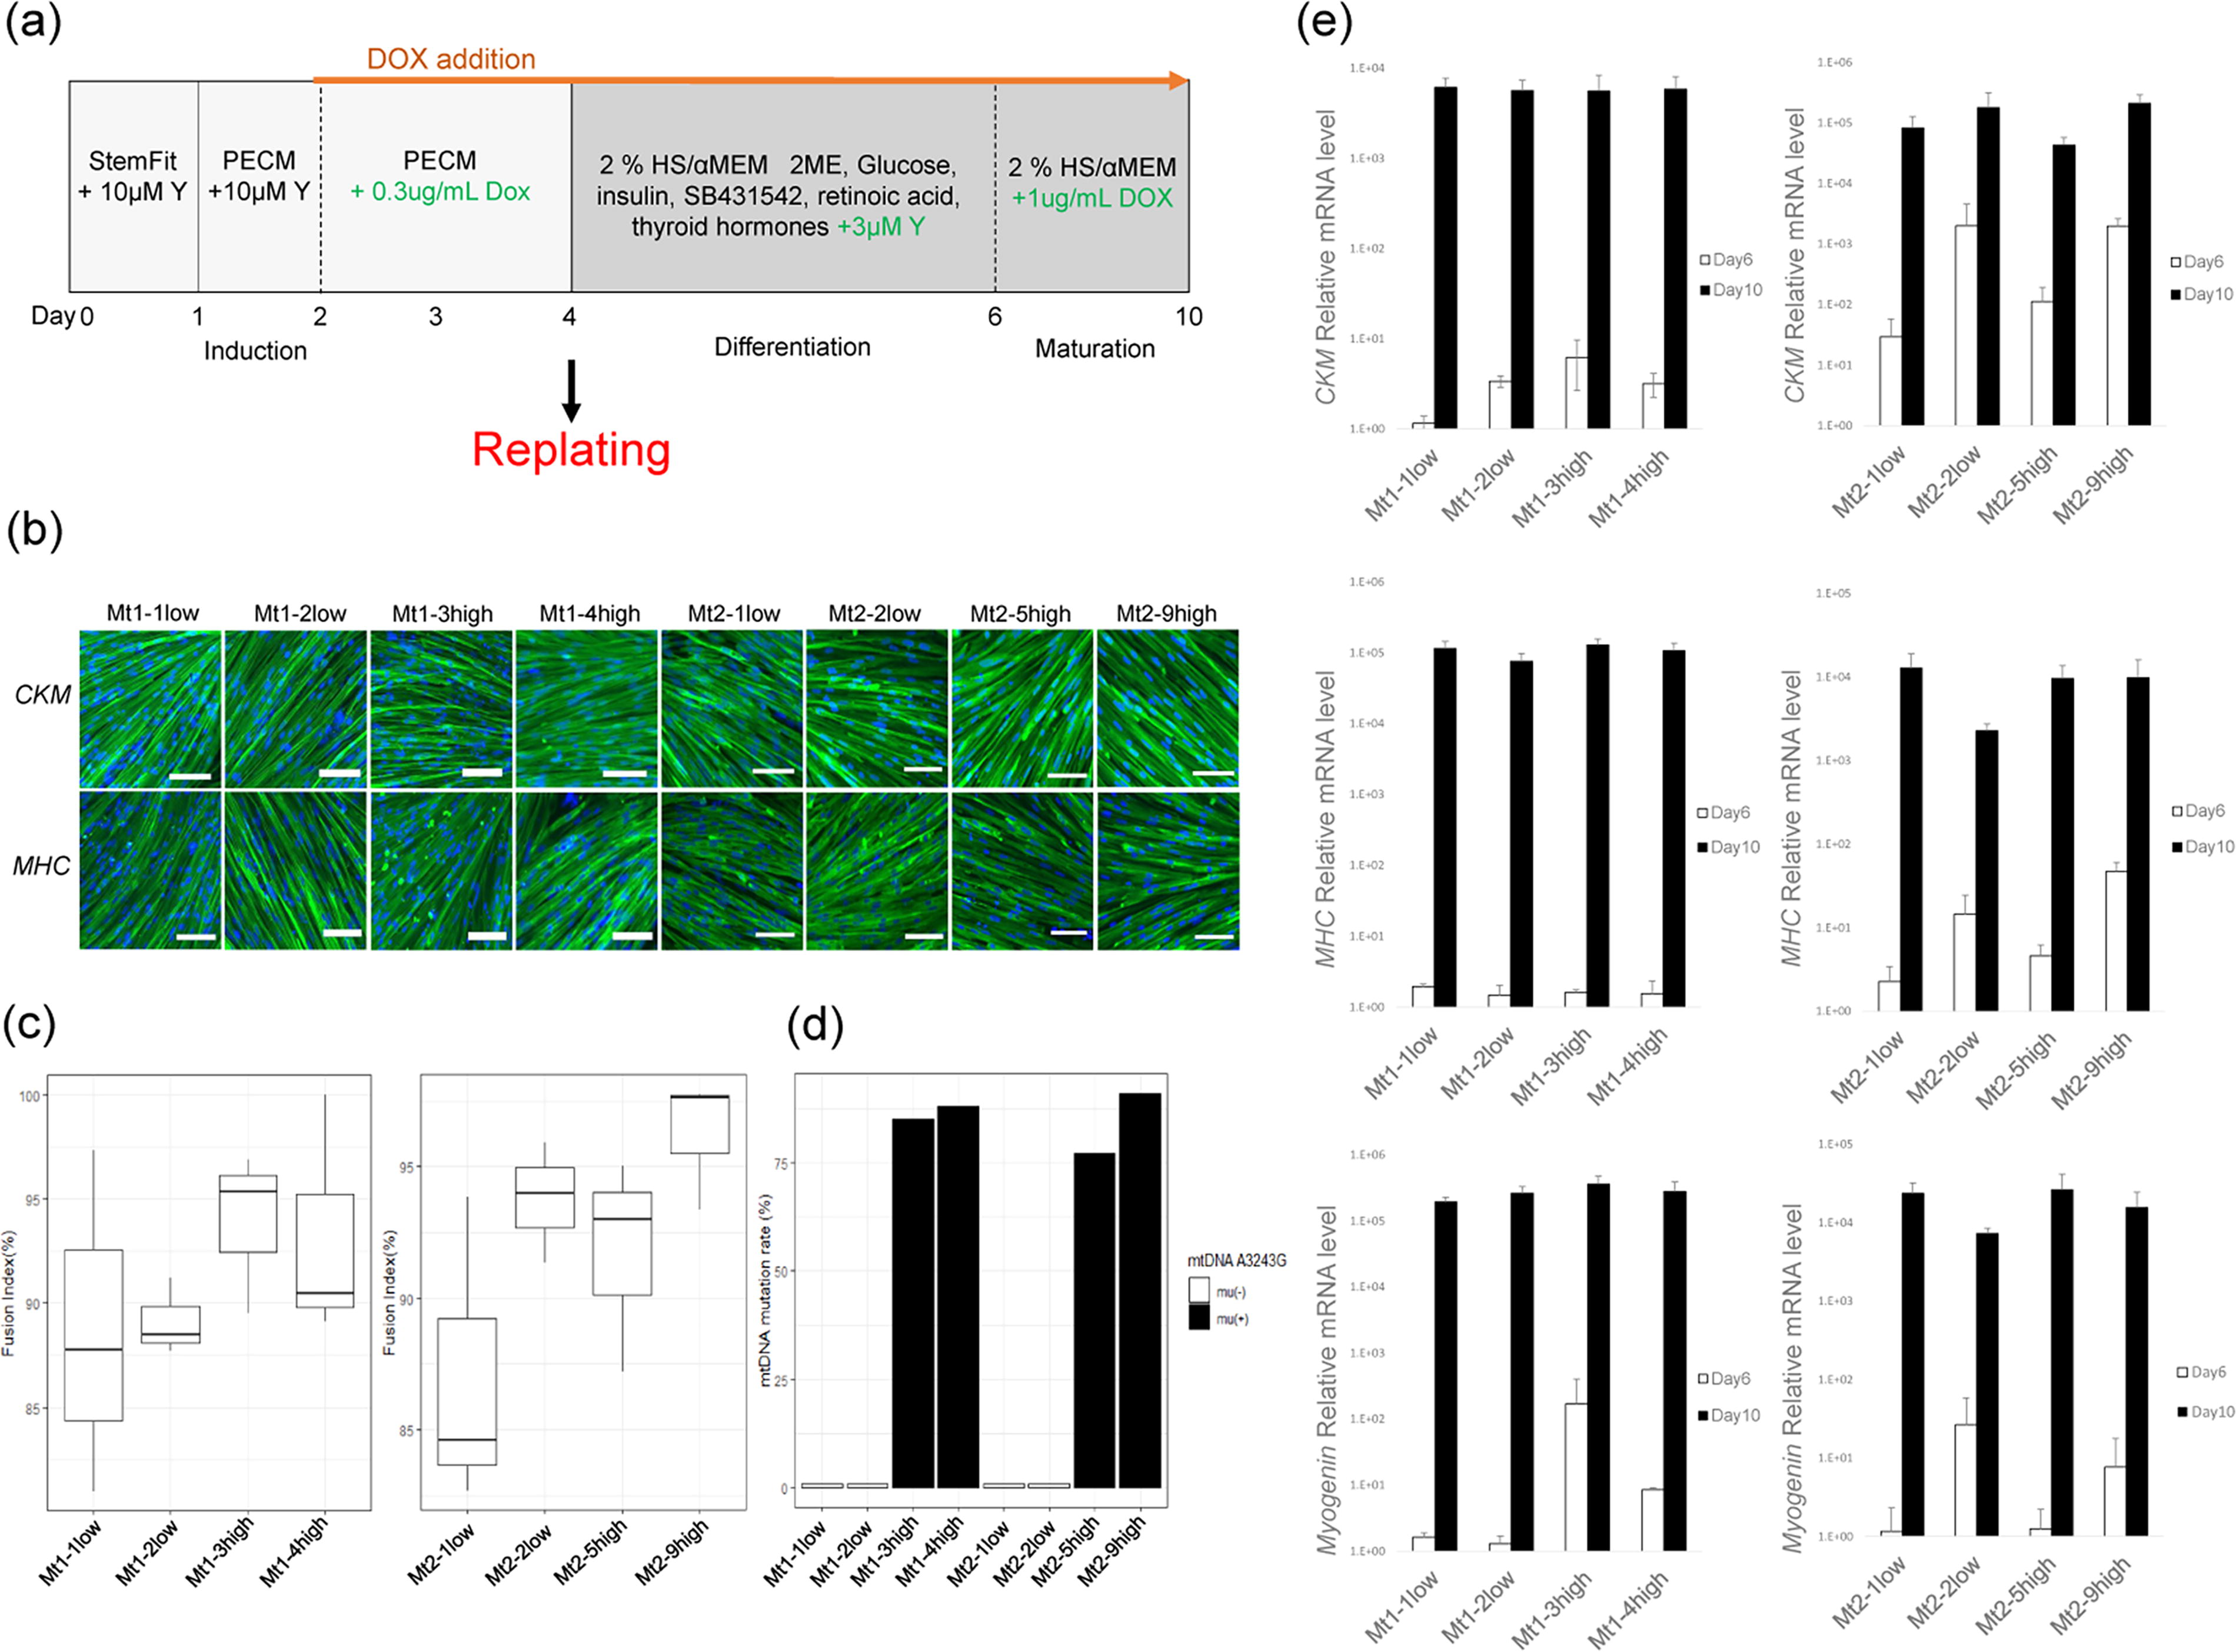
A flowchart of skeletal muscle induction is shown in Fig. 1a. Skeletal muscle differentiation was induced from iPS cell clones of Pt1 and Pt2, with the gradual development of spindle-like structures from days 2 to 7. On day 10, multinucleated myocytes were formed and assessed using immunohistochemistry to confirm the presence of skeletal muscle markers (CKM and MHC). Both mutation-high (Mt1-3high, Mt1-4high, Mt2-5high, and Mt2-9high) and mutation-undetectable (Mt1-1low, Mt1-2low, Mt2-1low, and Mt2-2low) subclones showed similar staining patterns and no morphological differences (Fig. 1b). We maintained the induced skeletal muscle cells for 10 days using a replating technique 26,27 while preserving stable and uniform myogenic differentiation (Fig. 1b). Additionally, no significant differences in the fusion index, an indicator of differentiation efficiency, were observed among the subclones (Fig. 1c).
Confirmation of mature skeletal muscle cell induction using the modified replating method.
Mitochondrial A3242G mutation rates exceeded 75% in the mutation-high groups
The mtDNA A3243G mutation rate was determined using the PCR-Invader assay. In the mutation-high groups, the mutation rates were significantly elevated: Mt1-3high (82%), Mt1-4high (88%), Mt2-5high (77%), and Mt2-9high (91%), whereas the mutation-undetectable subclones had rates below 1% (Fig. 1d).
Increase in the expression levels of skeletal muscle-specific markers following differentiation
The expression levels of MHC, CKM, and Myogenin in differentiated skeletal muscle cells were measured using qRT-PCR. On day 6 after differentiation, the expression levels of MHC, CKM, and Myogenin were low in all subclones but were remarkably higher on day 10 than those observed on day 6 in the same sample (Fig. 1e).
Reduced quantified metabolic capacity in mutation-high subclone groups than in mutation-undetectable groups
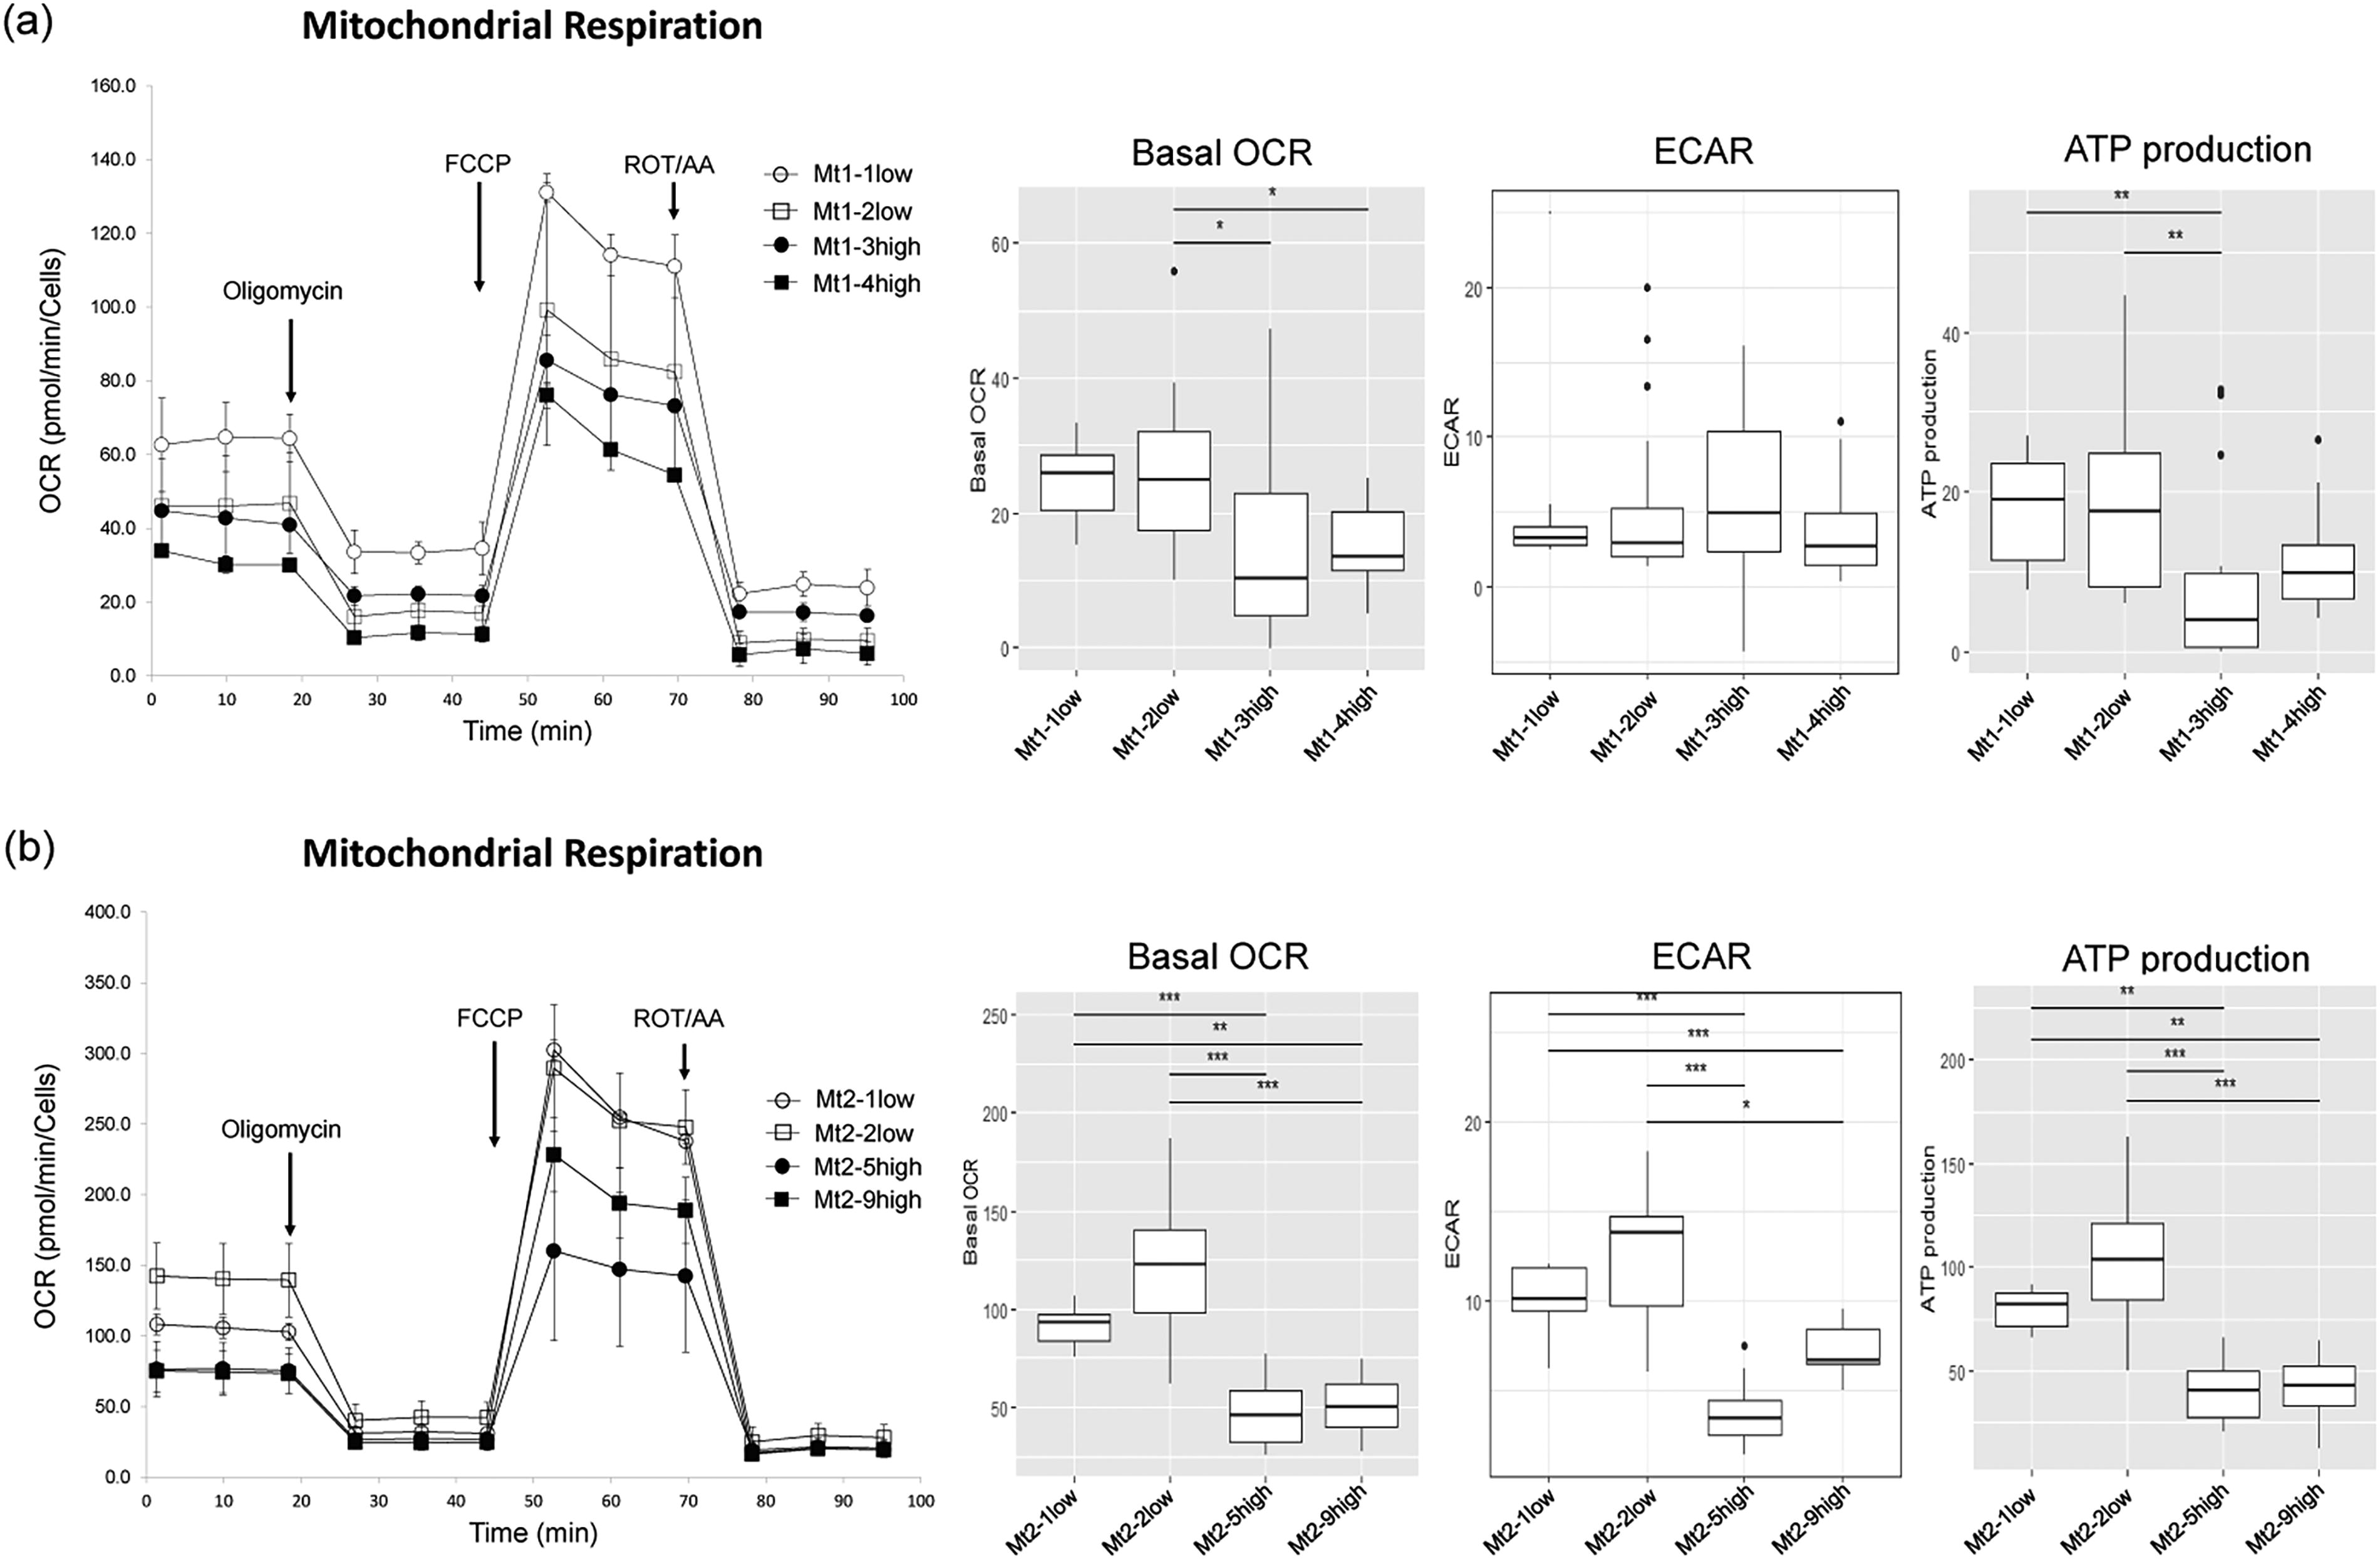
The metabolic phenotype of the cells and metabolic switches can be visualized based on OCR and ECAR levels (Fig. 2a, b). Mitochondrial respiration remained relatively quiescent in all cells in the basal state. However, when treated with FCCP (an inhibitor of oxidative phosphorylation in mitochondria), Mt1-1low and Mt1-2low shifted to an energetic state compared with Mt1-3high and Mt1-4high. In Pt2, Mt2-1low and Mt2-2low shifted increasingly from the quiescent state to an energetic state when stressed by the addition of FCCP, compared with Mt2-5high and Mt2-9high.

Energy phenotype in Pt1 and Pt2 skeletal myocytes on day 10 of differentiation.
Reduced OCR in skeletal muscle cells in the mutation-high subclones groups
We evaluated bioenergy by measuring OCR, ECAR, and ATP production. In Pt1, Mt1-3high and Mt1-4high showed significantly lower basal OCR than Mt1-2low. Similarly, in Pt2, Mt2-5high and Mt2-9high groups showed considerably reduced basal OCR compared with Mt2-1low and Mt2-2low (Fig. 3a, b). As for ECAR, no significant differences were observed in Pt1, whereas, in Pt2, Mt2-5high and Mt2-9high groups showed reduced ECAR compared with Mt2-1low and Mt2-2low. ATP production followed a similar trend in Pt1, with Mt1-3high showing significantly lower ATP production than Mt1-1low and Mt1-2low. In Pt2, ATP production was significantly lower in Mt2-5high and Mt2-9high than in Mt2-1low and Mt2-2low (Fig. 3a, b).
Evaluation of mitochondrial function using the XF extracellular flux analyzer.
Decreased Complex I activity in the mutation-high subclone group
We focused on respiratory chain protein Complex I to confirm mitochondrial function in the skeletal muscle. In Pt1, Mt1-3high and Mt1-4high showed significantly lower Complex I activity than Mt1-1low (Fig. 4). The Complex I activity of Pt2 was significantly lower in Mt2-5high and Mt2-9high than in Mt2-1low and Mt2-2low (Fig. 4).
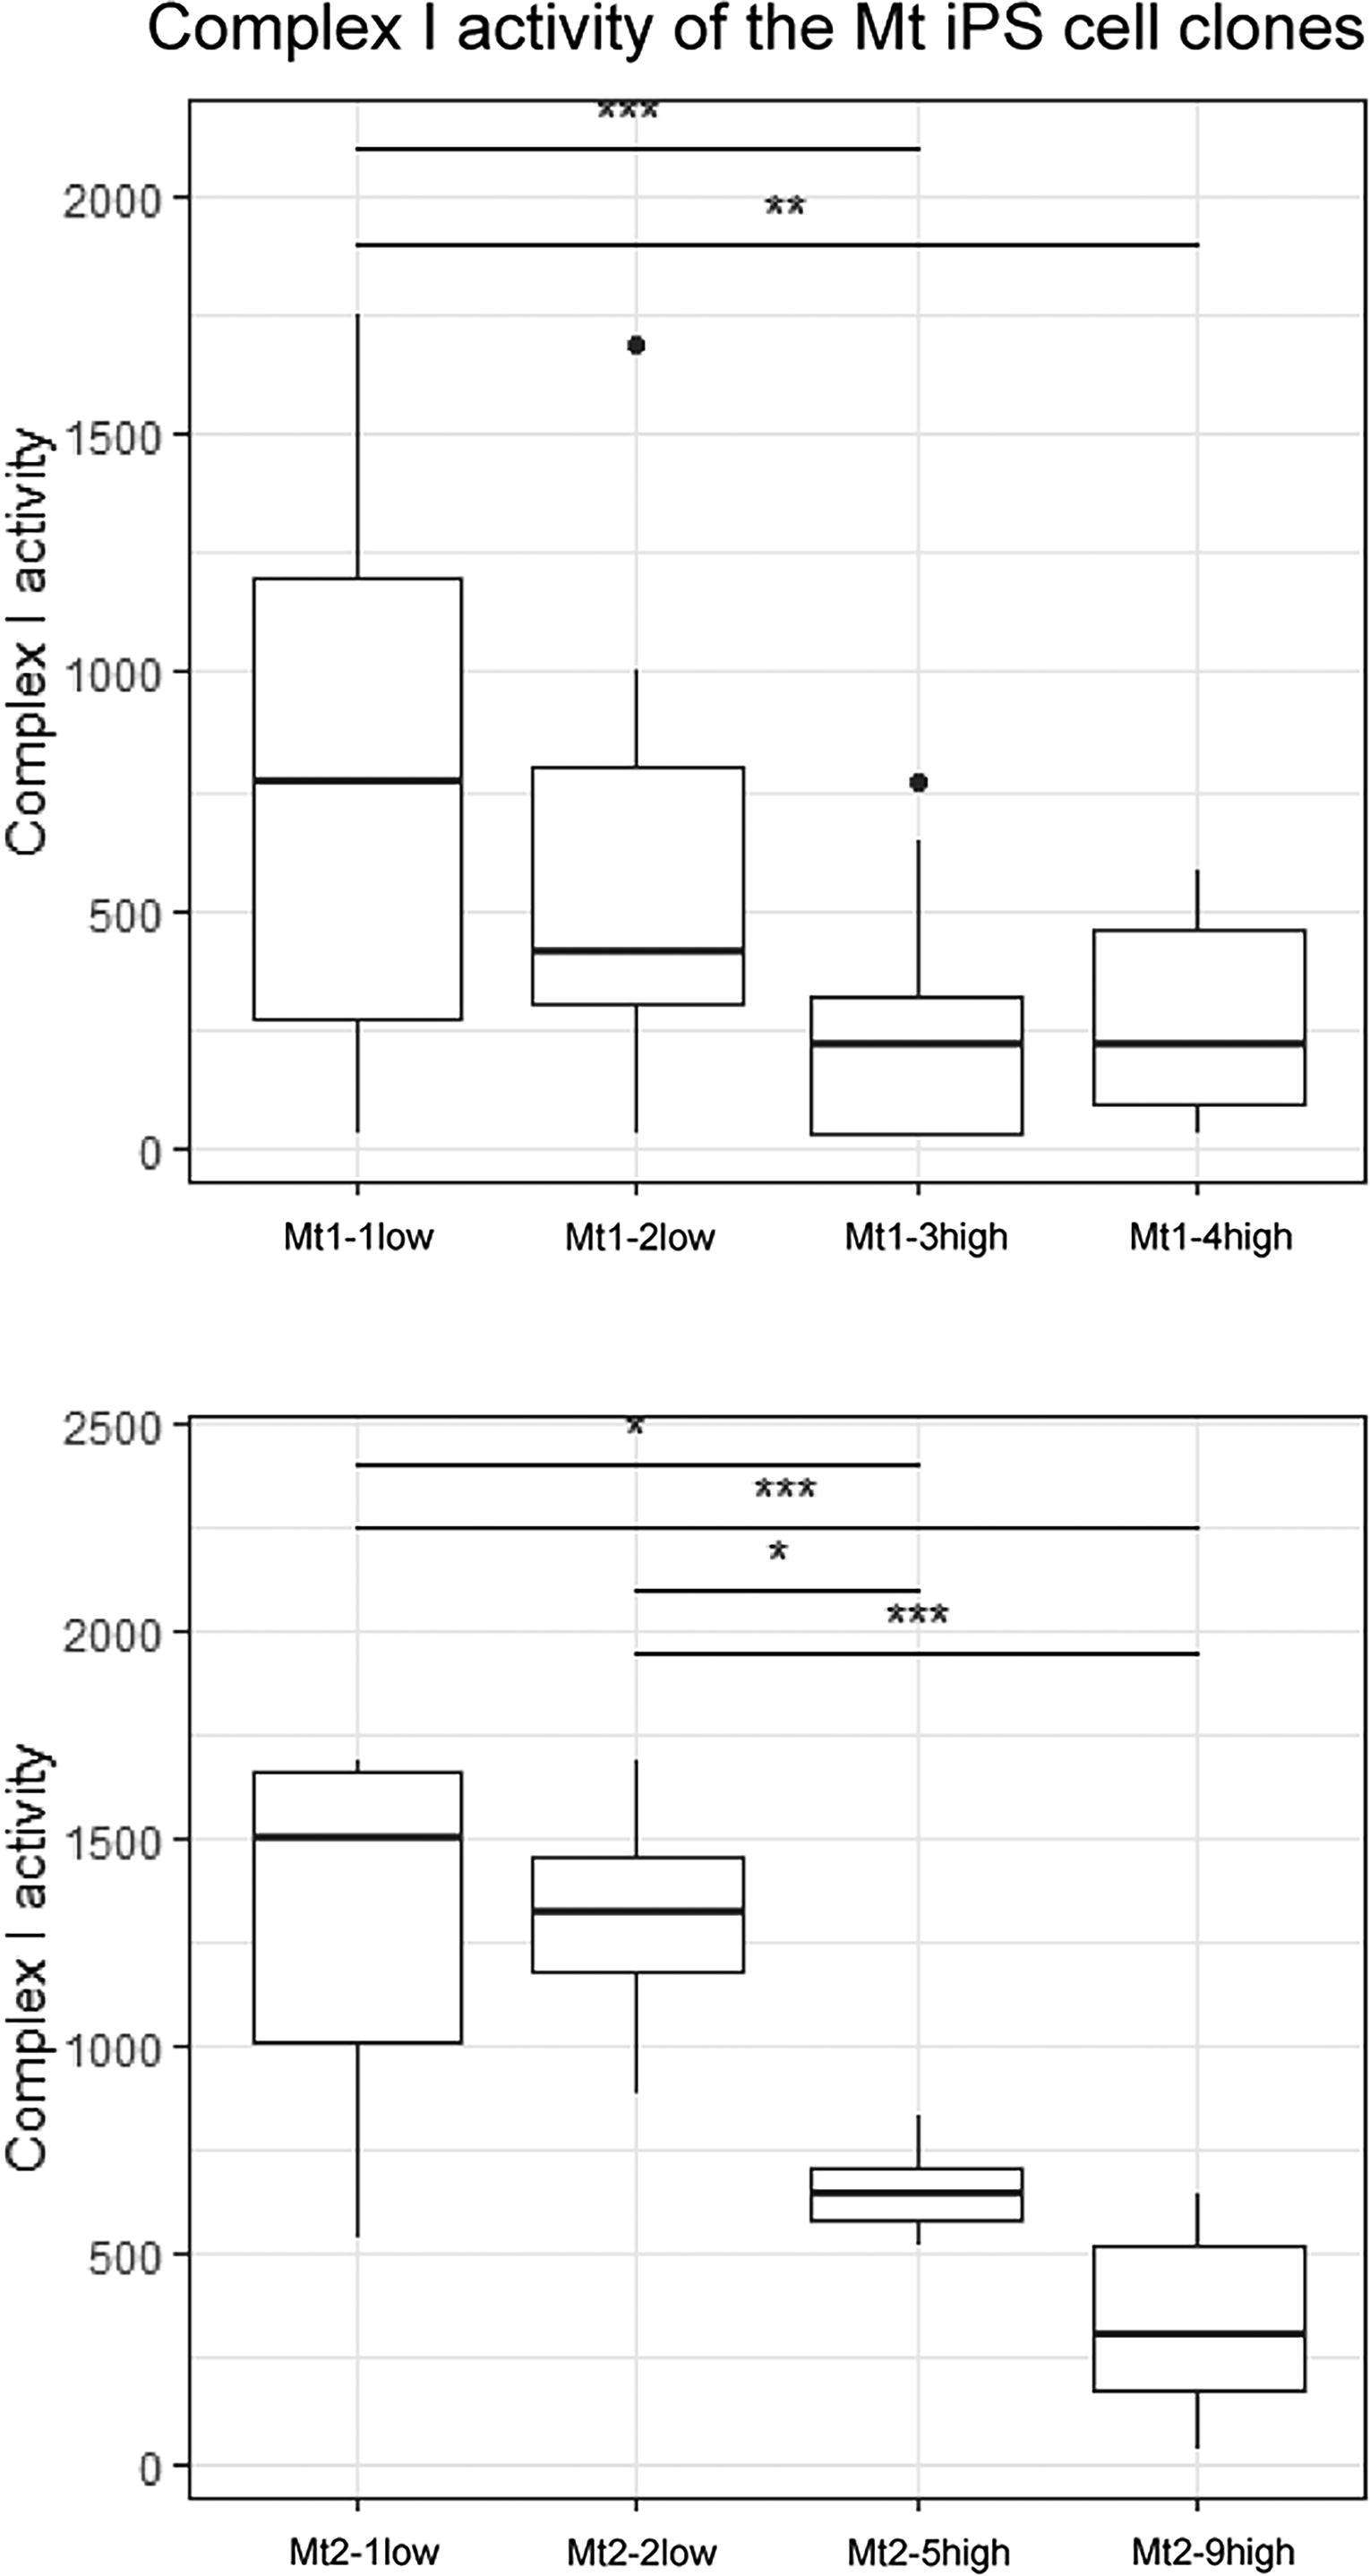
Mitochondrial Complex I activity in skeletal muscle cells on day 10 of differentiation. Complex I activity of Pt1 (upper panel) and Pt2 (lower panel) in skeletal myocytes on day 10 of differentiation. Data represent the means of triplicate experiments; error bars indicate standard error of the mean. Asterisks indicate significant differences (*P < 0.05, ** P < 0.01, *** P < 0.0001). P values were determined using two-way ANOVA with Tukey’s multiple comparison test.
Increased expression levels of PGC-1a and GLUT4 in skeletal muscle cells in the mutation-high subclone groups
PGC-1a and GLUT4, key regulators of mitochondrial function and glucose metabolism, were compared between mutation-high and mutation-undetectable subclones. 32 –36 In Pt1, PGC-1a expression was significantly higher in Mt1-3high and Mt1-4high than in Mt1-1low and Mt1-2low (Fig. 5a). GLUT4 expression was higher in Mt1-4high than in Mt1-1low and Mt1-2low (Fig. 5b). In Pt2, PGC-1a expression was significantly higher in Mt2-9high than in Mt2-1low and Mt2-2low (Fig. 5a). GLUT4 expression was significantly higher in Mt2-5high and Mt2-9high than in Mt2-1low and Mt2-2low (Fig. 5b).
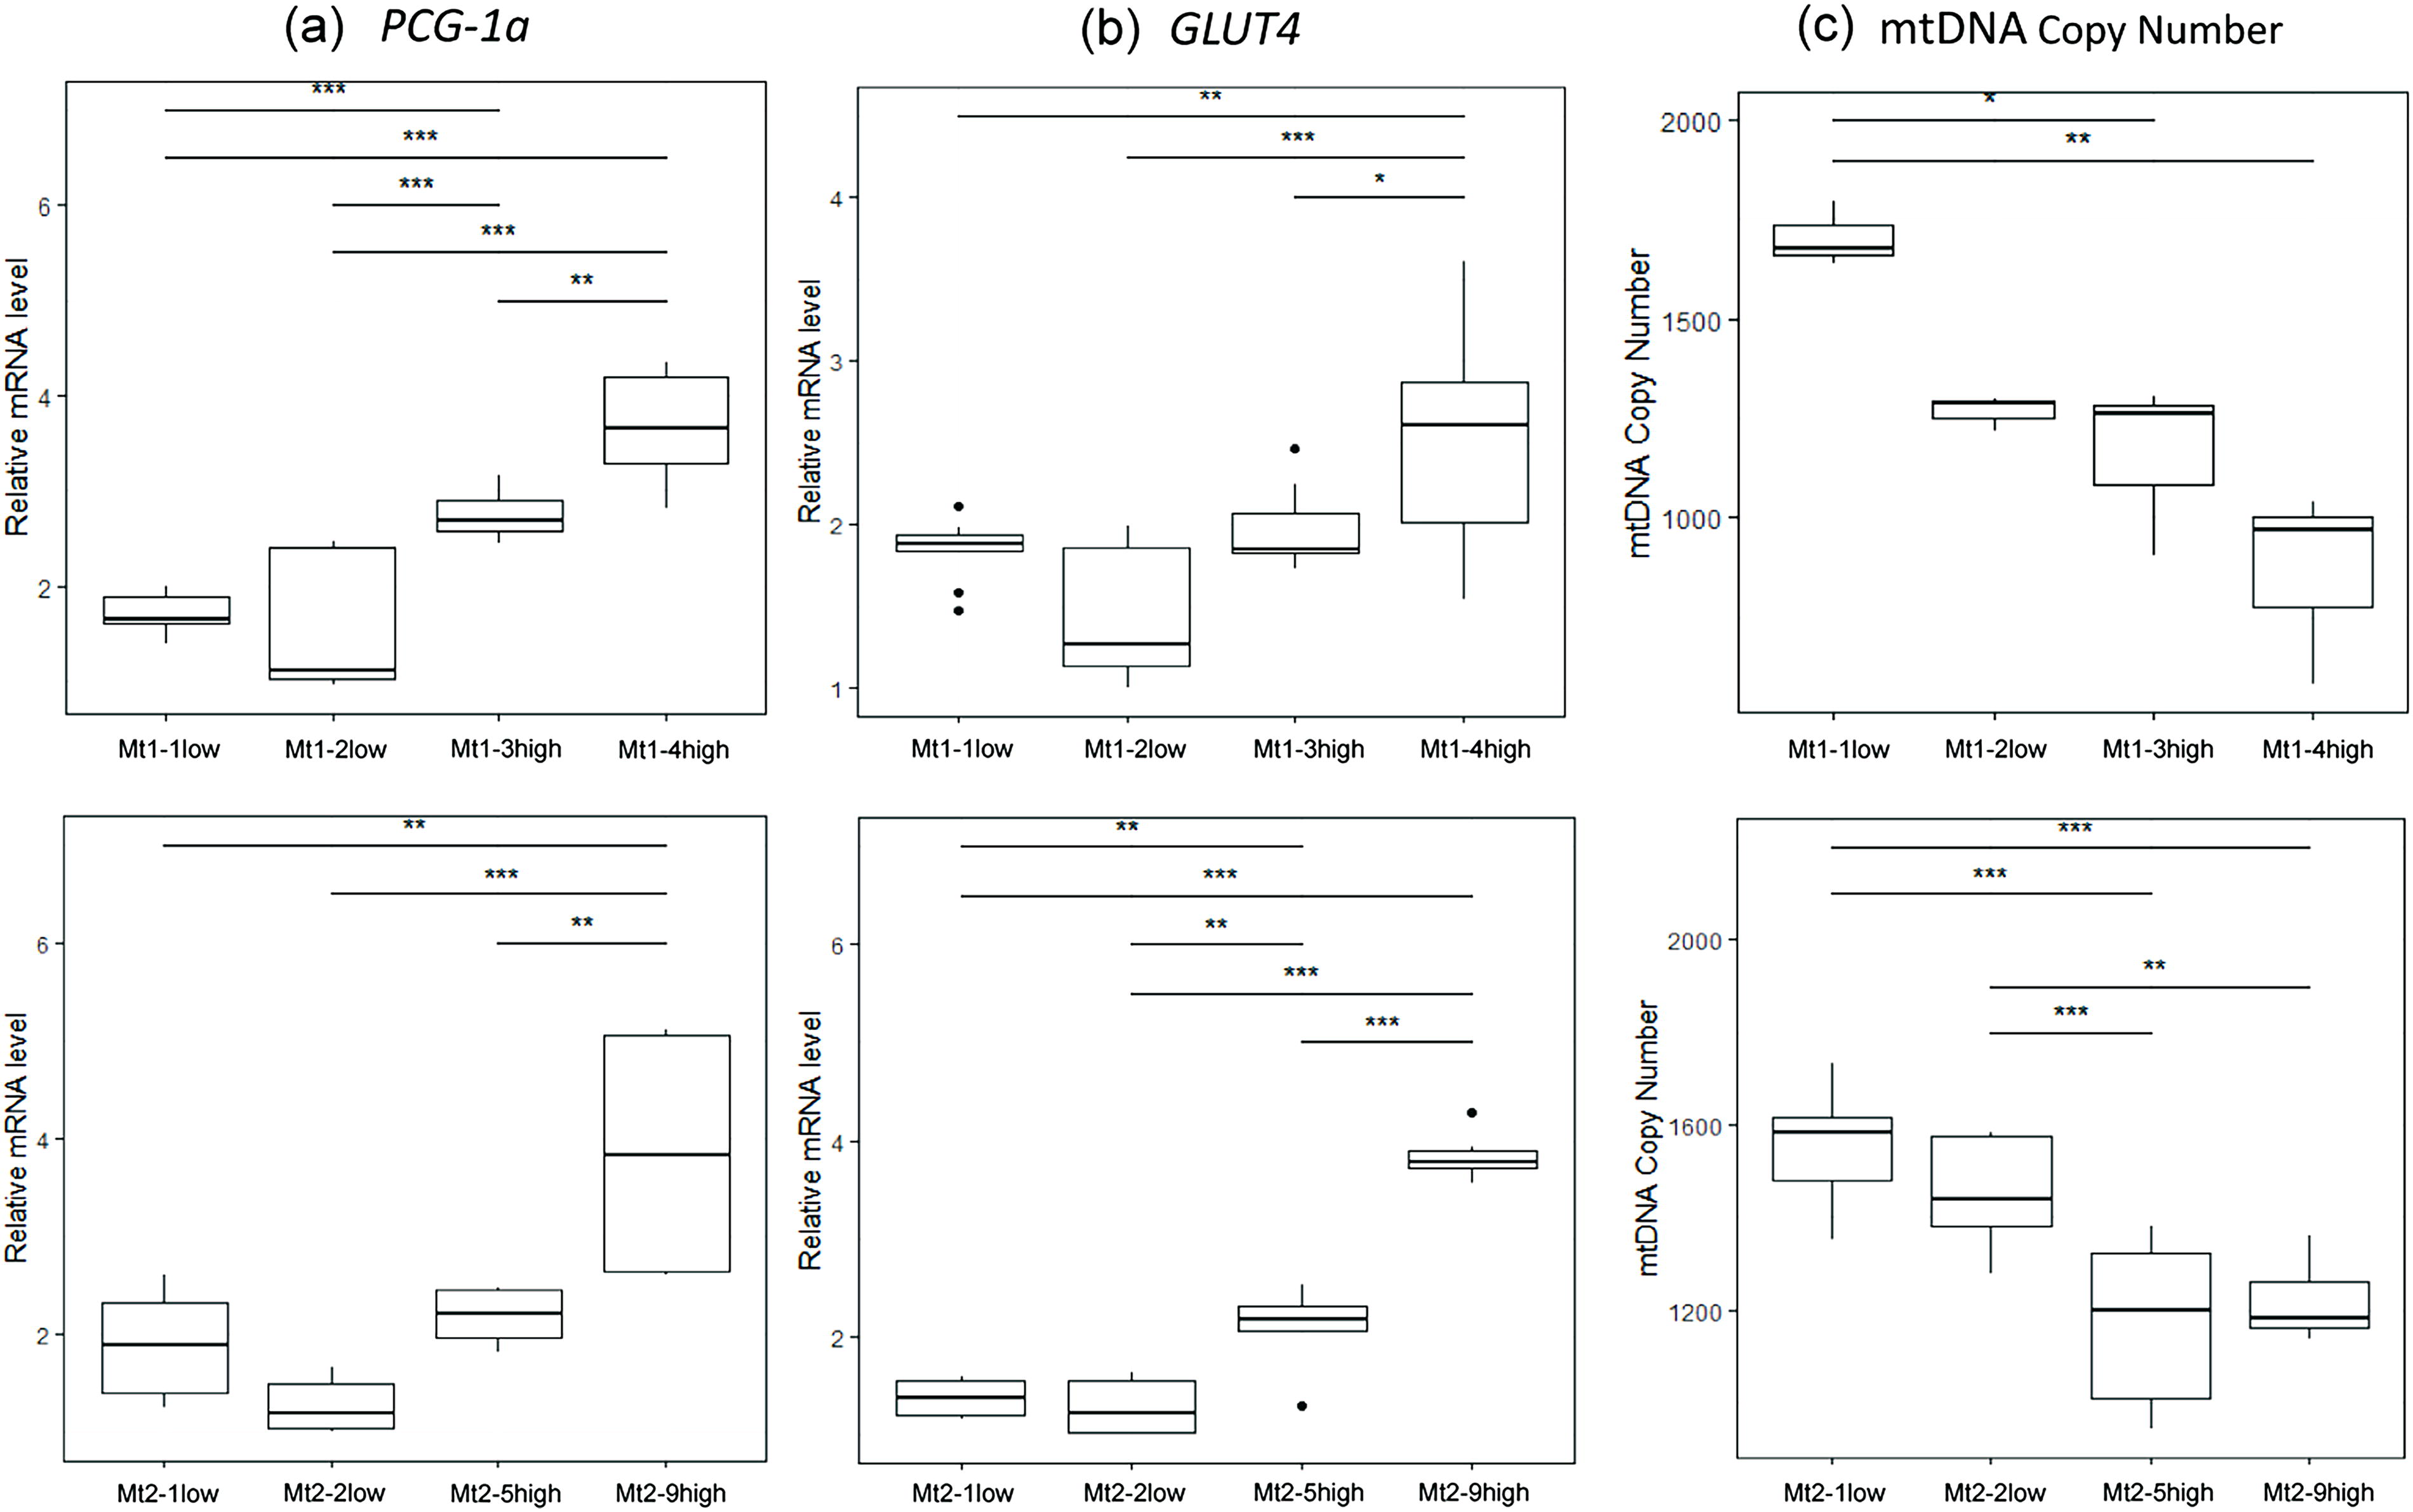
Measurement of mitochondrial DNA copy number and expression analysis of peroxisome proliferator-activated receptor gamma coactivator 1-alpha (PGC-1α) and Glucose transporter type 4 (GLUT4) mRNA levels.
Reduced mtDNA copy number in the mutation-high subclone groups
The mtDNA copy number of Pt1 decreased in Mt1-3high and Mt1-4high compared with that in Mt1-1low (Fig. 5c). The mtDNA copy number of Pt2 was lower in Mt2-5high and Mt2-9high than in Mt2-1low and Mt2-2low (Fig. 5c).
Discussion
Mitochondrial diseases comprise a diverse group of disorders caused by mitochondrial dysfunctions. Among these, the A3243G mutation is the most common. mtDNA differs from host nDNA and exhibits heteroplasmy, in which the mutation rate varies among cells. 37 In our previous study, iPS cells were established from the fibroblasts of patients with mitochondrial diseases carrying the A3243G mutation, and iPS clones were obtained from the same patient with either high levels of mutated mitochondria or no mutated mitochondria. 22 Several research groups have reported differences in disease severity, phenotype, and mitochondrial function according to heteroplasmy levels in iPS cells established from patients with mitochondrial disease. 38 –40 However, these studies were conducted on iPS cells 41 –43 or differentiated nerve cells. 44 To the best of our knowledge, this is the first study to examine differentiated skeletal muscle cells.
Skeletal muscle is the largest tissue in the human body, plays an important role in energy metabolism and exercise, and is one of the most affected organs in mitochondrial diseases. We succeeded in efficiently inducing skeletal muscle from human iPS cells via forced expression of the hMyoD1 gene, following the method established by Sakurai et al. 23,24 Mutation-undetectable subclones comprised <1%, whereas iPS cells with mutation-high subclones comprised ≥75% of the mutant mitochondrial rate. Consistent with previous reports, 39 our results confirmed that cell passages did not alter heteroplasmy levels. In addition, the heteroplasmy level of A3243G mutation was maintained in skeletal muscle cells.
The cell energy phenotype test allows for the evaluation of the metabolic phenotype under basal and stress conditions induced by FCCP, an inhibitor of oxidative phosphorylation, and oligomycin, an inhibitor of ATP synthase. These stress conditions mimick the maximum energy demand of the cells. Therefore, we evaluated whether differentiated skeletal muscle cells exhibited a shift toward more aerobic or glycolytic metabolic activity. In the basal state, all cells remained at approximately the same level. In contrast, under metabolic stress, the mutation-undetectable subclones of Pt1 and Pt2 shifted in the energy direction. In other words, energy from both oxidative phosphorylation and glycolytic pathways was utilized. However, the mutation-high subclones of Pt1 remained quiescent and showed no changes in their metabolic phenotypes. Additionally, the metabolic phenotype of the mutation-high subclones of Pt2 shifted slightly toward the glycolytic pathway. These findings indicate that skeletal muscle cells from mutation-undetectable subclones use both pathways for ATP production under stress conditions, whereas those from mutation-high subclones exhibit reduced oxidative phosphorylation and glycolysis, thereby suppressing their ability to meet high energy demands under stress conditions.
Furthermore, by performing a Mito stress test, we confirmed that the basal OCR and ATP production were lower in the skeletal muscle cells of the mutation-high subclones of Pt1 and Pt2 than in the mutation-undetectable subclones (Fig. 3). Pathology caused by the A3243G mutation mainly occurs due to the impairment of Complex I induced by tRNALeu (UUR) dysfunction, which is responsible for decoding UUR codons. 45,46 In fact, the respiratory chain Complex I activity, an electron transfer chain where ATP production occurs, was also reduced (Fig. 4), indicating that the mutant clones had impaired mitochondrial respiration due to the inhibited function of mitochondrial Complex I, resulting in lower energy production. Furthermore, the A3243G mutation also affects the expression of other nuclear genes 47 and NADH metabolism, further reducing ATP production, 48 consistent with previous studies. Interestingly, ECAR also decreased in Pt2, and the relative extent of decreased ATP production appeared to be greater than that in Pt1. This finding is consistent with the greater clinical severity observed in Pt2. Although the precise mechanism remains unclear, one possible explanation is that Pt2 also harbors abnormalities in nDNA-encoded mitochondrial proteins, leading to impaired glycolysis. This simultaneous decrease in both OCR and ECAR may also cause an overall reduction in cellular metabolic activity and could be associated with decreased cell viability or increased cell death.
The transcriptional coactivator PGC-1α promotes mitochondrial biogenesis and regulates mitochondrial mass. 49 Sarcopenia, which is associated with age-related loss of muscle mass and function, is associated with mitochondrial biogenesis regulated by PGC-1a rather than old age. 50 PGC-1a was predominantly increased in mutation-high subclones compared with that in mutation-undetectable subclones. Increasing total mitochondrial abundance by promoting mitochondrial biosynthesis may be a compensatory mechanism to counteract the bioenergetic deficit caused by mutations in the mtDNA or nuclear genome. 51 These results are consistent with those reported in skeletal muscles from mice with mitochondrial myopathy, where individual mitochondria exhibit severely impaired function, but increased mitochondrial mass sufficiently restores overall ATP production. 52 In addition, the expression of GLUT4, which transports blood glucose into skeletal muscle cells, increased in the Pt1 and Pt2 mutation-high subclones. This suggests that glucose uptake is enhanced to compensate for energy deprivation.
The mtDNA copy number is directly correlated with energy demand, oxidative stress, and mitochondrial membrane potential. 53 Alterations in mtDNA copy number may affect mitochondrial ATP production and contribute to disease development. However, the distribution of heteroplasmy among cell types and its effects on phenotypic expression in affected patients remain largely unknown. In the present study, the mtDNA copy number decreased in both Pt1 and Pt2 mutation-high subclones compared with that in mutation-undetectable subclones. A previous study reported that high heteroplasmy levels were significantly correlated with a low mtDNA copy number in the central nervous system of patients with the A3243G. 54 Furthermore, mtDNA copy number in neurogenetic diseases pathogenic to the A3243G mutation is negatively correlated with disease burden and muscle progression. 40 Thus, in mutation-high subclones with high levels of heteroplasmy, ATP production is affected by reduced mtDNA copy number.
The limitations of this study are as follows. First, we did not directly analyze skeletal muscle from patients with mitochondrial disease but rather iPS cell-derived skeletal muscle cells, which may differ from normal mature skeletal muscle. Second, because this study analyzed cells from only two patients, it is difficult to exclude the possibility that some results may be influenced by natural differences between the patients, and further analysis involving a larger number of patients is necessary. Third, the mechanisms underlying the clinical differences between Pt1 and Pt2 could not be elucidated in this study. One possible explanation is that Pt2 also harbored abnormalities in nDNA-encoded mitochondrial proteins, leading to impairment of the glycolytic pathway.
Our study showed that iPS cell-derived skeletal muscle cells with the A3243G mutation exhibited impaired mitochondrial Complex I activity and reduced mtDNA copy number, resulting in reduced mitochondrial respiration and ATP production. In contrast, PGC-1α and GLUT4 expression levels were upregulated, indicating a compensatory mechanism for energy deficiency. Our findings on mitochondrial function in iPS cell-derived skeletal muscle cells are expected to enhance our overall understanding of mitochondrial disease.
Footnotes
Data Availability
The data generated in this study will be shared upon reasonable request from the corresponding author.
Author Disclosure Statement
All authors declare no potential conflict of interest.
Funding Information
This work was supported by Grants-in-Aid for Scientific Research from the Ministry of Education, Culture, Sports, Science, and Technology of Japan to R.O. (#23K07468), K.Y. (#24K11397), and M.S. (#21K08587), and The Uehara Memorial Foundation to M.S. (#C-18), as well as Grants from the Japan Association for Diabetes Education and the TERUMO LIFE SCIENCE FOUNDATION.
Supplementary Material
Supplementary Tables
References
Supplementary Material
Please find the following supplemental material available below.
For Open Access articles published under a Creative Commons License, all supplemental material carries the same license as the article it is associated with.
For non-Open Access articles published, all supplemental material carries a non-exclusive license, and permission requests for re-use of supplemental material or any part of supplemental material shall be sent directly to the copyright owner as specified in the copyright notice associated with the article.