
Abstract
Drawing on the resource-based view and the behavioral theory of the firm, we examine how resources and aspirations affect rapid internationalization of firms from emerging economies. Using a 5-year panel from 257 publicly listed manufacturing firms from China, we find that neither technological resources nor marketing resources—two knowledge-based drivers traditionally identified to be behind internationalization—directly drive these firms’ growth in internationalization. Instead, we find that emerging multinationals’ performance relative to aspirations has a U-shaped impact on their growth in internationalization. In addition, technological resources amplify the U-shaped effect of performance relative to aspirations, while marketing resources weaken the effect.
Keywords
Multinational enterprises (MNEs) from emerging economies (EEs)—in short, EE multinationals or emerging multinationals—have emerged as a significant new contributor to the global economy (Cui, Meyer, & Hu, 2014; Gubbi, Aulakh, Ray, Sarkar, & Chittoor, 2010; Hoskisson, Wright, Filatotchev, & Peng, 2013; Lebedev, Peng, Xie, & Stevens, 2015; Mutlu, Wu, Peng, & Lin, 2015; D. Xu & Meyer, 2013). Compared with mature multinationals from developed economies (DEs) that usually expand overseas via an incremental process (Johanson & Vahlne, 1977), an interesting feature of emerging multinationals is their rapid pace in international expansion (Peng, 2012; S. L. Wang, Luo, Lu, Sun, & Maksimo, 2014). For instance, it took only 10 years for Huawei to earn more than half of its total sales from overseas markets. Xiaomi, a Chinese smartphone marker founded in 2010, has expanded to Southeast Asia, India, and Latin America, and it has become a global top-three smartphone producer. The rapid growth in internationalization of emerging multinationals challenges conventional wisdom, and it calls for further investigation on the following important but underexplored question: “What are the factors driving emerging multinationals to expedite their international expansion?”
Among various perspectives that explore the drivers behind firms’ international expansion decisions, the resource-based view (RBV) is influential (Barney, 1991; Penrose, 1959; Wernerfelt, 1984). With a premise that firms engage in international expansion to exploit their superior resources, earlier studies have suggested that knowledge-based assets, particularly technological resources and marketing resources, lead to firms’ rapid expansion overseas (Delios & Beamish, 2001; Dunning, 1993). This view may be less applicable to EE firms, because these firms often lack concrete firm-specific expertise to establish their competitive advantages in global markets (Hoskisson et al., 2013; Peng, 2012). Recently, scholars have advocated a resource-seeking perspective on EE firms’ rapid internationalization, suggesting that intention to obtain superior resources from overseas markets may lead to these firms’ rapid pace in internationalization (Cui et al., 2014; Gubbi et al., 2010; S. L. Wang et al., 2014; Yamakawa, Khavul, Peng, & Deeds, 2013). With the caution that firms’ expertise developed in EEs may not generate extra benefits in overseas markets (Tian & Slocum, 2015), it is worth reexamining whether technological resources and marketing resources are indeed critical factors behind emerging multinationals’ rapid international expansion.
Another perspective that may shed further light on EE firms’ rapid international expansion is the behavioral theory of the firm (BTF; Cyert & March, 1963). Although acquiring valuable resources via rapid international expansion is risky for almost all firms, it is particularly the case for EE firms (Bhaumik, Driffield, & Pal, 2010; Luo & Jayaraman, 2013; Peng, 2012). This is because these firms generally lack expertise and experience about overseas markets. When the outcomes of rapid international expansion are highly uncertain, managers have to make international growth decisions without sufficient information or experience. As a substitute, they may use an aspiration level of performance—a reference point that identifies whether firms’ actual performance is satisfactory or not (Baum, Rowley, Shipilov, & Chuang, 2005; Greve, 2008; Shimizu, 2007). Given that international expansion may enable EE firms to obtain valuable assets and hence affect their performance (Cui et al., 2014; Luo & Tung, 2007; Yiu, Lau, & Bruton, 2007), the firms may respond to gaps between actual performance and aspirations—specifically, performance relative to aspirations—by adjusting their pace in international expansion. However, very little has been done to examine whether the BTF can explain EE firms’ rapid internationalization (Dess, Peng, & Lei, 2013).
Focusing on the drivers behind emerging multinationals’ rapid expansion, we address an important but previously underexplored question: “How do firms’ knowledge-based resources (specifically technological resources and marketing resources) and performance relative to aspirations affect their growth in internationalization?” We also examine the joint effects of the two factors, based on the complementarity between the RBV and the BTF. With an emphasis on the benefits of rapid internationalization in helping firms seek superior resources, the RBV indicates that EE firms’ pace in international expansion may hinge on their internal resource endowments. However, missing from the RBV is why and under what circumstances EE firms can tolerate substantial risks inherent in rapid international expansion. The BTF sheds insightful light on these decisions by contending that EE firms’ tolerance of risk depends on their performance relative to aspirations (Audia & Greve, 2006; Pitelis, 2007). Therefore, integrating the RBV and the BTF may yield further insights on why EE firms engage in rapid international expansion. Specifically, we examine how technological resources and marketing resources moderate the effect of performance relative to aspirations on EE firms’ growth in internationalization. Figure 1 shows our conceptual model.
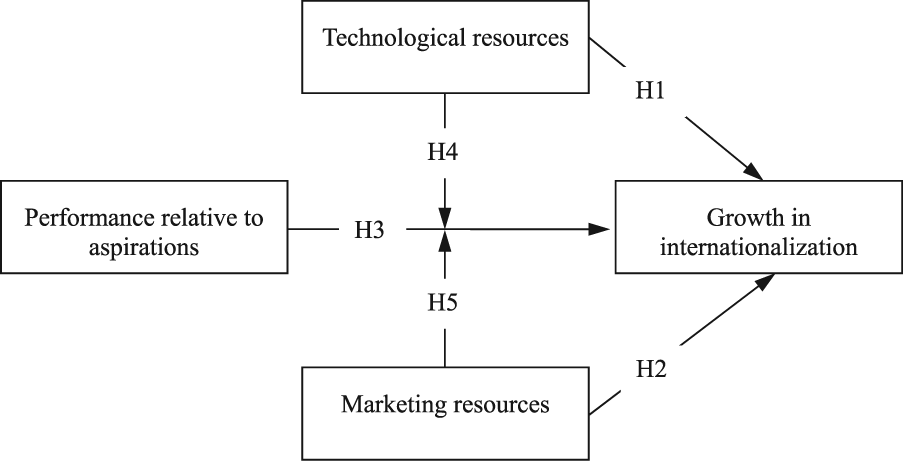
The conceptual model.
We leverage a 5-year panel from 257 publicly listed firms from China. Although China is the largest EE in terms of GDP and currently the second largest economy in the world, research on emerging multinationals from EE such as China pales in scale and scope compared with research on traditional multinationals from DE. If our field aspires to be globally relevant, we need to pay attention to such emerging multinationals (Sun, Peng, Lee, & Tan, 2015; Sun, Peng, Ren, & Yan, 2012). In addition, due to market-oriented transitions in China, competition has greatly intensified (J. J. Li, Poppo, & Zhou, 2008; J. Lu, Liu, Wright, & Filatotchev, 2014; Peng, Sun, & Markóczy, 2015). The entry of multinationals from DE brings Chinese firms’ rich information on the availability of valuable resources overseas (Meyer & Sinani, 2009). As a result, Chinese firms are increasingly motivated to expand internationally. These combined traits make China a suitable setting for the current study.
Theoretical Background
The Resource-Based View and Knowledge-Based Resources
The RBV highlights firms’ internal resource endowments behind strategic decisions (Barney, Wright, & Ketchen, 2001; Madhok, 1997). Among various categories of resources, knowledge-based resources have long been argued as a key driver behind international growth. Knowledge-based resources refer to the intangible assets of technological and marketing know-how, skills, brands, and experiences that are transferable within a firm across borders (Autio, Sapienza, & Almeida, 2000; Kotabe, Srinivasan, & Aulakh, 2002; J. W. Lu & Beamish, 2004; Yamakawa et al., 2013). Earlier studies focusing on DE multinationals have argued that superior knowledge-based assets can facilitate international expansion because these assets enable firms to obtain extra returns from foreign markets (Dunning, 1993; Kirca et al., 2011; Kirca, Hult, Deligonul, Perryy, & Cavusgil, 2012; Yiu et al., 2007). Empirical evidence from DEs has identified two categories of knowledge-based resources—technological resources and marketing resources—as critical drivers behind rapid international expansion (Anand & Delios, 2002; Fang, Wade, Delios, & Beamish, 2013; Tseng, Tansuhaj, Hallagan, & McCullough, 2007).
However, rapid international expansion of firms from EE challenges this traditional wisdom. As latecomers in global markets, emerging multinationals often lack superior knowledge-based assets to establish competitive advantages against their rivals from DEs (Bhaumik et al., 2010; Fey, Nayak, Wu, & Zhou, 2016; Luo & Tung, 2007). A resource-seeking perspective has hence been advocated, which contends that international expansion would be a way for “laggard firms to transform their competitive advantages and catch up with, or even overtake, incumbent global leaders” (Cui et al., 2014, p. 488). Based on this resource-seeking perspective, rapid international expansion of EE firms would be triggered by their needs to acquire from overseas markets strategic assets, particularly superior knowledge-based resources (Gubbi et al., 2010; Lebedev et al., 2015; Su, Peng, & Xie, 2016; Yu, Lee, & Han, 2015). This view implies that there may be a more complex relationship between EE firms’ knowledge-based resources and their pace in international expansion.
A Behavioral Theory of the Firm
The BTF provides novel insights on how firms make decisions whose performance outcomes are unpredictable (Greve, 2003). According to the theory, firms as a goal-oriented system use simple decision rules to guide their activities in response to gaps between actual performance and aspirations, which are the goals set by firms as the minimum level perceived as satisfactory (Cyert & March, 1963; Pitelis, 2007). The literature has argued that social aspirations (which is based on the performance of a reference group of firms) and historical aspirations (which is based on the firms’ own past performance) are two primary aspirations in performance evaluation (Bromiley & Harris, 2014). Firms often combine social and historical aspirations to create their comprehensive aspirations for performance evaluation (Blettner, He, Hu, & Bettis, 2015; Greve, 1998; Miller & Chen, 2004).
The BTF suggests that performance relative to aspirations affects firms’ propensity to take risks. When performance relative to aspirations decreases, managers may view the performance outcome as a signal of problems and failures. The judgment triggers firms’ problem-driven search endeavors, by which they aim to find promising solutions to enhance problematic performance (Blettner et al., 2015). If actual performance is only slightly below aspirations, firms may believe that they can fix the problems via small adjustments that are associated with lower risks. When performance is significantly below aspirations, however, they may direct their emphasis to more risky and nonroutine moves that offer higher probability of raising their performance relative to aspirations (Bromiley & Harris, 2014; Chen, 2008; Greve, 1998). On one hand, performing significantly worse than aspirations enhances managers’ tolerance for risks because the pressure of poor performance motivates managers to act boldly to appear progressive (Abrahamson & Fairchild, 1999; Baum et al., 2005). On the other hand, the problematic performance outcome drives managers to believe there are severe drawbacks in their current strategies and routines, and hence impels them to challenge the status quo (Greve, 1998). 1
When performance relative to aspirations increases, the possibility of firms to take risks may decline. It is because performance above aspirations reinforces firms’ confidence in their existing strategies and routines. At that time, they may deliberately avoid risk taking. If performance significantly exceeds aspirations, firms may be more willing to take risks due to two reasons (Baum et al., 2005; Chen, 2008). First, performing significantly above aspirations may create slack resources that may be strategically redeployed (Peng, Li, Xie, & Su, 2010; Stan, Peng, & Bruton, 2014). Because slack loosens resource constraints and buffers negative outcomes, it enables firms to experiment with promising alternatives even if the alternatives are highly risky (Park, 2007; Tan & Peng, 2003). Second, performing significantly better than aspirations drives managers to be overconfident in their own competence and infallibility (Thaler & Johnson, 1990). As a result, they tend to ignore the downside consequences of a risky but promising alternative and may only focus on its upside potential (J. T. Li & Tang, 2010). For many firms in EEs, rapid internationalization represents such a high-risk but potentially high-return alternative (Yamakawa et al., 2013).
The predictive power of the BTF has been validated in various risk-taking decisions, such as research and development (R&D) investment, market expansion, strategic change, acquisition, and unfamiliar partner selection (Barreto, 2012; Baum et al., 2005; Chen & Miller, 2007; Iyer & Miller, 2008; Joseph & Gaba, 2015; Vissa, Greve, & Chen, 2010). For two reasons, we expect that the BTF may also shed helpful light on EE firms’ rapid international expansion. First, as latecomers, emerging multinationals suffer from voids in resources and capabilities in comparison with leading multinationals (Lebedev et al., 2015; Mutlu et al., 2015; Peng, 2012; S. L. Wang et al., 2014). Such disadvantages may lead to substantial risk and uncertainty when EE firms rapidly expand to global markets. Second, as newcomers, EE firms lack international experience and knowledge about foreign markets (J. Lu et al., 2014). The two disadvantages result in highly uncertain outcomes of EE firms’ resource-seeking endeavors in global markets. When a strategic move’s outcome is less predictable, aspirations may be used to guide firms’ decisions (Greve, 2008; Park, 2007). It is hence worth examining whether and how performance relative to aspirations affects EE firms’ growth in internationalization.
Hypotheses
Knowledge-Based Resources and International Expansion
According to the RBV, two knowledge-based resources—technological resources and marketing resources—have been identified as critical drivers behind international expansion of DE multinationals (Fang et al., 2013; Tseng et al., 2007). We know little about whether the two categories of resources indeed facilitate emerging multinationals’ rapid international expansion. Based on the notion that technological resources and marketing resources are of inconsistent geographic fungibility, defined as the attributes of a firm’s resources that allow their deployment for alternative geographic location (Anand & Delios, 2002; Sapienza, Autio, George, & Zahra, 2006), we argue that the two categories of resources may exert different impact on firms’ pace in internationalization.
Specifically, we argue there is a positive effect of technological resources—which refer to the assets and capabilities used to develop new products and technologies—on EE firms’ growth in internationalization. Since technology is mostly fungible across borders, it is possible for EE firms to acquire new and valuable technological resources from overseas markets (Anand & Delios, 2002; Cui et al., 2014; Yamakawa et al., 2013). However, at least two difficulties may impede firms’ acquisitions of novel technologies in overseas markets. First, valuable technological expertise is often tacit and embedded in local firms or networks in foreign markets (Bertrand & Capron, 2015). With limited experience overseas, it is difficult for EE firms to recognize valuable technologies in international contexts. Second, assimilating new technologies is not an easy task. Due to different technological expertise needed in EE and DE markets (Tian & Slocum, 2014), EE firms face increased difficulties in assimilating new technologies in overseas markets. It requires firms to thoroughly understand new technological knowledge and integrate the knowledge with their existing expertise (King, Slotegraaf, & Kesner, 2008; Zhou & Wu, 2010). Thus, even if rapid international expansion offers EE firms’ access to valuable technological knowledge, effective acquisition of the knowledge may not take place (Chang, Gong, & Peng, 2012).
To overcome these difficulties, EE firms need to possess a high level of absorptive capacity (Chang et al., 2012). Strong internal technological resources represent important sources of absorptive capacity of EE firms (Laursen, Masciarelli, & Prencipe, 2012; Zhou & Wu, 2010). For EE firms having strong technological resources, they would invest substantial resources in R&D. The accumulation of technological knowledge increases these firms’ abilities to recognize the value of new technologies, which are available overseas (Chang et al., 2012). EE firms having strong technological resources are hence more capable of learning and assimilating tacit resources embedded in local firms or networks in foreign markets (Fang et al., 2013; Zhou & Wu, 2010). Therefore,
We argue that strong marketing resources may impede emerging multinationals’ growth in internationalization. Compared with technological resources, marketing resources—the assets and capabilities used to develop marketing programs and build brands—are less geographically fungible. Because marketing resources are accumulated via continuous interactions with local consumers, they are imprinted deeply by distinct local cultures and institutions (King et al., 2008; Kogut & Zander, 1996; Y. Li, Yao, & Ahlstrom, 2015; Puffer, McCarthy, Jaeger, & Dunlap, 2013; Puffer, McCarthy, & Peng, 2013). Inertial and heritage imprint generating from existing marketing resources in home countries may stand in the way of EE firms’ acquisition of marketing-related expertise from overseas markets (Audia, Locke, & Smith, 2000). On the one hand, it is difficult for these firms to identify value inherent in tacit resources that are embedded within the foreign environment. On the other hand, existing marketing resources at home may hinder the learning of expertise developed overseas (Autio et al., 2000). In contrast, EE firms with weak marketing resources may face less inertial constraints or cognitive biases caused by marketing knowledge accumulated at home (Sapienza et al., 2006). Because strong marketing resources may counteract with EE firms’ endeavors to seek resources overseas, such marketing resources may negatively correlate with these firms’ pace of internationalization. Therefore,
Aspirations, Performance, and International Expansion
We predict a U-shaped effect of performance relative to aspirations on EE firms’ growth in internationalization. When performance relative to aspirations decreases, a problem-solving orientation emerges among managers (Blettner et al., 2015). They may endeavor to search promising solutions to improve their firms’ problematic performance (Cyert & March, 1963; Greve, 1998; Miller & Chen, 2004). Although rapid international expansion is highly risky, the move is also a promising option to improve firm performance (S. L. Wang et al., 2014; Yamakawa, Peng, & Deeds, 2008; Yiu et al., 2007). When performance significantly falls below aspirations, EE firms may take rapid international expansion as a solution to enhance performance (Abrahamson & Fairchild, 1999; Baum et al., 2005; Park, 2007). However, when performance is just slightly below aspirations, these firms may not have adequate motivation to take substantial risks associated with rapid internationalization. This is because they believe small adjustments can raise performance relative to aspiration levels. Thus, as performance relative to aspirations increases from a position that is far below aspirations to a position that is close to aspirations, EE firms’ risk taking such as interest in rapid international expansion in this case may become less likely.
When performance is further improved and slightly above aspirations, EE firms may keep their conservative attitude toward rapid internationalization, because performing better than aspirations strengthens their confidence in current strategies (Greve, 1998; Lim & McCann, 2014). When performance relative to aspirations further increases and significantly exceeds aspirations, for two reasons, EE firms’ inclinations to expedite internationalization may increase. First, performing much better than aspirations may create slack resources (Baum et al., 2005; Tan & Peng, 2003), which can not only loosen resource constraints but also buffer potential negative outcomes produced by risky moves (Chen & Miller, 2007; Peng et al., 2010; Stan et al., 2014). At that time, firms are more likely to experiment with risky but promising alternatives such as rapid internationalization to sustain or further improve their satisfactory performance. Due to market-oriented transitions in EEs, resources are increasingly allocated and acquired via market-based mechanisms (Peng, 2003; Peng et al., 2015). Given that rapid internationalization offers EE firms’ richer opportunities to acquire valuable expertise that is not available domestically, the firms may prefer to expand internationally in a rapid pace when they are equipped with rich slack resources.
Second, performing significantly above aspirations enhances managers’ confidence in their abilities, which leads these managers to be potentially hubristic and believe in the infallibility of their decisions (J. T. Li & Tang, 2010). When the downside of possible failure of risky but promising alternatives is overlooked, managers are more likely to take these alternatives to pursue further success (Hayward & Hambrick, 1997; Mishina, Dykes, Block, & Pollock, 2010). Although rapid international expansion does expose EE firms to increased levels of risks, it also offers enhanced possibilities to acquire valuable assets from overseas markets, by which these firms can establish long-term advantages in domestic or even global markets. Thus, firms may be more inclined to engage in rapid international expansion.
In sum, when performance relative to aspirations significantly decreases, there are enhanced possibilities for EE firms to expedite their internationalization. As performance reaches the range that is close to aspirations—either below or above—the propensity to engage in rapid internationalization may become lower. Once performance relative to aspirations is highly increased, as it goes above a threshold, EE firms may be more likely to engage in rapid internationalization. Overall, we predict a U-shaped effect of performance relative to aspirations on EE firms’ growth in internationalization.
The Moderating Effects of Knowledge-Based Resources
Despite the differences, both the RBV and the BTF share the idea that firms are proactive organizations striving for better performance (Pitelis, 2007). Integrating some ideas of the RBV with the BTF’s contributions for cross-fertilization may offer additional insights on EE firms’ rapid internationalization. According to the RBV, rapid international expansion offers EE firms opportunities to acquire strategic assets in foreign markets, by which they may catch up or even overtake incumbent leaders (Cui et al., 2014; Gubbi et al., 2010). The theory offers little explanation on why EE firms are willing to take substantial risks inherent in rapid international expansion.
The BTF suggests that performance relative to aspirations shapes firms’ willingness to take risky but promising alternatives, such as rapid internationalization and radical innovation (Greve, 1998; Shimizu, 2007). The theory largely overlooks the importance of organizational contexts, particularly firms’ internal knowledge-based resources, behind rapid international expansion (Blettner et al., 2015). Because knowledge-based resources are embodied in firms’ internal routines and procedures, they may facilitate or impede firms’ absorption of new knowledge and expertise (Chang et al., 2012). As a result, knowledge-based resources may moderate the link between performance relative to aspirations and EE firms’ growth in internationalization.
Specifically, we predict that technological resources may amplify the U-shaped effect of performance relative to aspirations on EE firms’ growth in internationalization. For a given level of performance relative to aspirations, stronger technological resources may lead to more rapid growth in internationalization than firms with weaker technological resources. For EE firms, cutting-edge technologies are largely unavailable domestically. Expanding overseas may provide access to advanced expertise (Luo & Tung, 2007; Yamakawa et al., 2013). Stronger technological resources bestow enhanced absorptive capacity on firms from EE (Zhou & Wu, 2010), which increase these firms’ capacity to identify and seize new learning opportunities overseas. Thus, rapid growth in internationalization may become more promising among EE firms with strong technological resources. When these firms are motivated by gaps between actual performance and aspirations to take risky but promising options, the move of rapid international expansion may be more likely to be selected. Thus, the linkage between performance relative to aspirations and growth in internationalization is strengthened among these firms. Therefore,
We further argue that marketing resources may weaken the U-shaped effect of performance relative to aspirations on EE firms’ growth in internationalization, such that for a given level of performance relative to aspirations, stronger marketing resources may lead to lower levels of growth in internationalization. Compared with technological resources, marketing resources are more sensitive to local contexts and hence less geographically fungible (Anand & Delios, 2002; Fang et al., 2013; Tian & Slocum, 2014, p. 428). For this reason, EE firms with strong marketing resources may have more localized mind-sets and hence encounter greater difficulties to recognize value of assets available overseas. Inertial and heritage imprint generated from existing marketing resources also impair firms’ capacity to learn new expertise overseas (Autio et al., 2000). With limited capacity to learn novel expertise overseas, EE firms having strong marketing resources may be less likely to view rapid international expansion as a promising solution to respond to gaps between their performance and aspirations. In other words, the correlations between performance relative to aspirations and growth in internationalization may hence become weaker. Therefore,
Method
Sample
We leveraged archival, panel data on Chinese manufacturing firms publicly listed on the Shanghai and Shenzhen Stock Exchanges for a 5-year period (2007-2011, inclusive). The data were gathered mainly from three sources: the WIND database, the OSIRIS database, and firms’ annual reports. WIND is one of the most influential databases in China, which has been widely used in research (Liang, Ren, & Sun, 2015; Markóczy, Sun, Peng, Shi, & Ren, 2013; Xia, Ma, Lu, & Yiu, 2014). OSIRIS is a database of global listed firms and has also been widely used in research (S. Li, Brockman, & Zurbruegg, 2015; Muñoz-Bullón & Sánchez-Bueno, 2012). When required information was not available in the two databases, we turned to annual reports.
The period from 2007 to 2011 was used for three reasons. (1) The internationalization of Chinese firms became a significant phenomenon from the middle of the first decade in the new millennium (Peng, 2012). (2) Starting from 2007, more firms provided R&D information in their annual reports, because China Securities Regulatory Commission (CSRC) required that all publicly listed firms disclose their R&D expenses starting from that year. (3) Information disclosure of publicly listed firms has become more accurate and more complete since 2007 because CSRC enacted regulations to supervise information disclosure in that year. As a result, the quality of accounting information disclosed by publicly listed firms has been significantly improving recently. In 2007, the auditing market share of Big Four accounting firms (Deloitte, Ernst & Young, KPMG, and PwC) in Chinese-listed firms’ annual reports exceeded 80% in terms of client assets and 54% in terms of total incomes (H. Xu, 2009). We chose to sample manufacturing firms in order to better control for the differences between manufacturing and services. Chinese manufacturers generally have stronger international reach than service firms.
We applied a three-stage procedure to collect our data. First, the WIND and OSIRIS databases have 1,430 manufacturing firms (CSRC industry code: C01-C99) that are publicly listed on the Shanghai and Shenzhen Stock Exchanges. After dropping the firms listed after 2007 and delisted before 2011, 810 firms remained. Second, we identified 449 manufacturing firms that had nonzero foreign sales or foreign subsidiaries during the 2007-2011 period. Third, we deleted those with missing information or extreme outliers that were more than seven standard deviations beyond the annual means for our major ratio variables including return on assets, marketing expenses, and R&D expenses. Via the three-stage sampling procedure, we obtained a sample of 257 firms for the 5-year period (2007-2011) and 1,285 firm-year observations (257 × 5).
To test if sample bias was a major concern, we conducted a series of t tests on differences in firm sales and internationalization between the final sample of 257 firms and the original sample of 449 firms. The results showed no significant differences. For example, in 2007, the mean value of sales is 4.590 billion yuan (US$0.748 billion) for 449 firms, and 4.435 billion yuan (US$0.722 billion) for 257 firms (p > .1). The mean value of internationalization for 449 firms is 14.49% and 15.76% for 257 firms in 2007 (p > .1). Overall, Table 1 shows the basic information about our final sample, and Appendix shows variables and sources.
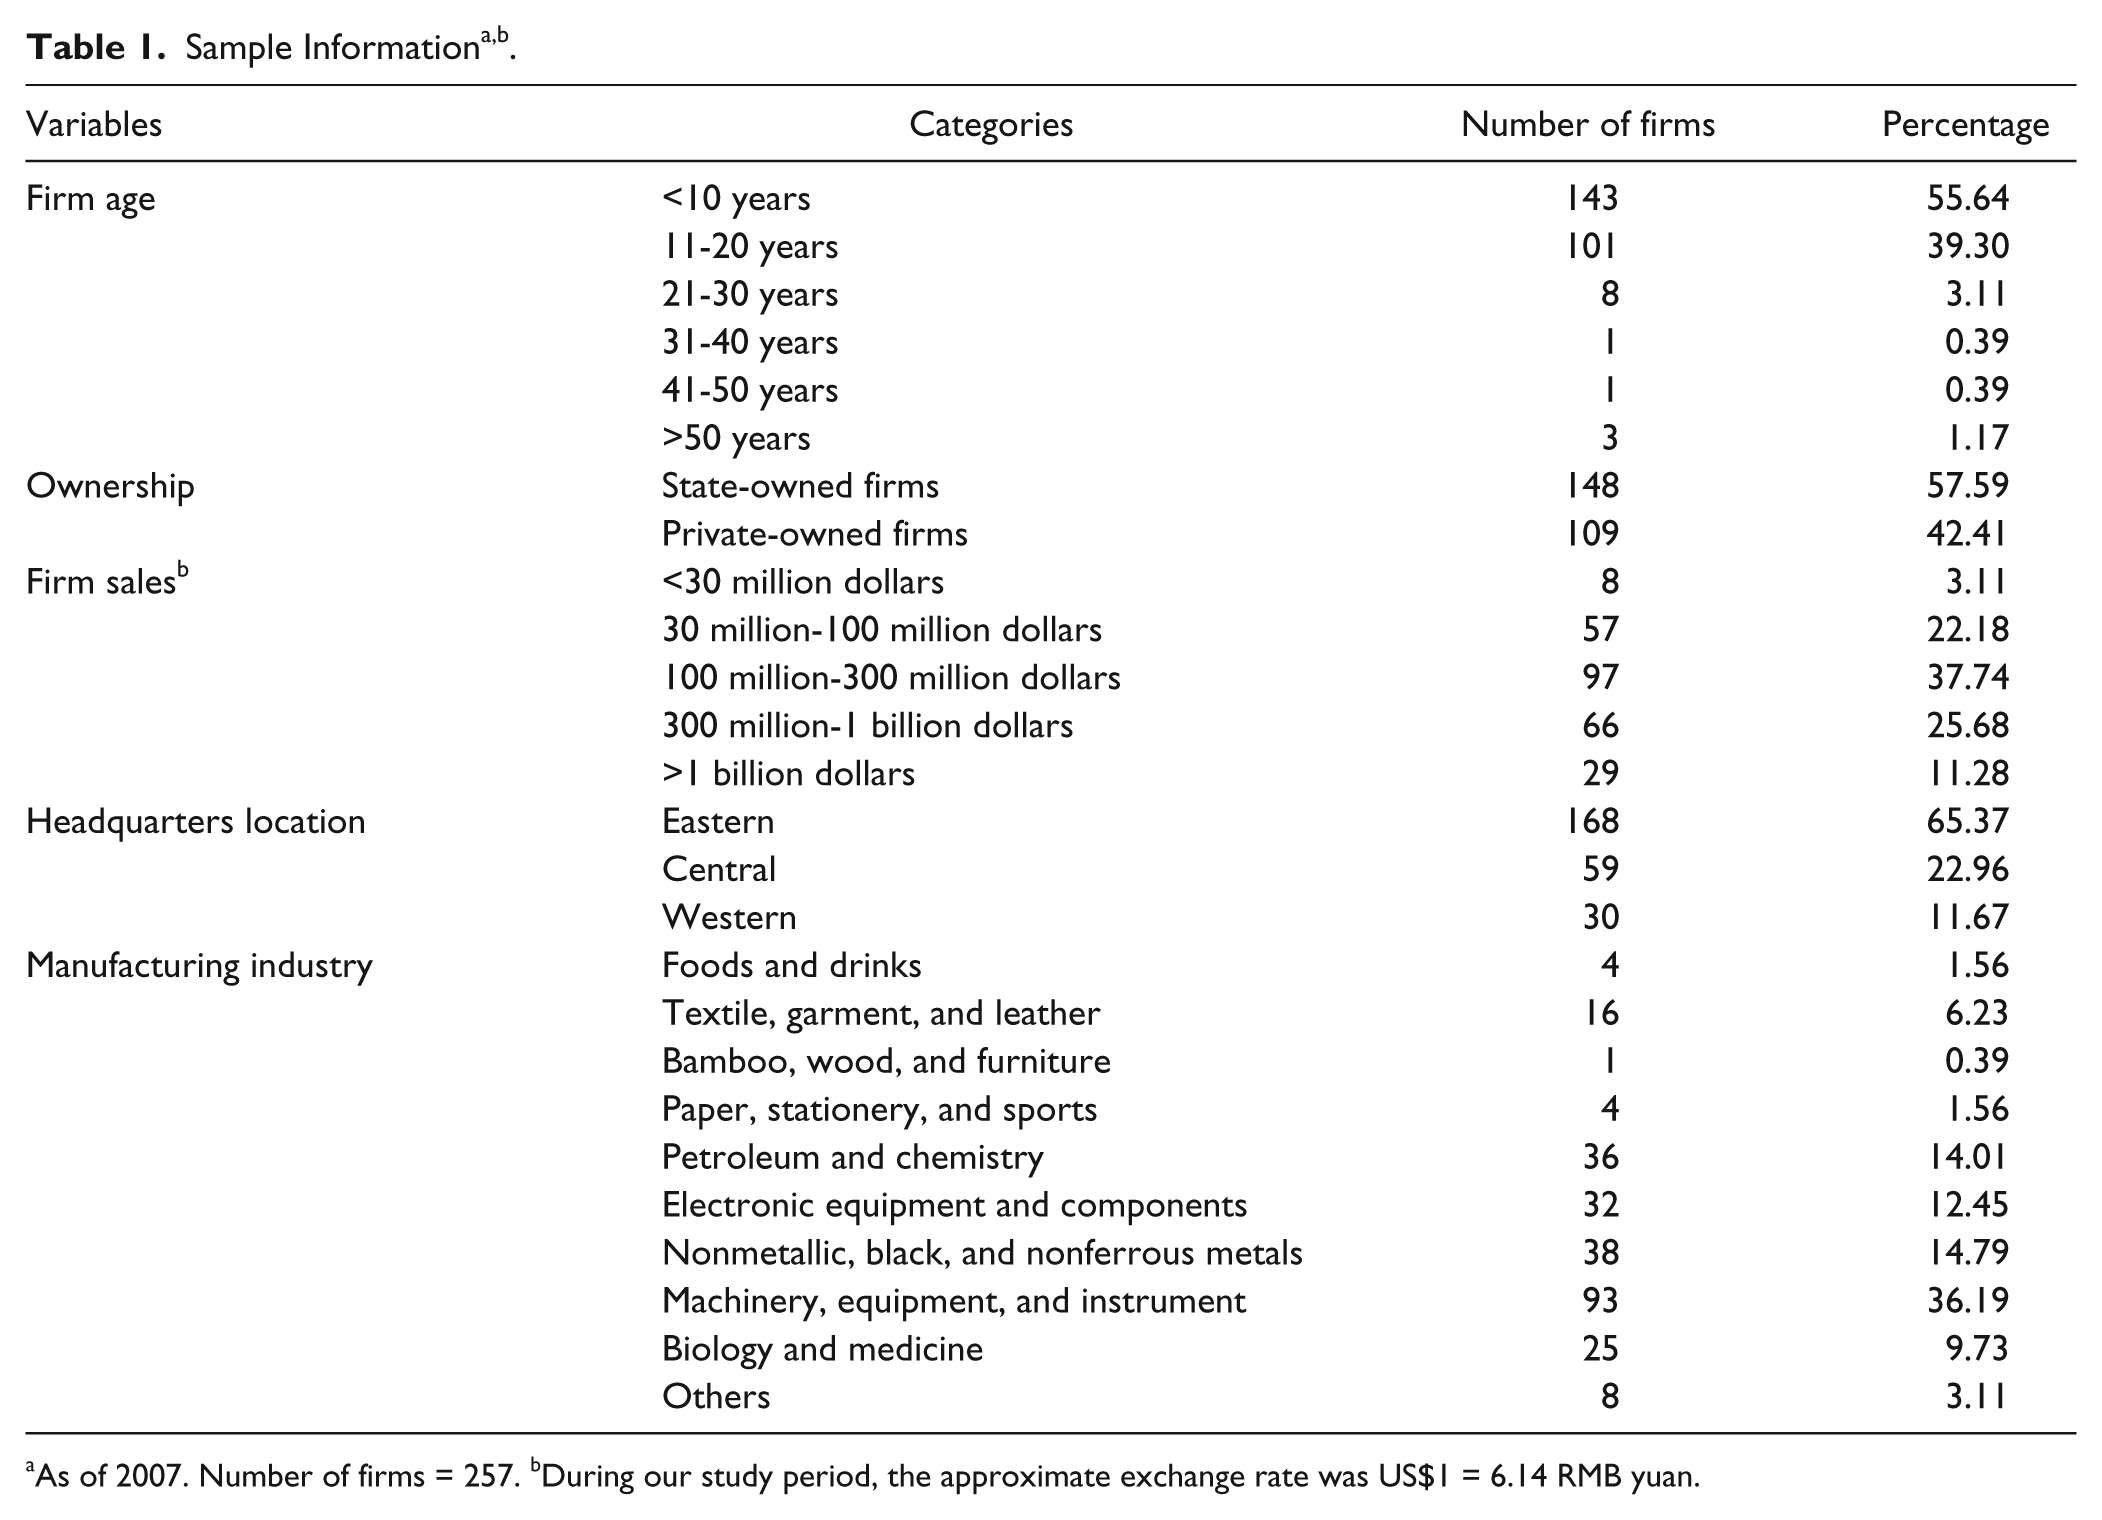
As of 2007. Number of firms = 257. bDuring our study period, the approximate exchange rate was US$1 = 6.14 RMB yuan.
Dependent Variable: Growth in Internationalization
Researchers have often adopted either scale-based or scope-based measures of internationalization (Hitt, Uhlenbruck, & Shimizu, 2006; Rugman & Oh, 2013). A common scale-based measure was the ratio of foreign sales to total sales to represent the depth of internationalization (Tseng et al., 2007). A common scope-based measure was the ratio of the number of foreign subsidiaries to the number of total subsidiaries, reflecting the breadth of internationalization (Goerzen & Beamish, 2003; Qian, Khoury, Peng, & Qian, 2010). However, some scholars contended that a single measure of internationalization may not fully capture this complicated concept (Capar & Kotabe, 2003; Qian et al., 2010; Sun et al., 2015). Taking these concerns into account, we endeavored to capture both the depth and breadth of internationalization. Specifically, we followed J. W. Lu and Beamish (2004) and Sun et al. (2015) to integrate the two measures into a composite measure by taking the average of the two ratios.
The data of foreign sales were obtained from the OSIRIS database, and the information of subsidiaries came from OSIRIS and annual reports. OSIRIS provided information on foreign sales, while it did not provide counts of every sampled firm’s subsidiaries in each given year. Thus, we identified the number of foreign subsidiaries and total subsidiaries for each firm in a given year according to name, location, and foreign currency of each subsidiary from each firm’s annual reports. With the information, we calculated the average value of the ratio of foreign sales to total sales and the ratio of foreign subsidiaries to total subsidiaries—each ratio represents 50% of weight. Our final measure of internationalization took the value ranging from 0 to 1, with 1 representing “all activities in foreign markets” and 0 representing an “exclusive focus on domestic markets with no business abroad.” To capture how rapid EE firms expand to international markets, we followed Tseng et al. (2007) and Xia et al. (2014) to operationalize growth in internationalization as the change in the degree of internationalization within a 1-year period.
Independent Variables
Technological Resources
Consistent with prior studies, we used R&D intensity as a proxy for technological resources. Specifically, R&D intensity was measured as the ratio of R&D expenses to total sales (Tseng et al., 2007; Vissa et al., 2010). We extracted the information on R&D expenses from WIND and complemented it with data manually collected from annual reports. Before 2011, there was no standard format for Chinese firms’ disclosure of R&D investment. By checking the key words—R&D expenses, technology investment, innovation expenses, or other similar words in the annotations of expenses and cash flow information—we obtained data on R&D expenses (Liu & Liu, 2007; T. Lu & Dang, 2014). We compared our manually collected R&D expenses with the data from WIND and found little significant difference.
Marketing Resources
Following Tseng et al. (2007) and Vissa et al. (2010), we operationalized marketing resources as the percentage of marketing expenses to total sales. We obtained firms’ total marketing expenses from OSIRIS, which covered all expenditures related to marketing activities, including costs for advertising, sales promotion, rebates, discounts, and all other marketing-related costs incurred during an accounting year.
Performance Relative to Aspirations
This construct reflects the extent to which performance deviates from aspirations (Greve, 1998). Performance was measured by return on assets, which was calculated as the ratio of net profit to total assets and obtained from OSIRIS. Following Cyert and March (1963), we specified aspirations as a mixture of social and historical aspirations. Social aspirations were measured as the mean of all other firms’ performance in an industry with same three-digit industry code (Baum et al., 2005; Iyer & Miller, 2008). Historical aspirations were calculated by an exponentially weighted average of previous performance levels of the focal firm (Hu, Blettner, & Bettis, 2011). Letting i and h be weights, the formulas are


where At,k is the aspirations of the focal firm k at period t; SAt,k is the social aspirations of focal firm k during period t; and HAt,k is the historical aspirations of focal firm k during period t.
Pt − 1,k represents the performance of focal firm k during period t − 1. At the same time, i and 1 − i are weights given to SAt,k and HAt,k, respectively; h and 1 − h are weights given to HAt − 1,k and Pt − 1,k during period t − 1, respectively. HAt,k is a composed observation of previous HA and previous performance at weight h during period of t − 1. The value of aspirations At,k is computed as the combination of SA and HA at weight i. To determine the value of i and h, we employed the value of 0.25, 0.5, and 0.75, respectively (Baum et al., 2005). Then we compared the results with three kinds of parameter’s value. As a result, we found that when h and i = 0.5, the fit of regression equations was the best.
Control Variables
Hitt, Tihanyi, Miller, and Connelly (2006) pointed out firms’ characteristics, financial characteristics, board factors, and institutional factors as antecedents of international expansion. Following Hitt, Tihanyi, et al. (2006), we included 11 control variables. First, we controlled firm age and size. Firm age was measured by a firm’s existence period from the founding year to the observation year (C. Wang, Hong, Kafouros, & Wright, 2012). Firm size was expressed by the total number of employees. Firm age and firm size were both in natural logarithmic form. Data of firm age and size were obtained from OSIRIS.
Second, to control the effect of threat-rigidity from bankruptcy, we included the distance from bankruptcy as a control. Following Chen and Miller (2007) and Iyer and Miller (2008), we used Altman’s (1983) Z-score as a measure of distance from bankruptcy, which was calculated as (1.2 × working capital divided by total assets) + (1.4 × retained earnings divided by total assets) + (3.3 × income before interest expense and taxes divided by total assets) + (0.6 × market value of equity divided by total liability) + (1.0 × sales divided by total assets). A lower z value indicates a higher likelihood of bankruptcy. We controlled the ratio of debt to asset as the financial factor (J. T. Li & Tang, 2010). Data for distance from bankruptcy and debt/asset were obtained from OSIRIS.
Third, we controlled board size that was measured by the number of directors, because board size may reflect the diversity of board members’ background and information sources and potentially affect firms’ international expansion (Puffer, McCarthy, Jaeger, et al., 2013). We included the effects of CEO duality by a dummy variable (1 = the same person for both CEO and chairman positions, 2 = two different persons), since that duality may determine a firms’ willingness to take risk in pursing short-term or long-term goal (Peng et al., 2010). The information of directors and CEO was obtained from WIND.
Fourth, in China, firms with different ownership structures usually have different relationships with government agencies and thus face different regulatory and resource support. At the same time, due to the institutional transitions and unbalanced development across different regions, the institutional and market environments in different provinces are different (Shi, Sun, & Peng, 2012; Shi, Sun, Pinkham, & Peng, 2014; Sun et al., 2015). Hence, we included firms’ state ownership and headquarters location to control the effects of government and institutional factors. State ownership was controlled by a dummy variable, which 1 represents “state-owned enterprise” (SOE) if the actual ultimate controlling shareholder of the firm is the state or governmental agency and 0 is for “private-owned enterprise” (Liang et al., 2015). Headquarters locations were captured by a category variable (1 = eastern area, 2 = central area, 3 = western area). The information about state ownership and headquarters was obtained from WIND and OSIRIS, respectively.
Finally, we included product diversification as a control since it may provide an alternative for risk taking and affect the firms’ internationalization (Hitt, Hoskisson, & Kim, 1997). Product diversification was measured by the number of firms’ products and was obtained from OSIRIS. Industry and year effects were controlled. Industry effects were controlled by using the category of industrial sector, which come from Industry Classification Guide of Listed Companies issued by the CSRC. We used 9 dummy variables representing 10 industrial subsectors (see Table 1). Year effects by using four dummy variables for 5 years were controlled. The descriptive statistics for all variables are presented in Table 2.
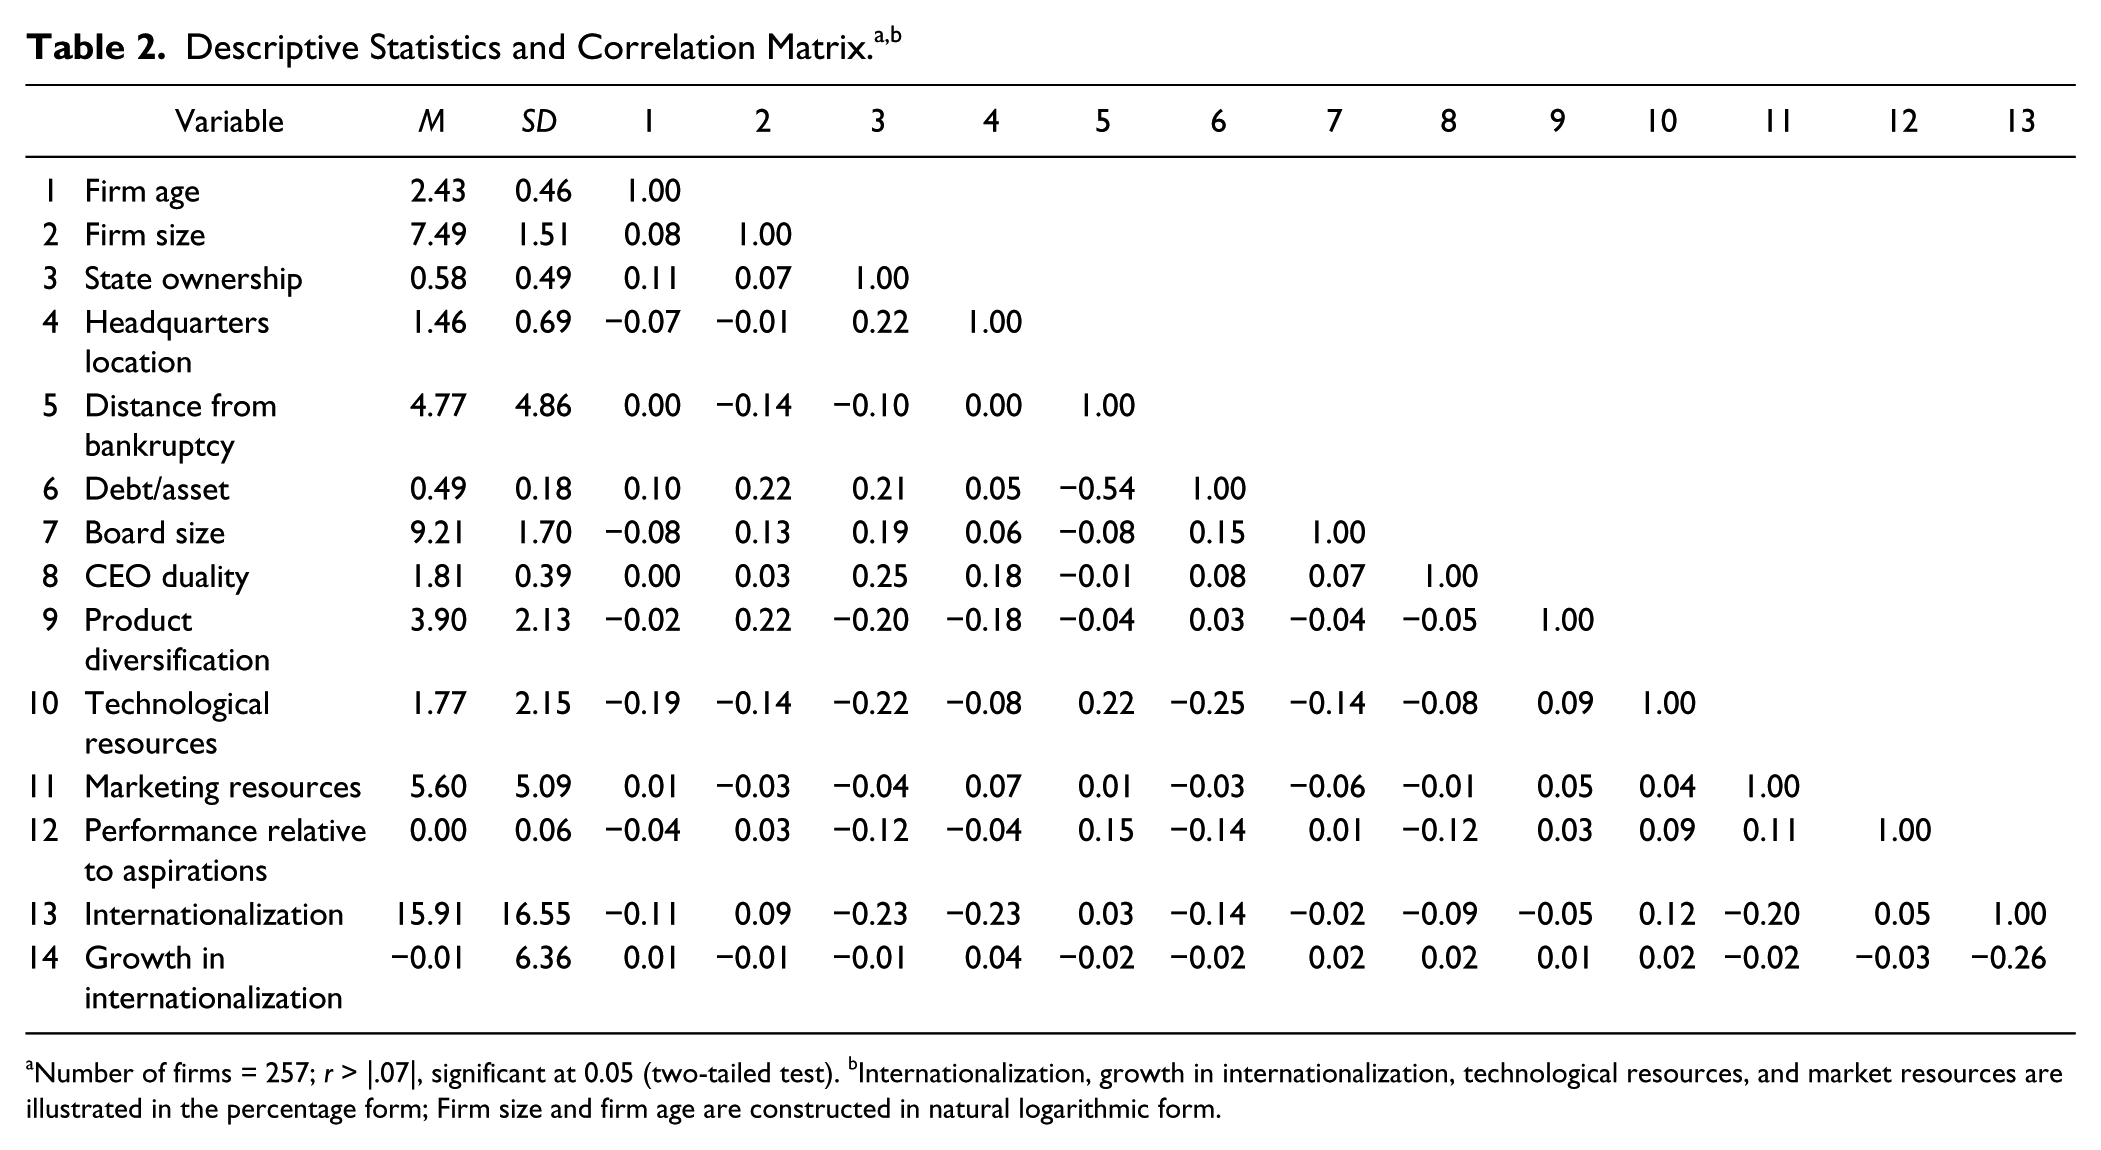
Number of firms = 257; r > |.07|, significant at 0.05 (two-tailed test). bInternationalization, growth in internationalization, technological resources, and market resources are illustrated in the percentage form; Firm size and firm age are constructed in natural logarithmic form.
Estimation Approach
To test our hypotheses, it is important to choose a proper panel estimation model according to the characteristics of data (Wooldridge, 2002). In the first step, we checked the error structure across panels and detected the presence of the heteroskedasticity and serial correlation statistics by using a log likelihood test and the Wooldridge (2002) test. Random effects or fixed effect panel estimating model did not seem appropriate under such an error structure. Instead, a feasible generalized least squares (FGLS) estimation method accommodates the presence of heteroskedasticity, autocorrelation within panels, and cross-sectional correlations (Harvey, 1976). Therefore, we employed FGLS estimator and applied the xtgls command with the option panels (he) to correct for error structure (STATA 12.0). This estimation method was widely used in previous research (Lee & Song, 2012; Turner & Fern, 2012; Zhang & Rajagopalan, 2010). Hence, we formulated the general form of model:
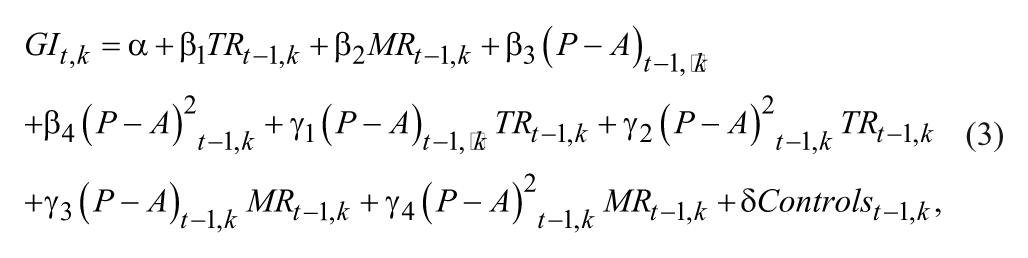
where GIt,k is coded as the growth of internationalization of firm k in year t. TRt − 1,k is the value of technological resources in the period t − 1. MRt − 1,k reflects the value of marketing resources in the period t − 1. (P − A)t − 1,k is the firm k performance relative to aspirations that is computed as the distance of performance relative to aspirations in the period t − 1. (P − A)2t − 1,k represents the squared value of (P − A)t − 1,k. (P − A)t − 1, k × TRt − 1,k, (P − A)2t − 1,k × TRt − 1,k, (P − A)t − 1, k × MRt − 1,k and (P − A)2t − 1,k × MRt − 1,k represent the interaction terms of (P − A)t − 1,k and (P − A)2t − 1,k with TRt − 1,k and MRt − 1,k in the period t − 1.
Results
Six FGLS models are used (Table 3). Industry and year effects are included but not reported due to space constraints. As the baseline, Model 1 contains only the control variables. Model 2 adds technological and marketing resources. In Model 3, we add performance relative to aspirations and its squared value based on Model 1. Model 4 includes technological resources, marketing resources, performance relative to aspirations, and the squared term of performance relative to aspirations. Models 5 and 6 are used to test the moderating effects of technological resources and marketing resources on the relationship between performance relative to aspirations and growth in internationalization, respectively. All models are significant as gauged by the model chi-square (χ2) statistics. We build the models incrementally, from the baseline to the addition of independent variables and moderating variables step by step. The changes in model χ2 are significant (p < .05), marking the improvement in overall model fit by the addition of the respective variables in each model. Following Aiken and West (1991), we standardize the independent variables in generating the moderating terms to mitigate potential collinearity. Variance inflation factors (VIFs) are used to test for multicollinearity. None of VIF score approaches the commonly accepted threshold of 10 (the highest VIF is 1.67). These results suggest that multicollinearity was not a significant problem.
FGLS Regression Analysis for Growth in Internationalization.
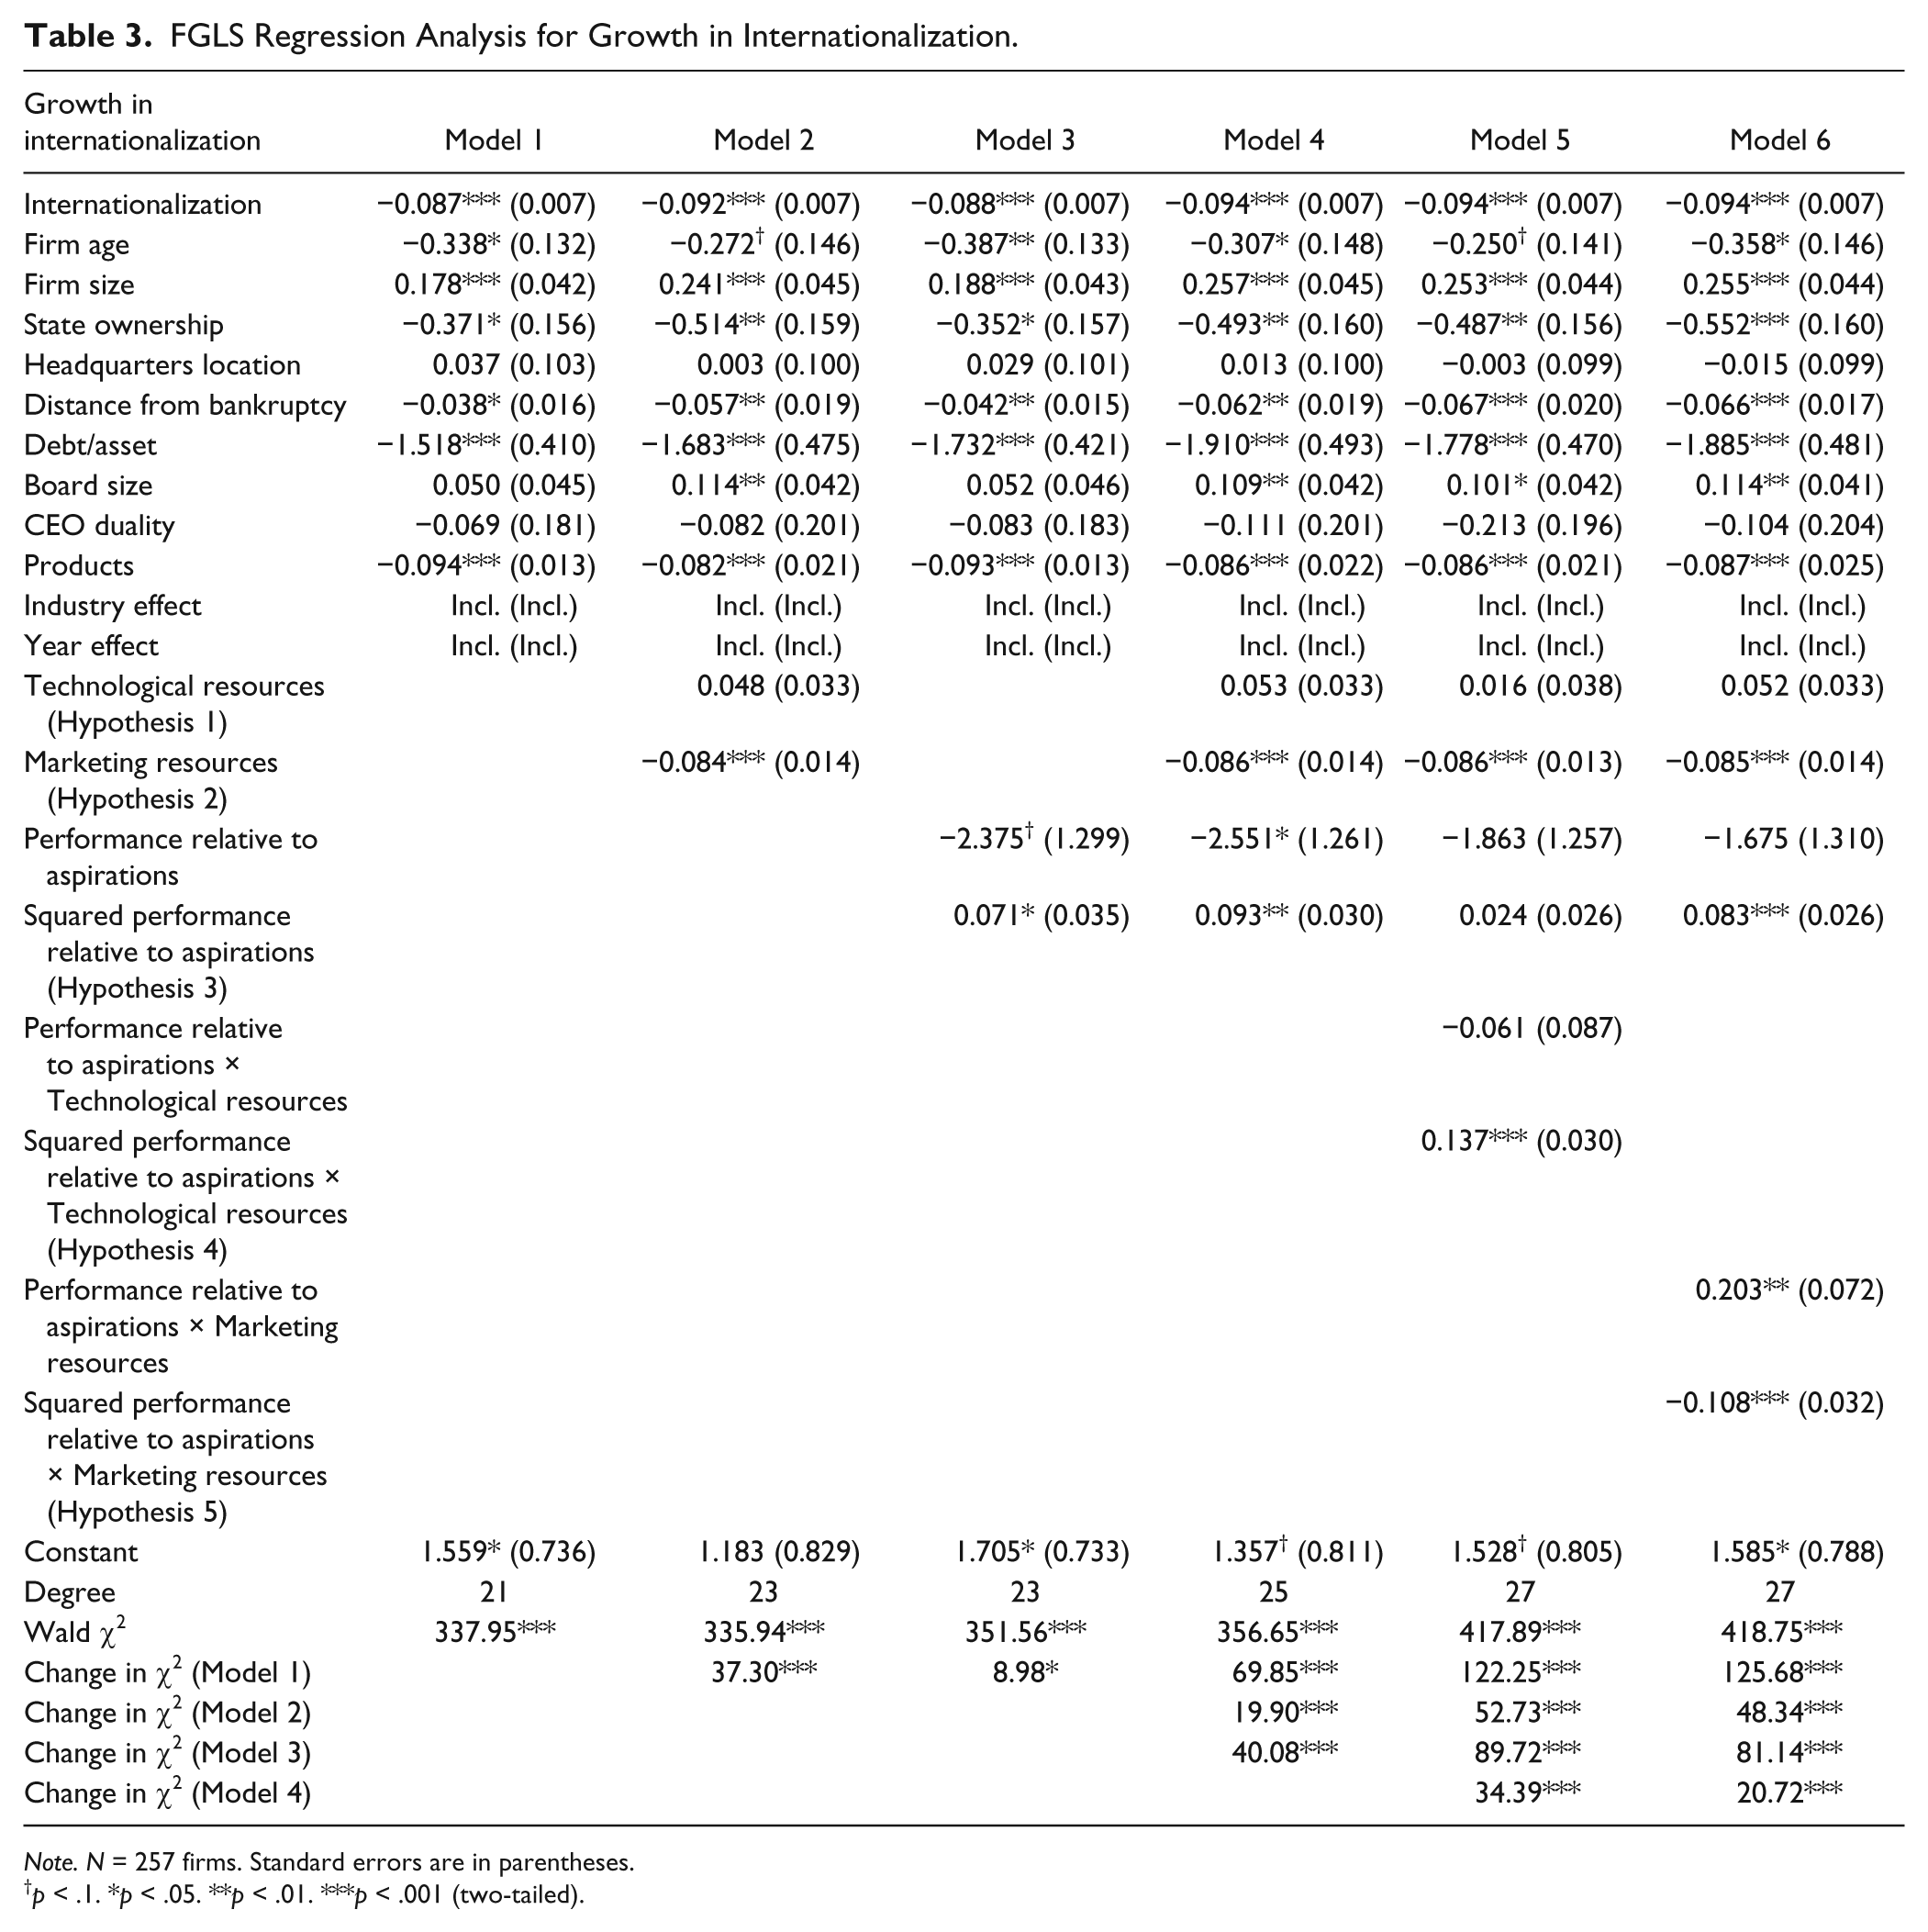
Note. N = 257 firms. Standard errors are in parentheses.
p < .1. *p < .05. **p < .01. ***p < .001 (two-tailed).
Hypothesis 1 predicts that technological resources are positively associated with the growth in internationalization. From Model 2, our results indicate the effect is not significant, failing to support Hypothesis 1. Hypothesis 2 proposes a negative relationship between marketing resources and growth in internationalization. Model 2 indicates that the effect of marketing resources is negatively significant (β = −0.084; p < .001), supporting Hypothesis 2.
Hypothesis 3 predicts a U-shaped effect of performance relative to aspirations on growth in internationalization. Model 3 shows that the estimated coefficient of performance relative to aspirations is negative and significant (β = −2.375; p < .1), and it shows a positive and significant correlation between squared performance relative to aspirations and growth in internationalization (β = 0.071; p < .05). These results support Hypothesis 3. Model 4 includes all main effects and there is no significant change of the coefficients and the significance levels.
In Hypotheses 4 and 5, we suggest the moderating roles of resources on the linkage between performance relative to aspirations and growth in internationalization. Model 5 shows that the interaction between technological resources and the squared performance relative to aspirations is positive and significant (β = 0.137; p < .001). The finding illustrates that technological resources may strengthen the U-shaped relationship between performance relative to aspirations and growth in internationalization in support of Hypothesis 4. Model 6 indicates a negative and significant interaction between marketing resources and squared performance relative to aspirations (β = −0.108; p < .001). The result suggests that marketing resources may weaken the U-shaped effect of performance relative to aspirations on growth of internationalization, thus supporting Hypothesis 5.
To investigate the moderating effects fully, we follow Aiken and West (1991) by decomposing the interaction terms and compare the impact of performance relative to aspirations on growth in internationalization at low and high levels of the moderating variables. Specifically, we plot the relationships in Figure 2. Panel A suggests performance relative to aspirations has a stronger U-shaped effect on international growth for EE firms with a higher level of technological resources. However, we can see from Panel B that performance relative to aspirations has a weaker U-shaped impact on growth in internationalization for firms with a higher level of marketing resources. In other words, strong technological resources strengthen the U-shaped relationship between performance relative to aspirations and growth in internationalization, while strong marketing resources weaken that relationship.
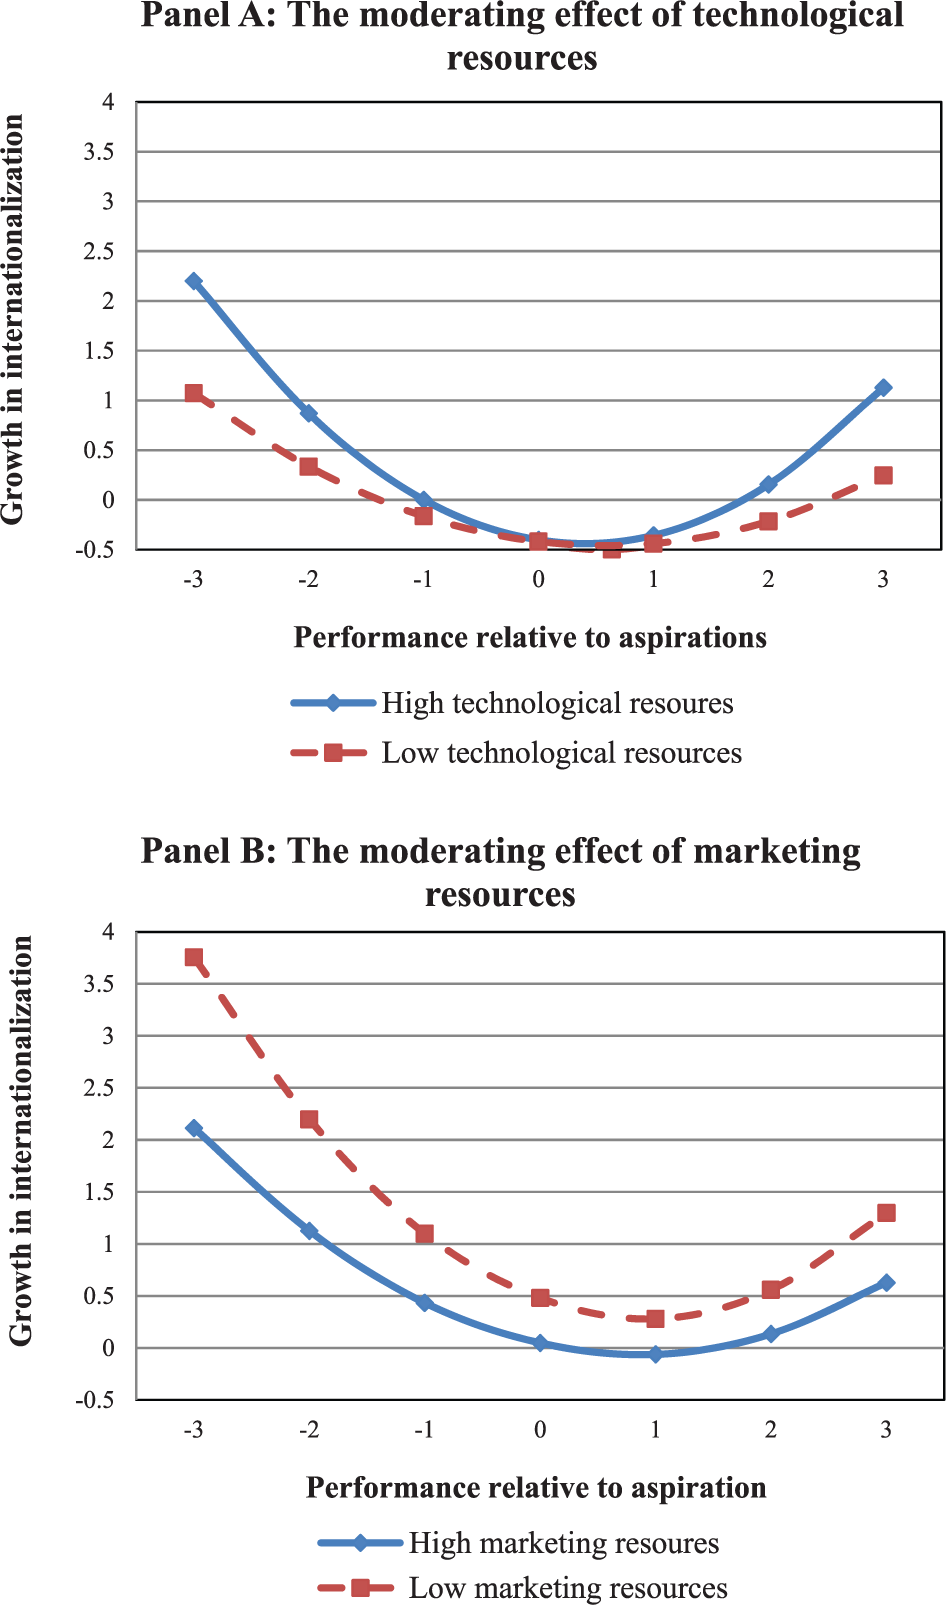
The moderating effects of technological and marketing resources.
Discussion
Contributions
At least three contributions emerge from our study. First, the study offers further insights on the role of knowledge-based resources in EE firms’ rapid internationalization. Earlier studies focusing on multinationals from DE have argued that superior knowledge-based assets facilitate firms’ internationalization. We know little about whether these facilitating effects would hold among EE firms that largely undertake rapid internationalization as an approach to seek valuable assets. Leveraging the notion of geographic fungibility, we reason and test the inconsistent effects of technological resources and marketing resources on EE firms’ growth in internationalization. Our findings show that we cannot simply follow studies focusing on mature multinationals from DE to predict a facilitating effect of knowledge-based resources in emerging multinationals from EE. Geographically, nonfungible marketing resources impede EE firms’ growth in internationalization, while geographic fungible technological resources exert no significant effect.
Based on a resource-seeking view of EE firms’ internationalization, some scholars have suggested a more complicated relationship between knowledge-based resources and EE firms’ internationalization (Gubbi et al., 2010; Luo & Tung, 2007; Yiu et al., 2007). Our findings support this view and offer a deeper understanding on the role of knowledge-based assets in EE firms’ rapid internationalization. The nonsignificant effect between knowledge-based resources and internationalization may not only be attributed to Chinese firms’ limited absorptive capacity but also to institutional distance, cultural conflicts, and even host country institutional pressures (Ang, Benischke, & Doh, 2015; Meyer, Ding, Li, & Zhang, 2014; Meyer & Peng, 2016; Stevens, Xie, & Peng, 2015). As a result, even if Chinese firms improve absorptive capacity based on their stronger technological resources, they may still be unable to acquire technological or related expertise from foreign markets. At that time, the link between technological resources and EE firms’ international expansion may become less significant.
Second, our study strengthens the explanatory and predictive power of the BTF by investigating why firms engage in rapid international expansion. Although the BTF is widely used to explain why managers engage in various types of exploratory activities (Baum et al., 2005; Greve, 2007), it is seldom used to investigate the drivers of rapid internationalization. Our results document a U-shaped effect of performance relative to aspirations on EE firms’ growth in internationalization. Due to inadequate knowledge and experience in doing business overseas, EE firms face substantial risks when they try to acquire valuable assets by expanding to global markets. It is hence necessary to explore drivers behind EE firms’ rapid internationalization from a risk-taking perspective. Our findings show that EE firms do change their preference toward rapid internationalization according to gaps between their performance and aspirations. To the best of our knowledge, this is one of the first times the BTF has been extended to investigate the internationalization of emerging multinationals.
Third, integrating the RBV and the BTF, our study reveals that knowledge-based resources moderate the relationship between performance relative to aspirations and EE firms’ growth in internationalization. The majority of the models of internationalization are main effect models (Kirca et al., 2011). Scholars recently have called for more efforts to develop moderating models by which we can examine whether selected drivers of firm growth in internationalization are more prominent under certain conditions (Hitt, Tihanyi, et al., 2006). Drawing on the RBV and BTF, we build and substantiate a moderating model and suggest how the effect of performance relative to aspirations on EE firms’ growth in internationalization is contingent on their resource profiles.
The tested moderating effects of knowledge-based resources also contribute to the BTF. Although much research has applied the BTF to examine why firms adopt risky alternatives (Baum et al., 2005; Bromiley, 1991; Greve, 2007; Iyer & Miller, 2008), some scholars have recently criticized such research for putting too much emphasis on individual-level explanations and for offering unrealistic representations of how strategic decisions are made (Audia & Greve, 2006; Blettner et al., 2015; Greve, 1998; Plambeck, 2012). Correspondingly, they call for new research that takes organizational contexts into consideration. We have responded to such calls by testing the moderating effects of knowledge-based resources on the linkage between performance relative to aspirations and EE firms’ growth in internationalization. Thus, our study suggests that future research underlying the BTF may need to emphasize organizational contextual factors when predicting whether and how managers respond to gaps between actual performance and aspirations.
Managerial Implications
Our findings provide important implications to EE firms engaged in international growth. First, the study helps managers in EE to understand the different roles of various types of internal resources in driving firms’ growth in internationalization. Although conventional wisdom suggests that a stronger inventory of knowledge-based resources would promote rapid growth in internationalization (Kotabe et al., 2002; Tseng et al., 2007; Yamakawa et al., 2013), we contend that such a conclusion is not necessarily applicable in emerging multinationals. According to our findings, rich technological resources have little effect on international expansion, and furthermore, strong marketing resources even stand in the way of internationalization.
Second, our results shed light on the timing of EE firms’ international expansion. Specifically, managers in Chinese firms may engage in international expansion when firm performance is distant from aspirations. Such an inclination will be stronger when firms have rich technological resources but few marketing resources. Entering foreign markets is a high-risk endeavor for EE multinationals. Managers may need to be more cautious toward international expansion when their firms’ performance is far below or far above aspirations level while having strong technological knowledge. For instance, during the period from 2008 to 2009, many large SOEs in China were highly motivated to engage in international expansion. Such a trend was surprising but understandable: A severe decline in the global economy resulted in performance far worse than their aspirations. Managers were motivated to undertake risky international expansion to improve firm performance. Consistent with our suggestion, the State-owned Assets Supervision and Administration Commission of the State Council, which controls all critical SOEs, has cautioned that SOEs should be more conservative in international expansion.
Limitations and Future Research Directions
Four theoretical, methodological, and geographic limitations suggest a variety of future research directions. Theoretically, we have emphasized the drivers of internationalization at the firm level with insights from the RBV and the BTF. It may be useful for future research to explore drivers at different levels (e.g., individual and top management team levels) and assess the relative weight of these different theoretical factors in one study (Kirca et al., 2011). In addition, because EE firms generally are in the initial stages of their internationalization, we consider their existing knowledge-based resources are mainly developed in domestic markets (C. Wang et al., 2012; Yamakawa et al., 2013). It may be interesting for future research to examine if domestically or internationally developed resources play different roles in their growth in internationalization.
Methodologically, our sample is publicly listed firms in China. They are generally large and well endowed. However, the internationalization literature has acknowledged that many small and entrepreneurial firms internationalize in a more radical approach (Yamakawa et al., 2008). It is hence worth examining whether our findings are applicable to these smaller firms.
Geographically, limiting our study to China, while removing cross-country differences, leaves open the question of how generalizable our findings are (Peng, 2012; Yamakawa et al., 2013). It remains to be seen in future research whether our China-based findings can be found in other EEs, such as Brazil, Russia, and India (Hoskisson et al., 2013).
Conclusion
As rapid international expansion of firms from EEs becomes more wide spread globally, it is necessary to examine the drivers behind such phenomena (Mutlu et al., 2015; Peng, 2012; Young, Tsai, Wang, Liu, & Ahlstrom, 2014). We find that neither technological resources nor marketing resources—two principal drivers behind DE firms’ international expansion—increase EE firms’ internationalization. Instead, large gaps between performance and aspirations fuel firms’ rapid international expansion. The study also indicates that knowledge-based resources moderate the effects of performance relative to aspirations. In conclusion, our findings suggest that for emerging multinationals, performance relative to aspirations is an important but underexplored driver behind their rapid internationalization, although the effect would be constrained or enabled by firms’ knowledge-based resources.
Footnotes
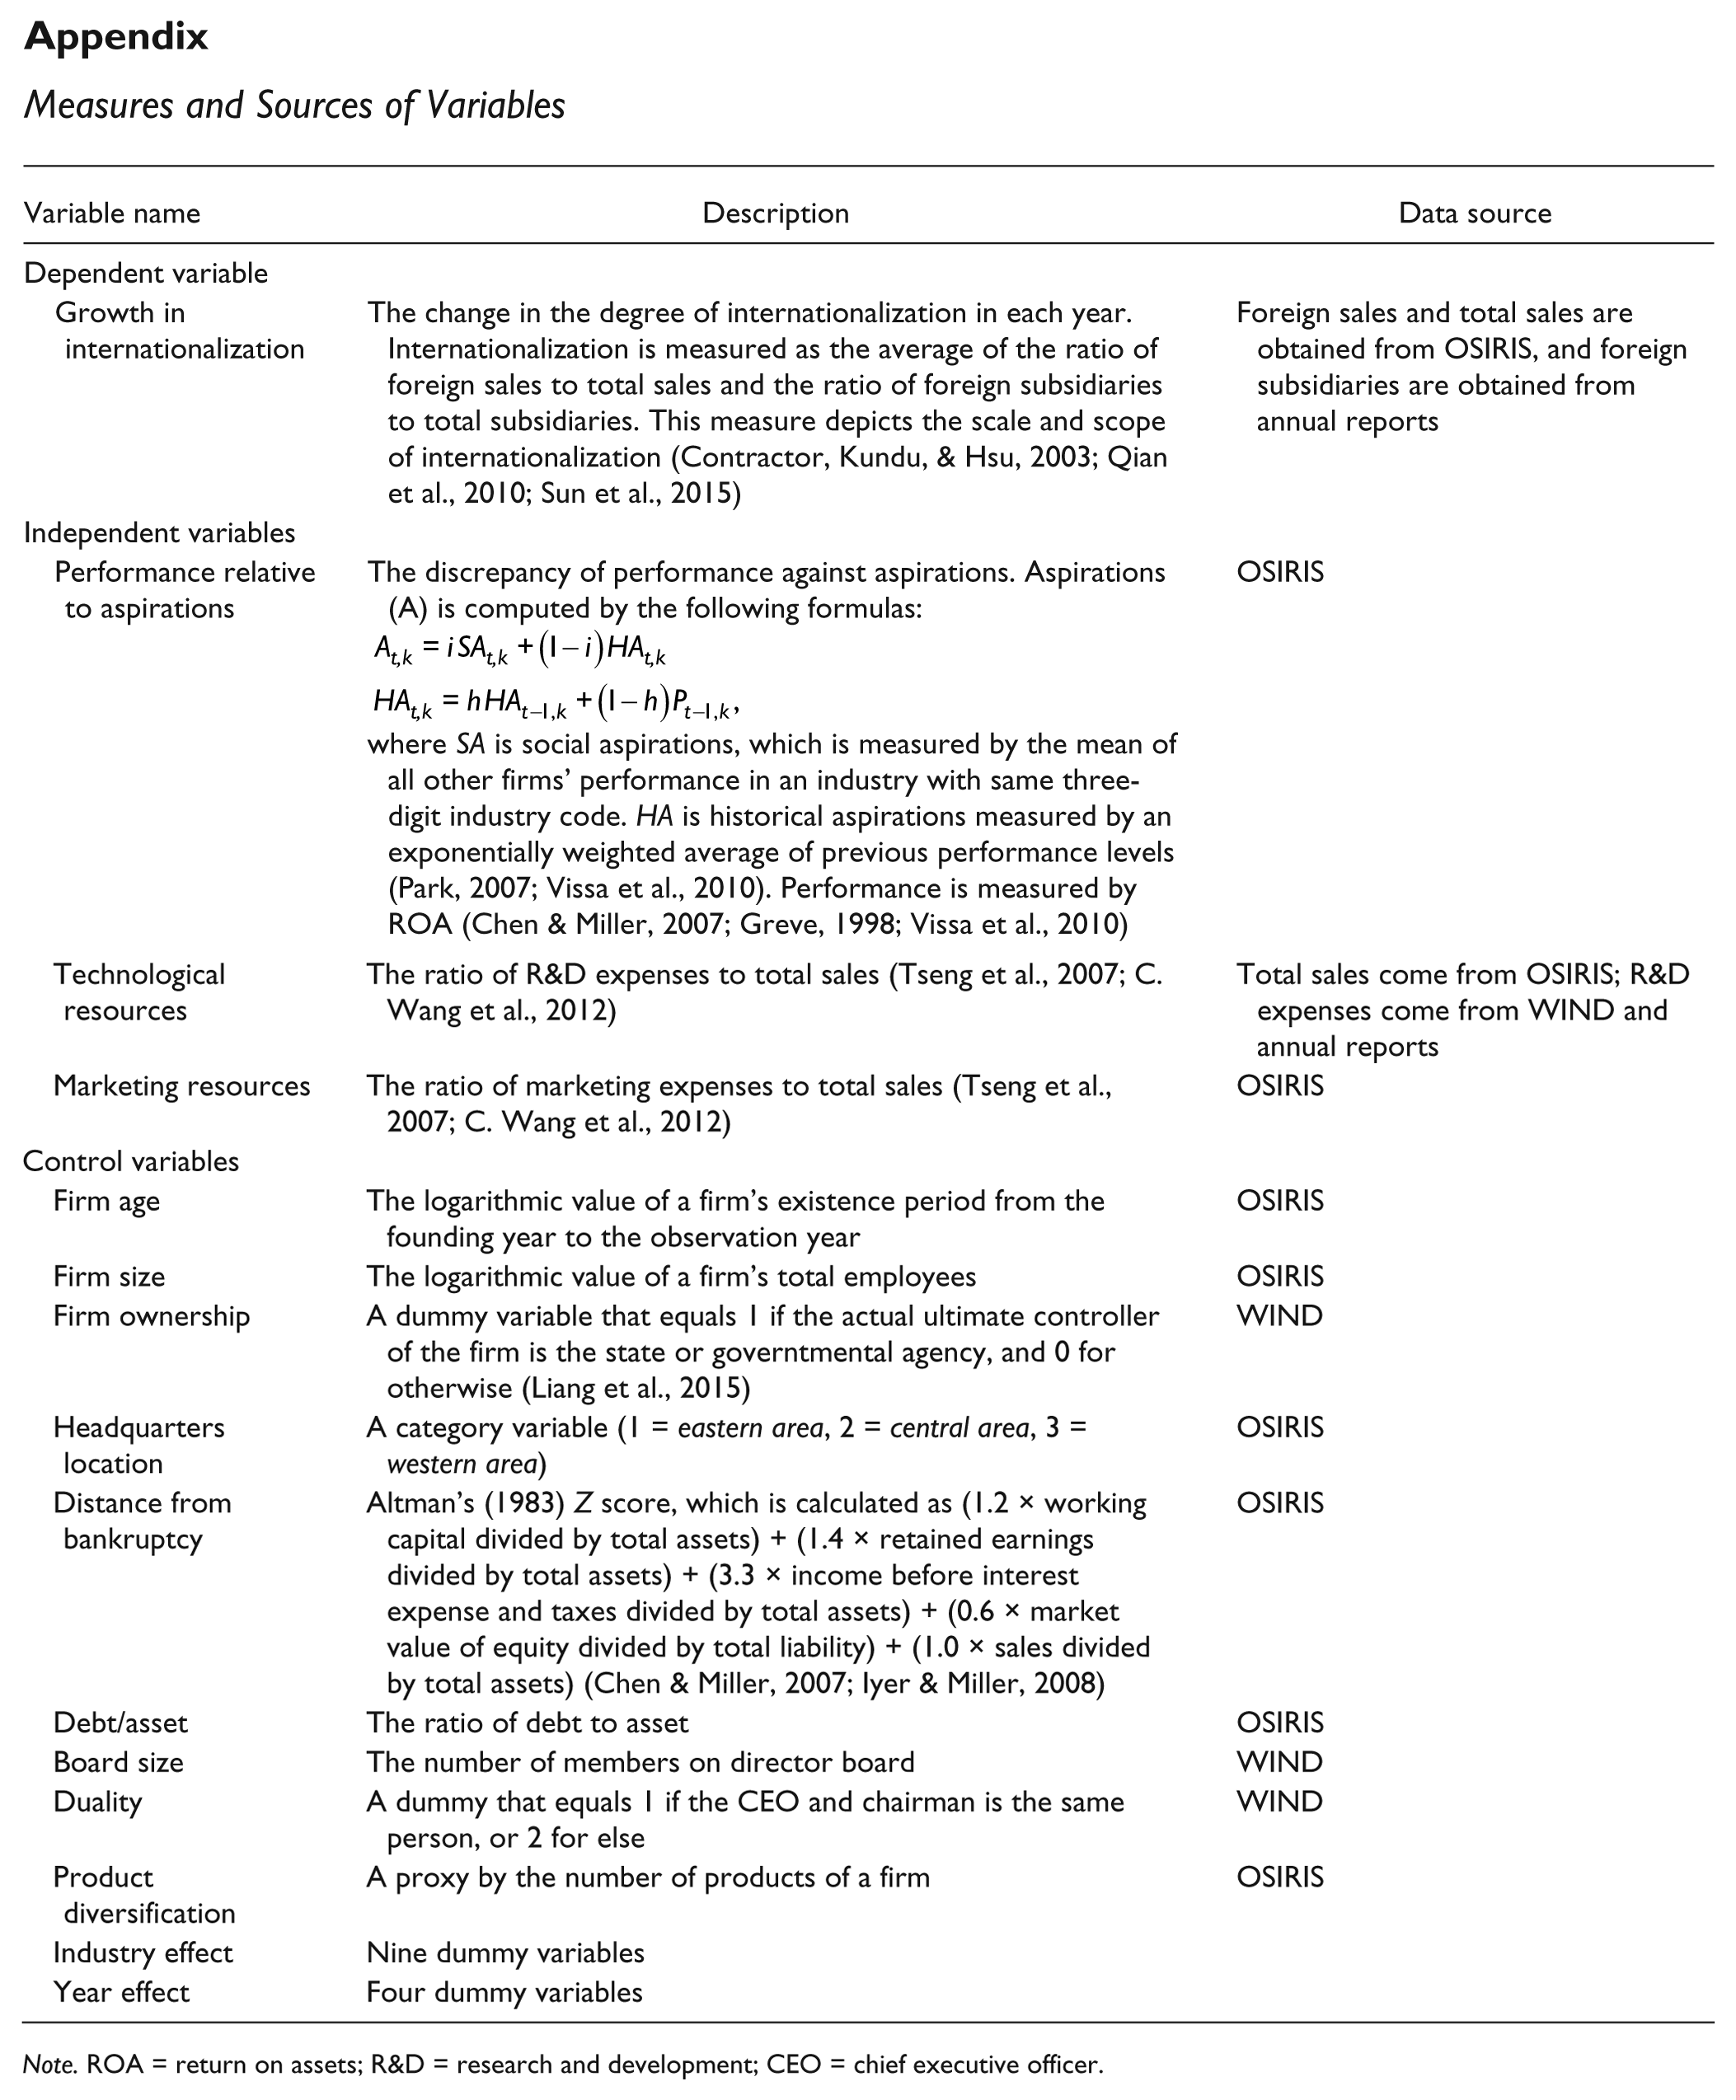
Appendix
Measures and Sources of Variables
| Variable name | Description | Data source |
|---|---|---|
| Dependent variable | ||
| Growth in internationalization | The change in the degree of internationalization in each year. Internationalization is measured as the average of the ratio of foreign sales to total sales and the ratio of foreign subsidiaries to total subsidiaries. This measure depicts the scale and scope of internationalization (Contractor, Kundu, & Hsu, 2003; Qian et al., 2010; Sun et al., 2015) | Foreign sales and total sales are obtained from OSIRIS, and foreign subsidiaries are obtained from annual reports |
| Independent variables | ||
| Performance relative to aspirations | The discrepancy of performance against aspirations. Aspirations (A) is computed by the following formulas: where SA is social aspirations, which is measured by the mean of all other firms’ performance in an industry with same three-digit industry code. HA is historical aspirations measured by an exponentially weighted average of previous performance levels (Park, 2007; Vissa et al., 2010). Performance is measured by ROA (Chen & Miller, 2007; Greve, 1998; Vissa et al., 2010) |
OSIRIS |
| Technological resources | The ratio of R&D expenses to total sales (Tseng et al., 2007; C. Wang et al., 2012) | Total sales come from OSIRIS; R&D expenses come from WIND and annual reports |
| Marketing resources | The ratio of marketing expenses to total sales (Tseng et al., 2007; C. Wang et al., 2012) | OSIRIS |
| Control variables | ||
| Firm age | The logarithmic value of a firm’s existence period from the founding year to the observation year | OSIRIS |
| Firm size | The logarithmic value of a firm’s total employees | OSIRIS |
| Firm ownership | A dummy variable that equals 1 if the actual ultimate controller of the firm is the state or governtmental agency, and 0 for otherwise (Liang et al., 2015) | WIND |
| Headquarters location | A category variable (1 = eastern area, 2 = central area, 3 = western area) | OSIRIS |
| Distance from bankruptcy | Altman’s (1983) Z score, which is calculated as (1.2 × working capital divided by total assets) + (1.4 × retained earnings divided by total assets) + (3.3 × income before interest expense and taxes divided by total assets) + (0.6 × market value of equity divided by total liability) + (1.0 × sales divided by total assets) (Chen & Miller, 2007; Iyer & Miller, 2008) | OSIRIS |
| Debt/asset | The ratio of debt to asset | OSIRIS |
| Board size | The number of members on director board | WIND |
| Duality | A dummy that equals 1 if the CEO and chairman is the same person, or 2 for else | WIND |
| Product diversification | A proxy by the number of products of a firm | OSIRIS |
| Industry effect | Nine dummy variables | |
| Year effect | Four dummy variables | |
Note. ROA = return on assets; R&D = research and development; CEO = chief executive officer.
Declaration of Conflicting Interests
The author(s) declared no potential conflicts of interest with respect to the research, authorship, and/or publication of this article.
Funding
The author(s) disclosed receipt of the following financial support for the research, authorship, and/or publication of this article: This research is supported by the National Natural Science Foundation of China (Project Nos. 71172185) and by the Jindal Chair at the University of Texas, Dallas.