
Abstract
Baseball is a rich mélange of tradition, spectatorship, evaluation, and fandom. Statistical fandom is presented as a cultural infrastructure, which influences how all fans perceive the game including what is valued in the game, how the game itself is played, and Major League Baseball as an industry. In building off of Halverson’s conception of a fantasy plane of baseball fandom, this research theorizes an additional statistical plane. Sabermetrics serve as a microcosm for a larger statistical turn in sports and reporting. The labor of saberfans builds a cultural algorithm through statistical analysis that shapes all fan engagement. Sabermetric inputs become an infrastructure of expertise through which the larger sporting public understands and evaluates baseball and culture.
Keywords
A baseball fan has the digestive apparatus of a billy goat. He can, and does, devour any set of diamond statistics with insatiable appetite and then nuzzles hungrily for more.
Baseball is an island of activity amidst a sea of statistics.
Baseball fans are junkies, and their heroin is the statistic.
Baseball is a rich mélange of tradition, athleticism, evaluation and spectatorship, culture, business, and fandom. One aspect of baseball that has recently gained notoriety and increased modes of meaningful interaction with the game and its fans is the statistical analysis of baseball. What is not understood is how saberfans (sabermetric fans) have also played a major role in the development of recent statistical inquiry and knowledge play in baseball. The history of baseball fandom is also inextricably connected to the statistical evaluation and analysis of baseball. This article begins with a cultural lineage of major touch-points in the analysis of statistics and baseball, as well as gestures toward a framework for future inquiry into baseball and sports fandom, by examining planes of fandom.
In building off of Halverson and Halverson’s (2008) conception of a fantasy plane of baseball fandom, this research includes a statistical plane. This article seeks to emphasize a cultural infrastructure (Turner, 2009) of statistical inquiry that anchors the fandom of these communities within the statistical analysis of the primary plane of baseball fandom—Major League Baseball (MLB). Halverson and Halverson (2008) identify a primary difference between the planes where, “Fans have little control over what happens in the primary plane and relate to it as media consumers. The secondary plane involves the transformation of primary franchise media content into productive expressions” (p. 292). The fantasy plane is characterized by “competitive gaming” through fantasy sports. The statistical plane transforms the primary franchise media into productive statistical expressions, but not always through competitive gaming. The fantasy plane does indeed have overlap with the statistical plane, but an understanding of sabermetrics is not required to play fantasy sports. The statistical plane does involve knowledge play, but always through the lens of statistical analysis and without the rules governing the shared game space of fantasy sports. Sabermetric play is not expressly limited to the shared game space of fantasy sports. The statistical plane differs from the fantasy plane, but it also differs from traditional fan activity. The statistical plane can cut across all players and teams to create productive articulations of fandom through sabermetrics.
This research attempts to articulate the co-constitutive relationship between sabermetrics and fandom—both that the labors of sports fans have impacted the quantification of baseball and the ways engaging in this quantification produces a particular form of statistical fandom. Baseball has always reinvented itself through statistical change since its inception. Sabermetrics begins to influence how all fans perceive the game of baseball—including what is valued in the game, how the game itself is played, and MLB as an industry.
Sabermetrics serves as a microcosm for a larger statistical turn in sports and reporting. Moreover, sports studies and popular culture studies have yet to completely account for the emergent “statistical revolution” in sports and fandom (Bialik, 2014). Research does exist linking the big data turn to sports and analytics (Baerg, 2013, 2017; Millington & Millington, 2015; Ruihley & Hardin, 2013). Hutchins (2016) argues that sports are a site for the rise of an “information technology infrastructure” (p. 501) that propels the market power of statistics. This article deals primarily with sports and statistics but provides a model through the identification of a statistical plane of fandom that can be extrapolated to other areas of popular culture and society. Consideration is given to the implications of findings for future research in sports and statistical fandom, as well as the importance of fan experts and the evaluation of fandoms as a site of pleasure that constructs norms and standards of expertise and credibility.
The advent of high-quality (at low cost) data analytics tools in the late 1980s (such as the spreadsheet program Lotus 1-2-3), reorganized everything from the stock market to information search and shopping. Statistical fandom is presented as a cultural infrastructure, borrowing from Turner’s (2009) analysis of “Burning Man” as a cultural infrastructure for Internet-based companies. Turner refers to Burning Man as both a structural and ideological cultural infrastructure that specifically shapes Google as a company. Statistical analysis, as a cultural infrastructure, can also be applied to baseball both structurally (how baseball is played) and ideologically (how baseball is perceived and constituted). Audiences negotiate and inhabit these spaces and planes of fandom to perform their respective articulation of baseball fandom. Cultural infrastructures inform the relationship the community has to the primary plane of fandom (in this case MLB) but also provides a lens for examining the contours of these emergent communities of expertise. Not only is this fan labor a form of amateur expertise (Baym, 2007), in addition, cultural infrastructures stage the performance and perception of baseball itself. This plane of expertise and statistical fandom is a different mode of viewing baseball that is separate from the normative baseball fan who attends games and purchases merchandise and the fan operating within the competitive/fantasy plane (Halverson & Halverson, 2008). While there is overlap between these modes of engagement with sports, statistical analysis should be understood as its own distinct plane. The research is built from a theoretical perspective, relying on key touch-points between baseball and statistical analysis as a cultural lineage, which is supplemented with in-depth interviews. The eight in-depth interviewees range from ordinary fans who practice statistical analysis to fans who turned into professionals through statistical analysis.
Planes of Fandom
Having described some of the key principles inherent in these communities, we now shift to a conceptualization of a framework for categorizing these expert fans or communities of expertise. Using the work of Halverson and Halverson (2008) on competitive fandom and fantasy baseball, I incorporate their concept of the varying planes of fandom with the statistical plane, which results in the following Venn diagram (Figure 1).
The space above the dotted line in Figure 1 is intended to represent the primary plane of activity (MLB itself). The “secondary plane” of the diagram represents the second plane of fandom, described by Halverson and Halverson as the traditional fan activities such as attending games, buying merchandise, and, in general, following the primary plane. Actions on this secondary plane are “essentially dependent on and derivative of the primary plane” (p. 302). The third plane of fandom is represented with the “fantasy plane” of the diagram that Halverson and Halverson propose as the competitive fandom plane or fantasy plane that comprises activities such as the playing of fantasy baseball or any “game within a game.”
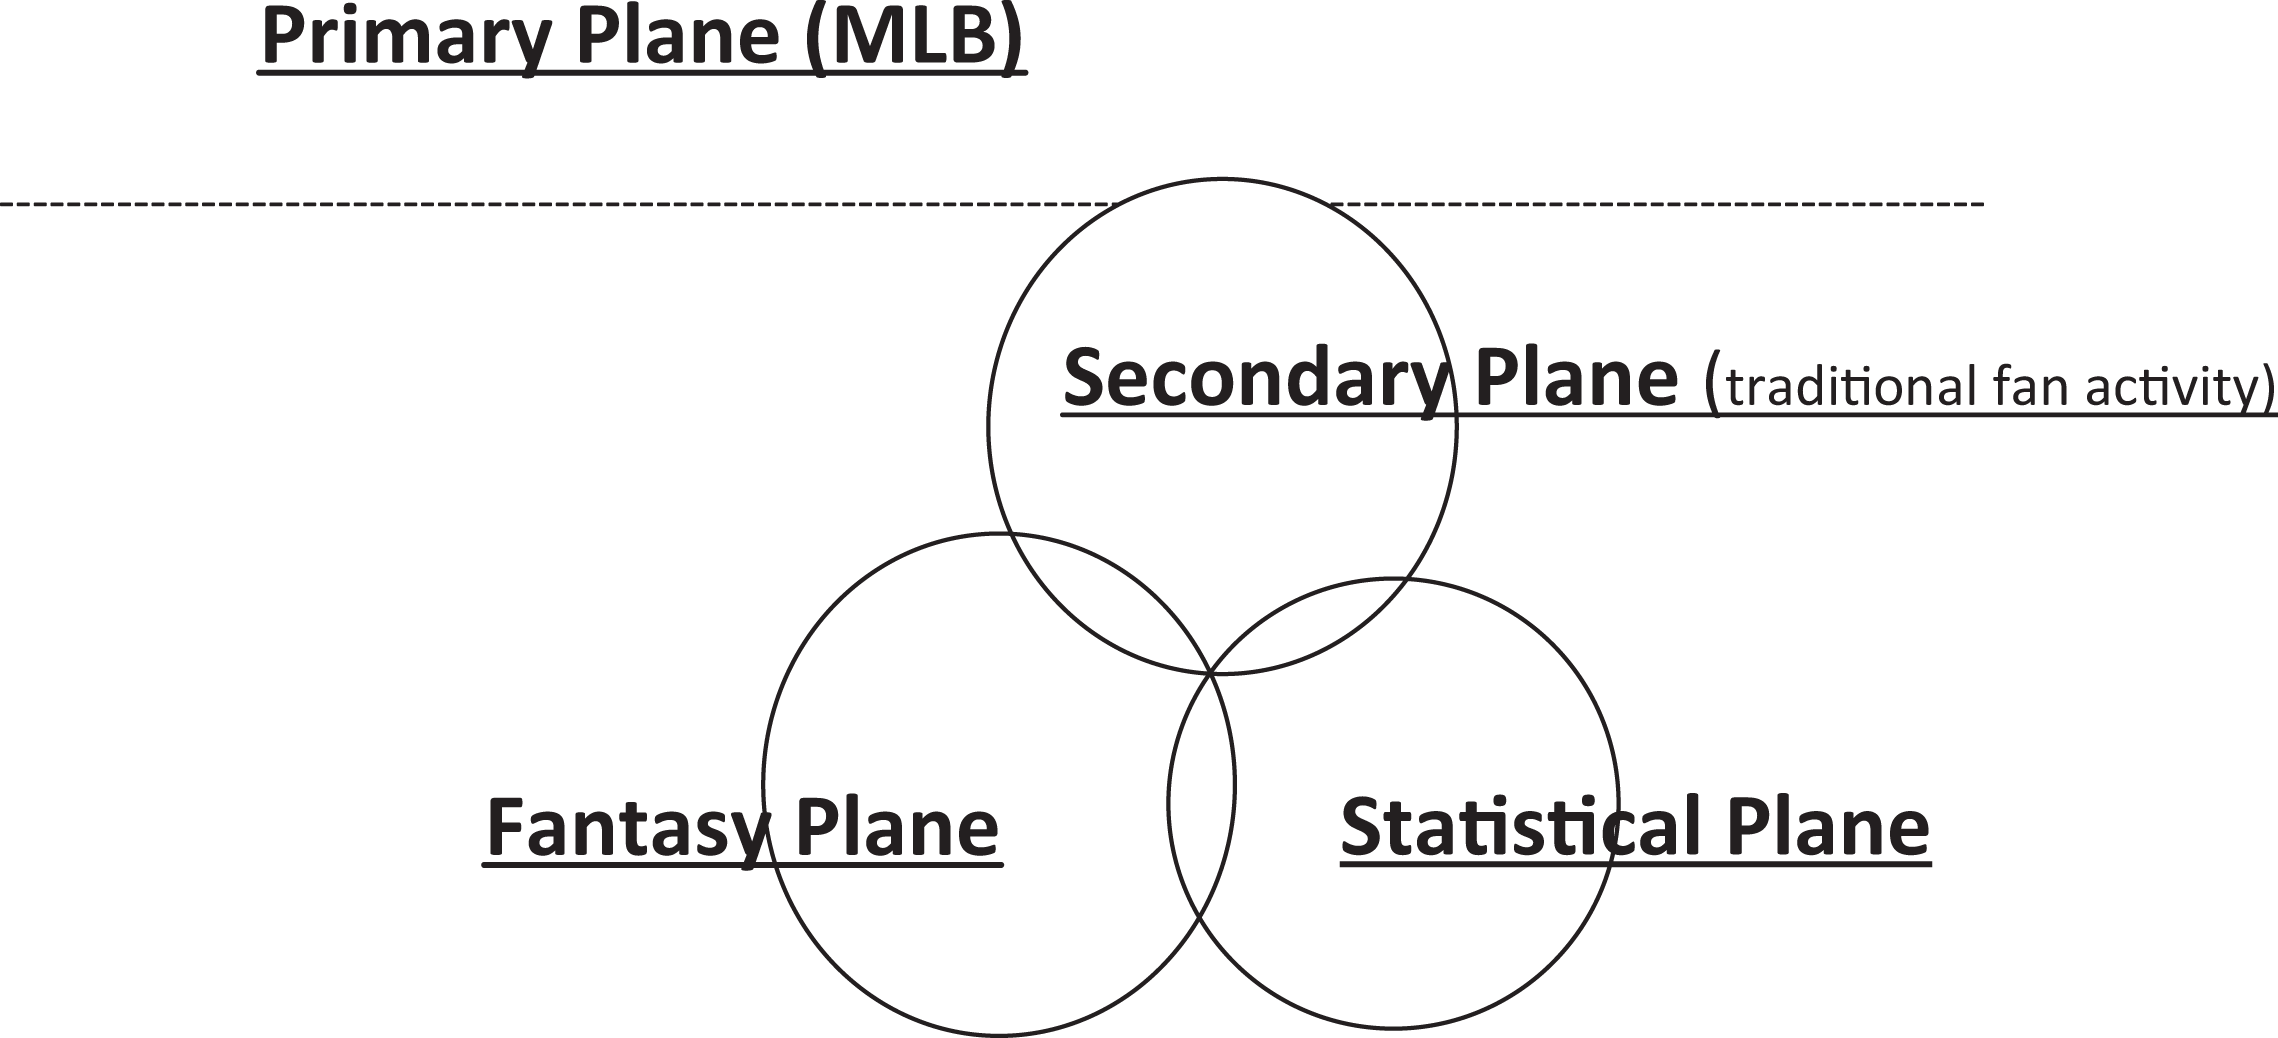
Statistical plane of fandom.
In addition to the third plane, I propose that there exists another section marked as the “statistical plane,” unique to the competitive fandom or fantasy baseball section. Communities of statistical analysis and baseball fandom require their own demarcation. What we see in the statistical community is an evaluation of the primary plane. Knowledge is a source of power, where fan experts gain prestige (Fiske, 1992), but that knowledge is slightly nuanced because expertise comes from the application of knowledge to theorize, scrutinize, and ultimately determine excellence in the primary plane (the possibility exists that academic fans might reside in this space as well). There also exists an overlap between the fantasy plane and the statistical plane. The overlap is alluded to by Halverson and Halverson (2008), The success of fantasy game play seems also to depend on players’ ability to use secondary plane fan knowledge and practices to competitive advantage in the fantasy plane game. The ability to use fan knowledge effectively amplifies fan interest and allows a serious fan…a chance to prove his acumen in a competitive environment. (p. 303)
There exists a complementary relationship between the primary plane and the fantasy plane as both consumptive and productive enterprises (Jenkins, 2006). This type of fandom links to capitalist production but is not expressly the commoditization of leisure. Scouts and the institutional forces of MLB largely rejected sabermetrics at the outset. Thus, this “playbour” (play + labor; Kücklich, 2005) developed outside of the direct purview of MLB. Many within baseball and sports journalism are still reticent to accept the changes to evaluation and expertise in the game, although sabermetrics has consistently gained in its cultural cache.
But moving beyond baseball, there is a broader, society-wide interest and capacity to engage in data-driven analytics. As Jenkins (2007) has elsewhere argued, there is a new kind of cultural power emerging as fans bond together within larger communities, pool their information, shape each other’s opinions, and develop a greater self-consciousness about their shared agendas and common interests. We might think of these knowledge communities as collective bargaining units for consumers. (pp. 362–363)
A Cultural Lineage of Statistical Fandom and Baseball
Statistics impact what is considered important within the game of baseball, beginning with the box score and “the walk.” The history of statistical analysis in baseball can be traced back to the invention of the very first box score. A box score is used as a way to recap an entire game in a concise, digestible retelling of the important points that led to the outcome of the game, told primarily through numbers and simple statistics. This ability to condense and compress all of the data of an entire game could fit neatly into a daily newspaper and allowed everyone to follow the game, even those not living in a baseball city (Gems, Borish, & Pfister, 2017). The year 2009 marked the 150-year anniversary of the invention of the box score in 1859, which is widely credited to the Englishman Henry Chadwick (some historians point to earlier use of statistics in newspapers, but it is conventionally understood that it was indeed Chadwick’s interpretation that standardized the box score). At the time, there was hardly any mass distributed photography, so fans of baseball came to rely solely on the box score to understand and interpret the game itself. Here, the newspaper is the lens and medium which largely codifies fan practices and perceptions of baseball. Chadwick even contributed the term “strikeout” 2 (as well as many other colloquially used baseball words) to the baseball lexicon (Schiff, 2008, p. 68). The use of the word “strike” came from Chadwick’s background in cricket, which becomes all the more important because it is precisely this background that delegitimizes the walk within the box score.
In cricket (as well as in Chadwick’s box score), a walk is not given much importance because no hit is produced and the batting average of a hitter, without the calculation of the walk, comes to stand for the essence of a good hitter. This omission means that the walk, along with a player’s on-base percentage (OBP), is not valued historically as much as a player’s batting average. A high batting average coupled with the amount of runs batted in or run batted in (RBI)’s (set within the parameters and bonds of the box score) cements nominal readings of what constitutes baseball as a game and what is valued within the game. A good hitter, as evaluated by the box score, is one that has a high batting average, not a player who draws a lot of walks. The most important statistic for a pitcher became the earned run average (ERA—the amount of runs scored against a pitcher per nine innings), which is still used as a measuring stick by players, coaches, front offices, and fans to gauge the value and excellence of individual pitchers. Statistics and their analysis provide fans with a particular lens through which they view and perform their fandom, historically reinforced through daily box scores as cultural infrastructure. Baseball then becomes directly linked to statistical categories that become ingrained in the culture and reading of baseball as statistics negotiate the gap between the imagined and lived experience. 3 These early statistical measurements become internalized and institutionalized, as they come to articulate what is of perceived value within the sport of baseball. The box score is a statistical revolution and an antecedent to future statistical revolutions, such as sabermetrics. Baseball maintains a mythic appreciation for statistics, especially as they purportedly connect the game throughout generations—no other sport claims as much significance for being able to compare statistics over time (hence, the infamous asterisk for Roger Maris). The early box score co-configures both the fan reading and institutional understanding of baseball.
Jumping ahead in our statistical history of baseball, Bill James,
4
must be credited with decoupling baseball from its shallow statistical origins. In a recent interview with national public radio [NPR], James comments on the importance of Henry Chadwick to the framing of statistics in baseball saying he was “the first of that type to take the game seriously enough to get as much as he could to the public.” However, James went on to acknowledge some of the flaws that Chadwick’s box score propagated. Chadwick and those who followed him for a long time tended to regard the walk as something that was done by the pitcher. What they failed to understand is that actually the batter has as much or a little more to do with when the walk occurs as the pitcher does. They ignored that element of it and that did distort the game for a lot of people. (Pesca, 2009)
James was first interested in the basic question of what constitutes a good player. Rather than constantly relying on the eye and gut of the seasoned professional scout to interpret value, as well as many of the same rudimentary statistical measures from Chadwick’s era, James began to look at previously undervalued categories in baseball. He wanted to know the additive value of a player who could steal bases for a team or the OBP of a player (which included if a player got a walk during an at bat). In 1971, the Society for American Baseball Research (SABR) was founded by L. Robert “Bob” Davids with four guiding principles that encouraged the study of baseball, education, and historical preservation (McKenna, 2010). While SABR was influential, it was not until the 1980s that a larger group coalesced around James’ writing and continued to pioneer new statistical metrics. SABR facilitated broad discussions while James honed in on specific inquiry. SABR, like the box score that preceded it, provides new ways of contextualizing baseball. One interview with a baseball fan who practiced statistical analysis and a former professor of psychology (who predicted that the Tampa Bay Rays would go to the World Series in 2008 using sabermetric analysis) summarized his perception of the relationship between these two influential groups, saying that he felt SABR: Gained steam in the ‘80s, and along with James furthered the study of baseball stats. SABR was probably less technical and broader in its studies, but seemed to provide a good framework for many who wanted to explore the realm of baseball stats. But the core of all sabermetric discussions is Bill James. He really got the discussions going with his in-depth inquiries. He wrote his first historical abstract in 1985, and the landscape has never been the same since. James initiated STATS, Inc., which went on to do pitch-by-pitch analysis of every major league game beginning around the early ‘90s. (Personal communication, January 4, 2011)
While this begins with baseball within the last few years, every major sport has made significant advances in the adaptation of advanced statistical analysis to improve player and team performance (Lowe, 2013). New technologies are furthering the individualizing of player performance in all professional sports. 5 Once again industry and saberfans, through their engagement with sabermetrics, are blazing new statistical pathways and influencing the performativity of sports. Moneyball is both a book written by Lewis (2004) and a term that signifies a particular approach to baseball assigned to Oakland Athletics’s General Manager (GM) Billy Beane. Beane was the first to use this certain kind of sabermetrics to gain a competitive advantage over other teams by reinventing how teams evaluated talent and player performance through data. The Beane–James paradigm changed the conversation as statistics acted as a site of rupture within a longer historical narrative. Fandom in the early days of fantasy baseball took off in new statistical directions, eagerly consuming Bill James’s Baseball Abstracts and Rob Neyer’s work for ESPN. This occurred initially on the fantasy plane and it certainly spurred teams to improve their analytics and adopt more sophisticated applications of statistics.
MLB has indeed adapted and pooled sabermetrics for any competitive advantage despite institutional hesitancy from “The Club” and the Joe Morgans of the baseball world. These amateur experts (Baym, 2007) of statistics and baseball ended up influencing the large organizations of power and how we view the primary plane of fandom. Within the sabermetric communities, many have now gone on to be hired directly by teams or write books and blogs that continue to feed like-minded baseball and statistic fans. Nate Silver, who founded Baseball Prospectus and Player Empirical Comparison and Optimization Test Algorithm (PECOTA) rankings (a forecast of player performance in a season), went on to start the widely influential political blog FiveThirtyEight.com (the total number of electoral votes) that forecasts the outcomes of political races across the country before moving to ESPN to establish a long-form hub for statistical inquiry into sports and popular culture. With his success in predicting the 2004 and 2006 electoral races, he signed a multibook deal worth just under a million dollars. This paralleled ESPN’s support and development of Grantland as a branded component of the ESPN.com platform. The addition of Silver was a move to build further the ESPN brand and boost its credibility and prestige through statistical analysis. While ESPN did support the statistical work of Rob Neyer on the site, the buying of FiveThirtyEight, as another branded site within a site, solidified not only the significance of Silver but also the acceptance of the statistical plane of fandom more broadly (Butterworth, 2014).
This has fueled the long-standing debate between scouts who rely on somewhat subjective experience and intuition about players (dubbed by Michael Lewis as The Club, 2004) and those who rely on statistics as a metric toward objective reasoning. The institutional powers in baseball met James’ “revolution” with resistance and outright rejection. Scouts have long relied on their own eyes and instincts to evaluate players rather than statistical formulas divorced from the sweat and grit of the field. The debate between the eye test and statistical markers has always been a debate within baseball. Those invested in sabermetric reasoning, however, wanted a more rigorous evaluation of colloquial baseball ideas such as a player being a “clutch” hitter or the management of the bullpen and the “closer” role. Bill James’ ideas pushed the use of sabermetrics and new ways of analyzing baseball into the public domain 6 while they remained on the outside of The Club. These in-depth inquiries planted the seeds for many writers and fans interested in the overlap between baseball and statistics, but this innovation in the 1980s and 1990s happened outside of baseball’s establishment.
Any survey of the current statistical landscape would be deficient without the mention of another pivotal figure, Rob Neyer, who worked as a prolific writer for ESPN.com from 1996 to 2011. Neyer was a colleague of Bill James and with the platform that ESPN afforded was instrumental in exposing a mainstream baseball audience to newer statistics in baseball. He ran a weekly column through the late 80s and 90s that educated a rising generation of fans who were hungry to delve deeper, as well as socialize, about their findings with like-minded baseball and stats fans. 7 The journalistic community and the rogue sabermetrics enthusiasts have not always shared a symbiotic relationship. There is a certain level of competition among journalists, especially beat writers, and these statistical communities and bloggers within the rearticulation of digital sports journalism.
During this period, the statistics community was often denigrated and marginalized by being called a bunch of geeks and nerds behind a computer typing in their parent’s basement (often in their underwear—a common critique of those perpetrating digital encroachment on traditional authority). This is perhaps best personified in legendary player-turned broadcaster, Joe Morgan. Morganisms, as they are colloquially known in community circles, are the common fodder to many a sabermetric joke. Morgan once proclaimed, All I’m saying is, I see a game every day. I watch baseball every day. I have a better understanding about why things happen than the computer because the computer only tells you what you put in it…. Anytime you’re trying to make statistics tell you who’s gonna win the game; that’s a bunch of geeks trying to play video games. (Craggs, 2010)
Then in 2003, Michael Lewis released the aforementioned book Moneyball that caused quite a stir in the entire MLB apparatus. The book analyzed the GM Billy Beane of the Oakland Athletics, who developed an unorthodox statistical methodology 8 for analyzing player/performance that tried to find undervalued players for a team that didn’t have as high a budget to spend. Lewis’s book shows the relevance of statistical analysis as meaningful for everyone—from the fan all the way up to the GM of a team (even Joe Morgan who has repeatedly made it clear he did not read the book). The book became a critical success outside of baseball, further cementing the wider recognition of statistics in baseball as sabermetrics slowly began to be incorporated by teams mimicking parts of Beane’s system. It is about this time that the Boston Red Sox hired Bill James as a statistical consultant for the team. The popularity of the film Moneyball has also elevated the term sabermetrics into the larger cultural lexicon. While each of these figures is invaluable to the maturation of sabermetrics, there was also a broader community of sabermetric baseball fans who were communally innovating in digital space. 9
The emergence of statistics, the merging of the work of James with baseball fans, is different from the late emerging statistical movements in the National Basketball Association (NBA) and the National Football League (NFL), which were formed largely by professionals and scouts. In the English Premier League (EPL), GPS tracking was adopted to monitor player’s movement (Fay, 2013) in order to decide who may need to rest (who isn’t covering enough of the field) or to prevent injury through data analytics. This is increasingly a technique used by college football teams and NFL teams (this is done through the use of a GPS surveillance tracker labeled the “sports bro” because of its resemblance to a sports bra). All NBA teams 10 have motion sensor data in arenas to track the number of touches and dribbles in a game, shot arcs, secondary assists, and the total distance a player travels in a game (McCann, 2012). These surveillance technologies are turning player performance into real-time data, which is changing how sports are viewed, managed, and ultimately played (Baerg, 2017). The labor of saberfans, with this broadened palate of statistical possibility, 11 was integral to this statistical turn, the evaluation, and production of value within all sports.
Knowledge Communities and Expertise
Baseball cards and collecting seems to be one of the predominant entry points for young boys into baseball fandom and the application of statistics to baseball, conjoining community and expertise to baseball cards. 12 Cards create contact zones (Pratt, 2004), fraternity, and the “goal-oriented” “building of sets” (Bloom, 2002) that are important to collectors much in the same way that Ito (2010) describes her investigation of the Pokemon generation’s collecting, remixing, and knowledge play. Baseball card collecting and the mastery of the multiplicity of players and teams is one entryway into baseball expertise, coupled with the statistics on the back of the baseball cards, which begins the process of interacting with the primary text of MLB as a knowledge community. Baseball cards should still be understood as toys (complete with a hard stick of gum 13 ) that form an affective space of play for fans, but this form of productive play initiates young fans into the statistical infrastructure of the game. Baseball cards statistically socialize young baseball fans, 14 while at the same time codifying categories for evaluating players in the same way that Chadwick’s box score calcified the box score.
I remember opening my first pack of baseball cards and actively seeking out what each category of statistics on the back of the card meant. I was taught what constituted a walk and batting average, and although I did not quite grasp it all, I began to gradually connect those numbers with their on-field manifestations while watching baseball. The statistics serve as metonymic chains that grow into larger narratives. I also remember paying close attention to how well a player performed from year to year, comparing the categories of statistics between years to see whether the player was getting better or worse. From 1952 to 1981, the baseball card company Topps maintained a monopoly over the industry after defeating rival company, Bowman. As part of their differentiation in the marketplace, Topps (2014) added “interesting, meaningful, and fun card backs that spurred fans’ interest in players’ statistics” (para. 13). This move to humanize players also codified the accompanying statistical categories that Topps would keep exactly the same until adding OPS (on-base plus slugging) in 2004. In July 2014, Topps finally acknowledged the importance of sabermetrics by adding wins above replacement (WAR) to the back of cards. Reflecting on the relationship between Topps and baseball fandom, sabermetric writer Larry Granillo (2011) states, it occurred to me that fans who have trouble with advanced stats generally do so because they’re hung up on the more traditional stats, the “back of the baseball card” stats…. Hits, doubles, triples, home runs, RBIs, and batting average were pretty much all you got for 30 years. This no doubt reflects how people talked about ballplayers at the time. (para. 2)
Baseball cards are bought and sold by collectors of all ages, but it is the statistics on the back of the cards that serve as the underlining structure, which informs the additive value of the player. The ERA comes to stand in for what counts as quality pitching. This notion of perceived excellence is then coupled with the aesthetics and popularity of the player to generate value in dollars and cents. The baseball card serves a fundamental role in melding the evaluation of a player’s excellence by fans with the statistics represented on the back of the card. Another recent entry point for statistical fandom can be found in statistics-based simulation video games such as the “MLB 2K” series, which was arguably superseded by the “MLB: The Show” series, and the internationally acclaimed “Football Manager” series. These video games allow players to act as GMs and make decisions based on statistical inputs. This further inculcates players to view baseball through the lens of statistical fandom and increases the public’s awareness and interest in statistical modeling of the sport.
These communities function as knowledge communities (Hakkarainen, Palonen, Paavola, & Lehtinen, 2004) akin to what Murray (2011) titles “encyclopedic capacity.” In fact, they even made their own encyclopedia as described by one long-standing sabermetric enthusiast familiar with SABR: When sabermetrics started catching fire, there was Total Baseball, a sabermetric encyclopedia in several editions that explored a lot of the questions about player performance that hadn’t been done on a wide scale before, and supplied their own ratings. So when it all started coming together, it seemed to be a bunch of freelancers riding on the coattails of James, without much organization. SABR brought some of it together, though SABR also consisted of a wide array of baseball topics beyond statistics, so SABR wasn’t an authoritative source for a close-up study of sabermetrics. (Personal communication, June 14, 2010)
Rusty Southwick, who participated in a community in the 90s called Baseball Think Factory and started one of the first national fantasy leagues, called On-Paper Baseball, stated, In the late ‘90s, other sabermetricians were coming out with formulas in various areas that contributed to the landscape, and I think they started feeding off each other, providing each other ideas to reach more agreeable formats. Fielding ratings used by STATS started getting notice. (Personal communication) When James popularized Win Shares
15
in the early 2000s, that set the table for many others. It’s like he was dishing out clues to see who could uncover the solutions. Maybe he was smart enough to lay out the scheme, but not quite savvy enough to put the pieces together. (Personal communication)
These sabermetricians met for the pleasure of sharing and enjoying the challenge, breaking new ground in statistical analysis, and fantasizing and theorizing about how to better the teams of their respective fandom (a direct relation to fantasy sports or statistically based simulation games). Sabermetricians often applied their new methods and statistics to better comprehend their own fandom, as statistics became a new lens for viewing how their teams could be improved because they were often still personally connected to the outcome of a team at the end of a season. When asked about the relationship between statistics and fandom, a fan-turned professional summarized his experience saying, I’ve been a fan through and through since about age 9, and I played dice baseball games around the clock like kids play video games now. I set up my own dice charts and worked out probabilities. I was already devoted to the game before sabermetrics and fantasy baseball came around, but the new discoveries continued my interest. (Personal communication)
Conclusion
Halverson and Halverson (2008) believe that “fantasy baseball players take an active role in their fan practices by creating an autonomous plane of game play, recasting the primary activity (a real baseball game) into a world they can control” (p. 292). Fans are intertwined with the primary plane of the MLB franchise, but there remains a degree of autonomy because of the “dual planes of activity” and control generated through fantasy world building. However, the economic relationship between the primary plane and the fantasy/competitive plane has increased since the original days of fan generated rotisserie leagues. The Internet has transformed fantasy baseball into a booming industry, which we might think of as a “regifting economy” (Scott, 2009), where fantasy fandom is resold. Saberfans do not “work” in the same way as fantasy fans engaged in competition and fantasy baseball operate. The plane of expertise for saberfans is dependent on the primary plane as a source of content for inquiry and study but not solely as an economic extension (which is the case with the game space of the competitive/fantasy plane or the merchandising of the secondary plane of fandom). Saberfans collaboratively generate new kinds of expertise and modes of spectatorship for the primary plane in this space. Other examples of fandoms that might be categorized as communities of expertise are the Doctor Who fans described by Tulloch and Jenkins (1995) as shaping the BBC’s production of Doctor Who through their rigorous understanding of the entire canon of the primary text and their projections and theories of how the world functions. The statistical plane pools knowledge and recontextualizes the viewership of the primary plane.
What is more important than the exploits of individual community members that rose through the sabermetric community, however, is the larger cultural movement of statistical analysis. This is the reason that statistical analysis can function as a cultural infrastructure. The sabermetric movement can be seen as an expression or articulation of the broader cultural Big Data and Googlization trend (Vaidhyanathan, 2011). It is now evident that all of the major baseball writers and reporters, from ESPN down to the local newspapers, respond (to varying degrees) to the injection of statistical analysis into baseball. Fox News even scrolls OPS statistics on its ticker to give you a sense of the penetration. The labor of saberfans builds a cultural algorithm through statistical analysis that shapes all fan engagement. Sabermetric inputs become the lens, as cultural algorithm, through which the larger sporting public understands baseball. The labor of fans can build cultural infrastructures that co-construct the definition of value or, in this case specifically, expertise within MLB. Sabermetrics as labor is generative. Those infrastructures are subject to incorporation within the primary plane of MLB as socioeconomic tools just like sports fandom and fantasy sports fandom, however, the statistical plane co-constructs meaning within baseball. Fan labor through sabermetrics has changed baseball, both in how it is played and understood. Yet, this labor is not subservient to baseball but works through baseball. The fan practices in this space of applied fan expertise have changed the way that all fans now view baseball. Sports become a microcosm for analyzing the larger statistical turn occurring in politics, data journalism, and marketing/social networking as “Big Data” collides with fan engagement and the society. Just as the box score once framed the way that fans interacted with the primary text, statistics and this space of fan expertise serve as a lens through which audiences now consume and interact with baseball. The specific ways the sabermetrics movement emerged underscores how numbers shape fandom in MLB and how the statistics plane pioneers a new way of being a fan.
The manipulation of statistics is a form of knowledge play, as fan practices shape perceptions of excellence and their assigned value to players, teams, and franchises. Fan expertise spills over to shape sports management and journalism as the development of new statistical systems reshapes how fans view the game. In this way, expertise itself is, perhaps, a kind of fan practice. This form of fandom, then, truly is an “island of activity amidst a sea of statistics.”
Footnotes
Declaration of Conflicting Interests
The author(s) declared no potential conflicts of interest with respect to the research, authorship, and/or publication of this article.
Funding
The author(s) received no financial support for the research, authorship, and/or publication of this article.