
Abstract
Integration in mixed methods involves bringing together quantitative and qualitative approaches. There is a need for practical examples of how to integrate the two approaches in an explanatory sequential design at the methods level and at the interpretation and reporting level. This article reports an explanatory sequential mixed methods study of adolescents’ quantitative judgments about belief-related scientific arguments and qualitative reasons behind those judgements via interviews. This context is used to illustrate how integration can be achieved in an explanatory sequential design at the methods level, through the sampling frame and through the development of the interview protocol with a methodological joint display, and at the interpretation and reporting level through narrative and the use of a results joint display.
Keywords
Explicitly defining a mixed methods design can help researchers plan a study and orient readers either to what was done in a study (e.g., journal reviewers, article readers) or will be done in a study (e.g., funding bodies, doctoral committee; Creswell, Plano Clark, Gutmann, & Hanson, 2003). Importantly, from a researcher’s perspective, generating a sound research question that is aligned with the methods can enable the researcher to make several key decisions about how to plan and implement a mixed methods study design. A crucial feature of this process is understanding when and how to integrate the quantitative and qualitative approaches.
Integration in mixed methods research involves intentionally bringing together quantitative and qualitative approaches such that their combination leads to greater understanding of the topic (Bryman, 2006; Caracelli & Greene, 1997; Creamer, 2018; Fetters, Curry, & Creswell, 2013; Greene, 2007; O’Cathain, Murphy, & Nicholl, 2007, 2010; Yin, 2006). Given the importance of integration to mixed methods research, it is crucial that researchers articulate how and to what extent they integrate the quantitative and qualitative approaches. However, integration in mixed methods is simultaneously “its greatest advantage and arguably its greatest challenge” (Tunarosa & Glynn, 2017, p. 224). The centrality of integration to mixed methods is joined by a variety of views on how to achieve integration. Some studies have focused on specific procedures for achieving integration (e.g., O’Cathain et al., 2010; Yin, 2006). Other studies have focused on the general stages or levels at which integration can be achieved (e.g., O’Cathain et al., 2007). Still others focus on generating a clear purpose for conducting a study based on the justification or rationale for using mixed methods (Creamer, 2018; Greene, Caracelli, & Graham, 1989). While there are several useful approaches for achieving integration in mixed methods, we chose to use Fetters et al.’s (2013) framework because its combination of generality (principle driven), specificity (practice based), and pragmatism (practical application) is accessible to emerging researchers. Nonetheless, we encourage mixed methods researchers to evaluate different approaches for achieving integration for their own research.
Fetters et al. (2013) describe integration at three levels. First, integration at the study design level refers to the conceptualization of the study and the type of design implemented to investigate the research topic. The three basic designs are explanatory sequential (e.g., QUAN → qual), exploratory sequential (e.g., QUAL → quan), and convergent (e.g., QUAN + QUAL). For sequential designs, data are collected and analyzed in the first phase, which informs the follow-up phase. For convergent designs, the data in the two phases are collected and analyzed independently, then later brought together to identify convergence and divergence between the two phases. Integration at the design level can subsequently affect a researcher’s decisions about whether and how to use integration at the other two levels, which ultimately influences the quality of a researcher’s inferences (Creswell & Plano Clark, 2011; Ivankova, 2014; Teddlie & Tashakkori, 2009).
Second, integration at the methods level involves linking the methods of data collection and analysis. Types of integration at the methods level include the following: (a) integrating the two databases through sampling (connecting), (b) using one data collection procedure to inform the other data collection procedure (building), (c) bringing both databases together for further analysis and comparison (merging), and (d) linking data collection and analysis at multiple points (embedding). Importantly, the type of study design typically informs whether and how integration will be implemented at the methods level. For instance, in an explanatory sequential design, a researcher might use a nested sampling design (Collins, Onwuegbuzie, & Jiao, 2007; Evertsson, 2017), in which the results from the quantitative phase are used to select the individuals or cases for the subsequent qualitative phase, a form of connecting.
Third, integration at the interpretation and reporting level occurs when the researcher mixes the two data sets to demonstrate how they are more informative than either data set alone. Types of integration at this level include describing the quantitative and qualitative data in a report (narrative), converting one data type into the other type of data (e.g., quantizing qualitative data) and integrating it with the data that have not been transformed (e.g., integrating quantized qualitative data with the existing quantitative data set), and using a joint display. A joint display in mixed methods is a visual display that a researcher uses to represent quantitative and qualitative data analyses or results interpretation in a single display (Creswell, 2015; Guetterman, Creswell, & Kuckartz, 2015; Plano Clark & Sanders, 2015).
A defining feature of any rigorous mixed methods study is the use of integration at the study design level (e.g., Creswell & Plano Clark, 2011). However, the integration or mixing of quantitative and qualitative approaches at the methods level is much less common than at the interpretation and reporting level (Bazeley, 2009; Creamer, 2018; Greene, 2007). A possible reason for this is the lack of exemplars or established templates for integration (Bryman, 2007; Ivankova, Creswell, & Stick, 2006). Bryman (2007) interviewed 20 purposefully sampled social scientists, who had published books and articles over a 10-year time frame, on their views about research that combines quantitative and qualitative approaches. Only one of these individuals was able to nominate an example of a mixed methods study that served as a clear exemplar for conducting or reporting a study. Similarly, Ivankova (2014) noted the need for practical recommendations and examples for designing and implementing mixed methods designs. One potential way to promote the use and reporting of integration in mixed methods research is by using examples that explicitly illustrate how researchers can integrate quantitative and qualitative approaches. Thus, the purpose of this article is to illustrate how integration can be achieved at the methods level and at the interpretation and reporting level when a researcher intentionally integrates the quantitative and qualitative approaches at the design level in an explanatory sequential design. A study on belief bias in high school students’ evaluations of scientific arguments provides the context for illustrating this integration.
Belief Bias in Reasoning
Sound scientific reasoning involves evaluating the plausibility of a claim, evidence used to support the claim, methods used to obtain the evidence, and characteristics of the source who provides the evidence (Koslowski, 1996; Kuhn, 2010; Sandoval, Sodian, Koerber, & Wong, 2014; Zimmerman, 2007). However, belief bias, failure to reason independently of one’s beliefs, undermines sound scientific reasoning because individuals evaluate information on the basis of whether it is consistent with their beliefs rather than the quality of the evidence (e.g., Kunda, 1990; Lord, Ross, & Lepper, 1979; Nickerson, 1998; Stanovich, West, & Toplak, 2013; Wolfe & Britt, 2008).
Previous research has shown that despite adolescents’ capacity for abstract and critical thinking, they are susceptible to belief bias. For instance, in Klaczynski and Gordon (1996), adolescents evaluated excerpts from fictional research studies that contained threats to internal validity (e.g., experimental confound). Before participants evaluated the fictional studies, the researchers measured participants’ religious affiliations and then tailored the studies to each participant’s religion. The participants then evaluated studies that were consistent or inconsistent with their beliefs (i.e., religious affiliations). For example, if a student self-identified as a Baptist, then the student read some studies that cast his/her religion in a positive light and read other studies that cast his/her religion in a negative light. However, as noted above, all the studies were flawed, and the same types of flaws were equally distributed between the belief-consistent and belief-inconsistent studies. For each fictitious study, participants rated the perceived strength of the researcher’s conclusion and how well-conducted they thought the research was. Participants rated belief-consistent studies as much stronger and considerably more valid than belief-inconsistent studies, despite the fact that they had identical flaws and were open to the same criticisms.
Klaczynski and colleagues have replicated these findings with adolescents for different belief-relevant topics including group affiliation (e.g., religious group; Klaczynski, 2000), gender (Klaczynski & Aneja, 2002), and occupational goals (Klaczynski, Gordon, & Fauth, 1997). These data indicate that adolescents tend to evaluate belief-consistent information more favorably than belief-inconsistent information, and thus use their critical thinking skills in a biased way. Importantly, age is not strongly related to the development of scientific reasoning, at least beyond childhood (Hofer & Pintrich, 1997; King & Kitchener, 2004; Moshman, 2011), and belief bias does not necessarily lessen as adolescents transition into adulthood. For instance, belief bias has been demonstrated in adults across a range of topics including capital punishment (Edwards & Smith, 1996; Lord et al., 1979), nuclear power safety (Plous, 1991), whether HIV causes AIDS (Kardash & Howell, 2000), gun control and affirmative action (Taber & Lodge, 2006), form of child care (Bastardi, Uhlmann, & Ross, 2011), climate change (Corner, Whitmarsh, & Xenias, 2012), vaccinations (Maier & Richter, 2013), and whether to participate in mammography screening (Bientzle, Cress, & Kimmerle, 2015). In each of these studies, participants evaluated belief-consistent information more favorably than belief-inconsistent information.
As schools prepare students to become scientifically literate, critical thinkers, it is important to understand how adolescents reason about belief-related scientific evidence to identify ways to promote the development of scientific reasoning and to minimize the influence of belief bias. With the notable exception of Klaczynski and colleagues’ work, adolescents are an understudied population in the area of belief bias. This body of work has shown that when adolescents make judgments about belief-relevant information, they tend to rate belief-consistent information more favorably than belief-inconsistent information.
However, much less is known about the reasoning behind these biased judgments. Previous research on belief bias has predominantly used quantitative research designs, which provide effects at the level of the group (i.e., whether the sample shows belief bias). At times, data at the level of the individual differ from the level of the group. When this is the case, qualitative inquiry can be useful for understanding differences at the level of the individual (Johnson & Schoonenboom, 2016). In such instances, a mixed methods design can be useful because it enables a researcher to use quantitative methods to investigate a topic at the level of group and use qualitative methods to investigate a topic at the level of the individual. This study investigated adolescents’ scientific reasoning about belief-relevant arguments with a focus on their judgements and the reasons used to justify those judgements. This research is important because it can provide insights into the thought processes that are related to higher and lower levels of belief bias, which can be used to inform the development and facilitation of sound scientific reasoning skills.
Method
Integration at the Study Design Level
We implemented integration at the design level through the use of an explanatory sequential design. The purpose of this explanatory sequential mixed methods study was to investigate how adolescents evaluated belief-relevant arguments about climate change using a quantitative argument rating task and qualitative interviews with students who attended a high school in New Zealand. This two-phase design (see Figure 1) began with the collection and analysis of argument ratings (i.e., quantitative data), followed by the subsequent collection and analysis of interviews (i.e., qualitative data; Creswell & Plano Clark, 2011). The following overarching question guided the study: How do adolescents evaluate belief-consistent and belief-inconsistent arguments that have equally compelling justifications?
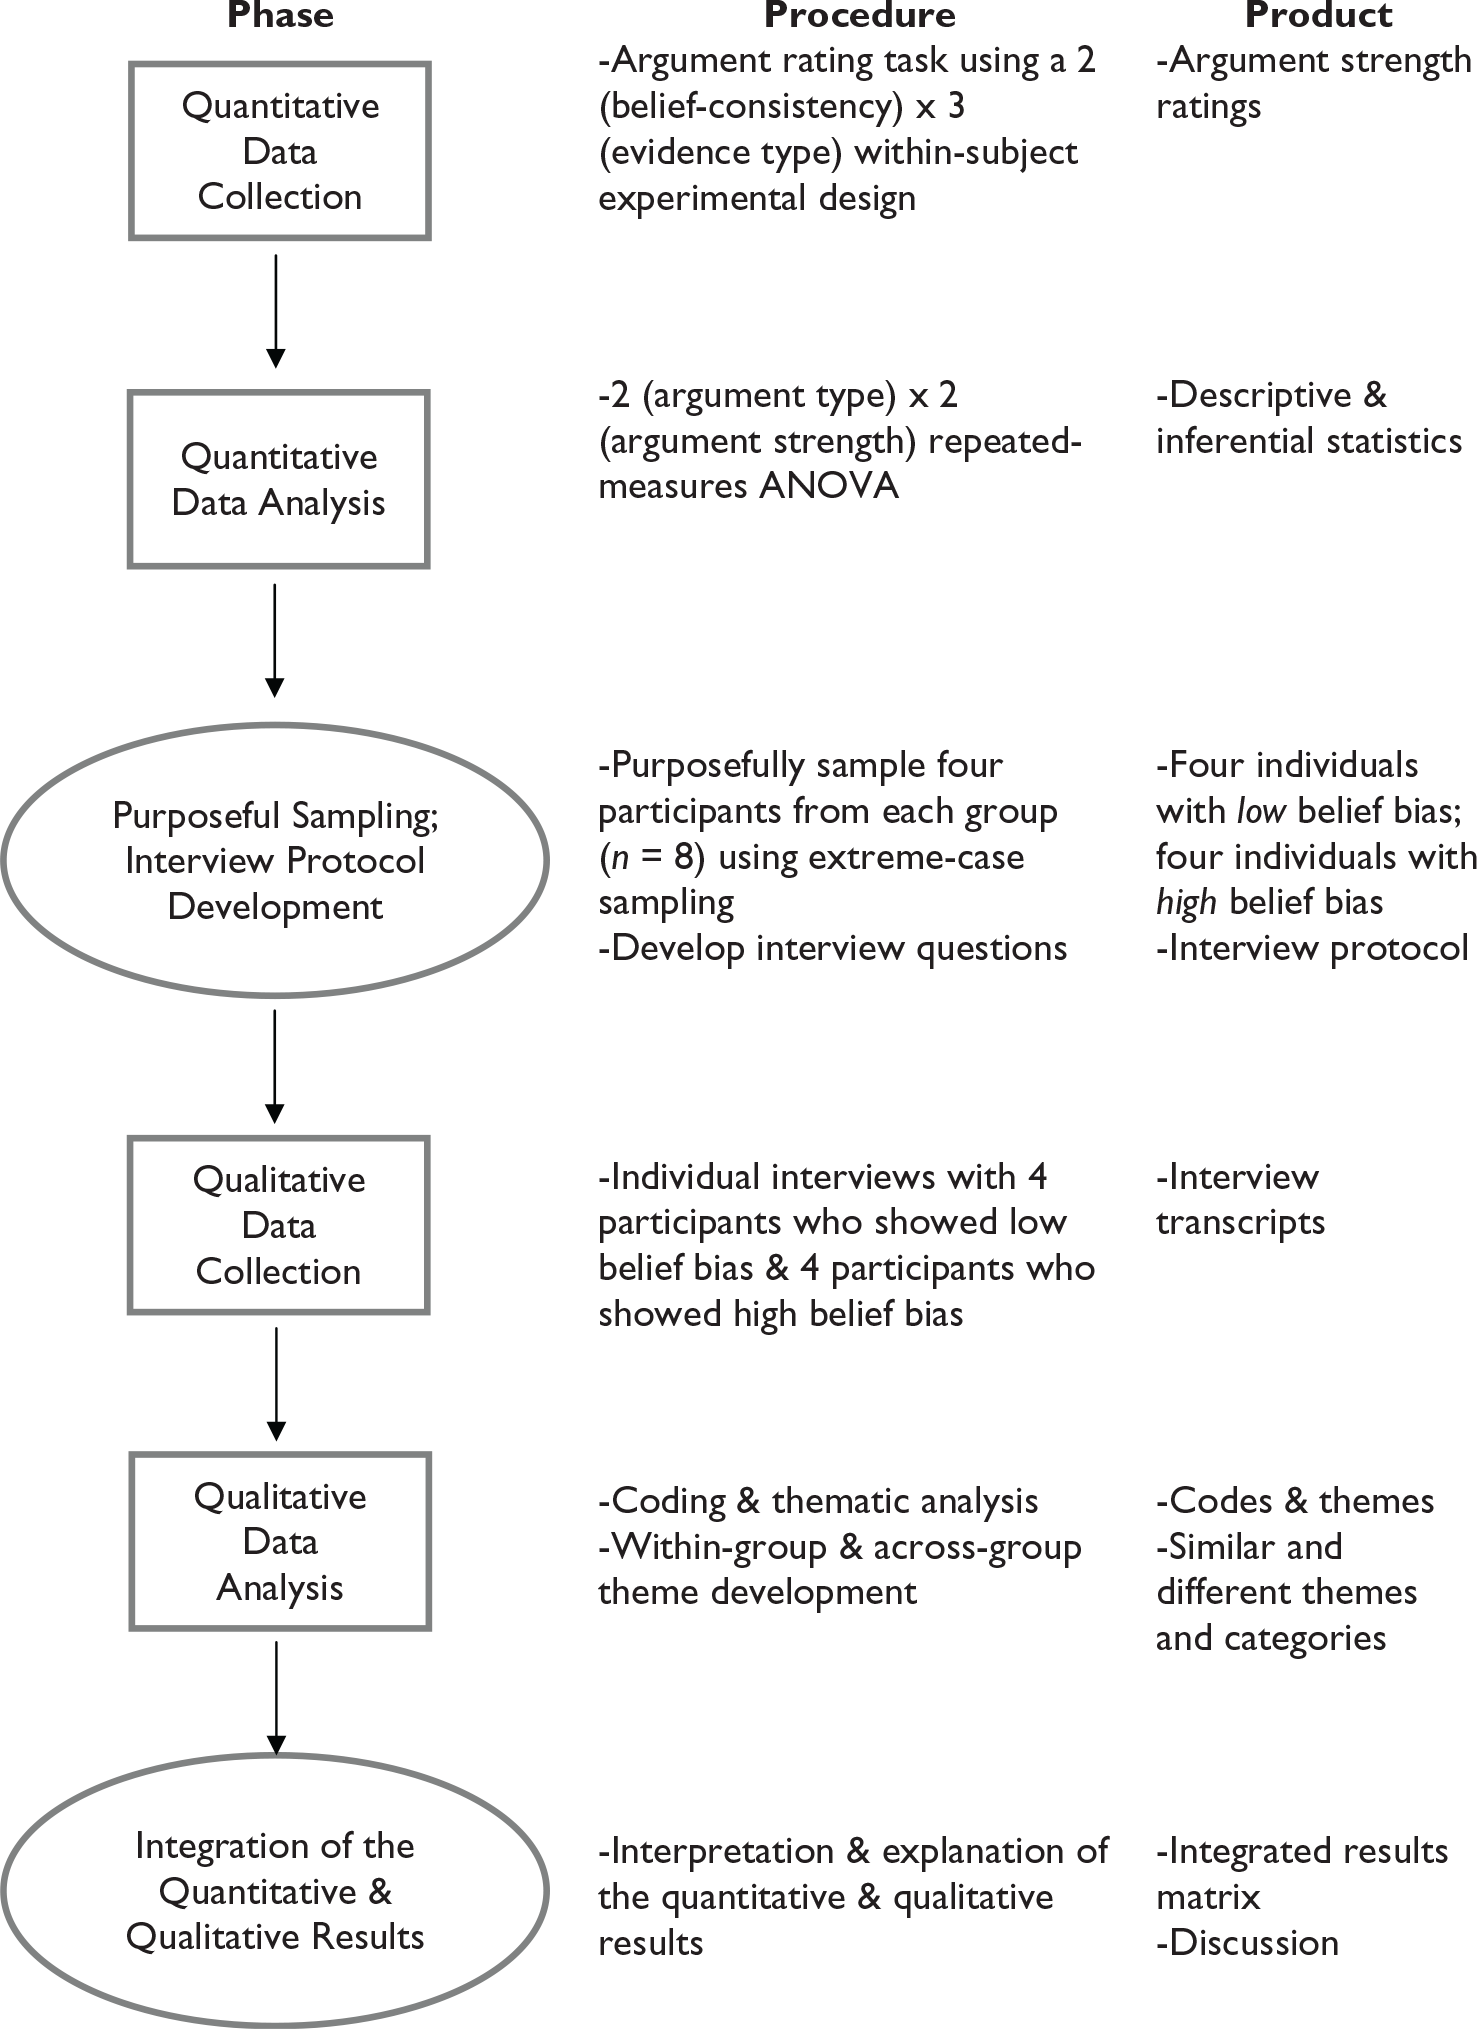
Visual display for the explanatory sequential study design procedure.
In the quantitative phase, participants rated the strength of arguments about climate change that were supported by plausible, fictional data that were consistent or inconsistent with their beliefs. Furthermore, all the arguments contained normatively weak evidence for the presence or absence of human-induced climate change (Intergovernmental Panel on Climate Change, 2013), such that none of the arguments included evidence that spanned more than a 2-year time frame (see the appendix). Importantly, all the arguments had the same types of weaknesses, which were equally prevalent in the belief-consistent and belief-inconsistent arguments. That is, the arguments had equally compelling justifications and were open to the same criticisms. Thus, if individuals evaluated the belief-consistent and belief-inconsistent arguments differently, it could provide evidence of belief bias. In the follow-up qualitative phase, a purposefully sampled subset of the participants from the quantitative phase were interviewed to gain insights into the reasoning behind their evaluation of the arguments. A unique contribution of the present study is its use of thematic analysis of interviews in an equally weighted approach alongside the within-subject experiment to improve the depth of results when examining students’ evaluations of stronger and weaker arguments about a belief-related topic.
Integration at the Methods Level
We implemented integration at the methods level in two ways: connecting and building. Connecting occurs when a researcher links one type of data to the other type of data through the sampling frame (Fetters et al., 2013). In an explanatory sequential design, researchers first analyze the quantitative data, then use the quantitative findings to develop sampling criteria for the follow-up qualitative phase. In the present study, we used the data from the argument rating task to purposefully sample participants for follow-up interviews. Specifically, we used extreme-case sampling to identify individuals who demonstrated higher and lower levels of belief bias, which enabled us to juxtapose the reasoning patterns between the two groups. Extreme-case sampling involves determining a dimension of interest, identifying a distribution of individuals along that dimension, and then locating extreme cases, which enables a researcher to compare individuals who differ on the specified dimension of interest (Ivankova et al., 2006; Teddlie & Yu, 2007).
Our dimension of interest was level of belief bias, which was determined by computing a bias score for each participant. Bias score was defined as the difference in summed scores for the belief-consistent and belief-inconsistent arguments on the argument rating task (Klaczynski, 2000). We created a distribution of the participants based on these scores, computed the bias score for each participant, and identified individuals who had lower and higher bias scores. A lower bias score indicated that the individual rated belief-consistent and belief-inconsistent arguments identically or very similarly in strength. In other words, these individuals displayed more-objective reasoning. Conversely, a higher bias score indicated that the individual rated belief-consistent arguments more favorably than belief-inconsistent arguments. These individuals displayed less-objective reasoning. On this basis, 20 individuals were identified who formed two qualitatively distinct groups (see Table 1). We randomly selected and invited four students from each group to participate in an interview, all of whom agreed to participate. Thus, we used integration through connecting when we used data from the argument rating task (quantitative data) to purposefully sample participants for follow-up interviews in the qualitative phase.
Participant Selection Display Using Ratings for Belief-Consistent and Belief-Inconsistent Arguments by Evidence Type.
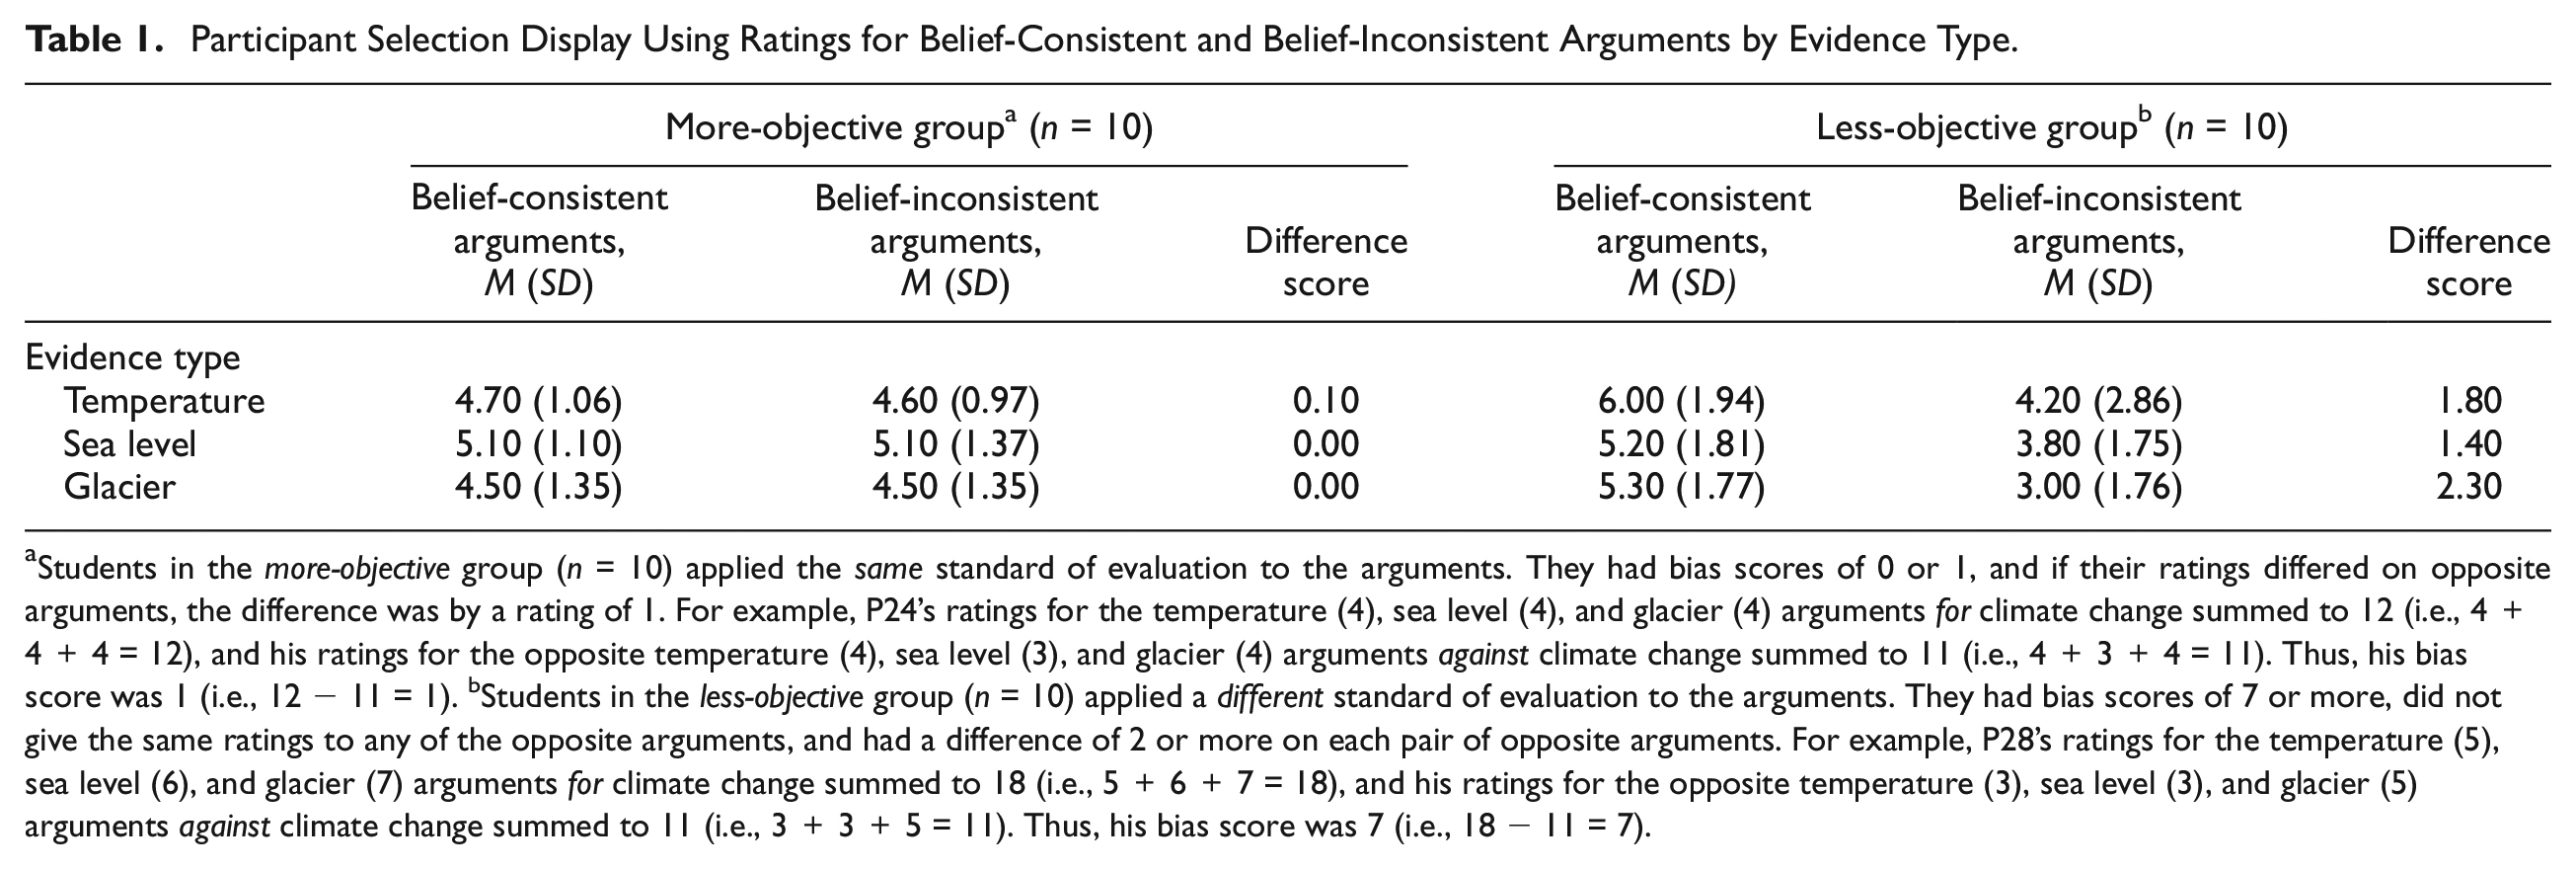
Students in the more-objective group (n = 10) applied the same standard of evaluation to the arguments. They had bias scores of 0 or 1, and if their ratings differed on opposite arguments, the difference was by a rating of 1. For example, P24’s ratings for the temperature (4), sea level (4), and glacier (4) arguments for climate change summed to 12 (i.e., 4 + 4 + 4 = 12), and his ratings for the opposite temperature (4), sea level (3), and glacier (4) arguments against climate change summed to 11 (i.e., 4 + 3 + 4 = 11). Thus, his bias score was 1 (i.e., 12 − 11 = 1). bStudents in the less-objective group (n = 10) applied a different standard of evaluation to the arguments. They had bias scores of 7 or more, did not give the same ratings to any of the opposite arguments, and had a difference of 2 or more on each pair of opposite arguments. For example, P28’s ratings for the temperature (5), sea level (6), and glacier (7) arguments for climate change summed to 18 (i.e., 5 + 6 + 7 = 18), and his ratings for the opposite temperature (3), sea level (3), and glacier (5) arguments against climate change summed to 11 (i.e., 3 + 3 + 5 = 11). Thus, his bias score was 7 (i.e., 18 − 11 = 7).
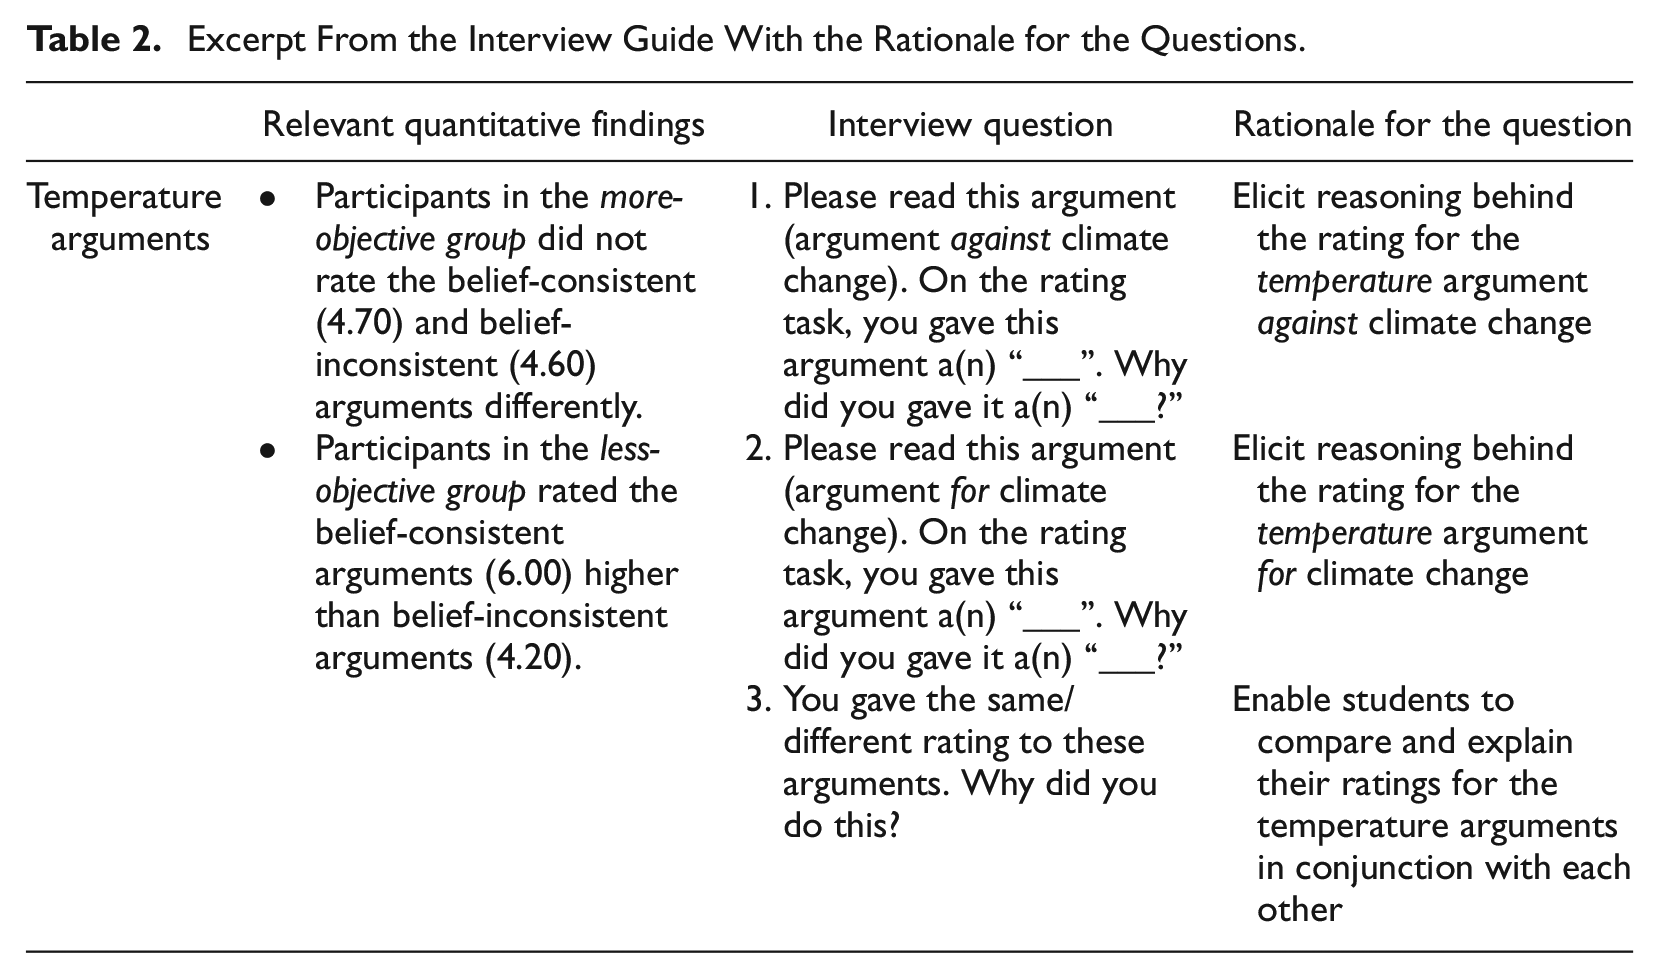
The second way we implemented integration at the methods level was through building, which occurs when a researcher uses the results from one data collection procedure to inform the data collection of the other procedure (Fetters et al., 2013). In the present study, in some instances, the quantitative findings at the level of the individual differed systematically from the quantitative findings at the level of the group. Although it was the norm for students to show less-objective reasoning, some students showed more-objective reasoning. We used the quantitative data to develop the interview protocol to investigate these differences in students’ reasoning (see Table 2).
Excerpt From the Interview Guide With the Rationale for the Questions.
Integration at the Interpretation and Reporting Level
We implemented integration at the interpretation and reporting level in two ways: integration through narrative and the use of a joint display. Integration through narrative occurs when a researcher describes the quantitative and qualitative findings in a single report or series of reports (Fetters et al., 2013). We describe the findings in a single report through the contiguous approach, whereby the researcher initially reports the quantitative and qualitative findings in different sections. Later, we organized the findings in an integrated results matrix, a joint display that is used to juxtapose quantitative results and qualitative findings to allow side-by-side comparisons and to provide evidence to support a researcher’s process for drawing meta-inferences and new insights about the topic (Guetterman, Fetters, & Creswell, 2015; Plano Clark & Sanders, 2015).
Quantitative Phase
Setting
The study took place at a suburban, all-male, public secondary school in New Zealand. The school was located at low elevation and on reclaimed land with ocean coastline on two opposite sides of the school within two kilometers of each side. This specific setting was important for the study because climate change, the topic of the argument evaluation task, could affect the area in which the school was located and many of the students lived. The quantitative phase was included as part of a classroom teacher’s literacy and writing curriculum, which focused on whether and how students used evidence in their written argumentation.
Participants
Participants were 62 male secondary students (mean age = 13.95 years, SD = 0.6). An additional six students did not complete all the items on the argument strength rating task; thus, their data were not included in the final sample. Participants’ self-identified ethnicity was 29 Pākehā (New Zealanders of European decent), 8 Māori (indigenous New Zealanders), 8 Indian, 7 Samoan, 3 Tongan, 3 other European, 2 Cook Island Māori, 1 Fijian, and 1 Southeast Asian, which reflected the school’s ethnic composition. The students’ national standards reading achievement mean stanine score was 5.9 (SD = 1.7), which was average based on the national norm.
Instruments
Topic beliefs scale
Topic beliefs about whether humans affect the Earth’s climate were measured with seven statements on a 9-point (1 = very strongly disagree to 9 = very strongly agree) Likert-type scale (α = .86). Example items are “Humans are affecting the Earth’s climate” and “Changes in Earth’s climate over the last 100 years are mainly caused by human activities.” Scores from the scale, which had a midpoint of 5, were used to determine whether the arguments were belief-consistent or belief-inconsistent. Individuals (n = 49) who had scores above the scale midpoint (M = 6.65, SD = 0.94) were considered more-accepting of humans’ role in climate change, whereas individuals (n = 13) who had scores below the scale midpoint (M = 4.76, SD = 0.42) were considered less-accepting of humans’ role in climate change. For example, the arguments for climate change were belief-consistent for participants who were more-accepting, whereas they were belief-inconsistent for participants who were less-accepting. Thus, it was possible to investigate how participants evaluated belief-consistent and belief-inconsistent arguments, independently of whether they were more-accepting or less-accepting.
Argument strength rating task
The task instructions were adapted from Taber and Lodge (2006), which focused on other topics (e.g., gun control). The task instructions introduced the topic and stated that some people argue that humans affect climate change, whereas others argue that humans do not affect climate change. Next, participants were informed that they would review arguments from both sides of this debate, and they would indicate how weak or strong they believed each argument was on a 9-point scale (1 = extremely weak to 9 = extremely strong). Furthermore, the instruction emphasized that they should leave their feelings about climate change aside and be as objective as possible, and that they would be asked to provide a brief written explanation of their rating for each argument. They were also given a practice item to familiarize them with the task and encouraged to ask questions if they were unclear with any aspect of the task.
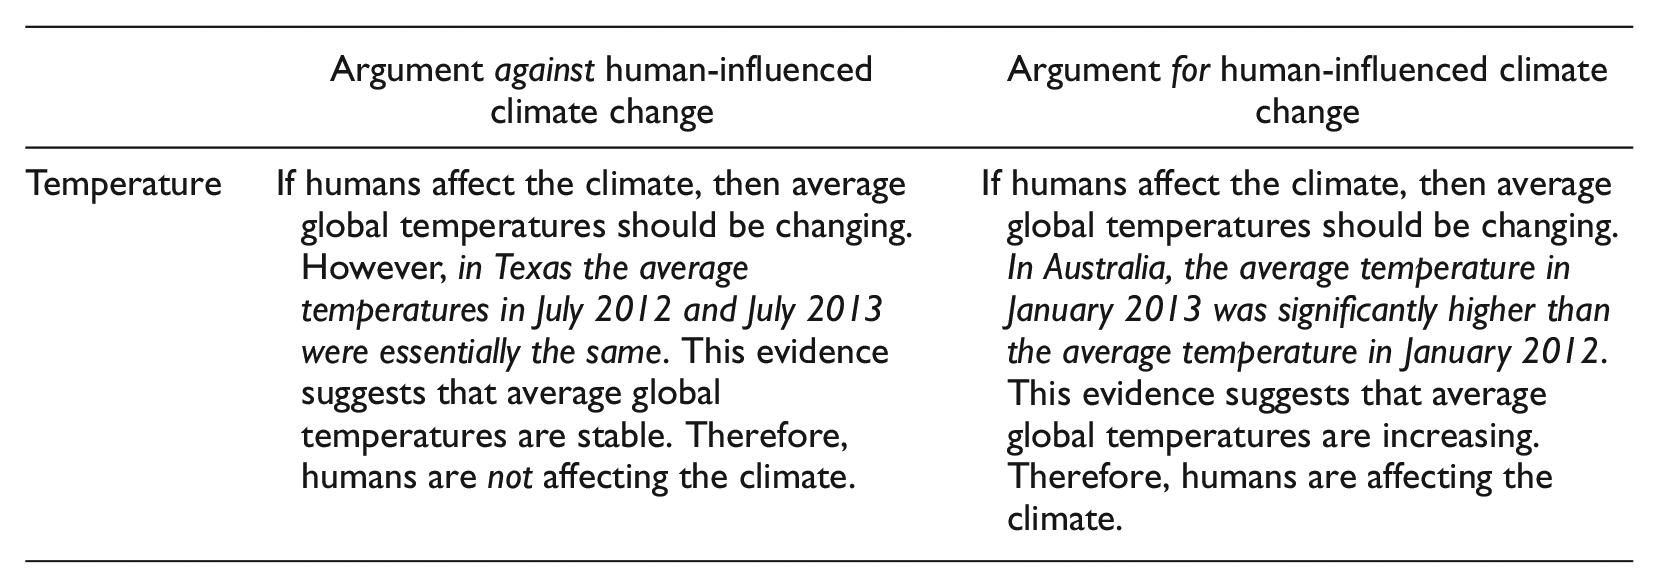
Participants evaluated six evidence-based arguments on climate change, three against human influence and three for human influence (see the appendix for examples; Flesch-Kincaid Grade Level: 8.9). Each argument used one of three types of evidence: temperature, sea level, or glacier. Thus, each participant was presented with a belief-consistent and belief-inconsistent argument for each type of evidence (temperature, sea level, and glacier). The evidence used in the arguments against climate change indicated no change over a time frame of 2 years or less (e.g., The Saint Mary’s Glacier in the U.S. state of Colorado did not change in size between 2011 and 2012), whereas the arguments for climate change indicated change over a time frame of 2 years or less (e.g., The Thunderbird Glacier in the U.S. state of Montana decreased in size between 2011 and 2012). Paired arguments that used the same type of evidence (e.g., glacier-based evidence), but supported opposite views, were presented on different sheets of paper and were not presented in sequence.
Each argument was supported by weak evidence based on the time span over which the evidence used in the argument were collected, which is consistent with the normative criteria established by the Intergovernmental Panel on Climate Change (2013). Furthermore, an expert in atmospheric science (i.e., university professor who is actively publishing research in peer-reviewed journals in atmospheric science) reviewed the arguments for technical accuracy with respect to time span. The expert’s evaluation confirmed the a priori classification of the evidence as weak based on the time span.
Data Collection
IRB approval, parental consent, and participant assent were obtained before the study began. The study was conducted in students’ regular classrooms and they worked independently. The researcher and the classroom teacher implemented the data collection procedure. To begin, participants received an overview of the procedures. Then they completed the topic beliefs scale, followed by the argument strength rating task. To ensure that they understood each task, the participants received instructions for each task, completed the task, and then waited quietly until they received further instructions. When all participants finished the argument rating task, all materials were collected and students were debriefed, thanked for participating, and resumed their regular classroom activities. The entire procedure took approximately 30 minutes to complete.
Data Analysis
Our quantitative research question was the following: Do adolescents show belief bias when they evaluate belief-consistent and belief-inconsistent arguments that have equally compelling justifications? We analyzed the argument strength ratings with a 2 (belief-consistency: belief-consistent and belief-inconsistent) × 3 (evidence type: temperature, sea level, and glacier) repeated-measures analysis of variance. Argument type, which referred to whether the argument was consistent or inconsistent with the participant’s beliefs, and evidence type, which referred to whether the type of evidence used in the argument was based on temperature, sea level, or glacier size, were within-subject variables. The dependent variable was argument strength rating.
Eta squared (η2) was computed for effect size, and η2 qualifying values of approximately 0.01 as small effects, values of 0.06 as medium effects, and values of approximately 0.14 or more as large effects (see Olejnik & Algina, 2000). All tests of significance were made at the p < .05 level of significance.
Qualitative Phase
Data Collection
The interview protocol (see Table 2) was designed to prompt participants to explain the reasoning behind their ratings for each of the arguments and to explain why they rated some arguments the same or differently. That is, the interview protocol was designed to enable students to explain their reasoning behind each argument rating individually and in conjunction with the opposing argument. To do this, the protocol was organized by argument type (i.e., evidence against, evidence for) for each evidence type (i.e., temperature, sea level, glaciers). For example, on the temperature-based arguments, the participant read the argument against human influence on climate change, and then explained his rating. Next, he read the argument for human influence on climate change, and then explained his rating. Then, with both arguments side-by-side, the participant was asked to explain why he gave both arguments the same ratings or different ratings (depending on the individual’s actual ratings). Using this format, it was possible to elicit how students applied evaluation criteria across different types of evidence for belief-consistent and belief-inconsistent arguments.
Using Kvale and Brinkmann’s (2009) terminology of question types, the sequence of questions started with follow-up questions (extending the students’ answers from the argument rating task), moved to probe questions as needed (asking for general expansion on an answer) and specification questions (inquiring about a particular aspect of an answer) as needed. Finally, the researcher moved to more direct questioning (Kvale & Brinkmann, 2009) and indicated that the participant either gave the two arguments the same rating or different ratings (depending on the individual’s actual ratings) and asked why he had done that. This same sequence was followed for the two sea level arguments and again for the two glacier arguments. Thus, integration through building occurred when the quantitative findings at the individual level were used to develop the interview protocol.
Individual interviews were conducted 10 days after the experiment. The researcher (first author) conducted all interviews in a room at the students’ school chosen by the school principal and the classroom teacher. The interview data were collected via audio-taped face-to-face interviews. Retrospective reporting is susceptible to post hoc rationalizations; however, the risk is lower when an attempt is made to minimize the time gap between task completion and retrospective reporting and when context cues are provided, which in turn can strengthen the validity of the reports (Ericsson & Simon, 1993; Nisbett & Wilson, 1977). Post hoc rationalizations were mitigated in two ways. First, the quantitative data were scored and analyzed as quickly as possible. Second, context cues were provided during the interviews. In the quantitative phase, students were asked to write a justification for each of their arguments ratings. During the interviews the participants were able to view the original documents that contained the arguments and their hand-written argument strength ratings and justifications. In addition, the primary researcher was aware of his status as an adult faculty member, which might have affected how high school students responded during the interviews. Therefore, the interviews were conducted at the students’ school in a location familiar to them and efforts were made to establish rapport and help the participants feel comfortable when responding in the interview sessions (Creswell, 2008).
Data Analysis
The primary researcher analyzed verbatim transcriptions of the audio-taped interviews using thematic analysis (Braun & Clarke, 2006) using a five-step process. The researcher aimed to be reflexive during the analysis and not impose his ideas on the data (Patton, 2002). In the first step, broad holistic scoring was used. The researcher listened to all the recorded interviews and read the interview transcriptions to get a “holistic sense” of the data. No sorting or coding of data occurred in this first step. Rather, this step allowed the researcher to become familiar with the nature of the data as a whole. In the second step, the researcher extracted descriptive phrases that pertained to participants’ explanations of their argument ratings. For example, comments such as “It’s just comparing [temperatures in] one place, so it isn’t really that strong” (P27) and “It’s only over two years which isn’t much time, you might not notice much difference in that time” (P1) were extracted because they pertained to participants’ explanations of their argument ratings. In the third step, the researcher generated initial codes for the data by segmenting and labeling the extracted phrases and identifying commonalities among the extracted phrases. For example, P27’s statement above was coded “number of locations” and P1’s comment above was coded as “amount of time.” The other codes were “comparability” (e.g., P1, “They are both pretty much the same argument, they are just saying opposite things,” and P32, “That argument was weak proof that humans are not really doing anything to contribute to climate change, whereas the other argument was really strong proof that humans are contributing to climate change”), “plausibility” (e.g., P32, “It’s kind of unlikely that temperature increased by itself with no outside help”), “beliefs” (e.g., P67, “I don’t believe that it is happening,” and P27, “I guess my personal opinion”), “alternative explanations” (e.g., P36, “Probably because there . . . may be high and low tides”), and “other,” which pertained to low-frequency segments that did not fit into the other codes. In vivo coding (i.e., low inference indicators) was used to categorize relevant phrases. This was done to keep the codes as similar to the participants’ meaning as possible.
In the fourth step, when needed, the researcher developed categories from the codes by aggregating similar codes together. For example, the codes “number of locations” and “amount of time” were combined to create the category “quantity of evidence.” In this example, the coded phrases indicated that the amount of evidence used in the argument affected participants’ evaluations of the arguments. Thus, the term “quantity of evidence” was used to represent this category. The fifth step was theme identification. The codes and categories were compared and examined to identify relevant relations between and across the codes and categories.
Furthermore, it was important to triangulate the researcher’s inferences with those of another researcher, a form of peer debriefing (Miles & Huberman, 1994). Therefore, an advanced graduate student, who was not involved in any of the interviews, was recruited and trained to analyze the data on her own. The trained rater and the researcher discussed the codes and themes derived from the data on numerous occasions. The rater and the researcher compared the themes generated in the analysis and the original statements made by the interviewees to clarify, elaborate upon, or challenge the codes and themes throughout the data analysis. We agreed upon the reported themes as accurate characterizations of participants’ standards of evaluation.
The authenticity of the inferences drawn and the data presentation was established in several ways, including semistructured interviews with probes, in vivo coding, peer debriefing, triangulating the different sources of data, and reviewing and resolving disconfirming evidence (Ivankova et al., 2006; Miles & Huberman, 1994). To triangulate the data and review the evidence, participants’ written justifications for each argument rating were compared with their interview responses for each argument rating during the coding process.
Results
In this section, we first report the results from the quantitative phase, followed by the results from the qualitative phase. Later, in the Discussion, we interpret the quantitative and qualitative results in an integrated results matrix, specifically a joint display.
Quantitative Phase
We analyzed the argument strength ratings with a 2 (argument type: belief-consistent and belief-inconsistent) × 3 (evidence type: temperature, sea level, and glacier) repeated-measures analysis of variance. The main effect for argument type was significant, F(1, 61) = 8.00, MSE = 5.13, p < .01, and had a medium to large effect size (η2 = .116). Participants gave higher ratings to belief-consistent arguments (M = 5.03) than to belief-inconsistent arguments (M = 4.37), 95% confidence intervals [4.67, 5.39] and [4.01, 4.73], respectively. Thus, participants rated belief-consistent arguments more favorably than belief-inconsistent arguments. Neither the main effect for evidence type (p = .26), nor the interaction effect (p = .58) were significant.
Collectively, participants rated belief-consistent arguments more favorably than belief-inconsistent arguments despite the fact that both types of arguments had equally compelling justifications. Thus, individuals applied a more-critical standard to belief-inconsistent arguments than to belief-consistent arguments. This suggests that students showed belief bias.
Qualitative Phase
We conducted two secondary analyses on the two qualitative groups. First, the more-objective (M = 6.5, SD = 1.5) and less-objective (M = 6.2, SD = 1.7) students did not differ with respect to reading comprehension skill, t(1, 17) = 0.38, p = .712, and Mann-Whitney U (p = .60). Second, we compared the groups with respect to strength of beliefs. The scale midpoint (i.e., 5) was subtracted from each participant’s mean scale score, then converted to an absolute value. Next, the absolute values for each group were summed and the group means were computed. The more-objective (M = 1.23, SD = 0.87) and less-objective (M = 1.87, SD = 1.23) students did not differ with respect to strength of beliefs, t(1, 18) = 1.35, p = .194, and Mann-Whitney U (p = .22).
More-Objective Group
Analysis of the interview data from the students in the more-objective group (P1, P9, P31, and P47) revealed two themes. First, they explicitly focused on the quantity of evidence (i.e., amount of time and/or number of locations) in the argument when they justified their ratings. Second, they applied the same evaluation criteria independently of whether the arguments were belief-consistent.
These themes are illustrated with interview excerpts from one student (P31) who was more-accepting of climate change. When asked to explain his rating (“4” somewhat weak) for an argument against climate change, which was belief-inconsistent, he said, “Because this [evidence] was based on one glacier and one area between two years, and ‘coz it was one glacier, it doesn’t mean that all the glaciers around the world are the same.” In his explanation, he identified both location and amount of time as criteria for his justification. Similarly, when asked to explain his rating (“4” somewhat weak) for the opposite argument for climate change, which was belief-consistent, he said,
Because [the argument] was only based on one glacier, in only one area, and it was only [a] period of one year, so it’s not very strong because climate change happens over a long period of time, and it was based it on one glacier, not globally.
Thus, he applied these criteria consistently to both types of arguments based on the evidence. Then, when asked why he gave the same rating to both of these arguments, he replied, “Because they are only based on one place, on one glacier, over a short period of time 1-2 years. So [they’re] not very strong because [they weren’t] globally and [they were] over a short period of time.” These statements, and others like them, indicated that students in the more-objective group applied the same evaluation criteria independently of whether the argument was belief-consistent.
Less-Objective Group
Analysis of the interview data from the students in the less-objective group (P27, P32, P36, and P67) revealed two themes. The first theme, which they shared in common with the students in the more-objective group, was that they explicitly focused on the quantity of evidence (i.e., amount of time and/or number of locations) in the argument when they justified their ratings. This finding was particularly interesting because it indicated that they used the quantity of evidence to evaluate the arguments. However, unlike the more-objective group, they only did this when the argument was belief-inconsistent. So, the second theme was that they applied evaluation criteria differently based on whether the argument was consistent with their beliefs. When arguments were belief-inconsistent, they focused on the quantity of evidence; however, when arguments were belief-consistent, they focused on the plausibility or believability of the evidence. As such, they viewed the evidence that was consistent with their beliefs to more plausible or believable. Specifically, individuals who were more accepting of climate change thought it was implausible for change without human influence, whereas individuals who were less accepting of climate change dismissed some evidence because they thought it was implausible for humans to affect change. This finding is consistent with research that has shown that individuals struggle to reason about information that contradicts one’s ideas.
These themes are illustrated with interview excerpts from one student (P27) who was more-accepting of climate change. When asked to explain his rating (“2” very weak) for an argument against climate change, which was belief-inconsistent, he said, “Coz, it’s only giving one data set, like just one country . . . but in another country it could be different.” In his explanation, he identified number of locations as criteria for his justification, which illustrates his focus on the quantity of evidence. Furthermore, he indicated that one location did not provide strong evidence of climate change. However, when asked to explain his rating (“6” somewhat strong) for the opposite argument for climate change, which was belief-consistent, he said, “The average sea level rising is pretty unnatural, but then again it’s only describing like one place in the world.” Although he noted that evidence from one location provided weak evidence, as he had done with the belief-inconsistent argument, he thought it implausible for the sea level to rise without human influence and rated it stronger than the belief-inconsistent argument. Thus, he applied these criteria differently based on whether the argument was belief-consistent. Furthermore, when asked why he gave different ratings to the opposing arguments, he said, “Well, they are both the same, but one’s for [climate change] and one’s against [climate change] so I think my personal opinion influenced me to give [the argument for] a higher rating.” These statements, and others like them, indicated that students in the less-objective group applied evaluation criteria in a belief-driven way.
Discussion
The quantitative data suggest that adolescents aged 13 to 14 can reason independently from their beliefs about a complex scientific topic, and verbally explain their reasoning, although belief bias is more common. Scores on the argument rating data at the group level indicated that the students showed belief bias when they evaluated the arguments. However, scores at the individual level indicated that some students’ ratings were more-objective, whereas other students’ ratings were less-objective. The joint display (Table 3) revealed two key quantitative findings. First, students in the more-objective group rated belief-consistent and belief-inconsistent arguments for each type of evidence almost identically. Second, students in the less-objective group rated the belief-consistent arguments for each type of evidence as stronger than the belief-inconsistent arguments. The interview data could be used to explain these two findings.
Integrated Results Matrix.

Analysis of the qualitative interviews indicated that students in both groups applied the same evaluation criteria to belief-inconsistent arguments (i.e., quantity of evidence). However, only students in the more-objective group indicated that they applied these same standards of evaluation to belief-consistent arguments; these students applied the same evaluation criteria independently of whether the arguments were belief-consistent (see Table 3). Thus, students in the more-objective group separated their beliefs from the evaluation process. Conversely, students in the less-objective group described evaluating arguments differently based on whether they were belief-consistent (see Table 3). Thus, holding a belief did not necessarily lead to biased reasoning; rather, biased reasoning occurred when individuals applied a more critical standard of evaluation to belief-inconsistent arguments. That is, students in the less-objective group applied different standards of evaluation based on whether the arguments were belief-consistent rather than on the evidence presented in the arguments.
One explanation for these findings is that these adolescents differed with respect to conceptual and procedural metacognition. Conceptual metacognition is one’s knowledge about cognition, such as knowing that one’s beliefs can influence reasoning, and procedural metacognition is knowledge about how to control one’s cognition, such as being able to guard against the influence of one’s beliefs on reasoning (Moshman, 2015). Participants in the more-objective group may have understood that beliefs can bias one’s judgments and guarded against this potential bias by applying evaluation standards uniformly to the arguments independently of their beliefs. Conversely, participants in the less-objective group may have been unaware that beliefs can bias one’s judgments, unable to guard against the potential influence of their beliefs on reasoning, or both. These students may have been unaware that they evaluated belief-consistent arguments with a bias toward confirmation and belief-inconsistent arguments with a bias toward disconfirmation.
The interview data are consistent with this explanation. During the interview, students viewed the arguments and were asked justify their ratings for each argument individually and in conjunction with the opposing argument. Students who were more-objective explicitly noted that the arguments were similar and indicated that they rated them similarly because they had equally compelling evidence. However, students who were less-objective did not appear to recognize that they justified their ratings differently for opposing arguments. Furthermore, they did not express any awareness that they had used different standards to justify their different ratings, despite the fact that the arguments had equally compelling evidence, were open to the same criticisms, and were presented side-by-side at the point during the interview in which they were asked to compare the arguments. Thus, even if they were aware of the explicit criteria they used to evaluate both types of arguments, they did not appear to be aware that they had used different criteria to evaluate the two types of arguments.
The present study provides insights into how adolescents evaluate belief-relevant arguments and addresses the need for research on the role that belief bias plays in adolescent scientific reasoning. The findings suggest that the development of scientific reasoning is necessary but not sufficient for more-objective reasoning. The fact that participants from both groups used quantity of evidence to reason about the belief-inconsistent arguments indicated that they were capable of applying a common set of standards to identify weaknesses within the arguments. However, only the students in the more-objective group used these same evaluation criteria to evaluate belief-consistent arguments, whereas students in the less-objective group applied less stringent standards to belief-consistent arguments. Thus, the study demonstrates how researchers can use mixed methods to investigate reasoning at both the group and individual levels to provide insights into differences between those who are more and less effective at reasoning independently of their beliefs.
Contribution to Mixed Methods Research
From a methodological perspective, the study illustrates how integration can be achieved at the methods level and at the interpretation and reporting level when a researcher intentionally integrates the quantitative and qualitative approaches at the design level in an explanatory sequential design. Integration at the study design level occurred through the intentional use of an explanatory sequential mixed methods design in which quantitative data (i.e., argument ratings) were collected and analyzed, and in turn informed the follow-up qualitative phase. Integration at the methods level occurred in two ways. First, integration through connecting involved using the data from the argument rating task to purposefully sample participants for follow-up interviews, via extreme-case sampling, who demonstrated higher and lower levels of belief bias. Second, integration through building involved designing the argument interview protocol to enable students to explain their reasoning behind each argument rating individually and in conjunction with the opposing argument to gain insights into why they rated some arguments the same or differently. Integration at the interpretation and reporting level occurred in two ways. First, integration through narrative occurred when the quantitative and qualitative data were described contiguously so that it was possible to compare the findings for both groups and to develop meta-inferences. Second, integration through the use of a joint display involved the use of an integrated results matrix, a visual display that can be used to represent quantitative and qualitative data results interpretation in a single display.
It is important to note that the framework and procedures we used to achieve integration in the present study, prioritizing Fetter et al.’s (2013) approach, is but one approach available to researchers. Independently of the approach a researcher uses, achieving integration in a mixed methods study involves asking and addressing crucial questions about the design and implementation of a study: what to do, how to do it, and why. Knowing what involves knowledge about integration and the ways integration can be achieved in a mixed methods study. Knowing how involves knowledge about executing specific procedures for integrating the quantitative and qualitative aspects of a study. Knowing why involves knowing when and why particular methods and procedures are appropriate in a given context, and more broadly why integration is a goal of mixed methods research.
The different frameworks provide a mixture of information about integration that can be used to address these three basic question of what, how, and why to different degrees. Some provide more direction with respect to “what” and others provide more direction with respect to “why,” which is related to the authors’ intent, audience, and outlet in which the piece was published. Given our (the authors) current knowledge of mixed methods research and integration, we primarily relied on the Fetters et al. (2013) paper because it provided us with a pragmatic organizational framework for reflecting on how integration could be achieved both broadly across levels (conceptually understanding how the levels were related) and specifically within particular levels (practically understanding the procedures that would enable integration) in a study. The back-and-forth shift in focus helped us simultaneously strive for integration across levels and within levels. We encourage researchers to evaluate different approaches for achieving integration to identify the optimal way of maximizing the yield from their mixed methods research.
Furthermore, the study illustrates the use of a multilevel mixed design in which the quantitative data are collected at one level of analysis (i.e., class level) and the qualitative data are collected at another level of analysis (i.e., student level) in a sequential manner (Teddlie & Tashakkori, 2009). The quantitative strand provided useful information in the form of descriptive and inferential statistics at the level of the group, such as whether the sample showed evidence of belief bias. However, it is possible that data at the level of the individual differ from group trends. When this is the case, qualitative inquiry can be useful for understanding differences at the individual level (Johnson & Schoonenboom, 2016), as was the case with the qualitative strand in the present study. In such instances, a multilevel mixed design can be useful because it enables a researcher to use quantitative methods to investigate a topic at the level of group and use qualitative methods to investigate a topic at the level of the individual. This type of design has utility for investigating topics in “naturally occurring nested, or hierarchical structures” because it enables researchers to use quantitative and qualitative data from different levels to answer related questions about a topic of interest (Teddlie & Tashakkori, 2009, p. 156). Thus, we recommend that researchers consider the not only how to integrate the quantitative and qualitative aspects of a study but also to consider the possible role that level might play in the research process (e.g., types of research questions posed, types of analyses conducted).
Footnotes
Appendix
Example Arguments.
| Argument against human-influenced climate change | Argument for human-influenced climate change | |
|---|---|---|
| Temperature | If humans affect the climate, then average global temperatures should be changing. However, in Texas the average temperatures in July 2012 and July 2013 were essentially the same. This evidence suggests that average global temperatures are stable. Therefore, humans are not affecting the climate. | If humans affect the climate, then average global temperatures should be changing. In Australia, the average temperature in January 2013 was significantly higher than the average temperature in January 2012. This evidence suggests that average global temperatures are increasing. Therefore, humans are affecting the climate. |
Declaration of Conflicting Interests
The author(s) declared no potential conflicts of interest with respect to the research, authorship, and/or publication of this article.
Funding
The author(s) received no financial support for the research, authorship, and/or publication of this article.