
Abstract
When mixed methods research (MMR) has a qualitatively driven analytic frame, integration techniques should align with the purposes and contributions of qualitative methods. This article describes two integration strategies that can be used within qualitatively driven MMR to deductively analyze qualitative data: (a) using quantitative variables as a coding framework, (b) using statistical findings to develop codes for qualitative analysis. The strategies capitalize on the strengths of qualitatively driven MMR while facilitating analytic integration. After describing the strategies, we provide examples within a study examining early childhood inclusive education. This discussion contributes to MMR by providing integration strategies that are necessarily grounded in an analytic frame and that allow rigorous qualitative analysis, facilitate systematic analytic integration, and promote richer understanding of phenomena.
The integration of qualitative and quantitative methods is the key process differentiating mixed methods research (MMR) from research using multiple methods (Bazeley, 2012; Fetters, 2016). Yet without explicit consideration of when and how integration takes place to fulfill specific purposes, there is a risk that it will become yet another research concept with so many meanings that it will “become meaningless” (Fetters & Molina-Azorin, 2017b, p. 8). At its best, integration allows researchers to build stronger conclusions, initiate new understandings, and gain a more complete picture of underlying mechanisms (Bazeley & Kemp, 2012). However, integration remains a challenge for researchers, as many grapple with purposeful integration that does not sacrifice the rigor of individual methods while accounting for fundamentally different assumptions about research design and purposes (Bazeley, 2012; Bryman, 2007). At the same time, the narrowest interpretation of data integration can lead to the simple merging of data, which may not allow researchers to appropriately consider or explain exactly when and how methodologies, methods, and philosophies are mixed (Fetters & Molina-Azorin, 2017a). Consequently, the dimensions of integration should be explicitly articulated, and integration practices should be consciously tied to its analytic frames in order to ensure intentional, systematic MMR design decisions (Fetters & Molina-Azorin, 2017a; Moseholm & Fetters, 2017).
Specifying the Context of Integration: Integration Dimensions and Analytic Frames
In part to combat the unclear conceptualizations of integration, Fetters and Molina-Azorin (2017a) proposed an MMR integration trilogy that represents the systematic linking of quantitative and qualitative methodological commitments, methods, and philosophical approaches. Based on that trilogy, the authors proposed 15 dimensions of integration that help explicate the many possibilities for MMR integration (e.g., philosophical, theoretical, researcher, team, rationale, research design, data collection, data analysis, interpretation). The present article focuses on integration within the “data analysis dimension” (Fetters & Molina-Azorin, 2017a, p. 294).
When considering integration during analysis, the analytic frame is an articulation of the specific approaches that drive analysis, indicating the intended purpose and process of analysis (Moseholm & Fetters, 2017). Moseholm and Fetters (2017) articulated three analytic frame dimensions that affect the strategies used for merging qualitative and quantitative data during analysis: relational (separative or iterative), methodological (qualitative, quantitatively, or equivalently driven), and directional (unidirectional or bidirectional). Although Moseholm and Fetters (2017) discussed these dimensions in the context of convergent MMR, we assert that they apply to other forms of MMR as well due to the necessity to be clear about the intent of MMR integration (Creswell, 2015; Moseholm & Fetters, 2017), the process for integration, and the utility of different integration strategies to enhance interpretation (Moseholm & Fetters, 2017). Thus, articulating a clear analytic frame facilitates intentional, effective integrated analysis. The integration strategies described in this article will be explicitly discussed in relation to MMR with an iterative, qualitatively driven, bidirectional analytic frame.
Articulating an explicit analytic frame, particularly the methodological dimension, helps drive intentional data collection, analysis, and integration decisions when data are mixed at the analysis dimensions. However, being qualitatively or quantitatively driven is not just about the type of data collected but how data are analyzed, integrated, and used to fulfill the purposes of the research. As defined by Hesse-Biber et al. (2015), qualitatively driven MMR involves engaging in a research process in which (a) social reality is viewed as manifold; (b) the goal of research is to understand multiple perspectives, with individuals being viewed as experts regarding their experiences; (c) the purpose of research is to broadly understand a phenomenon; (d) data are collected within naturalistic settings and reflect qualitative methods, such as in-depth interviews; (d) analysis maintains a commitment to in-depth descriptions of phenomena and the identification of general themes or patterns; and (e) the goal of the research is to understand process, rather than predict or generalize outcomes. Furthermore, integration grounded in a qualitatively driven analytic frame aims to actively utilize multiple sources of knowledge and achieve saturation (depth) of data rather than control for bias or achieve statistical power (Moseholm & Fetters, 2017). This is generally reflective of a constructivist, phenomenological, poststructural, or critical paradigm (Bhattacharya, 2017; Corrigan & Onwuegbuzie, 2020). For example, MMR that intends to draw conclusions about the relationship between variables would warrant data integration strategies that still control for bias or outside variables, which may mean quantitizing qualitative data or minimally using it to inform conclusions. Meanwhile, MMR that intends to incorporate multiple sources of knowledge into analysis (e.g., existing theory, in-depth descriptions of participant perspectives) or highlight underlying mechanisms of quantitative patterns would necessarily draw heavily on rich qualitative data and retain the details of qualitative data during integration and conclusions. Thus, decisions about integration strategies should be grounded in explicit articulation of the intentions and analytic frame of integration.
In this article, we will describe two integration strategies that can be conducted in studies with a qualitatively driven analytic frame. First, we will discuss data integration during analysis processes, including practical implications of particular analytic frames. Next, we describe the two integration strategies for deductively analyzing qualitative data and the ways they facilitate integration within the data analysis dimension. Finally, we provide an example of the strategies within a mixed methods study with an iterative, qualitatively driven, bidirectional analytic frame. These two strategies add to the growing dialogues regarding explicit integration strategies (e.g., Vogl, 2018) that are appropriately grounded within analytic frames (Moseholm & Fetters, 2017).
Data Integration During Analysis
Integration during the analysis phase of a study allows researchers to capitalize on the unique strengths of quantitative and qualitative data, identify deviant or extreme cases, compare different data sources, and support exploratory, predictive, or confirmatory statistical analyses (Bazeley, 2010, 2012). There has been significant literature that describes analysis integration techniques (e.g., Bazeley, 2012; Fetters et al., 2013; O’Cathain et al., 2010). For example, Bazeley (2012) identified five useful types of integrative strategies that particularly focus on data analysis: (a) one form of data informs design and analysis of another, (b) integrating multiple data components during analysis, (c) integration of more than one strategy for analysis (i.e., data transformation), (d) results integration from analyses of separate data components, and, (e) methods that are “inherently mixed” (e.g., studies in which the same data source produces both qualitative and quantitative data, such as social network analysis). However, practical guides about how to integrate during analysis have typically not linked such practices to analytic frames, which can make it difficult to understand how different types of data contribute to conclusions (Moseholm & Fetters, 2017). Here, we review three types of integrative analysis that are often used: using one form of data informs design and analysis of another, integrating multiple data components during analysis, and integration of more than one strategy for analysis (i.e., data transformation; e.g., Bazeley, 2012; Fetters et al., 2013; O’Cathain et al., 2010). These three strategies warrant particular consideration because they represent interactive or iterative analysis approaches (Fetters et al., 2013).
Using One Form of Data to Inform Another
The first analytic technique, the use of one form of data to inform the design and analysis of another, is particularly prevalent in MMR that has a development purpose (Greene, 2007). For example, Manz et al. (2014) conducted focus groups with home visitors to determine the content and format of a quantitative tool measuring parent involvement behaviors. Once the measure was developed based on qualitative analyses, only statistical analyses of the surveys were used to characterize parent involvement behaviors and to determine the usefulness of the tool. In these and similar examples of MMR where the purpose of analysis (to develop a quantitative tool that identifies discrete variable relationships and outcomes) aligns with a quantitatively driven, unidirectional analytic frame (e.g., Akinade et al., 2018; Nichifor, 2016), qualitative analyses may not inform quantitative analyses or be used in final interpretations. When qualitative analyses are used, they may be limited to that which the quantitative results deemed meaningful.
Alternatively, when studies with a development purpose employ a qualitatively driven, bidirectional analytic frame, different analysis and integration decisions are warranted. For example, Lucero et al. (2018) explored community-based participatory research (CBPR) partnership practices and outcomes within health research contexts using an indigenous-transformative model. The authors first conducted interviews with CBPR partners that influenced survey development and the development of additional interview protocols. After initial analysis, surveys and interviews were compared using joint displays grounded in the study’s conceptual model and research questions. Final conclusions were determined based on convergence between the two types of data or qualitative data only. In this and other research with a similar analytic frame (e.g., Bal et al., 2014), qualitative analyses may shape interpretation of quantitative analyses and how they are applied to make meaning.
Integrating Multiple Data Components
The second type of analytic integration involves integrating multiple data components during analysis. For instance, in comparative analysis, qualitative data can be independently coded and then organized according to quantitative variables (e.g., demographics, assessment scores; e.g., Bazeley, 2006). However, this approach may be employed with a variety of analytic frames. For example, Bradt et al. (2015) examined the differential impacts of music therapy and music medicine using an iterative, unidirectional, quantitatively driven analytic frame. After independently coding interviews, the researchers integrated qualitative and quantitative findings in a joint data display organized based on quantitatively assessed treatment results. Study conclusions were ultimately based on z-score statistical analysis that created groups based on which type of therapy was most effective.
In a qualitatively driven example, Cabrera (2011) examined similarities and differences in racial ideologies between White men and other racial and gender groups (i.e., White women, non-White men and women), and how those ideologies were formed before and during college. Cabrera (2011) conducted interviews with White males to identify their primary racial ideologies and then administered a longitudinal survey that reflected three of the four racial ideologies from the interviews. The author used the survey to determine whether the interviewed White males’ ideologies generalized to a larger population and to examine the relationship between discrete college experience variables (e.g., number of classes addressing racial/ethnic issues) and changes in racial ideologies. Cabrera’s (2011) final analysis and interpretation reflected the study’s analytic frame as inferences were focused on participants’ expressed ideologies during interviews and he used existing theory about color-blind racism to interpret and make meaning of the survey findings (thus, drawing on multiple sources of knowledge).
Data Transformation
Finally, the third type of analytic integration technique is data transformation, wherein qualitative data are quantitized or quantitative data are qualitized. Data transformation is such a common way to integrate quantitative and qualitative data during analysis that it is even a possible standalone step in recommended mixed methods data analysis procedures (Greene, 2007; Onwuegbuzie & Combs, 2010). Creamer (2018) argued that data transformation “may well be ubiquitous to mixed methods research” (p. 117). Moreover, in their literature review, Archibald et al. (2015) found that, when data undergo transformation, quantitizing qualitative data are more common than purposefully qualitizing numeric data. Qualitizing quantitative data may include generating qualitative categories based on quantitative data, theoretically grouping or profiling participants based on quantitative scores, or otherwise converting quantitative data into data that can be analyzed qualitatively (Corrigan & Onwuegbuzie, 2020; Nzabonimpa, 2018). Such transformation can introduce bias and therefore should be undertaken with caution. However, it is important to note again that qualitatively driven analysis does not aim to control bias like quantitatively driven analysis (Moseholm & Fetters, 2017). As Moseholm and Fetters (2017) assert, the approach to bias should align with the analytic frame.
Quantitizing qualitative data may include counting codes, instances, or patterns (sometimes differentiated as “quantifying”; Creamer, 2018, p. 119); applying a dichotomous variable to identify the presence or absence of a code; conducting cross-tabulations; and performing nonparametric or exploratory multivariate statistical analyses of counted data (Bazeley, 2010; Sandelowski et al., 2009). For example, Kim (2009) divided participating teachers according to whether they were native English speakers. The teachers’ comments about how they evaluated students’ English performance were inductively coded, resulting in 19 evaluation criteria. Then, Kim counted how many times teachers used each evaluation criteria and compared the two teacher groups. These code counts formed the primary basis for study conclusions. Similarly, researchers have quantitized qualitative observations and interviews by counting the occurrence of certain participant actions or emotions, and/or rating the quality of observed actions according to a predetermined scale (e.g., Ahlgrim-Delzell & Rivera, 2015; Kramer et al., 2014; Monrouxe & Rees, 2012).
The ways qualitative data have been quantitized can reflect a quantitatively driven analytic frame because analysis is driven by the desire to control bias, generalize to a representative sample, or identify consistent, discrete relationships (Moseholm & Fetters, 2017). Creamer (2018) named three example purposes for quantitizing qualitative data: document relationships, demonstrate temporal change, and identify clusters of individuals (p. 121). The emphasis on quantitatively driven analysis may be particularly true for certain MMR designs. For instance, Creswell and Plano Clark (2018) specified that the data-transformation variant of convergent MMR designs includes researchers implementing the convergent design while “often placing greater emphasis on the quantitative strand, and us[ing] a merging process of data transformation” in order to “quantify the qualitative findings” (p. 73). Such emphasis on quantitative data and the transformation of qualitative data is appropriate for research whose purposes align with a quantitatively driven analytic frame. However, if researchers intend to examine mechanisms underlying quantitative findings or explore broad phenomenon, context, or experiences (purposes of analysis), or plan to incorporate multiple sources of knowledge to inform conclusions (process of analysis), a different analytic integration strategy is warranted.
Given the prevalence of quantitizing qualitative data and the present focus on integration strategies within a qualitatively driven analytic frame, this analytic technique warrants additional discussion. Quantitizing qualitative data can help merge or compare different data sources, aide statistical analyses, identify time-based sequences, support typology development, and support researchers’ ability to credibly represent a set of findings (Bazeley, 2009, 2012; Hannah & Lautsch, 2011). However, quantitizing qualitative data has been critiqued as leading to potentially misleading findings or inappropriate generalization due to the smaller sample sizes typically utilized in qualitative research (Maxwell, 2010; Pratt, 2009). It may also obscure rich descriptions of naturalistic context and participant experiences that can be captured by qualitative research (Hesse-Biber et al., 2015) and that uniquely contribute to research questions regarding mechanisms underlying quantitative results (Creswell et al., 2003; Creswell & Plano Clark, 2011). Thus, quantitizing qualitative data can result in researchers not capitalizing on the unique strengths of qualitative and quantitative research methods, potentially doing both a disservice (Pratt, 2009). This is particularly a concern because appropriately using the multiple methods employed in a study, based on their unique strengths, is a key component of MMR quality (O’Cathain, 2010). In the case of the Kim (2009) study previously described, the author acknowledged that the way qualitative data were analyzed limited an understanding of why the teachers scored differently on certain measures.
The two integration strategies that will be discussed here are offered as alternatives to quantitizing qualitative data when integrating within an iterative, qualitatively driven, bidirectional analytic frame. There have been continued calls for more examples of data integration techniques during analysis (e.g., Vogl, 2018), but such strategies must be grounded in particular analytic frames (Moseholm & Fetters, 2017). The purpose of this discussion is to highlight analytic strategies that facilitate integrated analysis while capitalizing on the strengths of qualitative research and allowing rigorous qualitative analysis.
Strategies to Analyze Qualitative Data Using Quantitative Data Sources
Before articulating the strategies, it is important to note that both these strategies reflect deductive analysis of qualitative data. Deductive analysis that explicitly draws from existing theory or frameworks, as opposed to inductive analysis, can be especially useful in attempts to contextualize and complicate existing knowledge (Ravitch & Riggan, 2012). Although most qualitative analysis is informed by existing theory or literature to some extent, deductive coding, as used here, reflects the use of a previously formed framework or “start list” of codes to analyze qualitative data sources (Miles et al., 2014, p. 81). This is in contrast to inductive analysis in which a coding system emerges progressively from an iterative process of rereading data sources in order to “chunk” data into meaningful units that eventually form the basis for code development (Bhattacharya, 2017, p. 150). Using quantitative (QUAN) research to analyze qualitative (QUAL) data represents one method of deductive coding.
Notably, Hesse-Biber et al. (2015) assert that qualitatively driven MMR analysis should be inductive. However, we argue that, when used as a part of an iterative, bidirectional analytic frame, the qualitatively driven nature of analysis can be retained when using these deductive strategies. First, inductive coding is still possible due to the iterative nature of analysis. Additionally, other aspects of qualitatively driven MMR are retained because of the bidirectional nature. QUAL data may still stand independently and/or inform QUAN analysis (e.g., QUAL findings may inform which statistical analyses are conducted or used to draw final conclusions). When QUAL data or findings inform QUAN analysis and interpretation (a potential avenue for qualitizing QUAN data), the incorporation of multiple sources of knowledge drive analysis, as opposed to concerns about bias. Additionally, “thick” descriptions of participant experiences and contexts are retained when drawing inferences. Finally, the focus of analysis can remain on mechanisms underlying quantitative patterns rather than the patterns themselves. All these features are commitments aligned with qualitatively driven MMR (Hesse-Biber et al., 2015; Moseholm & Fetters, 2017), and QUAL data’s unique contributions within MMR (Creswell et al., 2003; Creswell & Plano Clark, 2011). Indeed, as Hatta et al. (2020) illustrated, switching between inductive and deductive approaches can add to an overarching qualitatively driven analytic frame. Thus, all three dimensions of the analytic framework (iterative, bidirectional, qualitatively driven) work together to advance analysis purposes and facilitate coherent and intentional integrated analysis.
Table 1 provides an overview of the strategies, purposes relative to a qualitatively driven analytic frame, influence on data collection and analysis, and hypothetical examples.
Data Analysis Integration Strategies.
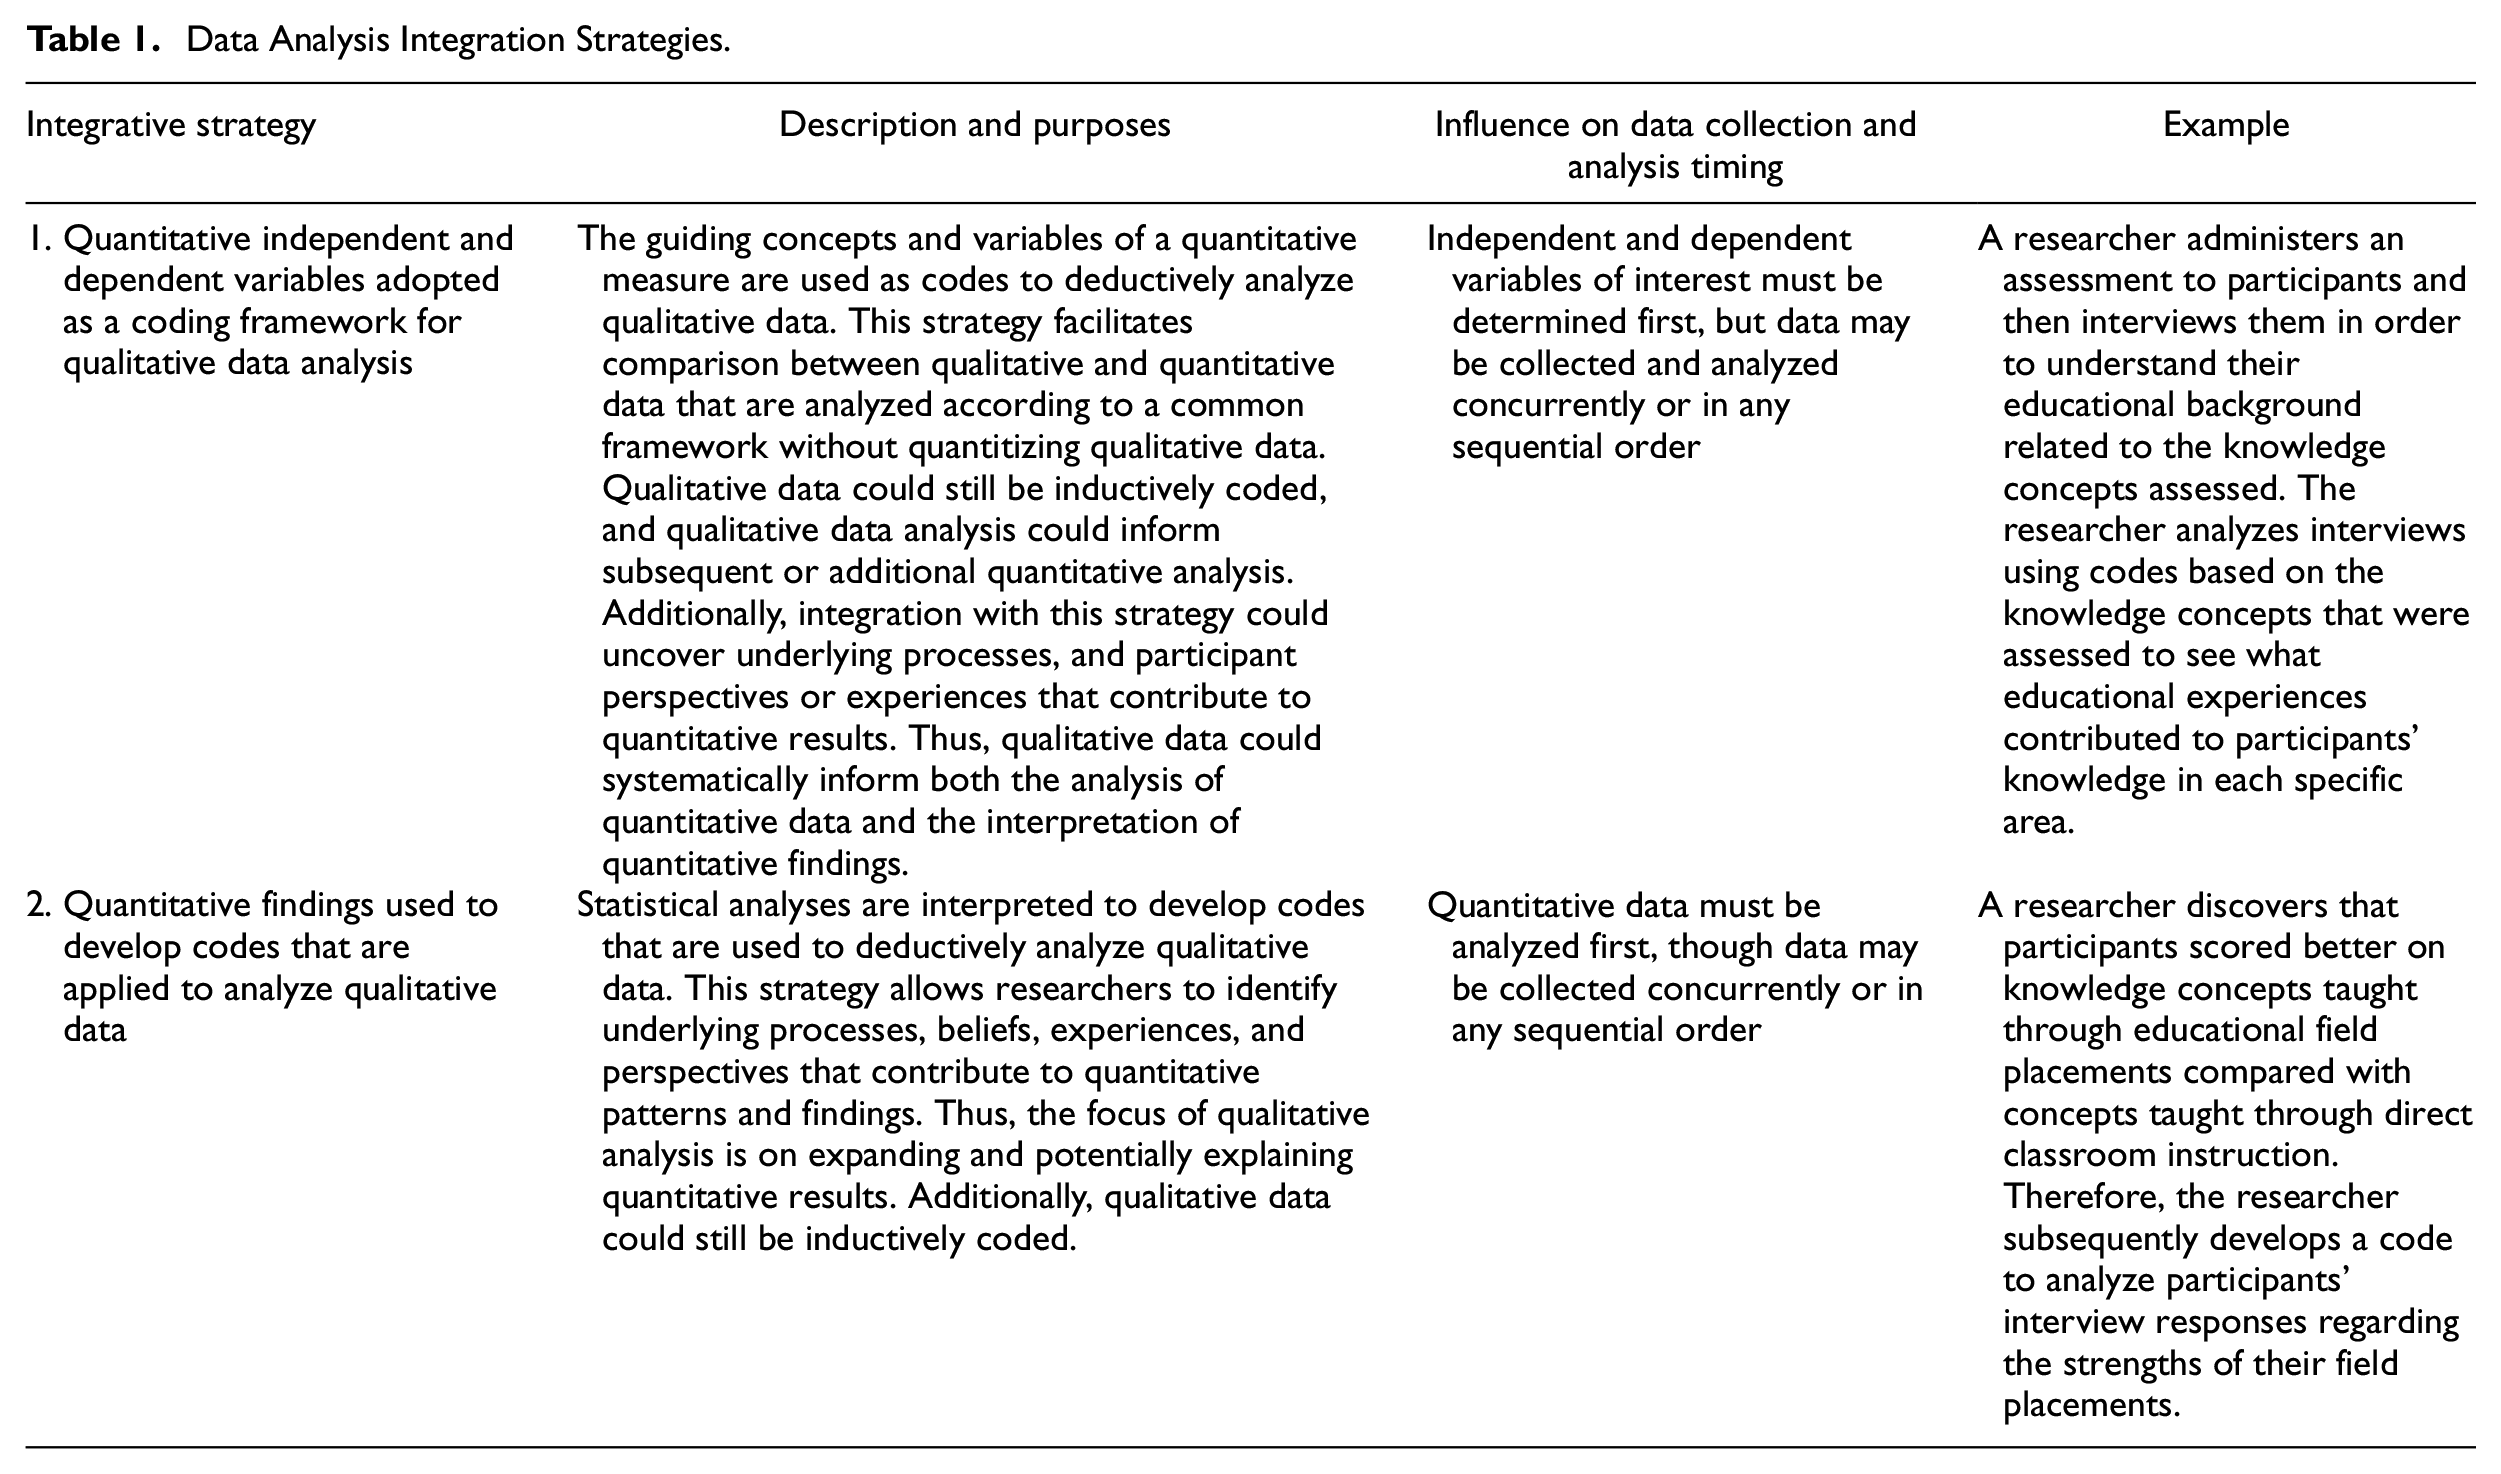
Strategy 1: Using Independent and Dependent Quantitative Variables as Coding Framework
Independent and dependent quantitative variables can be adopted as a coding framework or typology for qualitative data analyses. For example, a researcher could administer an assessment to participants and then conduct interviews with a select group of participants in order to understand their educational background related to the knowledge assessed. To analyze the interviews, the researcher could apply codes that represent each knowledge concept that was assessed to see what educational experiences contributed to participants’ knowledge in that specific area. This strategy does not require data to be collected or analyzed in a certain order.
Because this strategy does not depend on data being collected in a certain sequence, it is possible to use this strategy in different types of mixed methods designs. In a convergent MMR design, qualitative and quantitative data would be analyzed separately initially but at the same time (Creswell & Plano Clark, 2018), using the quantitative variables. In a sequential MMR design, where qualitative or quantitative data are collected and analyzed one-at-a-time (Creswell & Plano Clark, 2018), qualitative data could be analyzed either before or after quantitative data are collected and analyzed. If qualitative data are analyzed first, its analysis could potentially inform quantitative analysis through the identification of experiences, perspectives, and behaviors that were highlighted by participants.
The matching of domains and constructs have previously been described and used as a way to focus both analysis and collection of quantitative and qualitative data around specific domains or constructs (e.g., Fetters & Molina-Azorin, 2017a; Moseholm et al., 2017). However, we propose isolating the matching of constructs to analysis. Although a small change, this is key to researchers being able to uphold qualitatively aligned paradigms (e.g., constructivist, phenomenological, or critical perspectives; Bhattacharya, 2017) and engage in expansive inductive analysis. That is, broader qualitative data collection and inductive analysis paired with this strategy facilitates the positioning of individuals as experts of their experiences who may communicate subjective realities and allows in-depth understanding of experiences, contexts, and processes outside generalizability or outcomes-focused research (qualitative-driven analysis goals; Bhattacharya, 2017; Hesse-Biber et al., 2015).
Strategy 2: Using Statistical Findings to Develop Codes for Qualitative Analysis
For the second strategy, findings derived from statistical analyses can be used to develop codes that are then applied to analyze qualitative data. For example, if the same researcher analyzed assessment results and found that participants scored better on concepts taught through educational field placements compared with concepts taught through direct classroom instruction, they could subsequently develop a code to analyze participants’ interview responses regarding the strengths of their field placements. Unlike the first strategy, this strategy requires quantitative data to be analyzed before engaging in deductive analysis of the qualitative data. Because of this distinction, the second strategy could be used in tandem with the first strategy.
Using statistical findings to develop qualitative codes is compatible with multiple types of MMR designs. In a sequential MMR design (Creswell & Plano Clark, 2018), quantitative data could be analyzed and then findings would be used to inform qualitative data analysis. The use of a convergent MMR design with this strategy would require the fully integrated variant of the design (Creswell & Plano Clark, 2018). The fully integrated variant allows the qualitative and quantitative strands to interact with each other (bidirectional and iterative) rather than keeping them separate. Note that inductive qualitative analysis could take place before or after the quantitative findings-based deductive analysis and is still recommended.
Unlike what has been done previously (e.g., Bradt et al., 2015), this strategy positions the QUAN data as contributing to targeted, in-depth QUAL code development and application, instead of simply dividing and comparing QUAL data according to discrete QUAN variables (e.g., participant characteristics). Additionally, like the first strategy, we recommend that integrating data sources in this way is limited to analysis rather than informing qualitative data collection. The strategy, as described here, still draws on a qualitatively driven analytic frame because the goals and process of analysis allow in-depth description of phenomena, an understanding of process and underlying mechanisms, and a manifold view of participant perspectives and sources of knowledge (Creswell et al., 2003; Hesse-Biber et al., 2015; Moseholm & Fetters, 2017). Those goals may be lost when qualitative data are quantitized (e.g., Ahlgrim-Delzell & Rivera, 2015; Kramer et al., 2014).
Example of Integrative Strategies: Understanding High-Quality Inclusive Education Across Early Childhood Settings
Little research has addressed inclusive education quality as a contextualized process influenced by classroom and program features (e.g., Odom et al., 2011; Tsao et al., 2008). The study described here examined the influence of organizational context and special education service delivery models on the quality of inclusive education young children experience. The study explored two research questions: (1) How do features of the organizational context influence inclusive education quality? (2) How do features of the service delivery model influence inclusive education quality?
The conceptual framework that guided data collection and analysis was grounded in Bronfenbrenner’s ecological systems model (Bronfenbrenner, 1999; Bronfenbrenner & Morris, 1998), the Division for Early Childhood of the Council for Exceptional Children & the National Association for the Education of Young Children (DEC & NAEYC, 2009) definition of inclusive education, and Odom et al.’s (1999) categorization of forms of inclusion. Variables were examined based on that framework with an understanding that a myriad features, structures, and policies influence the implementation of high-quality early childhood inclusive education (Barton & Smith, 2015).
The two integrative strategies previously described were employed as data analysis procedures within an iterative, qualitatively driven, bidirectional analytic frame. Here, we briefly describe the study and report sample findings that resulted from the integration strategies. The study’s description will not be comprehensive. Instead, the focus is to highlight the ways these integrative strategies can be used and the benefits of their use.
Methods
The study used an explanatory sequential design in which quantitative data collection (i.e., structured observations) was followed by qualitative data collection (i.e., in-depth interviews; Creswell & Plano Clark, 2018). Additionally, an embedded, multiple case study method of inquiry was employed (Yin, 2014). Structured observations were used to understand whether inclusive practices differed across early childhood inclusion models. Qualitative interviews facilitated an understanding of additional differences across contexts and the possible mechanisms underlying said differences.
Settings and Participants
Each model of inclusive education formed a case for which quantitative and qualitative analyses were integrated. Case formation was theoretically grounded, rather than statistically determined, such that classrooms within cases served as theoretical replications—that is, they were viewed as likely operating similarly because of their shared inclusion model (the theory-based context they were defined by) and operating differently from other contexts (Yin, 2014). There were three cases that represented three models of inclusive education: coteaching within a public school (two classrooms), early childhood special education (ECSE) teacher within a public school (three classrooms), and early childhood education (ECE) teachers within a community-based center (two classrooms). The small within-case sample sizes were a limitation but allowed more in-depth data collection and analysis given the focus on transferability, in line with qualitative research. Within each case, there were three units of analysis: the child, the teacher(s)/classroom, and the administrator/program (Teddlie & Tashakkori, 2009; Yin, 2014). Participants across each unit of analysis were recruited using multilevel purposive sampling (Collins, 2010; Teddlie & Tashakkori, 2009). Ultimately, seven classrooms were selected for inclusion in the study with 11 associated teachers. 21 children participated, 12 of whom had identified developmental delays or disabilities.
Data Collection
Data collection took place in two phases (Figure 1). Each phase consisted of structured observations followed by interviews with teachers and administrators. In the first phase, structured observations were conducted using the Classroom Assessment Scoring System (CLASS; an evaluation of global early childhood quality), the Inclusive Classroom Profile (ICP; a measure of inclusion quality), and the Code for Interactive Recording of Children’s Learning Environments (CIRCLE; a child-specific ecobehavioral observation tool). For the second round, observations only used the CIRCLE tool because the other tools are known to reflect stable measures of teacher practices in the absence of intervention.
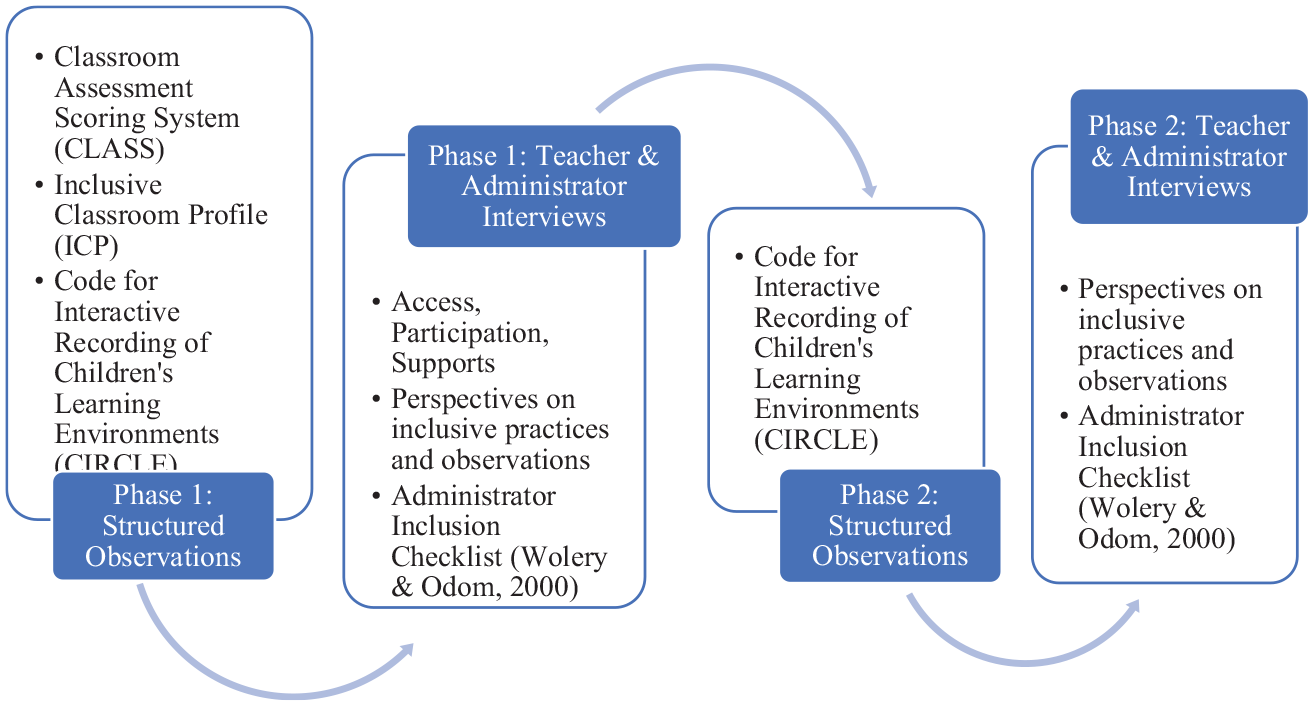
Data collection.
Semistructured interviews with teachers and administrators were conducted after each round of structured observations to understand their perspectives on inclusive education in their context and to add an understanding of unobserved classroom and program structures (e.g., program resources, professional development). They were implemented using a “tree and branch” structure (Rubin & Rubin, 2005, p. 45). Phase 1 interviews included five sections: (1) teacher/administrator background information, (2) general knowledge/beliefs about inclusive education, (3) classroom/model-specific implementation of inclusive education, (4) definition of inclusive education translated to practice, (5) questions based on observations and ICP interview questions. Phase 2 interviews consisted of four sections: (1) additional teacher/administrator and classroom information, (2) general knowledge and beliefs about inclusive education, (3) how the definition of inclusive education was translated to practice, (4) questions based on observations and initial Phase 1 analysis. Importantly, the interview protocol was designed to build on observations but was not limited to the structured observation constructs. Thus, while data collection started with quantitative data, analysis was able to retain a qualitatively driven analytic frame during integration, as defined by Moseholm and Fetters (2017).
Data Analysis
Because of the case study method of inquiry, data analysis was divided into within-case and cross-case analysis. The goals of within-case analysis were to (1) identify the inclusive education quality features across classrooms within a case (based on CLASS and ICP observations and interviews), (2) characterize children’s individualized experiences across classrooms within a case (based on CIRCLE data), and (3) identify classroom and program processes that were influencing inclusive education quality and practice (based on interviews). The product of within-case analysis was a collection of mixed methods joint data displays and case summaries organized around the conceptual framework of the study (not the QUAN variables). The joint data displays and the case summaries facilitated the integration of qualitative and quantitative data (Bazeley, 2018; Creswell & Plano Clark, 2011; Guetterman et al., 2015), in addition to the previously described analytic integration strategies. Within-case analysis yielded an in-depth understanding of the implementation of inclusive education within each case, including divergence within cases. Integrating different methods within cases before conducting cross-case analysis helped retain close connection to the context within which data were collected (Bazeley, 2018). That reflects the focus on in-depth descriptions of naturalistic contexts within qualitatively driven MMR (Hesse-Biber et al., 2015).
During cross-case analysis, within-case joint data displays and case summaries were (1) compared to identify differences in patterns of inclusive education quality and children’s individualized experiences and (2) analyzed to support developing inferences regarding contextual features and mechanisms influencing inclusive education quality. Although within-case data display were used to develop the case summaries, they were also used as an additional data set for cross-case analysis to facilitate the development of cross-case joint displays (Greene, 2007; Onwuegbuzie & Combs, 2010). Figure 2 summarizes data analysis integration points to highlight the bidirectional and iterative nature of analysis. Table 2 provides more details about the analysis actions and purposes, illustrating the study’s qualitatively driven analytic frame.
Integrated Analysis Process.

Note. QUAN = quantitative; QUAL = qualitative.
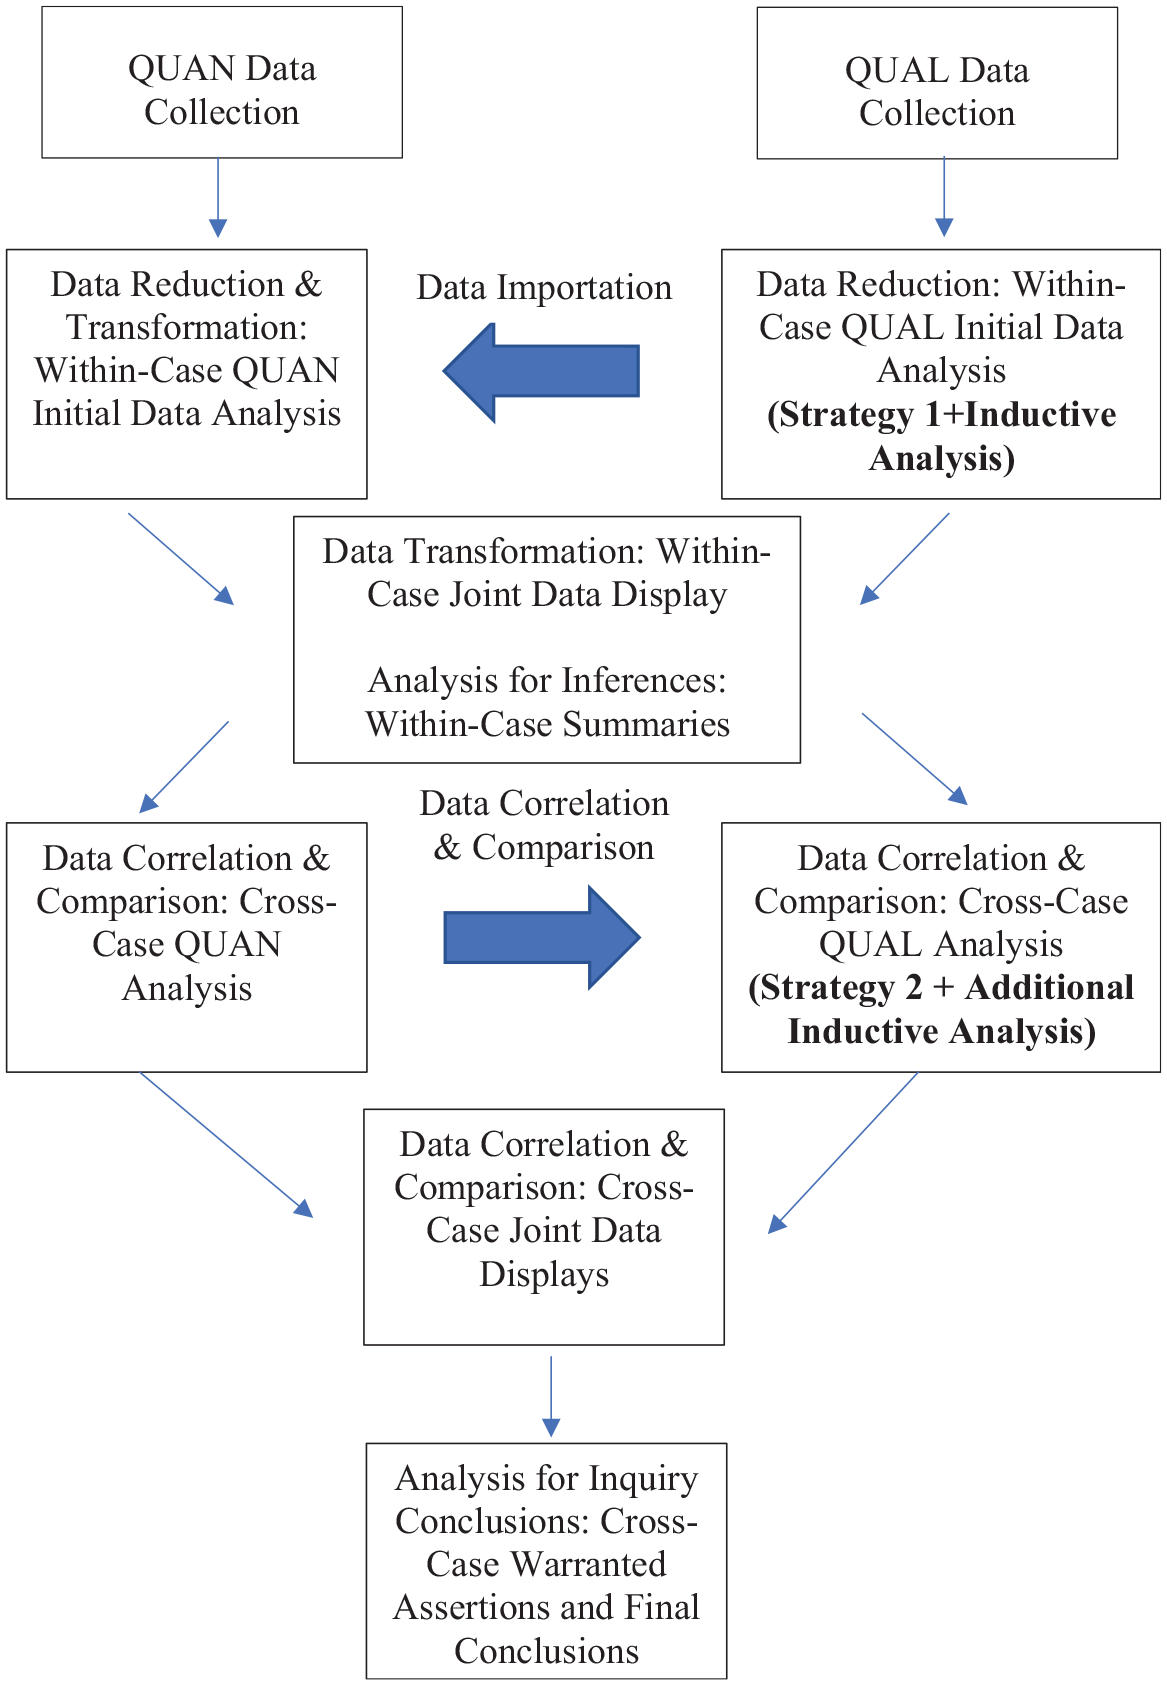
Data analysis points of integration.
Use of Integration Strategies
The following sections are divided by each integration strategy to discuss how the two previously described integration strategies were used and sample findings.
Integration Strategy 1: Translating Independent Variables Into a Coding Framework
Both research questions addressed how classroom and program processes influenced quantitative data that characterized inclusive education quality features. To support this purpose early in the analysis process, the first integration strategy was used during within-case analysis to facilitate initial deductive analysis of teacher and administrator interviews.
Description of analysis process
A coding system was developed based on the items or dimensions of each structured observations used in the study and the definition of inclusive education (access, participation, supports; DEC & NAEYC, 2009). The CLASS’ 10 dimensions resulted in 10 codes. The 12 ICP items formed 12 codes. Two of CIRCLE’s items were combined (Teacher Recipient of Talk and Teacher Involvement) into a single code, and two other items were used that directly aligned with inclusive education quality (Academic Content, Classroom Engagement). Other items from CIRCLE were not used in the coding framework because they were specific to a certain content area (e.g., Literacy Instruction) or described classroom features specific to the time of the observation (e.g., Teacher/Child Language Used). An excerpt of the initial code framework can be seen in Table 3. These codes represent part of the “Participation” component of inclusive education. A coding system grounded in the quantitative data frameworks helped integrate quantitative and qualitative data starting with initial analysis (Bazeley, 2018).
Inclusive Education: Select Participation Codes Derived From Structured Observations.
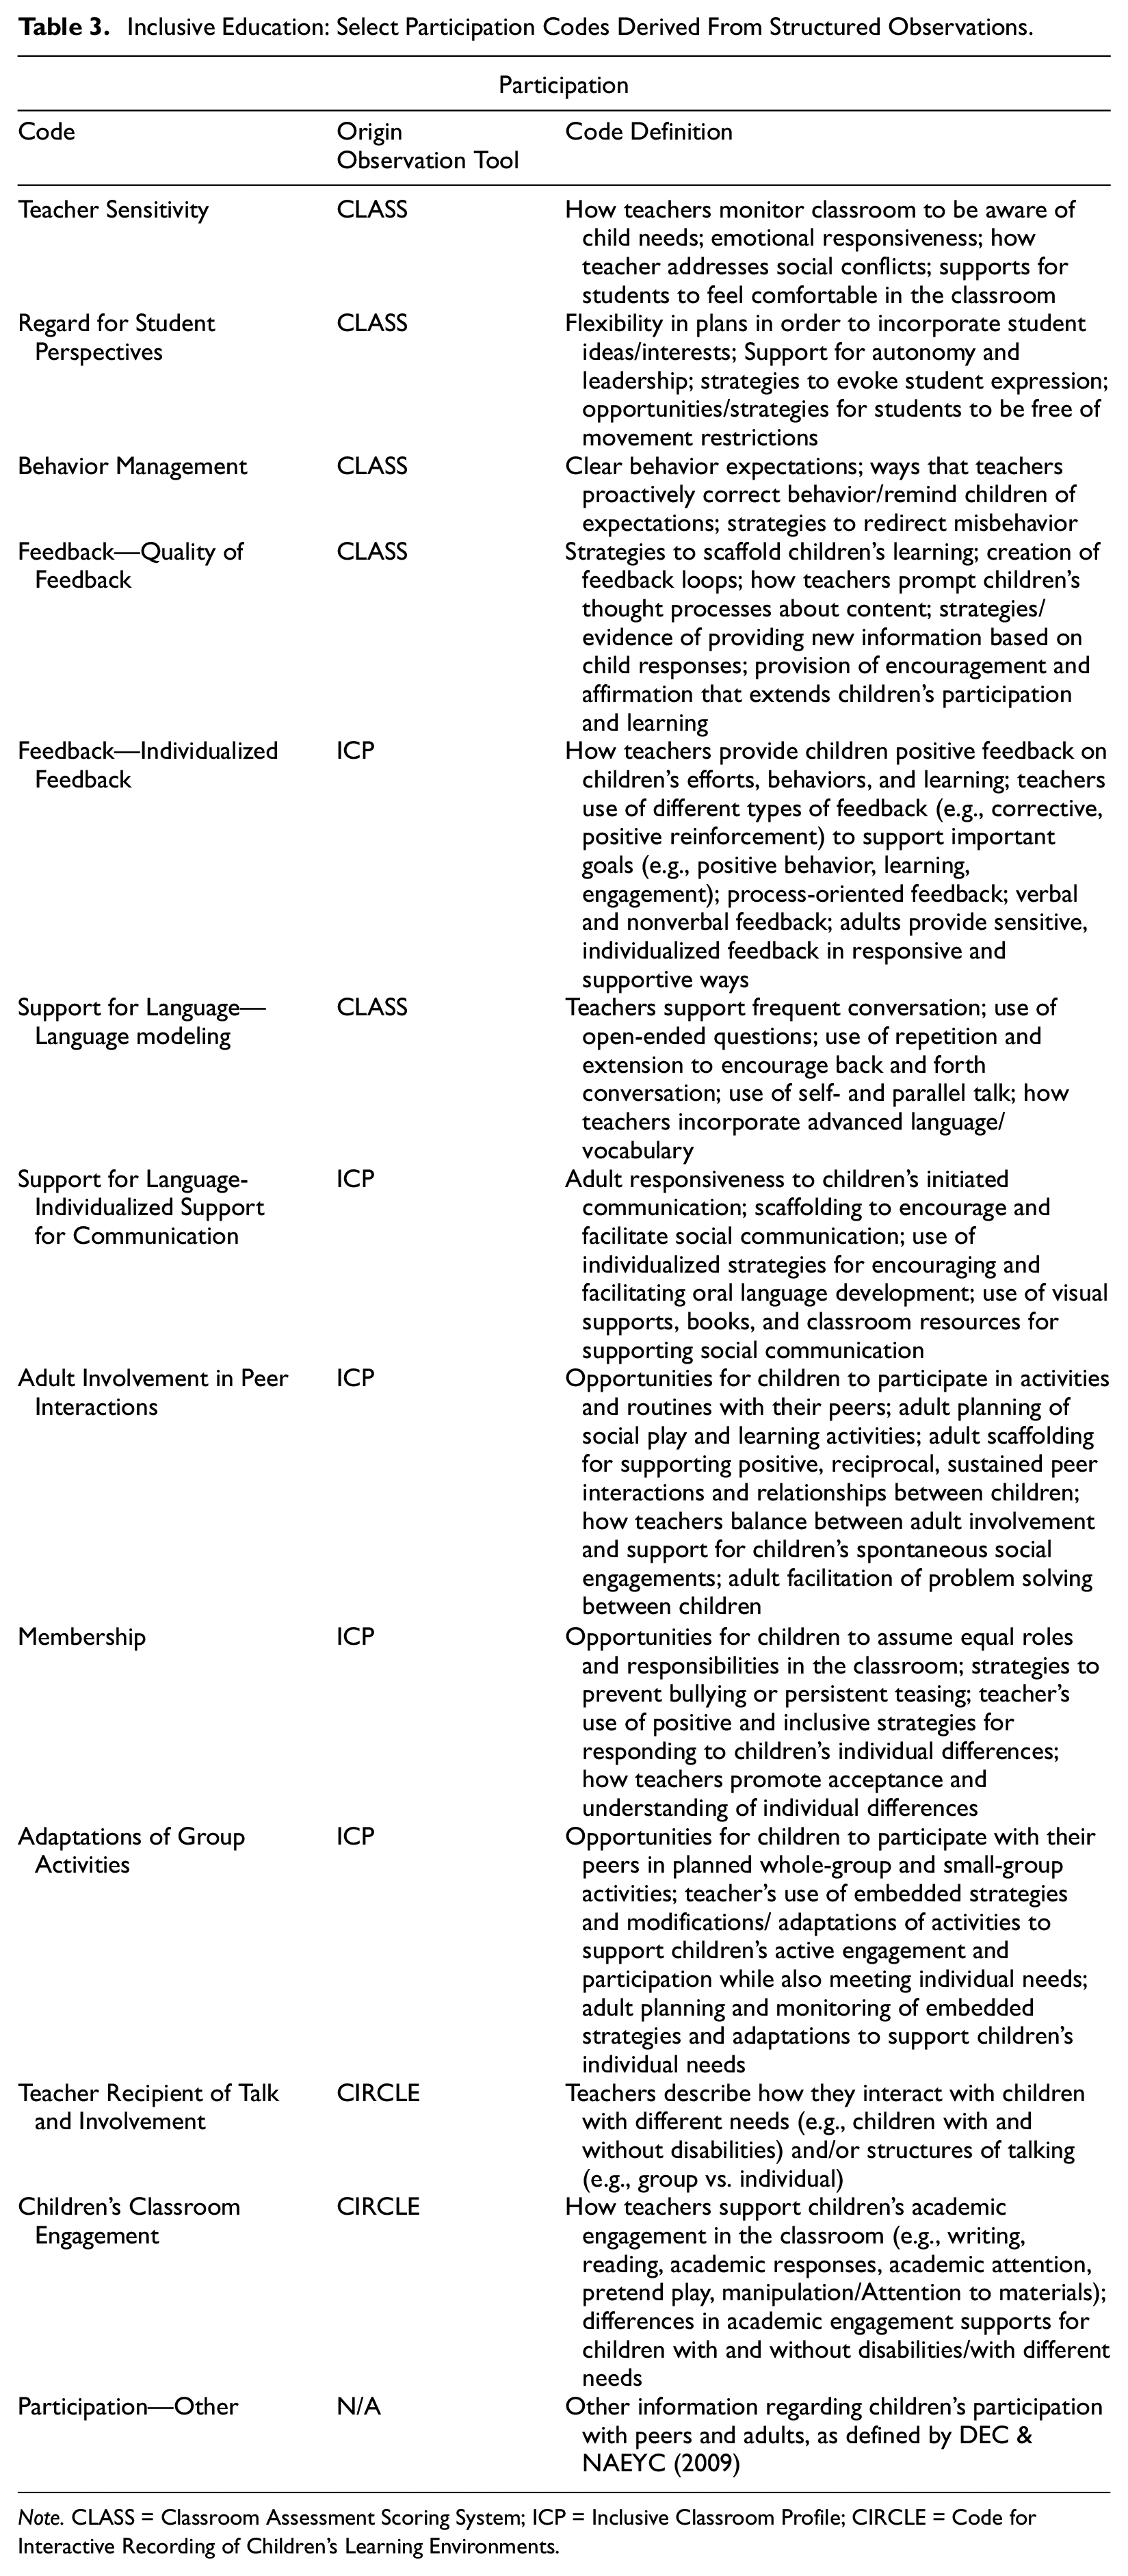
Note. CLASS = Classroom Assessment Scoring System; ICP = Inclusive Classroom Profile; CIRCLE = Code for Interactive Recording of Children’s Learning Environments.
In addition to codes from the structured observations, an “other” code was developed for each of the three components of inclusive education (i.e., “Access—Other,”“Participation—Other,” and “Supports—Other”). Transcript excerpts were coded as “other” if they were deemed relevant information based on the conceptual framework of the study and its research questions, despite the excerpt not directly aligning with a structured observation item. These codes facilitated subsequent inductive analysis.
Select findings
Several important findings emerged as a result of the first integration strategy. Linking the QUAN and QUAL data in this way allowed an understanding of why teachers scored as they did on the structured observation tools and the underlying beliefs and approaches that influenced their practices. Table 4 provides an excerpt of a within-case joint data displays linking the average ICP—Monitoring Children’s Learning score for the two classrooms in the ECE: community-based center case to coded interview excerpts. Note that the within-case joint data display were organized around the study’s conceptual framework (in this case, the “supports” dimension of inclusive education), rather than QUAN variables.
Excerpt of Within-Case Joint Data Display.
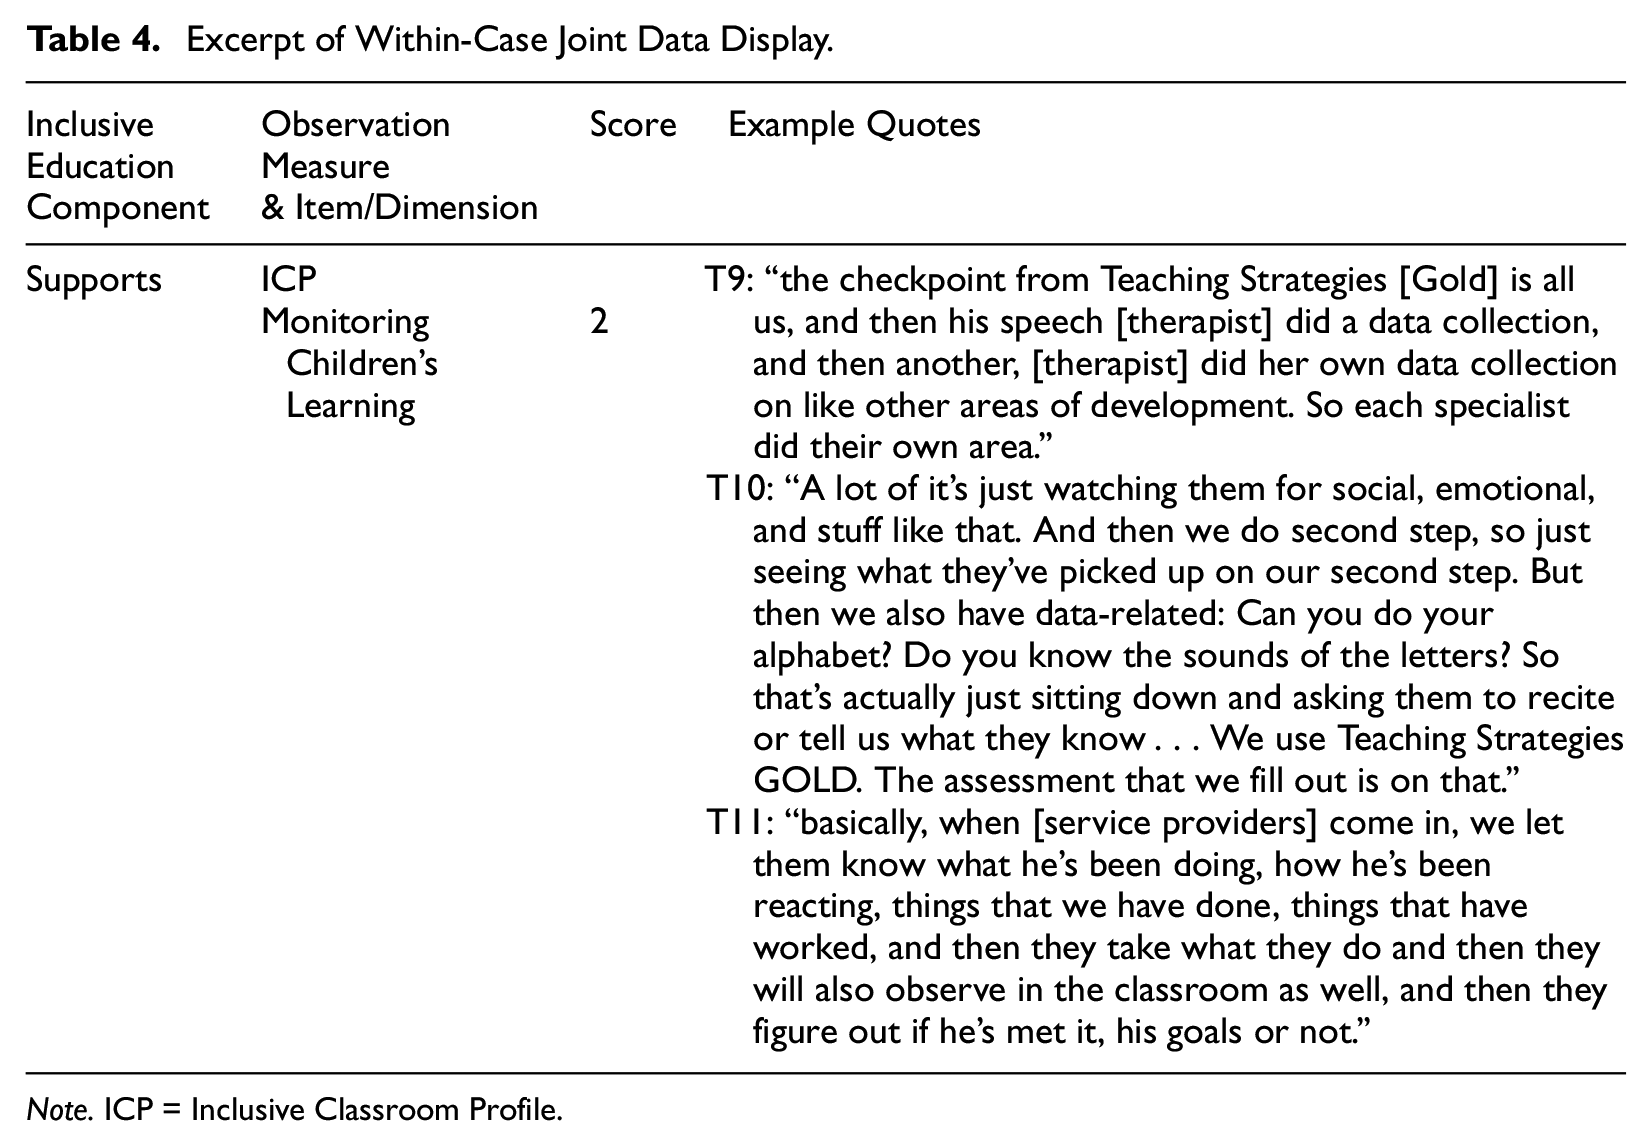
Note. ICP = Inclusive Classroom Profile.
Combining the classrooms’ average score on that ICP item and the teachers’ description of their progress monitoring practices provided a more nuanced understanding than the score alone. Based on the ICP score, one might conclude that center-based ECE teachers were doing very little, if any, progress monitoring for children with disabilities. In fact, as seen by the quotes in Table 4, center-based ECE teachers described progress monitoring as a responsibility divided among children’s service providers based on their areas of specialty. Additionally, they managed progress monitoring from a less structured approach. For example, in addition to describing how classroom teachers split data collection with related service providers, Teacher 9 (Classroom 4-107, ECE: Community-Based Center) described her more regular, formative progress monitoring by saying that she and the other classroom teacher “will record or take pictures on the tablet . . . just kind of write down things that they’re saying.” The interviews coded using the first strategy provided key insight into not only if/how teachers tracked children’s progress, but their beliefs and knowledge about both data collection and collaboration with related service providers. Later inductive cross-case analysis of the interviews confirmed that this progress monitoring approach was unique to center-based ECE teachers.
Inductive analysis of the original transcripts also expanded on this finding to indicate that public school ECSE and coteaching teachers utilized service providers differently because they are based in public schools. For example, Teacher 3 (Classroom 1-103, Coteaching: Public School) described that a child’s speech pathologist was regularly able to generally help within the classroom, saying “[s]he’ll sit down with the students regardless of if they’re on an IEP or not. So she kind of just adds into the group as like another teacher.” Thus, public school teachers had more access to service providers and their collaboration with them more generally centered around classroom support.
In sum, using the first integration strategy to deductively code qualitative data according to the QUAN observations’ items allowed an expanded, more nuanced understanding of the cases, including potential mechanisms underlying the QUAN findings. Additionally, inductive interview coding combined with findings from the use of the first analysis strategy resulted in an unexpected, tangential finding. Such a qualitatively driven, iterative process allowed a richer understanding of the context that was not restricted to the quantified ways they differed.
Integration Strategy 2: Applying Findings Derived From Quantitative Data
The second integration strategy was employed during cross-case analysis. Both research questions centered on the desire to better understand how inclusive education processes differed. In addition to inclusive education quality differences, the cases potentially could have been similar on certain quality scores while differing in the mechanisms that contributed to those scores. Therefore, it was important that cross-case analysis maintained the data integration that was achieved during within-case analysis. Additionally, data analysis needed to maintain a dual focus on inclusive education quality differences and underlying mechanism differences.
Description of analysis process
After within-case analysis, the joint data displays and case summaries were compared to identify cross-case differences in inclusive education classroom quality scores. Statistical analyses also compared CIRCLE ecobehavioral data from individual children across cases. Once differences were identified, the associated QUAL findings were examined to understand potential underlying mechanisms (e.g., staffing and service delivery patterns, resources, teacher beliefs and priorities). Several times, differences in quality features emerged between cases that warranted a reanalysis of interviews. In these instances, the second integrative analysis strategy was employed to allow targeted iterative analysis of QUAL data. Importantly, while we focus on that process here, study conclusions were not limited what the QUAN findings deemed significant and QUAL data still drove conclusions. This is a departure from the ways analytic integration has typically operated when one data source informs the analysis of another (e.g., Bradt et al., 2015; Dockett & Perry, 2004)
Select findings
Based on a comparison of the within-case joint data displays, one difference that emerged between the cases was the relationship between teacher feedback and academic responses for children with disabilities. In ECSE classrooms, teacher feedback was associated with academic responses for both children with disabilities (r[956] = .063, p < .05) and their typically developing peers (r[478] = .091, p < .05; Table 5). However, in coteaching classrooms, teacher feedback was positively correlated with academic responses for children without disabilities only (r[318] = .112, p < .05). Similarly, in ECE: community-based classrooms, teacher feedback was positively correlated with academic responses for children without disabilities only (r[638] = .181, p < .01). Whether the teachers’ feedback prompted active academic engagement in children with disabilities was one way to understand its influence on children’s learning and development.
Correlation Between Teacher Feedback and Children’s Academic Responses.
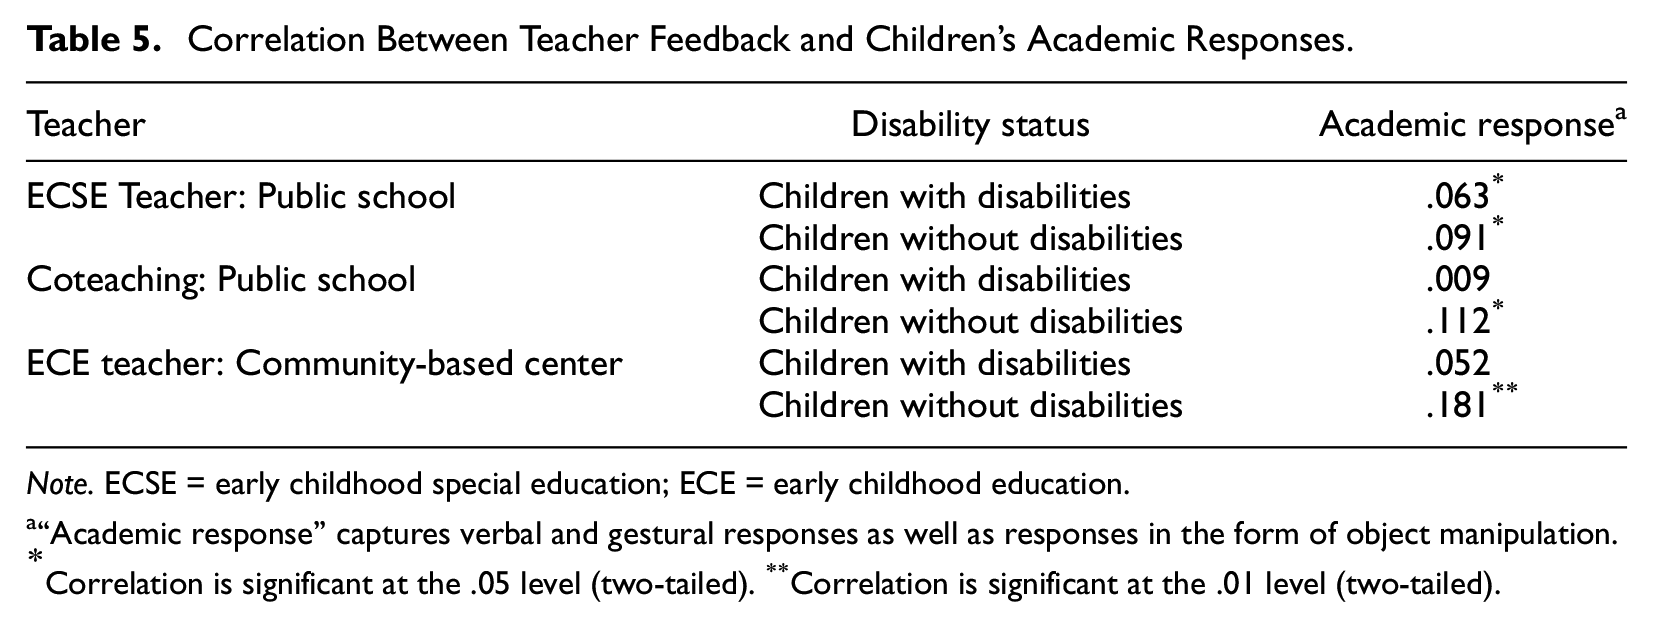
Note. ECSE = early childhood special education; ECE = early childhood education.
“Academic response” captures verbal and gestural responses as well as responses in the form of object manipulation.
Correlation is significant at the .05 level (two-tailed). **Correlation is significant at the .01 level (two-tailed).
Based on these QUAN analyses, the Teacher Feedback codes previously developed based on the CLASS and ICP were divided into two subcodes: Teacher Feedback—Children With Disabilities and Teacher Feedback—Children Without Disabilities. Analysis applying the new Teacher Feedback codes, in combination with inductive QUAL analysis, resulted in an important finding that ECSE teachers described a unique approach to teacher feedback, specifically, and intentional instruction, generally. Namely, ECSE teachers described using more direct instruction compared with other teachers and they largely based all classroom instruction and routines on individual children’s IEP goals. For example, when Teacher 7 (Classroom 3-106, ECSE: Public School) was asked how she differentially approaches supporting children with and without IEPs, she responded that children with IEPs need more one-on-one time with me. And it has to be intentional to make sure they’re getting what they need, making sure I’ve gotta take data on their goals and make sure that there’s a time during the day that they’ll be able to show me that goal.
In contrast, she reported supporting the progress of children without IEPs in “more of a general way.” Similarly, Teacher 5 (Classroom 2-104, ECSE: Public School) described her process for planning general curriculum objectives as being heavily shaped by children’s individual IEP goals. She reported, “in each weekly lesson plan, I always have a box that says, ‘working on these goals for this week.’ . . . I’ll put the initials from the IEP of each of the students that have a similar goal.” Thus, ECSE teachers often described providing children with disabilities with individualized instruction based on their IEP goals and shaping classroom curriculum around individualized goals.
In comparison, both coteaching and ECE teachers described efforts to balance the individualized needs of children with disabilities with a broader curricular focus. The coteachers did this by developing lessons based on general ECE standards and delegating individualization among themselves. For example, Teacher 2 (Classroom 1-101, Coteaching: Public School), the designated SPED teacher in her room, described their lesson planning and implementation process by saying, “[Gen ed teacher] takes care of a lot of the Gen Ed curriculum lesson plans. And I am the one that kinda goes in and helps tweak it to include the special needs students.” The lesson plans were based on general ECE goals and standards, and the support needs of children with disabilities in the classroom were added to it and primarily addressed by one of the two teachers. That process was different from the ECSE classrooms, where there was only one special education teacher leading (smaller) classrooms who structured classroom curriculum around individualized goals.
Meanwhile, the ECE teachers developed lessons by thinking broadly about potential barriers and then depending on related service providers to work on children’s individualized goals. Teacher 10 (Classroom 4-108, ECE: Community-based Center) explained, [we’re] thinking about what are potential roadblocks? So we have a lot of visuals in our room, and we’re currently making more visuals for all of our kids, but specifically for a couple of them, to try to help them before anything becomes too big of a problem.
Similarly, when asked how she works on children’s individual goals, Teacher 8 (Classroom 4-107, ECE: Community-based Center) reported that both teachers are “aware of what the children are working on and what they need help with . . . [but] I don’t know if I have the main responsibility of it.” Thus, ECE teachers appeared to more generally consider all children’s abilities and needs in the classroom when planning activities and providing instruction. They heavily relied on related service providers (e.g., speech therapists) to more directly support the few children with IEP goals. Again, this differed from the approach of ECSE classroom teachers whose classrooms consisted mostly of children with IEPs and who were primarily responsible for children’s individualized instruction. This also differed from coteaching teachers, who divided responsibilities among the two teachers in the room full-time.
Using the deductive strategy of revising and reapplying QUAL codes based on QUAN findings allowed identification of divergent approaches to teacher feedback and intentional instruction that potentially underscored QUAN findings. Additionally, the QUAL data highlighted how the coteaching and ECE teachers took different approaches to instructional planning, based on their teaching structures and classroom make-up. QUAN findings had not differentiated those two models in terms of the impact of their teacher feedback. Thus, the QUAL findings that resulted from deductive analysis helped explain mechanisms underlying the QUAN finding, elucidated its practical implications, and resulted in an additional inference point. In this way, the analytic integration allowed a greater understanding of the phenomenon at hand than a single method or the simple sum of the two methodological components (Fetters & Freshwater, 2015). If one were to just consider the QUAN finding (that only ECSE teachers’ feedback was positively correlated with academic responses for children with disabilities), the conclusion could be drawn that the other teachers simply were not providing effective feedback for children with disabilities. Moreover, the process of quantitizing qualitative data could have resulted in researchers missing important details about the unique planning and collaboration processes teachers undertook or limiting the analysis of QUAL data based on the QUANT construct (teacher feedback). In sum, deductively analyzing the QUAL data based on QUAN findings facilitated meaningful data integration and capitalized on the unique strengths of qualitative inquiry.
Limitations
This research exhibits two primary limitations. First, due to the exploratory nature of the study, it was conducted with a small sample of classrooms both within and across cases. More research is needed to continue to determine whether the patterns illustrated here transfer to similar contexts. Qualitative research aims to be transferable, rather than generalizable (Bhattacharya, 2017), which requires the broad, yet deep, information facilitated by MMR with intentional, rigorous integration. However, more research is still needed that evokes an understanding of participants’ direct testimony, in-depth contextual description, and information that places cases within the context of a larger frame (Tracy, 2010).
Additionally, data collection and analysis focused so much on contextual features that some individual variance among children, even within cases, may have been lost. Child information was limited to children’s disability label(s) and general abilities and needs, as reported by teachers. Whether children’s individual support needs were being met was minimally reflected in either QUAN or QUAL data determining the quality of teachers’ practices and underlying processes. This limitation illustrates the fact that the contributions of any analytic integration strategy are ultimately bounded by what and how data are collected.
Contributions of the Analytic Integration Strategies to the Study
The two analytic integration strategies greatly contributed to the conclusions that were possible in the described study. During within-case analysis, the first analytic integrative strategy (deductively coding qualitative data according to the QUAN observations’ variables) facilitated an in-depth understanding of the cases and contextual processes while immediately integrating the interviews and quantitative measures. Classroom processes were never separate from their outcomes. The strategy supported nuanced understanding of the cases, including a mechanism underlying a QUAN finding (why ECE teachers scored lower on the progress monitoring item). Additionally, because the QUAL data remained in its original form, a tangential finding was discovered based on inductive analysis of the QUAL data. That finding provided new insight on the differential relationships between teachers and related service providers across contexts.
The second analytic strategic (revising and applying QUAL codes based on QUAN findings) supported rigorous cross-case analysis. The strategy helped reveal divergent approaches to teacher feedback and intentional instruction for children with disabilities, a potential mechanism underscoring differences in the QUAN relationship between teachers’ feedback and children’s academic engagement. Additionally, the QUAL data analyzed in this way revealed differences in how coteaching and ECE teachers approached instructional planning, a difference that was not apparent in QUAN findings. Like the first strategy, the benefits of this strategy largely lay in the fact that QUAL data were not quantified yet QUAN and QUAL data were iteratively integrated at multiple points of analysis.
Both strategies significantly contributed to the use of QUAL data to answer the research questions. They revealed conclusions that drew on both integrated QUAL and QUAN data and QUAL data alone and allowed researchers to capitalize on the unique strengths of qualitatively driven research.
Contribution to the Field of Mixed Methods Research
Novelty of the Integration Strategies
Both the described strategies using quantitative data to deductively analyze qualitative data fall under the overarching integration strategy of using of one form of data to inform the analysis of another (Bazeley, 2012; Caracelli & Greene, 1993), which Fetters and Molina-Azorin (2017b) classified as a form of advanced integration analytics. However, they differ from the way such techniques have typically been implemented in several important ways. First, the codes that are derived from quantitative data or variables are not confined to those that help differentiate subgroups of participants or data (Caracelli & Greene, 1993). Additionally, although the quantitative variables or findings are informing QUAL analysis, they are not limiting QUAL analysis the way that quantitizing qualitative data can. Moreover, both of these proposed strategies allow for inductive coding before and/or after deductive analysis is implemented, which is recommended when research is aligned with a qualitatively driven analytic frame. Shifting between inductive and deductive analysis can be particularly beneficial for studies that aim to identify patterns within or across cases and studies that work from an established hypothesis or conceptual framework (e.g., Hatta et al., 2020). Finally, both strategies are explicitly confined to analysis stages of MMR, rather than using QUAN variables or findings to structure QUAL data collection. Indeed, although these integration strategies do somewhat structure QUAL findings to those relevant to QUAN framework, there are still opportunities to use multiple sources of knowledge (e.g., theory, rich descriptions of participant experiences).
Contributions to MMR With a Qualitatively Driven Analytic Frame
These two analytic integrative strategies can be useful as the MMR community continues to explore analytic integration strategies that retain the intent and processes of qualitatively driven research and capitalize on the strengths and contributions of qualitative research. When utilized within an iterative, bidirectional, qualitatively driven analytic frame, the two integration strategies allow for novel or unexpected findings related to QUAN variables, new information outside QUAN frameworks, and QUAL findings that influence subsequent QUAN data collection and analysis decisions. Accordingly, these strategies help researchers employ a qualitatively driven analytic frame in ways that address the 1 + 1 = 3 challenge of MMR integration, as described by Fetters and Freshwater (2015).
Future MMR can utilize these strategies in a wide variety of research designs to facilitate explicit analytic integration while maintaining commitments to paradigms associated with qualitative research (e.g., constructivist or interpretivist, phenomenological, and critical perspectives; Bhattacharya, 2017). These strategies may be particularly applicable to MMR that takes a critical paradigmatic stance as the analytic strategies align with and value the centering of participant voices while identifying mechanisms that contribute to larger patterns. For example, the strategies could be used in critical research that aims to connect participant’s individual experiences of marginalization to quantitative patterns of inequities, an endeavor of many critical theories (e.g., disability critical race theory; Annamma et al., 2018). Importantly, through the use of these strategies, the voices of the marginalized groups would be connected to, but not wholly defined by, the inequitable systems that affect them.
Conclusion
Thoughtfully integrating quantitative and qualitative data is central to high-quality mixed methods research, but it can also be a challenge. The two strategies described in this article facilitate meaningful integration during data analysis for research that takes a qualitatively driven analytic frame. They allow researchers to integrate QUAN and QUAL data without quantitizing qualitative data in order to capitalize on the unique strengths of qualitative research (e.g., centering participant experiences and knowledge, understanding mechanisms that underlie quantitative findings). Future research may employ these integration strategies in a variety of mixed methods designs and for a variety of purposes.
Footnotes
Declaration of Conflicting Interests
The author(s) declared no potential conflicts of interest with respect to the research, authorship, and/or publication of this article.
Funding
The author(s) received no financial support for the research, authorship, and/or publication of this article.