
Abstract
The primary objective of this study is to assess the effect of systematic dataset augmentation on the accuracy of real-time, vision-based Personal Protective Equipment (PPE) detection systems in occupational environments. The PPEDS-1000 dataset was employed, comprising 1,000 expertly annotated images across four PPE usage categories: worker (W), worker with helmet (WH), worker with vest (WV), and worker with both helmet and vest (WHV). An augmented dataset (PPEDS-2600) was derived via controlled geometric transformations (horizontal and vertical flips), additive Gaussian noise, and Gaussian blur. Each dataset is partitioned using an 80/10/10 train–validation–test split and utilized to train five YOLOv8 model variants (nano through extra-large). The evaluation metrics include precision, recall, F1-score, mean average precision at an IoU threshold of 0.5 (mAP50), and mean average precision averaged over IoU thresholds from 0.5 to 0.95 (mAP50-95). The experimental results demonstrate that augmentation elevates mAP50 from 77.7% on PPEDS-1000 to 94.8% on PPEDS-2600, thereby substantiating the hypothesis that targeted augmentation markedly enhances detection performance. The findings indicate that the present work establishes a rigorous benchmark for real-time PPE compliance monitoring.
Introduction
In its 2023 report on global occupational risks, the International Labour Organization (ILO) emphasized the urgent need for “safer and healthier working environments,” identifying occupational injuries as the leading cause among the top ten workplace risk factors, with 26.44 million cases reported worldwide (International Labour Organization, 2023). A major contributor to these injuries is the inconsistent or improper use of PPE (Liu et al., 2023). Ensuring PPE compliance is therefore critical, not only for reducing injury risks but also for ensuring regulatory compliance, promoting worker well-being, and maintaining operational continuity, especially in safety-critical sectors such as construction, mining, and manufacturing.
Despite the ongoing expansion of industrial automation, human workers continue to play a pivotal role in numerous operational environments. Conventional PPE monitoring techniques, such as manual inspection or surveillance review, are characterized by their time-consuming nature, susceptibility to human error, and impracticality for large-scale or real-time enforcement. These limitations have led to increased interest in artificial intelligence (AI) and computer vision techniques to enable automated PPE compliance monitoring. Deep learning-based object detectors such as the YOLO (You Only Look Once) family (Redmon et al., 2016) offer promising solutions capable of detecting safety violations with high speed and accuracy (Ahmed et al., 2023).
Nonetheless, several critical challenges remain. Chief among them is the scarcity of high-quality, diverse, and domain-specific datasets. Existing datasets, such as CHV (Wang et al., 2021), Pictor-v3 (Nath et al., 2020), and Roboflow's Hard Hat Workers (Roboflow, n.d.), have provided foundational resources for PPE detection research. In this study, we extend these datasets by introducing the proprietary PPEDS-1000 dataset, which deliberately incorporates varied lighting conditions, complex backgrounds, and balanced representation across four PPE configurations (W, WH, WV, WHV). Furthermore, we derive an augmented variant (PPEDS-2600) via systematic application of geometric and photometric transformations, thereby addressing both data variability and the computational constraints inherent to real-time, low-resource deployments. This contribution advances the field by furnishing a more diverse and robust dataset for multi-label PPE detection under realistic workplace conditions.
To address these gaps, the present study introduces two new datasets specifically curated for real-time PPE compliance detection. The first, PPEDS-1000, comprises 1,000 annotated images, each categorized into one of four PPE usage conditions: worker (W), worker with helmet (WH), worker with vest (WV), and worker with both helmet and vest (WHV). The second, PPEDS-2600, is an augmented extension of the original, generated through controlled transformations including horizontal and vertical flipping, Gaussian blurring, and noise injection. These augmentations simulate real-world visual variance, thereby increasing the image count to 2,600 and improving variability in background, lighting, occlusion, and camera perspective.
To evaluate the effectiveness of these datasets, five variants of the YOLOv8 object detection architecture (nano, small, medium, large, and extra-large) were trained and tested using a standardized 80/10/10 split for training, validation, and testing. Evaluation metrics included precision, recall, F1-score, mean Average Precision at IoU = 0.5 (mAP50), and mean Average Precision across multiple thresholds (mAP50-95). The experimental results demonstrated that dataset augmentation led to substantial performance improvements: YOLOv8 achieved a mAP50 of 77.7% on PPEDS-1000 and 94.8% on PPEDS-2600.
This study makes three key contributions:
The development of a high-quality, multi-class PPE detection dataset pair suitable for benchmarking and real-world deployment. A comprehensive performance analysis of YOLOv8 model variants under varying data conditions, offering insights into model scaling and generalizability. A reproducible, scalable framework for deploying real-time vision-based PPE monitoring systems, with considerations for resource-constrained environments such as mobile or embedded platforms.
The remainder of this paper is organized as follows. Section 2 presents a comprehensive review of prior work in PPE detection using deep learning and computer vision. Section 3 introduces the PPEDS-1000 and PPEDS-2600 datasets, detailing the data collection, annotation procedures, and augmentation techniques used. Section 4 outlines the YOLOv8 architecture, experimental setup, and evaluation methodology. Section 5 presents the experimental results and provides an analysis of the model's performance. Section 6 concludes the paper by summarizing findings, addressing limitations, and outlining future research directions in AI-driven PPE compliance monitoring.
Literature Review
This section provides an overview of recent advancements in the detection of personal protective equipment (PPE) through the application of artificial intelligence (AI), with an emphasis on computer vision and deep learning techniques. Particular attention is given to the YOLO (You Only Look Once) family of object detection algorithms, which have demonstrated notable efficacy in real-time safety compliance monitoring.
Sensor-Based and Vision-Based Detection Approaches
PPE compliance monitoring methodologies are generally divided into two main categories: sensor-based and image-based systems. Sensor-based systems use embedded technologies that are directly integrated into PPE items, such as RFID tags, inertial sensors, or proximity detectors. Image-based systems, on the other hand, automatically assess PPE usage by utilizing surveillance images in conjunction with deep learning models. These approaches offer a non-intrusive, scalable, and cost-effective alternative, especially when integrated with real-time video analysis frameworks. For instance, Fadhilla et al. (2025) demonstrated the efficacy of convolutional neural networks (CNNs) in identifying PPE non-compliance within construction areas, thereby reinforcing the viability of image-based monitoring solutions in operational contexts.
YOLO-Based Models for PPE Detection
The YOLO architecture has emerged as a foundational model for object detection tasks, particularly in domains requiring real-time inference. Its efficiency and accuracy have rendered it a preferred choice for PPE compliance applications. Several recent studies have evaluated the performance of various YOLO versions in this context.
Kisaezehra et al. (2023) conducted a comparative evaluation of YOLOv5 variants (n, s, m, l, x) using a dataset of 7,063 images focused on helmet detection. YOLOv5x achieved the highest mAP50 at 95.8%, while YOLOv5n demonstrated the best inference speed at 70.4 frames per second. Similarly, Chourasia et al. (2023) evaluated YOLOv4, YOLOv5, and YOLOv7 on a dataset of 5,000 images. YOLOv7 outperformed the others, achieving a mAP of 96.4% and an average inference latency of 12.4 milliseconds.
Patel et al. (2023) employed YOLOv8 for helmet detection under varying lighting and perspective conditions, reporting a classification accuracy of 99% and robust generalization across scene variations.
Girdhar et al. (2024) conducted a comprehensive evaluation of the YOLOv8 architecture for PPE detection in construction site environments, incorporating a dataset comprising ten ‘PPE and safety-related’ classes. Their results confirmed the model's robustness in detecting multiple PPE items, including both present and absent states of helmets, masks, and vests, demonstrating effective multi-label generalization under real-world, uncontrolled conditions.
Ma et al. (2025) introduced a hybrid object detection framework by integrating the YOLOv10n model with the RepViT backbone to enhance real-time PPE detection for power maintenance workers. This integration achieved competitive mean Average Precision (mAP50 = 0.911) while significantly reducing computational complexity, making it suitable for deployment in resource-constrained, real-world environments.
Finally, Semercigil et al. (2025) implemented a YOLOv7-based deep learning model to detect safety helmets in hazardous workplace environments. Their evaluation demonstrated high training accuracy and reliable detection performance, supporting the model's applicability in real-world safety-critical deployments.
Collectively, these studies underscore the adaptability and scalability of YOLO-based models in PPE detection. They also highlight an emerging need for context-specific optimization and training data diversity to enhance model generalizability further.
Dataset Contributions and Domain Adaptation
The success of deep learning approaches in PPE detection is inextricably linked to the availability of well-annotated, diverse, and domain-representative datasets. Numerous efforts have been undertaken to curate such datasets for model development and benchmarking.
Wang et al. (2021) introduced the CHV dataset, comprising 1,330 construction site images annotated across six object classes: four helmet colors (red, white, yellow, blue), vest, and person. This fine-grained categorization provides a more nuanced benchmark for evaluating multi-class PPE detection systems in real-world environments.
Liu et al. (2022) developed the PPED dataset containing 3,300 images from chemical factory settings and benchmarked YOLOv3-SPP, YOLOv5, SSD, and Faster R-CNN, identifying YOLOv5 as the most effective model (mAP 93.6%, recall 87.5%).
Bian et al. (2023) presented a new model based on the YOLOv7 model for the detection of helmet use in construction sites. Throughout the review, they used UAV aerial photography as one of the tools to obtain datasets for hard hat detection. The experimental results show that the YOLOv7 model improves the detection accuracy and is better than the previous YOLO models in helmet detection.
Ibrahim and Yussuf (2024) developed a YOLOv5-based deep learning model for real-time PPE compliance monitoring in mining environments, which detects helmets, reflectors, and safety boots from video streams, achieving a reported mAP of 0.85 on a 6,300-image dataset.
Recent advancements have shifted toward creating site-specific datasets and incorporating context-aware augmentation techniques. Yang and Kim (2025) proposed a relationship-aware object detection model that utilizes spatial semantics between objects to validate PPE usage and concrete pouring readiness. Their model, trained on a curated dataset of 641 construction-site images, exemplifies the potential of incorporating environmental context into model training.
Liu et al. (2025) proposed an enhanced YOLOv5s framework for identifying unsafe behaviours among construction workers. Their model incorporated a Focal-EIoU loss function, a Coordinate Attention mechanism, and a dedicated small-target detection layer to improve localization accuracy and feature representation in complex construction scenarios. The framework achieved a 3.6% improvement in recall and a 2.2% increase in mAP over the baseline model while maintaining a processing speed of 42 FPS, demonstrating its suitability for real-time safety monitoring.
These contemporary contributions indicate a clear transition from generic datasets toward curated, contextually enriched corpora designed to reflect real-world complexity. In response, the present study introduces two new datasets, PPEDS-1000 and PPEDS-2600, specifically developed to facilitate multi-class PPE detection under varied environmental conditions, including noise, occlusion, and camera distortion.
Synthesis and Research Gaps
Despite the demonstrated capabilities of YOLO-based object detection frameworks, several critical challenges persist in the literature:
A considerable number of studies rely on datasets with limited class diversity, constrained environmental variability, or staged scenarios that may not reflect operational complexity. Although augmentation techniques are frequently employed, few studies offer a systematic analysis or justification of their selection and impact on generalization. The comparative performance of different YOLO variants, particularly in the context of computational constraints (e.g., mobile or embedded systems), remains underexplored. The integration of vision-based detection systems with additional modalities, such as sensor data, environmental parameters, or temporal behavior tracking, has not been extensively investigated.
The present study seeks to address these gaps by making three key contributions:
The development of two high-quality, annotated datasets designed for multi-class PPE detection in diverse environmental conditions, including an augmented variant that simulates real-world visual variance. A detailed comparative evaluation of five YOLOv8 model variants, focusing on precision, recall, mAP metrics, and computational efficiency across deployment scales. A scalable and reproducible implementation framework suitable for deployment in both high-performance cloud environments and low-power mobile or embedded platforms.
Materials and Methods
PPEDS-1000 and PPEDS-2600 Datasets
Data Collection and Labeling
The PPEDS-1000 dataset was curated using a two-phase acquisition strategy to ensure domain relevance and image diversity. In the initial phase, approximately 3,000 images were gathered from publicly available sources, including Google Images and Bing Search, using structured queries such as “personal protective equipment,” “safety vest,” and “helmet with vest.” Images were screened for resolution, duplication, and intellectual property constraints. Low-quality or copyrighted content was excluded.
To enhance authenticity and context alignment, the second phase involved in-field image acquisition by the research team. Workers at construction and industrial sites were photographed under natural lighting, in varying angles, and with diverse postures.
From this combined pool, 1,000 high-resolution images were selected and converted to a standardized JPEG format. Manual annotation was conducted using the Roboflow platform, where bounding boxes and semantic class labels were assigned to each image. All annotations were verified by experts in occupational safety and computer vision to ensure accuracy in both label semantics and object boundaries. Figure 1 illustrates representative samples across the four categories.
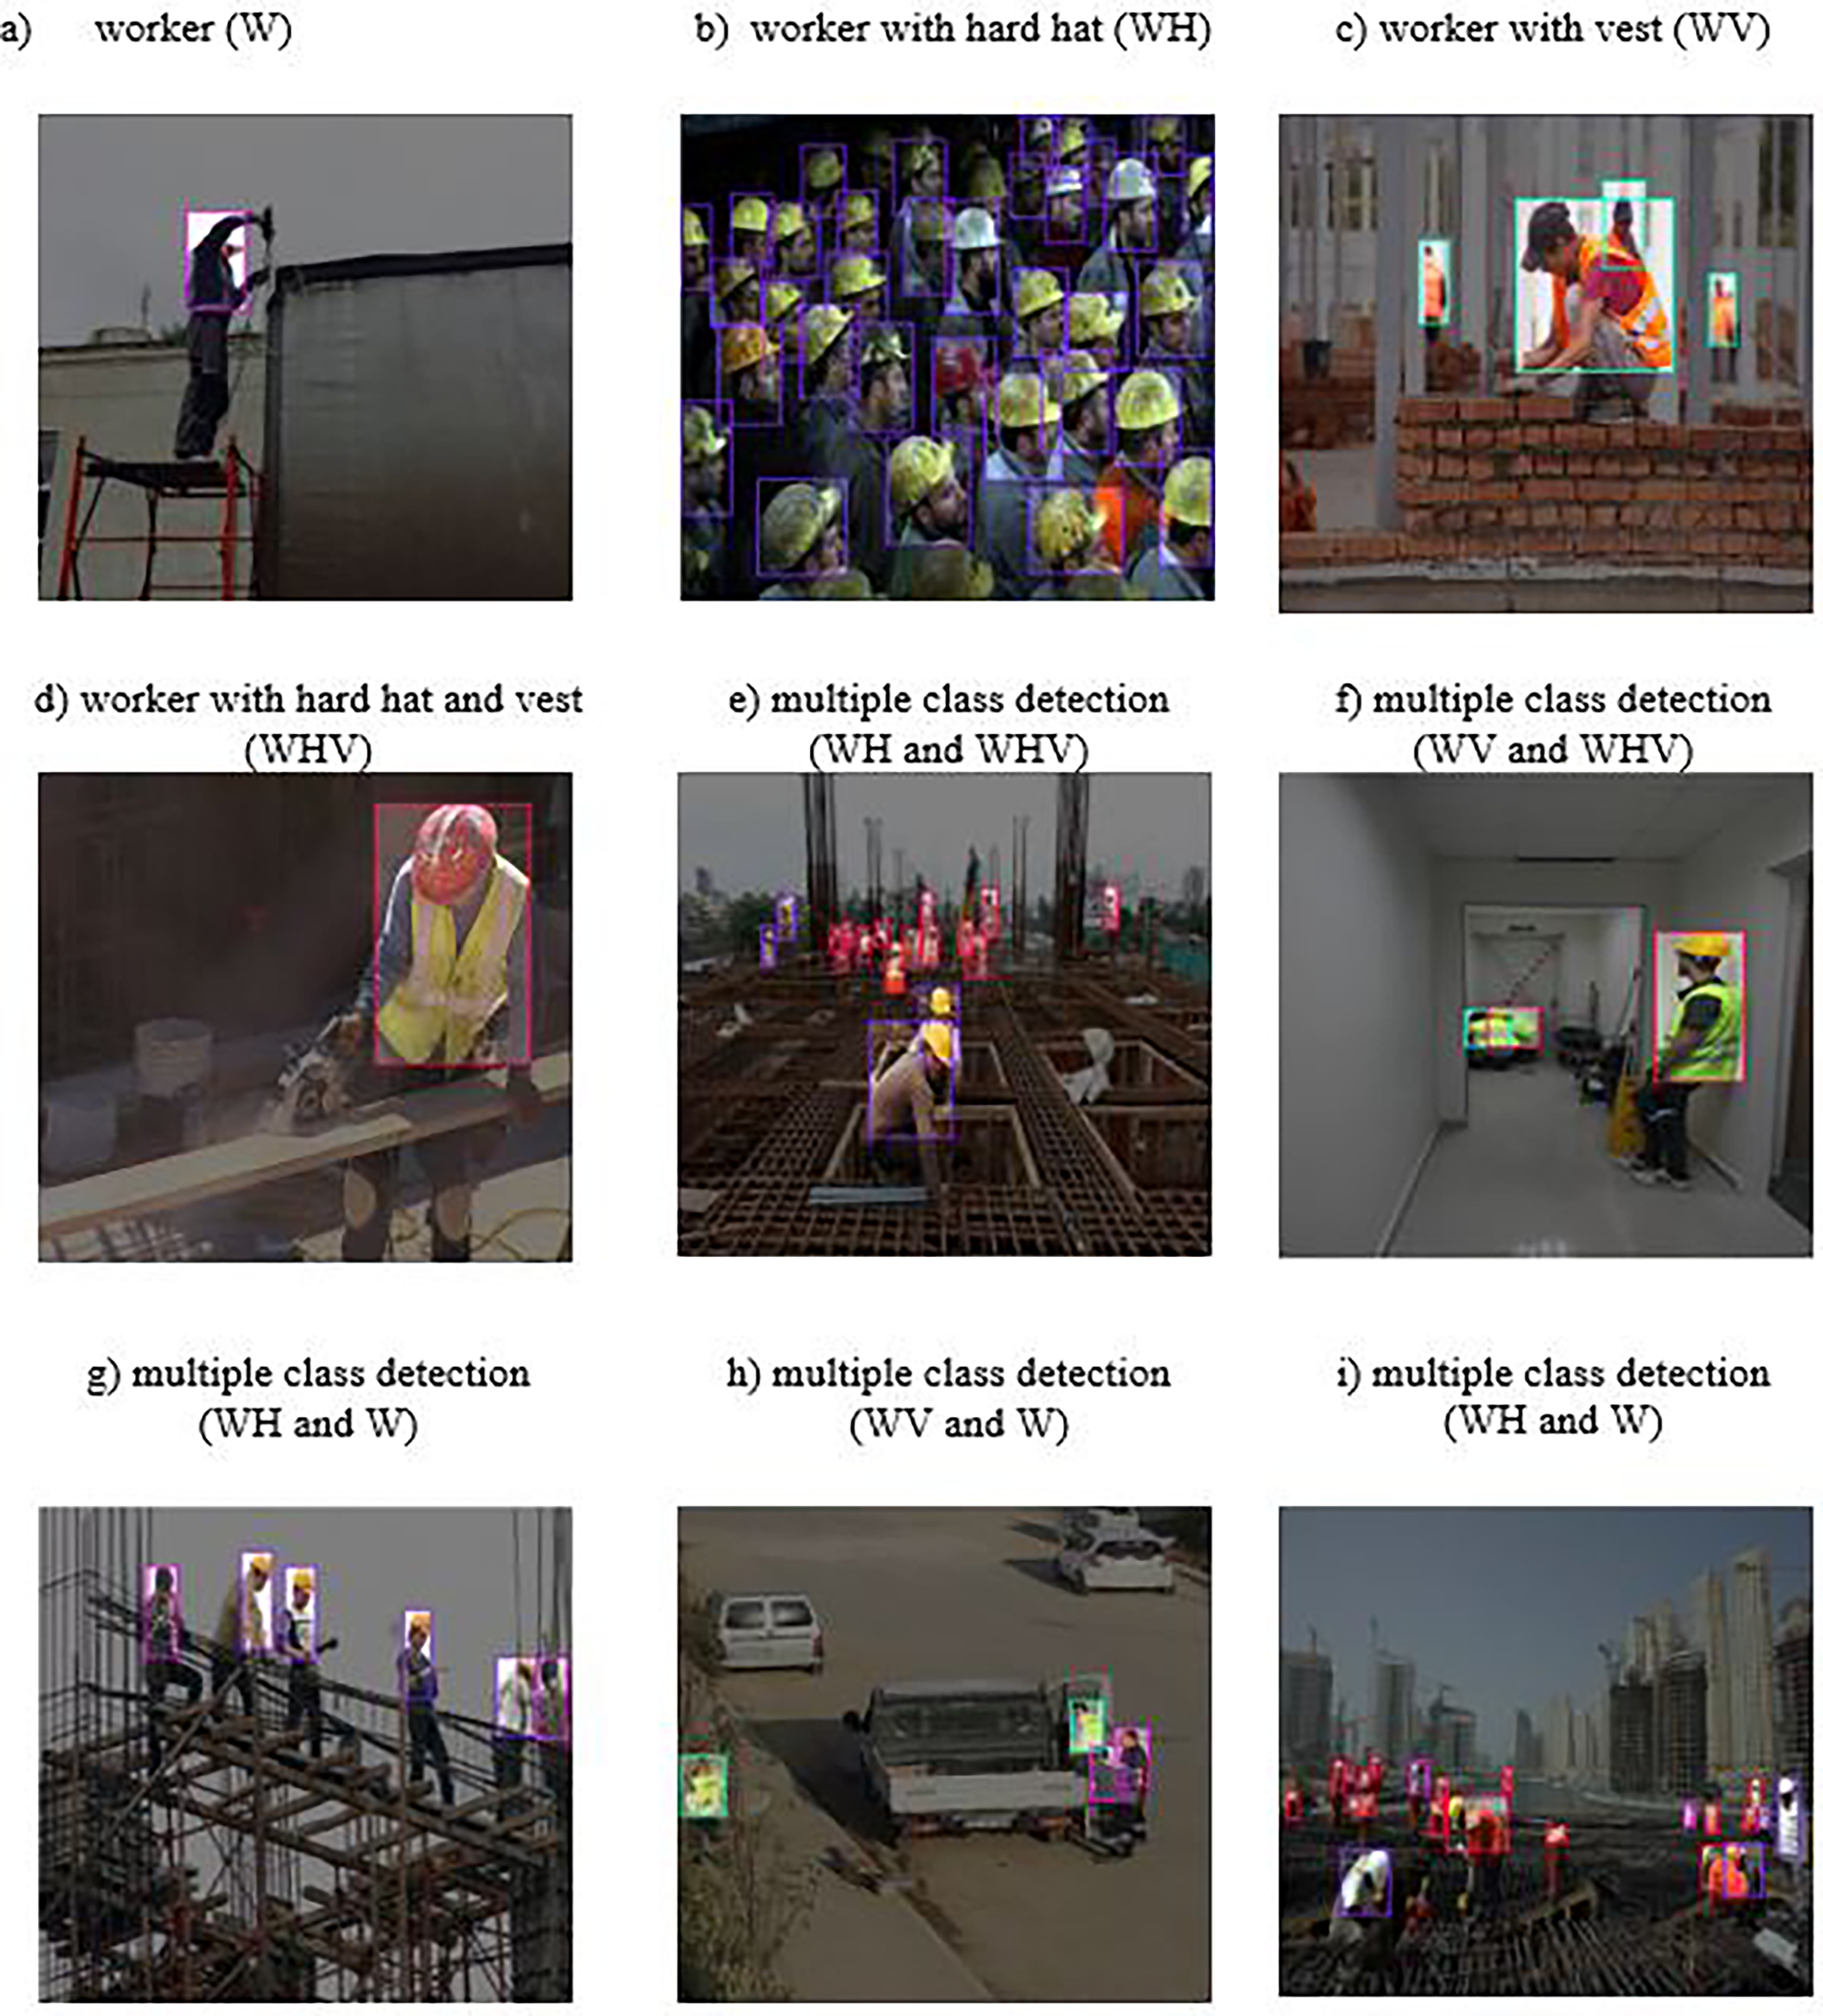
Examples of images in different categories of the PPEDS-1000.
Pre-Processing of PPEDS-1000
Preprocessing is essential to ensure uniformity across the dataset and facilitate optimal model performance. All images were standardized to a resolution of 640 × 640 pixels. Automatic rotation alignment was applied to correct skewed samples. This step ensures consistent input dimensions and aspect ratios, which are critical for convolutional neural network (CNN)-based detectors such as YOLOv8 (Ultralytics, 2023).
Data Augmentation and Creation of PPEDS-2600
To address dataset size constraints and simulate real-world visual variability, data augmentation was applied to the PPEDS-1000 dataset. Augmentation improves generalization, reduces overfitting, and enhances robustness against environmental noise. The augmented dataset, titled PPEDS-2600, contains 2,600 images generated through controlled transformations, as summarized in Table 1.
The Augmentation Techniques Applied.
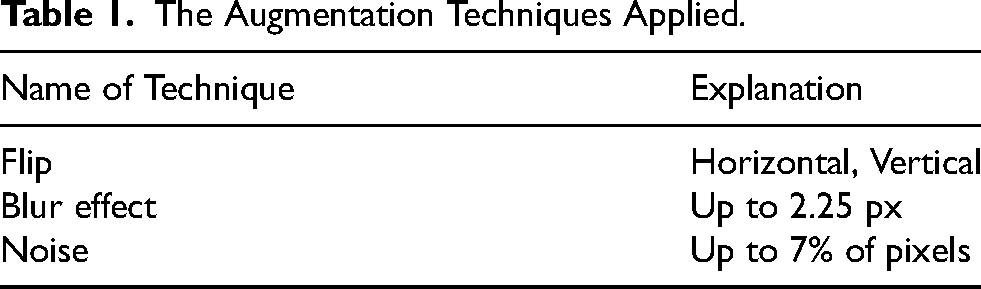
As shown in Table 1, several augmentation techniques were employed, including flipping, blurring, and adding noise. In the flip augmentation stage, horizontal and vertical flips were systematically applied to the dataset. As part of the blur effect operation, we intentionally incorporated up to 2.25 px of blur into the selected image. This extension was used to simulate changes in image sharpness that represent changes in image quality that occur in actual scenes in the real world. Regarding the noise augmentation process, intentional noise was introduced into up to 7% of the pixels in the selected image. This introduces random variations in pixel values, effectively simulating real-world imperfections. After the augmentation techniques were applied, the original dataset was expanded to 2,600 images and named PPEDS-2600.
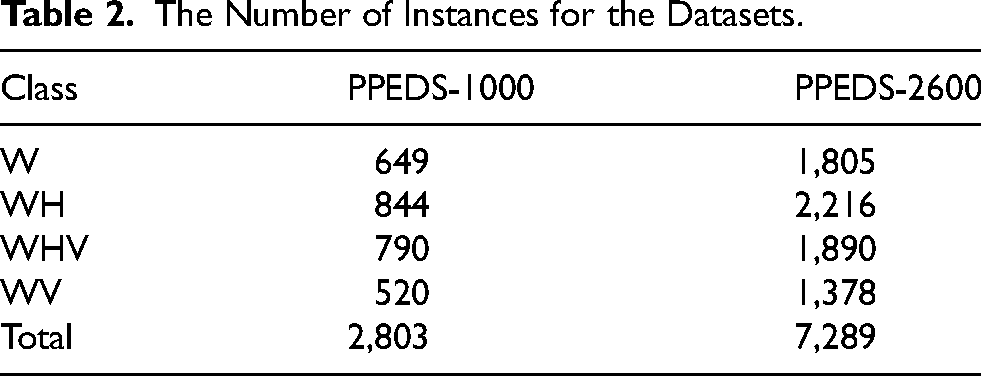
Table 2 shows the number of annotated instances for each PPE class in the PPEDS-1000 and PPEDS-2600 datasets. Each image in the dataset may contain multiple PPE samples. Because a single image may contain multiple workers and PPE items, the total number of instances exceeds the number of images. PPEDS-1000 contains 649 W, 844 WH, 790 WHV, and 520 WV instances. Following augmentation, PPEDS-2600 contains 1,805 W, 2,216 WH, 1,890 WHV, and 1,378 WV instances. This increase in class-specific instances may improve the diversity of the training data and support more robust model learning.
The Number of Instances for the Datasets.
Evaluation Metrics
Precision reflects the proportion of true positive predictions out of all predicted positives, indicating how often the model's positive classifications are correct, as expressed in Equation (1) (Padilla et al., 2020)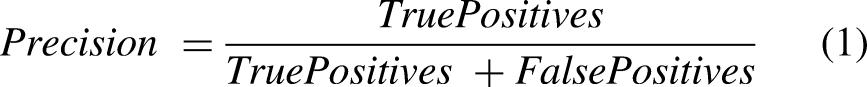
Recall measures the proportion of actual positive cases that are correctly identified. The model can recognize every occurrence of an object in the pictures (Padilla et al., 2020). Recall is calculated using Equation (2).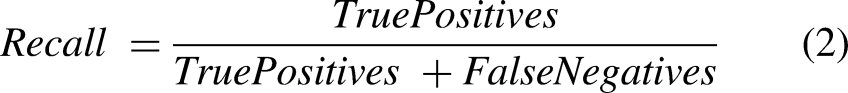
F1 is a metric used in machine learning to evaluate the performance of classification models. It is a combination of precision and recall, used to measure the effectiveness of a model in making predictions or classifications (Ultralytics, 2023). The F1 score is calculated using Equation (3) and ranges from 0 to 1, with 1 being a perfect score and 0 being the worst possible score. A high F1 score indicates that the model is highly accurate, while a low F1 score suggests that the model is not very effective in making predictions.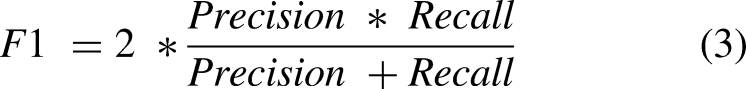
The Mean Average Precision (mAP) metric is a widely used objective method for evaluating object detection models, with its calculation presented in Equation (4). It offers an easy way of comparing various models by considering average accuracy across classes; it uses precision-recall metrics with Intersection of Union (IoU) used as positive identification markers; thus, providing an efficient method for evaluating accuracy when it comes to multiple categories (Padilla et al., 2020).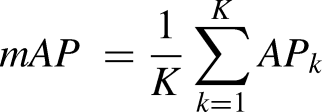
mAP50 measures mean average precision at an IoU threshold of 0.50. In addition, mAP50-95 represents mean average precision averaged across IoU thresholds from 0.50 to 0.95, providing a more comprehensive assessment of model performance (Ultralytics, 2023).
Object Detection, YOLO Architecture and Models
YOLO (You Only Look Once) is a single-stage object detector that performs object localization and classification in a single forward pass, enabling real-time inference (Redmon et al., 2016). Unlike two-stage methods such as Faster R-CNN (Ren et al., 2017), YOLO segments the input image into a grid, within which each cell is responsible for predicting bounding boxes and class probabilities. This unified architecture enables high-speed inference, making it particularly effective for time-sensitive applications (Jiang et al., 2022; Redmon et al., 2016).
Typical Architecture of YOLO Network
YOLO creates an S × S grid out of an input image. A grid cell is responsible for detecting an object if its center falls within its boundaries. Bounding boxes and their corresponding confidence scores are predicted for each grid cell. These confidence scores indicate the degree to which the model believes the box includes an object and the degree to which it believes the predicted box is accurate (Du, 2018). Figure 2 provides a schematic overview of the YOLO network architecture. The model processes the input image through convolutional layers for feature extraction and is subsequently adapted for detection through additional convolutional and fully connected layers. The final prediction layer estimates class probabilities and bounding box coordinates (Redmon et al., 2016).
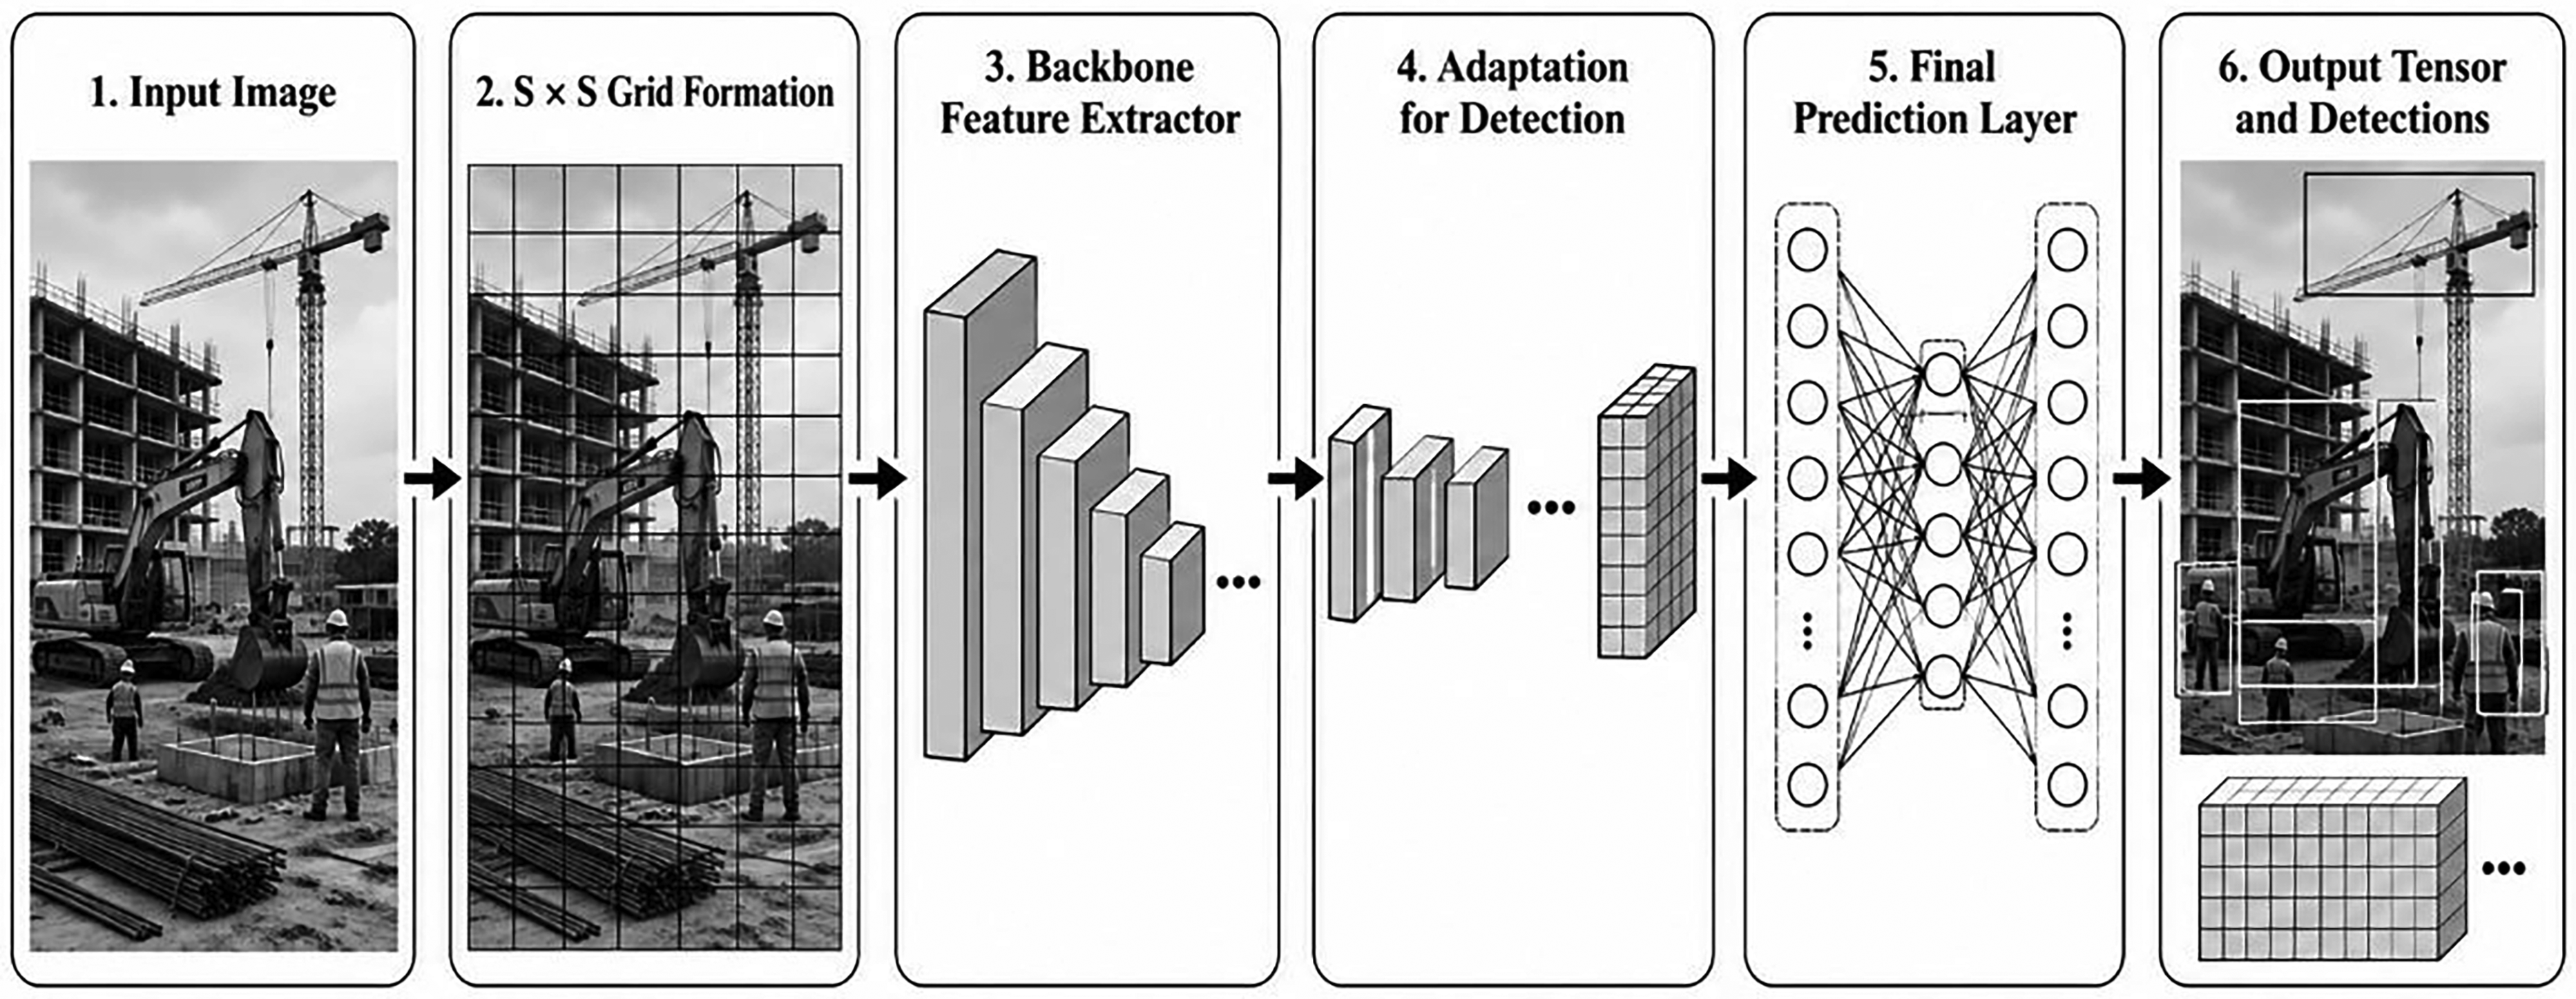
Schematic overview of the YOLO network architecture, based on the framework described by Redmon et al. (2016).
YOLOv8 Models and Hyperparameters
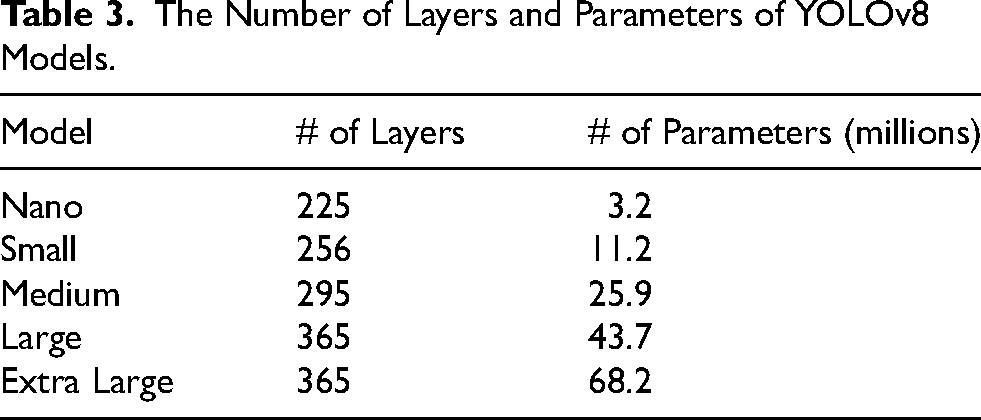
YOLOv8 builds upon earlier YOLO versions by incorporating architectural improvements that enhance its performance across various tasks, including object detection, tracking, and segmentation. Due to its quick, precise, and user-friendly architecture, YOLOv8 is an excellent option for various applications, including object recognition and tracking, instance segmentation, image categorization, and PPE prediction. In Table 3, five models available for YOLOv8 are presented, including nano (n), small (s), medium (m), large (l), and extra-large (x), along with their respective numbers of layers and parameters (Ultralytics, 2023). When given sufficient data, complex models with more layers and parameters can learn more accurately; however, they also require longer computation times for both training and prediction. The n, s, and m models are recommended for mobile use, while the l and x models are suggested for cloud use, as outlined in the YOLO model tutorial provided by the developers.
The Number of Layers and Parameters of YOLOv8 Models.
Hyperparameters are crucial to the overall effectiveness of deep learning models, and training a YOLO model involves numerous hyperparameters, including epoch, batch size, optimizer, and learning rate.
An epoch represents a single complete pass of training data through a model during its training process. Each epoch involves feeding all data sets into the model, updating gradient descent weights accordingly, and moving on to the next one. The number of epochs used to train a model is a crucial hyperparameter that significantly affects its performance. Using too few epochs may lead to underlearning, where the model fails to generalize to new data adequately; conversely, using too many epochs may cause overfitting, where the model retains excessive memory of the training data but struggles to generalize to new data (Yang & Shami, 2020). Thus, selecting an optimal number of epochs is key to achieving optimal model performance.
The learning rate (Lr) is a key parameter that controls how effectively model parameters are tuned during training for deep learning (Ozaki et al., 2017). One way of considering Lr as a “step dimension” of model learning processes. Training machine learning models requires minimizing their loss function, which measures the difference between what the models predict and the actual outcome. The learning rate defines the speed at which model parameters are updated according to this function. An excessive learning rate can result in significant parametric adjustments that overshoot the optimal solution; on the other hand, low learning rates can slow convergence or cause drift. Therefore, finding an optimal learning rate is key to practical model training.
The learning rate is strongly dependent on the optimization algorithm chosen to train a model, such as Stochastic Gradient Descent (SGD), Adam, or RMSProp (Domhan et al., 2015). SGD is an algorithm that updates model parameters after each training sample. Adam, on the other hand, provides adaptive learning rate optimization by automatically adjusting learning rates according to the loss history of the model. The recommended initial value of Lr depends on the optimizer chosen. For SGD, which is the default in YOLO, it should be set to 0.01. In contrast, Adam/RMSProp have recommended initial values between 0.01 and 0.001; for these optimizers, the recommended value would be 0.01.
Experimental Results
A critical aspect of training deep learning models lies in the use of datasets that accurately reflect real-world conditions. To achieve this, it is essential to implement rigorous dataset construction and stratified sampling procedures that minimize bias. In this study, the PPEDS-1000 and PPEDS-2600 datasets were partitioned using an 80/10/10 split, wherein images were randomly allocated to training, validation, and test sets, respectively. This stratified approach supports statistical robustness and enhances model generalizability, thereby reducing the risk of overfitting.
Independent experiments were conducted on both the PPEDS-1000 and PPEDS-2600 datasets utilizing five variants of the YOLOv8 architecture: nano (n), small (s), medium (m), large (l), and extra-large (x). The optimal configuration, applied uniformly across all model variants, comprised the following settings: number of training epochs = {50, 100, 150, 200}, batch size = 16, learning rate = 0.01, and Stochastic Gradient Descent (SGD) as the optimizer.
Table 4 presents the optimal performance outcomes of all YOLOv8 variants for both datasets, evaluated using five standard object detection metrics: Precision (P), Recall (R), F1-score, mAP50, and mAP50-95. Performance assessments were conducted across four personal protective equipment (PPE) categories: W, WH, WV, and WHV.
Best Results of YOLOv8 Models on PPEDS-1000 and PPEDS-2600 Datasets.
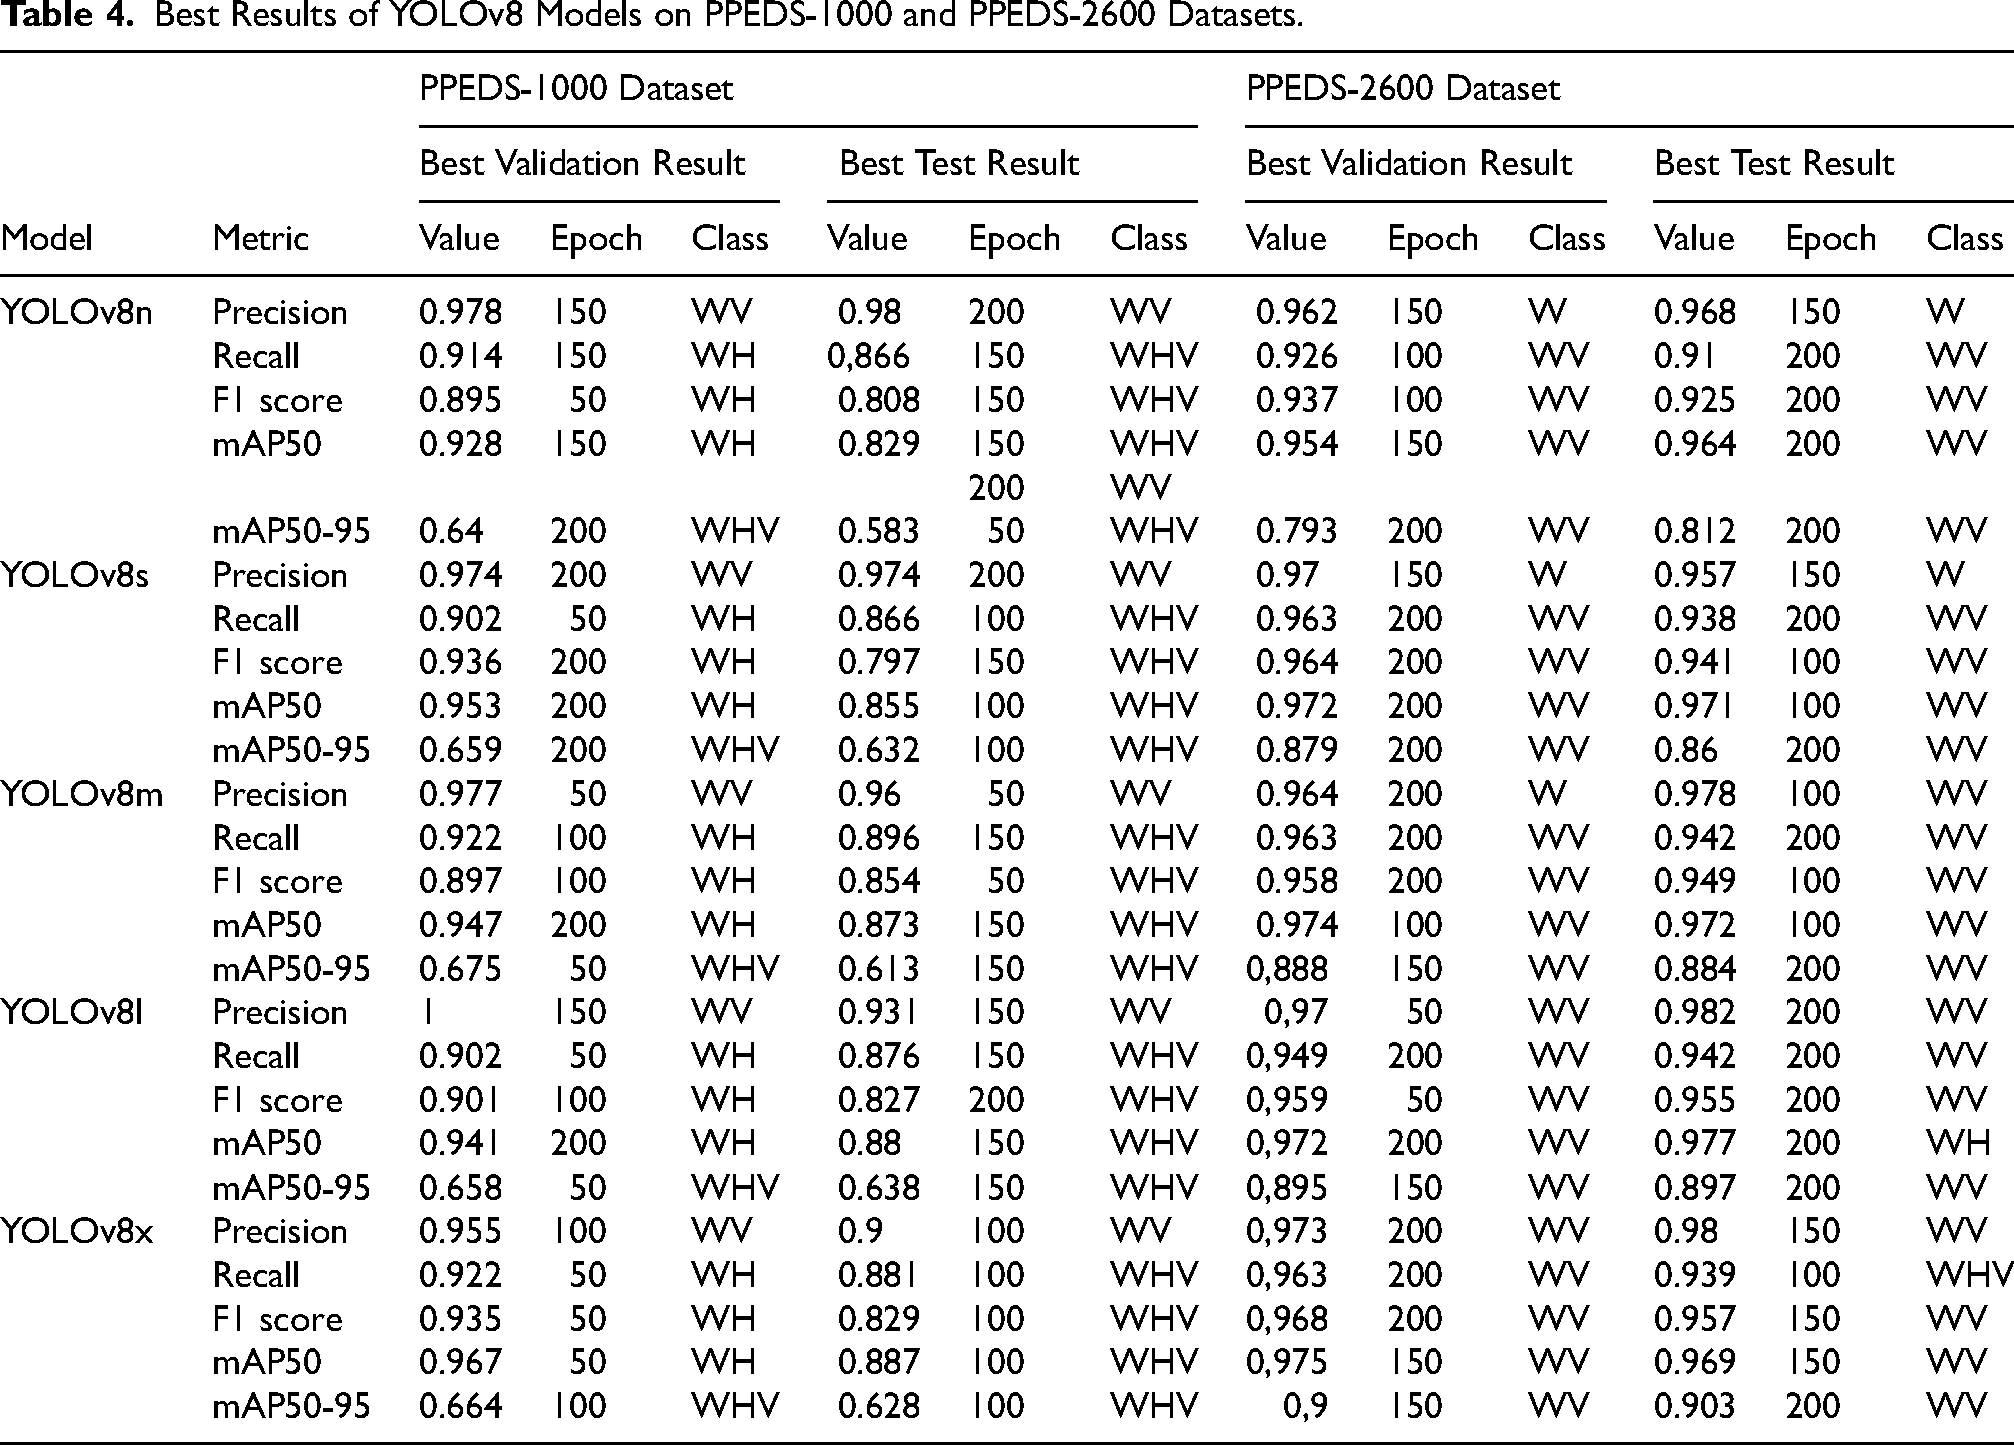
An examination of Table 4 reveals that, for the PPEDS-1000 dataset, increasing the complexity of the YOLOv8 models generally results in improved performance across key evaluation metrics, including Precision (P), Recall (R), mAP50, and mAP50–95, on a per-class basis for each PPE category. These metrics have been widely employed in the literature as standard benchmarks for object detection performance (Ultralytics, 2023). However, relying solely on the Precision metric to evaluate the percentage of true positives among all positive predictions may yield a limited perspective of model effectiveness. Therefore, a more comprehensive evaluation is afforded by the use of mAP50 and mAP50–95, which offer a nuanced view of detection accuracy across multiple Intersection over Union (IoU) thresholds.
The experiments conducted using the PPEDS-1000 and PPEDS-2600 datasets involved independent evaluations of model performance based on validation and test sets. The results of the analysis are as follows:
YOLOv8-nano model: For the PPEDS-1000 dataset, the optimal validation performance based on mAP50 was observed in the WH class at 150 epochs, achieving 92.8%. Test performance peaked at 82.9% in the WHV class at 150 epochs and in the WV class at 200 epochs. In the case of the PPEDS-2600 dataset, the highest validation performance was achieved at 95.4% at 150 epochs in the WV class, while the best test result was 96.4% at 200 epochs, also in the WV class. YOLOv8-small model: Using the PPEDS-1000 dataset, the highest validation mAP50 (95.3%) was attained in the WH class at 200 epochs, while the best test performance (85.5%) occurred in the WHV class at 100 epochs. For the PPEDS-2600 dataset, the optimal validation performance was 97.2% in the WV class at 200 epochs, and the highest test result was 97.1%, also in the WV class at 100 epochs. YOLOv8-medium model: On the PPEDS-1000 dataset, the best validation outcome was 94.7% in the WH class at 200 epochs, and the highest test value was 87.3% in the WHV class at 150 epochs. For the PPEDS-2600 dataset, the top validation and test performances both occurred in the WV class, with values of 97.4% and 97.2%, respectively, at 100 epochs. YOLOv8-large model: When trained on PPEDS-1000, the model achieved its highest validation result (94.1%) in the WH class at 200 epochs and its top test score (88%) in the WHV class at 150 epochs. On the PPEDS-2600 dataset, the best validation performance was 97.2% in the WV class at 200 epochs, whereas the highest test performance (97.7%) was recorded in the WH class, also at 200 epochs. YOLOv8-extra-large model: For the PPEDS-1000 dataset, the best validation result was 96.7% in the WH class at just 50 epochs, while the highest test performance (88.7%) was obtained in the WHV class at 100 epochs. On the PPEDS-2600 dataset, the model achieved its peak validation score of 97.5% in the WV class at 150 epochs, with a corresponding test performance of 96.9% at the same epoch and class.
These results collectively suggest that model complexity, when paired with sufficient training data and practical hyperparameter tuning, has a positive influence on object detection performance, particularly when assessed using robust and comprehensive metrics such as mAP50 and mAP50–95.
Figure 3 illustrates that, when considering all YOLOv8 models, the YOLOv8l model achieved the highest validation value in training with the PPEDS-1000 dataset according to the Precision metric. This was achieved at 150 epochs, with a performance of 100%. In contrast, the YOLOv8n model achieved the highest test value at 200 epochs, with a performance of 98% in the WV class. During the training phase with the PPEDS-2600 dataset, the YOLOv8x model achieved the highest validation value, yielding a performance of 97.3%. Similarly, the YOLOv8l model exhibited the highest test value, attaining 98.2% performance at 200 epochs.
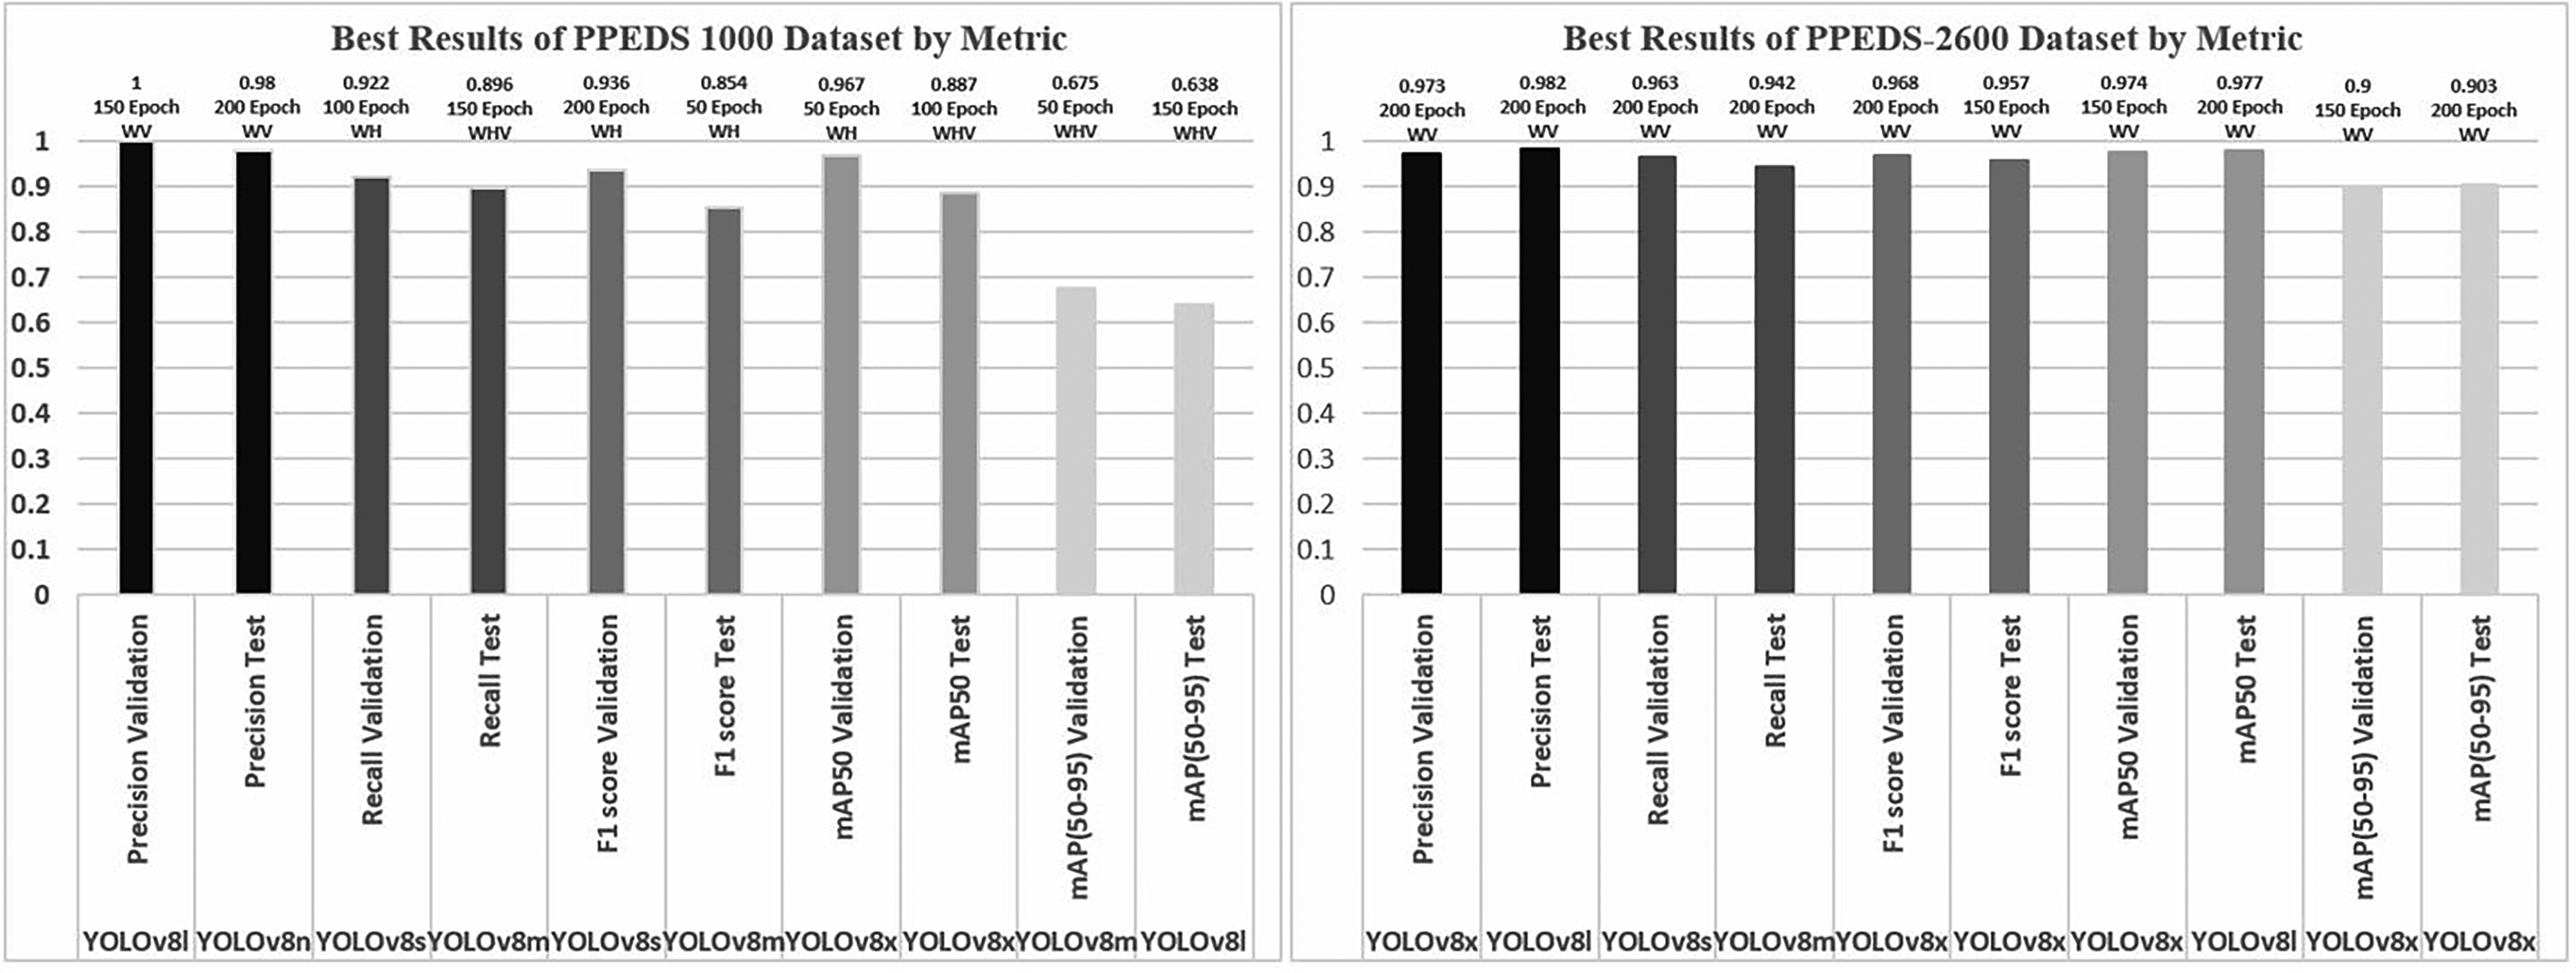
Best results of PPEDS-1000 and PPEDS-2600 datasets by metric.
According to the recall metric, in the training with the PPEDS-1000 dataset, the best validation value was achieved with the YOLOv8s model at 100 epochs with a performance of 92.2% in the WH class, and the best test value was achieved with the YOLOv8m model at 150 epochs with a performance of 89.6% in the WHV class. In the training with the PPEDS-2600 dataset, the YOLOv8s model achieved the best validation value, with a performance of 96.3%. The YOLOv8m model achieved the best test value at 200 epochs, with a performance of 94.2% in the WV class.
The F1 score metric indicates that the YOLOv8s model achieved the highest validation value during training with the PPEDS-1000 dataset, with a performance of 93.6% at 200 epochs. The YOLOv8m model achieved the highest test value at 50 epochs, with a performance of 85.4% in the WH class. In the training phase with the PPEDS-2600 dataset, the highest validation F1 score was achieved by the YOLOv8x model at 200 epochs, with a performance of 96.8% in the WV class. The highest test F1 score was achieved by YOLOv8x model at 150 epochs, with a performance of 95.7%, also in the WV class.
By the most frequently employed metric in the literature, mAP50, the optimal validation value was attained in the training with the PPEDS-1000 dataset at 50 epochs in the WH class, with a performance of 96.7%, and the optimal test value was achieved at 100 epochs in the WHV class with a performance of 88.7% in the YOLOv8x model. In the training with the PPEDS-2600 dataset, the YOLOv8x model achieved the best validation value at 150 epochs, with a performance of 97.4%. Meanwhile, the YOLOv8l model achieved the best test value at 200 epochs, with a performance of 97.7% in the WV class.
According to the mAP50-95 metric, the optimal validation value was achieved in the training phase using the PPEDS-1000 dataset with the YOLOv8m model at 50 epochs, resulting in a performance of 67.5%. Similarly, the optimal test value was achieved with the YOLOv8l model at 150 epochs, exhibiting a performance of 63.8% in the WHV class. During the training phase with the PPEDS-2600 dataset, the YOLOv8x model achieved the highest validation accuracy of 90% at 150 epochs and the highest test accuracy of 90.3% at 200 epochs in the WV class.
Figure 4 presents the validation and test results for all categories based on metrics for the training conducted with YOLOv8 models using the PPEDS-1000 and PPEDS-2600 datasets.
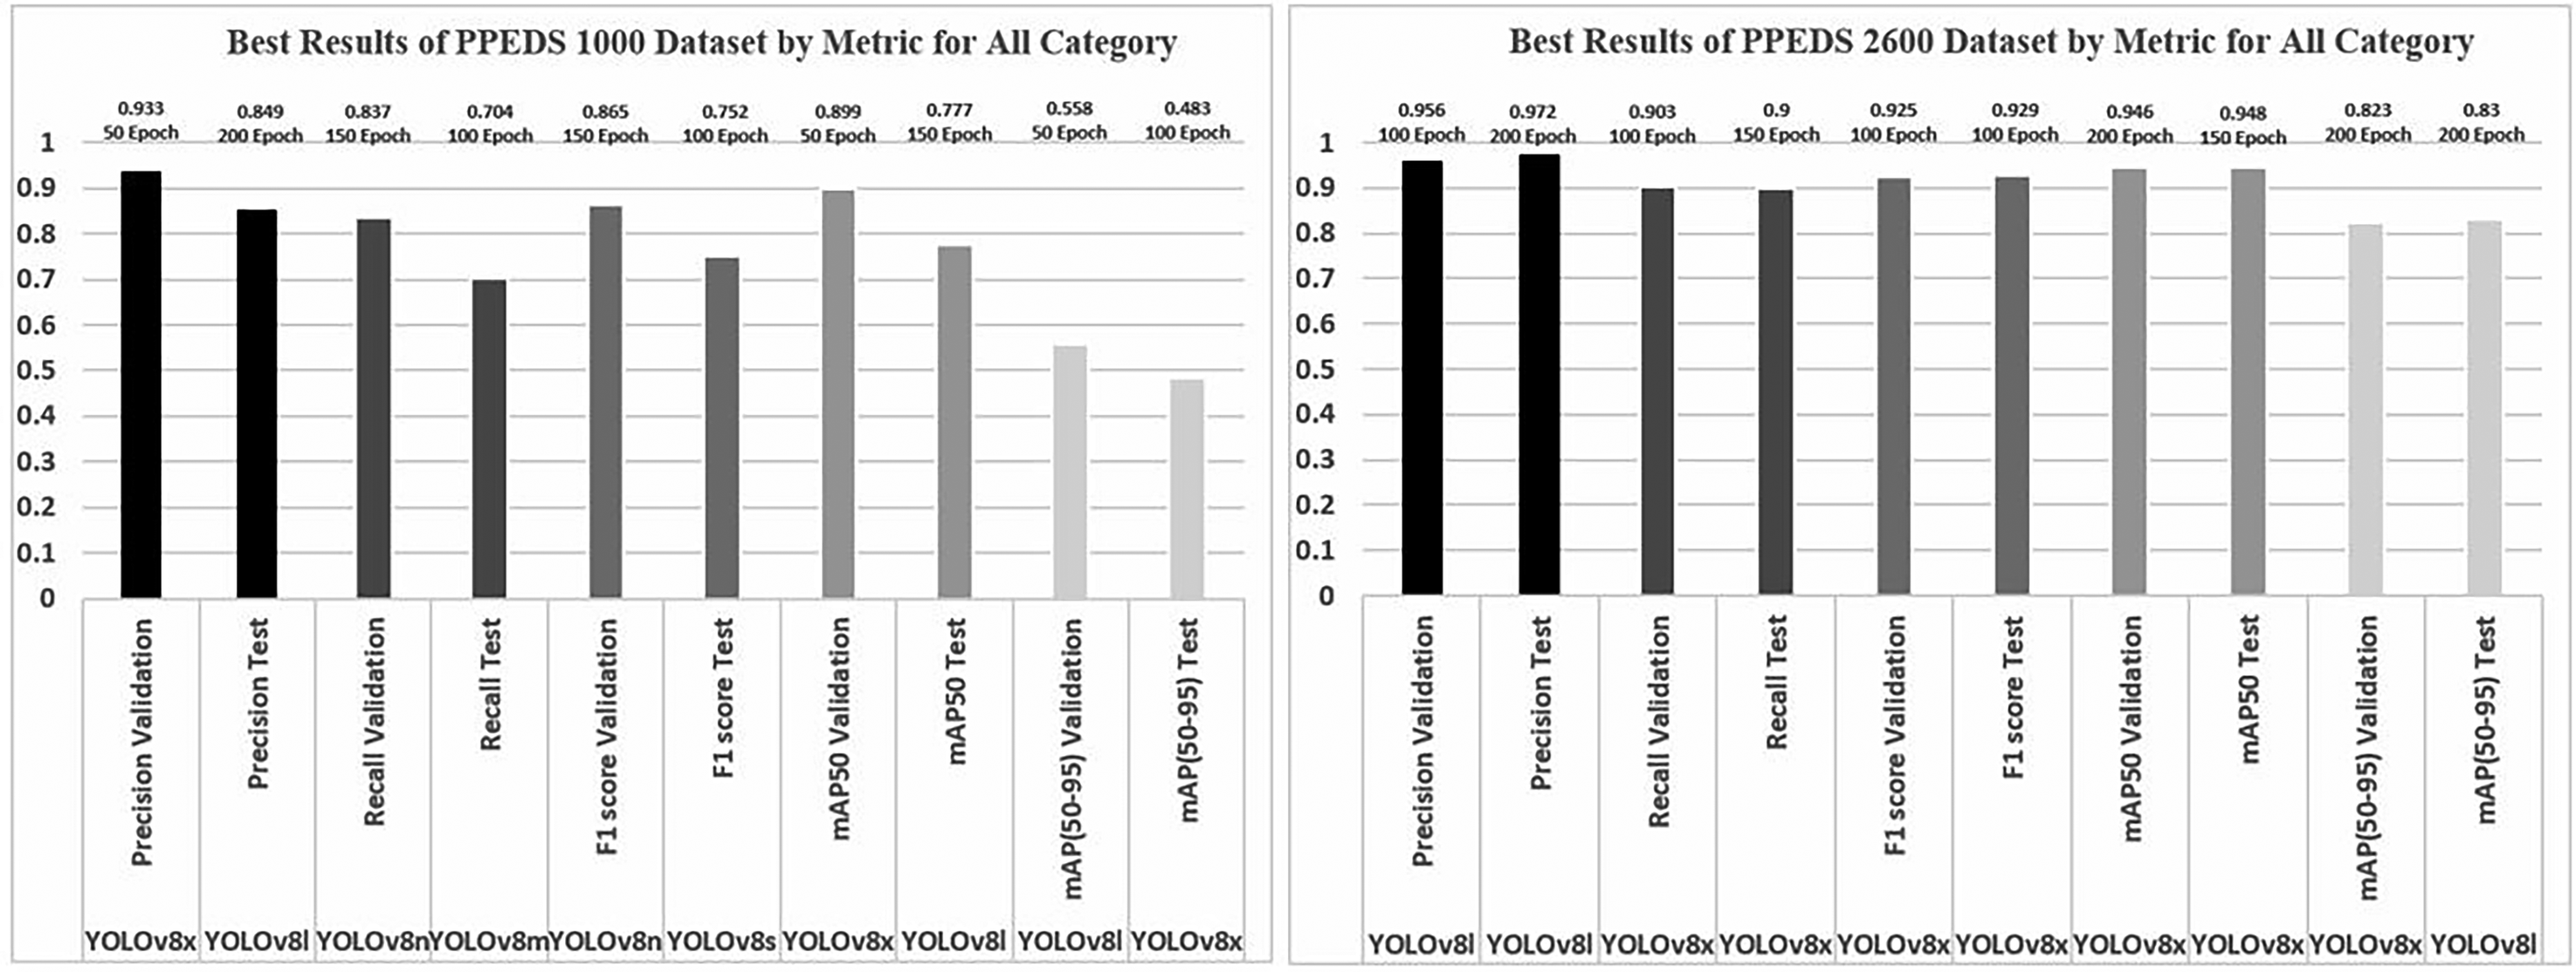
Best results of PPEDS-1000 and PPEDS-2600 datasets for all (PPE) categories.
A comparison of the YOLOv8 nano, small, medium, large, and extra-large models, based on the Precision metric, revealed that the YOLOv8x model achieved the highest validation value during training with the PPEDS-1000 dataset at 50 epochs, with a performance of 93.3%. Similarly, the YOLOv8l model demonstrated the highest test value at 200 epochs, with a performance of 84.9%. During the training phase with the PPEDS-2600 dataset, the highest validation accuracy was 95.6% at 100 epochs, while the highest test accuracy was achieved at 200 epochs, reaching 97.2%.
Regarding the recall metric, the YOLOv8n model exhibited the most optimal validation value during training with the PPEDS-1000 dataset at 150 epochs, achieving a performance of 83.7%. Conversely, the YOLOv8m model demonstrated the most optimal test value in the training with the PPEDS-1000 dataset at 100 epochs, with a performance of 70.4%. In the training phase with the PPEDS-2600 dataset, the YOLOv8x model exhibited the highest validation value (90.3%) at 100 epochs and the highest test value (90%) at 150 epochs.
The F1 score metric indicates that the YOLOv8n model achieved the highest validation value in the training phase with the PPEDS-1000 dataset, with a performance of 86.5% at 150 epochs. The YOLOv8s model demonstrated the highest test value at 100 epochs, with a performance of 75.2%. In the training with the PPEDS-2600 dataset, the best validation value was 92.5% at 100 epochs, and the best test value was 92.9% at 150 epochs with the YOLOv8x model.
According to the most frequently employed metric in the literature, mAP50, the optimal validation value was achieved by the YOLOv8x model after training with the PPEDS-1000 dataset for 50 epochs, yielding a performance of 89.9%. Conversely, the optimal test value was achieved in the YOLOv8l model following training with the PPEDS-1000 dataset at 150 epochs, with a performance of 77.7%. In the training phase with the PPEDS-2600 dataset, the YOLOv8x model exhibited the highest validation value (94.6%) at 200 epochs and the highest test value (94.8%) at 150 epochs.
The mAP50-95 metric indicates that the YOLOv8l model achieved the highest validation value in the training with the PPEDS-1000 dataset at 50 epochs, with a performance of 55.8%. Conversely, the YOLOv8x model demonstrated the highest test value at 100 epochs, with a performance of 48.3%. During the training phase with the PPEDS-2600 dataset, the YOLOv8x model achieved the highest validation accuracy, reaching 82.3%. Additionally, the YOLOv8l model demonstrated the most optimal test value at 200 epochs, achieving an accuracy of 83%.
Upon evaluating the test results based on the specified metrics, it was observed that the WHV class yielded the most optimal results for the PPEDS-1000 dataset. Conversely, the classification performance for the PPEDS-2600 dataset demonstrated the highest degree of precision on WV images. In consideration of additional metrics in these studies, it was determined that the work did not present any issues related to overfitting or underfitting. During the training and testing phases, it was observed that performance decreased as the number of epochs exceeded 200. Consequently, the training was limited to 200 epochs.
The training conducted with two different datasets based on the most preferred metric in the literature, mAP50, yielded optimal results with the YOLOv8l model for the PPEDS-1000 dataset (performance value: 0.777 at 150 epochs) and with the YOLOv8x model for the PPEDS-2600 dataset (performance value: 0.948 at 150 epochs). As the dataset expanded, the training performance rate increased by approximately 22%. Consequently, as the number of samples increased during training with the PPEDS-1000 and PPEDS-2600 datasets, the performance values improved, thereby enhancing the consistency of the training. This suggests that the expansion of the datasets enhances the overall performance and reliability of the model.
Conclusion and Future Work
This study presents a comprehensive evaluation of the YOLOv8 deep learning architecture for detecting Personal Protective Equipment (PPE) in occupational settings, where accurate and timely identification of safety compliance is crucial for preventing work-related accidents and illnesses. Given the significant economic and human costs associated with inadequate PPE use, the primary goal was to enhance automated visual monitoring systems by leveraging state-of-the-art object detection models.
To facilitate this investigation, a new domain-specific dataset, PPEDS-1000, was constructed and annotated to encompass four PPE usage categories: W, WH, WV, and WHV. To improve the robustness and generalizability of the model evaluation, an expanded and augmented dataset, PPEDS-2600, was developed based on PPEDS-1000. The datasets were used to train five YOLOv8 model variants, ranging from nano to extra-large, and performance was assessed across key evaluation metrics: Precision, Recall, F1-score, mAP50, and mAP50-95.
Experimental results showed an overall mAP50 of 77.7% on the PPEDS-1000 dataset. Following systematic dataset augmentation and expansion, the overall mAP50 increased to 94.8% on the PPEDS-2600 dataset. This improvement underscores the importance of dataset scale and diversity in enhancing multi-class PPE detection accuracy and supporting real-world applicability.
Nonetheless, certain limitations warrant further investigation. While stratified sampling was employed to promote dataset balance, potential biases remain, particularly in terms of class distribution and environmental uniformity, which may affect model generalizability in real-world deployments. Additionally, higher-complexity YOLOv8 variants (i.e., ‘l’ and ‘x’) entail significant computational requirements, which may hinder deployment on edge devices or mobile platforms without further optimization through techniques such as model compression or inference acceleration. Furthermore, the impact of real-world factors such as occlusion, low lighting, and diverse camera angles was not extensively evaluated and should be addressed in future validation studies.
The novelty of this research lies in the development of a specialized PPE dataset and the systematic evaluation of the latest YOLOv8 architecture across multiple scales. Unlike prior works that typically utilize pre-existing, general-purpose datasets or older object detection models, this study demonstrates the effectiveness of cutting-edge real-time models in an occupational health and safety context.
Future work will focus on: (1) extending the dataset to include additional PPE categories, such as gloves and boots, to support more granular classification; (2) implementing domain adaptation strategies to improve cross-environment performance; (3) optimizing YOLOv8 models for real-time deployment in edge and embedded systems; and (4) contributing to the establishment of standardized benchmarks for PPE detection to enable consistent comparisons across future studies.
In summary, this research confirms that YOLOv8 models are highly effective for PPE detection tasks and hold promise for advancing intelligent occupational safety monitoring systems. The findings serve as a foundation for future developments in this emerging area of applied computer vision.
Footnotes
Funding
The authors received no financial support for the research, authorship, and/or publication of this article.
Declaration of Conflicting Interests
The authors declared no potential conflicts of interest with respect to the research, authorship, and/or publication of this article.
Data Availability
The data that support the findings of this study are available from the corresponding author upon reasonable request.