
Abstract
The notion of a U shape in happiness—that well-being is highest for people in their 20s, decreases to its nadir in midlife, and then rises into old age—has captured the attention of the media, which often cite it as evidence for a midlife crisis. We argue that support for the purported U shape is not as robust and generalizable as is often assumed and present our case with the following arguments: (a) Cross-sectional studies are inadequate for drawing conclusions about within-person change in happiness across the life span; (b) cross-sectional evidence with respect to the ubiquity and robustness of the U shape in general levels of happiness and life satisfaction is mixed; (c) longitudinal support for the U shape in happiness and life satisfaction is also mixed; (d) longitudinal research on subjective indicators of well-being other than general levels of happiness and life satisfaction challenges the U shape; (e) when asked to reflect on their lives, older adults tend to recall midlife as one of the more positive periods; and (f) a focus on a single trajectory of well-being is of limited scientific and applied value because it obscures the diversity in pathways throughout life as well as its sources. Understanding happiness across the life course and moving the research field forward require a multidisciplinary, collaborative approach.
In 2010, an article in The Economist (“The U-Bend of Life,” 2010) proclaimed that happiness across the life course follows a “U-bend” that is highest in youth, declining to its nadir in midlife, with an upswing thereafter. This claim has been echoed in media reports (e.g., Ingraham, 2017) and in a recent book entitled The Happiness Curve: Why Life Gets Better After 50 (Rauch, 2018). The idea of a U shape in happiness (also known as the U curve) emerged largely out of cross-sectional studies using single-item measures of well-being (e.g., happiness, life satisfaction) in large samples from diverse countries around the world (Blanchflower & Oswald, 2008; Stone, Schwartz, Broderick, & Deaton, 2010). Economist Andrew Oswald, one of the primary proponents of the U-shape argument, states: “I view this as a first-order discovery about human beings that will outlive us by hundreds of years” (Rauch, 2018, p. 52).
The purported U shape in happiness is interpreted by a number of economists as evidence that, as people move through the life course, they will experience a midlife trough, sometimes labeled a midlife crisis. Many laypeople also assume that crisis in midlife is common. An Internet survey of Swiss respondents, for example, found that 92% believed in the existence of a midlife crisis and 71% knew someone who had experienced or was experiencing one (Freund & Ritter, 2009), which is similar to the beliefs of adults in the United States (Lachman, Lewkowicz, Marcus, & Peng, 1994; Wethington, 2000). The pervasiveness of a midlife crisis, however, is challenged by data from psychological studies (Baird, Lucas, & Donnellan, 2010; Galambos, Fang, Krahn, Johnson, & Lachman, 2015; Mroczek & Spiro, 2005; Whitbourne, 2010). The disciplinary difference between economists and psychologists regarding the existence of a midlife crisis has been highlighted in the media (Suddath, 2017) and in peer-reviewed articles (Easterlin, 2006; Frijters & Beatton, 2012; Headey, Muffels, & Wagner, 2010; Ulloa, Møller, & Sousa-Poza, 2013). When recently interviewed, economist David Blanchflower commented: “ ‘How hard is that to see?’ when psychologists say they can’t find a U?” (Rauch, 2018, p. 66).
We believe that a more systematic discussion of the conceptual and methodological issues underlying disagreement about the U shape in happiness is required and present evidence that the U shape is not as robust or generalizable as often argued. Our goal is to move beyond the disciplinary debate around whether mean levels of happiness are either higher or lower in midlife than in other age periods. Instead, we should focus more on variability within and across people, highlighting the importance of questions about when and why some people are unhappy and what we can do about it. To start, we briefly review our understanding of happiness in the context of the empirical literature.
Conceptualizing and Measuring Happiness
The meaning of happiness has challenged social scientists for decades and has led to differing definitions and operationalizations. In a lay sense, happiness refers to the state of feeling or showing pleasure or contentment and is often used interchangeably with well-being (Mroczek & Kolarz, 1998; Oishi, 2010). In a long line of scientific writings, Diener and colleagues have framed happiness in terms of subjective well-being (SWB). In their view, SWB consists of multiple separable components, including life satisfaction (a cognitive evaluation of the quality of one’s life), positive hedonic affect (the subjective experience and accumulation over time of positive emotions such as feeling happy), and low levels of negative affect such as sadness (Diener, Kahneman, Tov, & Arora, 2010; Diener, Suh, Lucas, & Smith, 1999). As such, life evaluations and a preponderance of positive over negative affect (or affect balance) are considered key components of SWB. Satisfaction in domains such as marriage and work and the specific variables of depression, anxiety, and anger (indicators of negative affect) and self-esteem and optimism have been mentioned as additional subjective indicators of well-being (Diener & Suh, 1999; Diener et al., 1999).
In contrast to the SWB framework, the model of well-being proposed by Ryff (1989) includes six factors: purpose in life, self-acceptance, autonomy, personal growth, environmental mastery, and positive relationships. These dimensions together reflect eudaimonic well-being, an alternative to the SWB framework that taps into the meaningfulness of life (Ryff, 2014). Although eudaimonic well-being has become an additional focus in happiness studies (e.g., Dolan, Kudrna, & Stone, 2017; Steptoe, Deaton, & Stone, 2015), most investigations of the U shape have taken a hedonic approach and measured life satisfaction and/or positive affect (i.e., happiness).
Three single-item hedonic measures have been commonly used in investigations of the U curve. Life satisfaction, a cognitive judgment, is typically assessed by asking a question such as “All things considered, how satisfied are you with your life as a whole these days?” Responses range from very dissatisfied to very satisfied. Cantril’s ladder (Cantril, 1965) is also a cognitive evaluation of life that determines life satisfaction by asking participants the following question: “On which step of the ladder would you say you personally stand at this time?” Responses range from 0 (worst possible life) to 10 (best possible life). The affective dimension of SWB is often assessed with a happiness item such as “Taking all things together, would you say you are” very happy to not at all happy? Such items are considered valid global indices of well-being that assess how people judge or feel they are doing in general (Diener, Inglehart, & Tay, 2013; Oishi, 2010). The five-item Satisfaction With Life Scale (SWLS; Diener, Emmons, Larsen, & Griffin, 1985) has been used occasionally, as have measures of immediate or recent experiences (e.g., happiness/stress/worry experienced yesterday; Oishi, 2010; Steptoe et al., 2015).
Most U-shape studies explicitly or implicitly use measures associated with the SWB perspective, that is, cognitive evaluations (life satisfaction) and positive affect (happiness); hence, we primarily discuss SWB in this article. Furthermore, we draw mostly on research using global indices of these dimensions (life satisfaction and happiness in general) rather than domain-specific (e.g., job satisfaction) or experiential measures (e.g., happiness felt yesterday) because of their widespread usage in large-survey data sets examining the U curve.
Challenging the U Shape
The U shape in happiness relies on finding that young and old adults are happier than middle-aged adults. If the U shape applies, then there should be a downward slide from the teens or early 20s into the 40s and 50s and a climb back up after the 50s (Galambos et al., 2015; Piper, 2015). Well-being in the transition to adulthood (teens through 20s), however, is characterized by diverse trajectories, with some young people thriving during this period and others floundering as they attempt to meet normative challenges (e.g., finishing education, finding work, finding a romantic partner; Krahn, Howard, & Galambos, 2015; Schulenberg, Bryant, & O’Malley, 2004). Some research shows depressive symptoms—indicative of negative affect—decrease on average from the late teens into the 20s and 30s, although life circumstances and histories contribute to diversity in these trajectories (Galambos, Barker, & Krahn, 2006; Merikangas et al., 2003). Research specifically on within-person change in general levels of happiness between the teens and midlife is in short supply, but it is not clear that young people are happier than middle-aged adults as suggested by the U curve (Galambos et al., 2015).
When people reach middle age they may review their earlier goals in the context of their achievements. For some, the realization of unmet aspirations or the perceived failure to have accomplished goals set as young adults could lead to a midlife low (Freund & Ritter, 2009; Schwandt, 2016). Considering the presumed upward climb after midlife, socioemotional selectivity theory suggests older adults’ awareness of a diminishing future leads to their preference for positive emotions and experiences relative to younger adults, whose future timelines are longer (Carstensen, Isaacowitz, & Charles, 1999). Indeed, a meta-analysis of 100 studies found a reliable positivity effect in which older adults, more so than younger adults, naturally process (attend to and remember) positive more than negative information (Reed, Chan, & Mikels, 2014). Also consistent with the idea of increasing happiness after midlife are findings that older adults often show more positive affect than middle-aged adults at least until very late in life (e.g., Carstensen et al., 2011; Mroczek & Kolarz, 1998). These effects, however, tend to be relatively small and vary across dimensions of well-being (Lachman, 2015; Stone et al., 2010; Ulloa et al., 2013).
We believe the conclusion that happiness declines from late adolescence to midlife (the first half of the U shape) is premature, and possibly wrong, and although there is better evidence of a rise in happiness after midlife, it is scientifically limiting to presuppose that a single trajectory characterizes the development of well-being across the life course. We present our case with the following arguments: (a) Cross-sectional studies are inadequate for drawing conclusions about within-person change in happiness; (b) cross-sectional evidence with respect to the ubiquity and robustness of the U shape is mixed; (c) longitudinal support for the U shape is also mixed; (d) longitudinal research on subjective indicators of well-being other than general levels of happiness and life satisfaction challenges the U shape; (e) when asked to reflect on their lives, middle-aged to older adults tend to recall midlife as one of the more positive periods; and (f) a focus on mean-level happiness (i.e., the U shape) obscures the more important question of diversity in well-being and its sources across the life span.
Recent Cross-Sectional and Longitudinal Studies Examining the U Shape
To inform our discussion, we conducted a literature search of relevant articles published from January 2013 to June 2019. The search was restricted to 2013 and later because of an earlier literature review that cited articles on the U shape published through 2012 (Ulloa et al., 2013). The Web of Science Core Collection and MEDLINE were searched with these terms: (well-being OR life satisfaction OR happiness) AND age AND u-shape. This search generated 64 articles. We read the abstracts (and the articles when the abstracts were not informative enough) to determine whether the study met the following criteria: (a) published in a peer-reviewed journal in English; (b) tested for age differences (cross-sectional) or changes with age (longitudinal) in global measures of life satisfaction or happiness; and (c) spanned the teens or 20s into the 60s (cross-sectional studies) or had at least two times of measurement and spanned the periods of young adulthood to midlife, midlife to late life, or young adulthood to midlife to late life (longitudinal studies). Twenty-seven articles were retained after eliminating studies that did not fit the criteria or did not yield enough information to draw conclusions. In addition, we included two articles that the search did not identify but with which we were familiar.
Table 1 summarizes these 29 studies and identifies the data source, the happiness measure, and whether the results were consistent with a U shape. Results of cross-sectional age comparisons are presented first and are followed by longitudinal or accelerated longitudinal analyses. The accelerated longitudinal analyses are based on data from two or more birth cohorts or cross-sections tracked for a number of years; the repeated-measures data for these different age groups are spliced together to create an estimate of change across the life course.
Recent Studies Illustrating Diversity in Age-Related Differences and Trajectories of Happiness Across Life
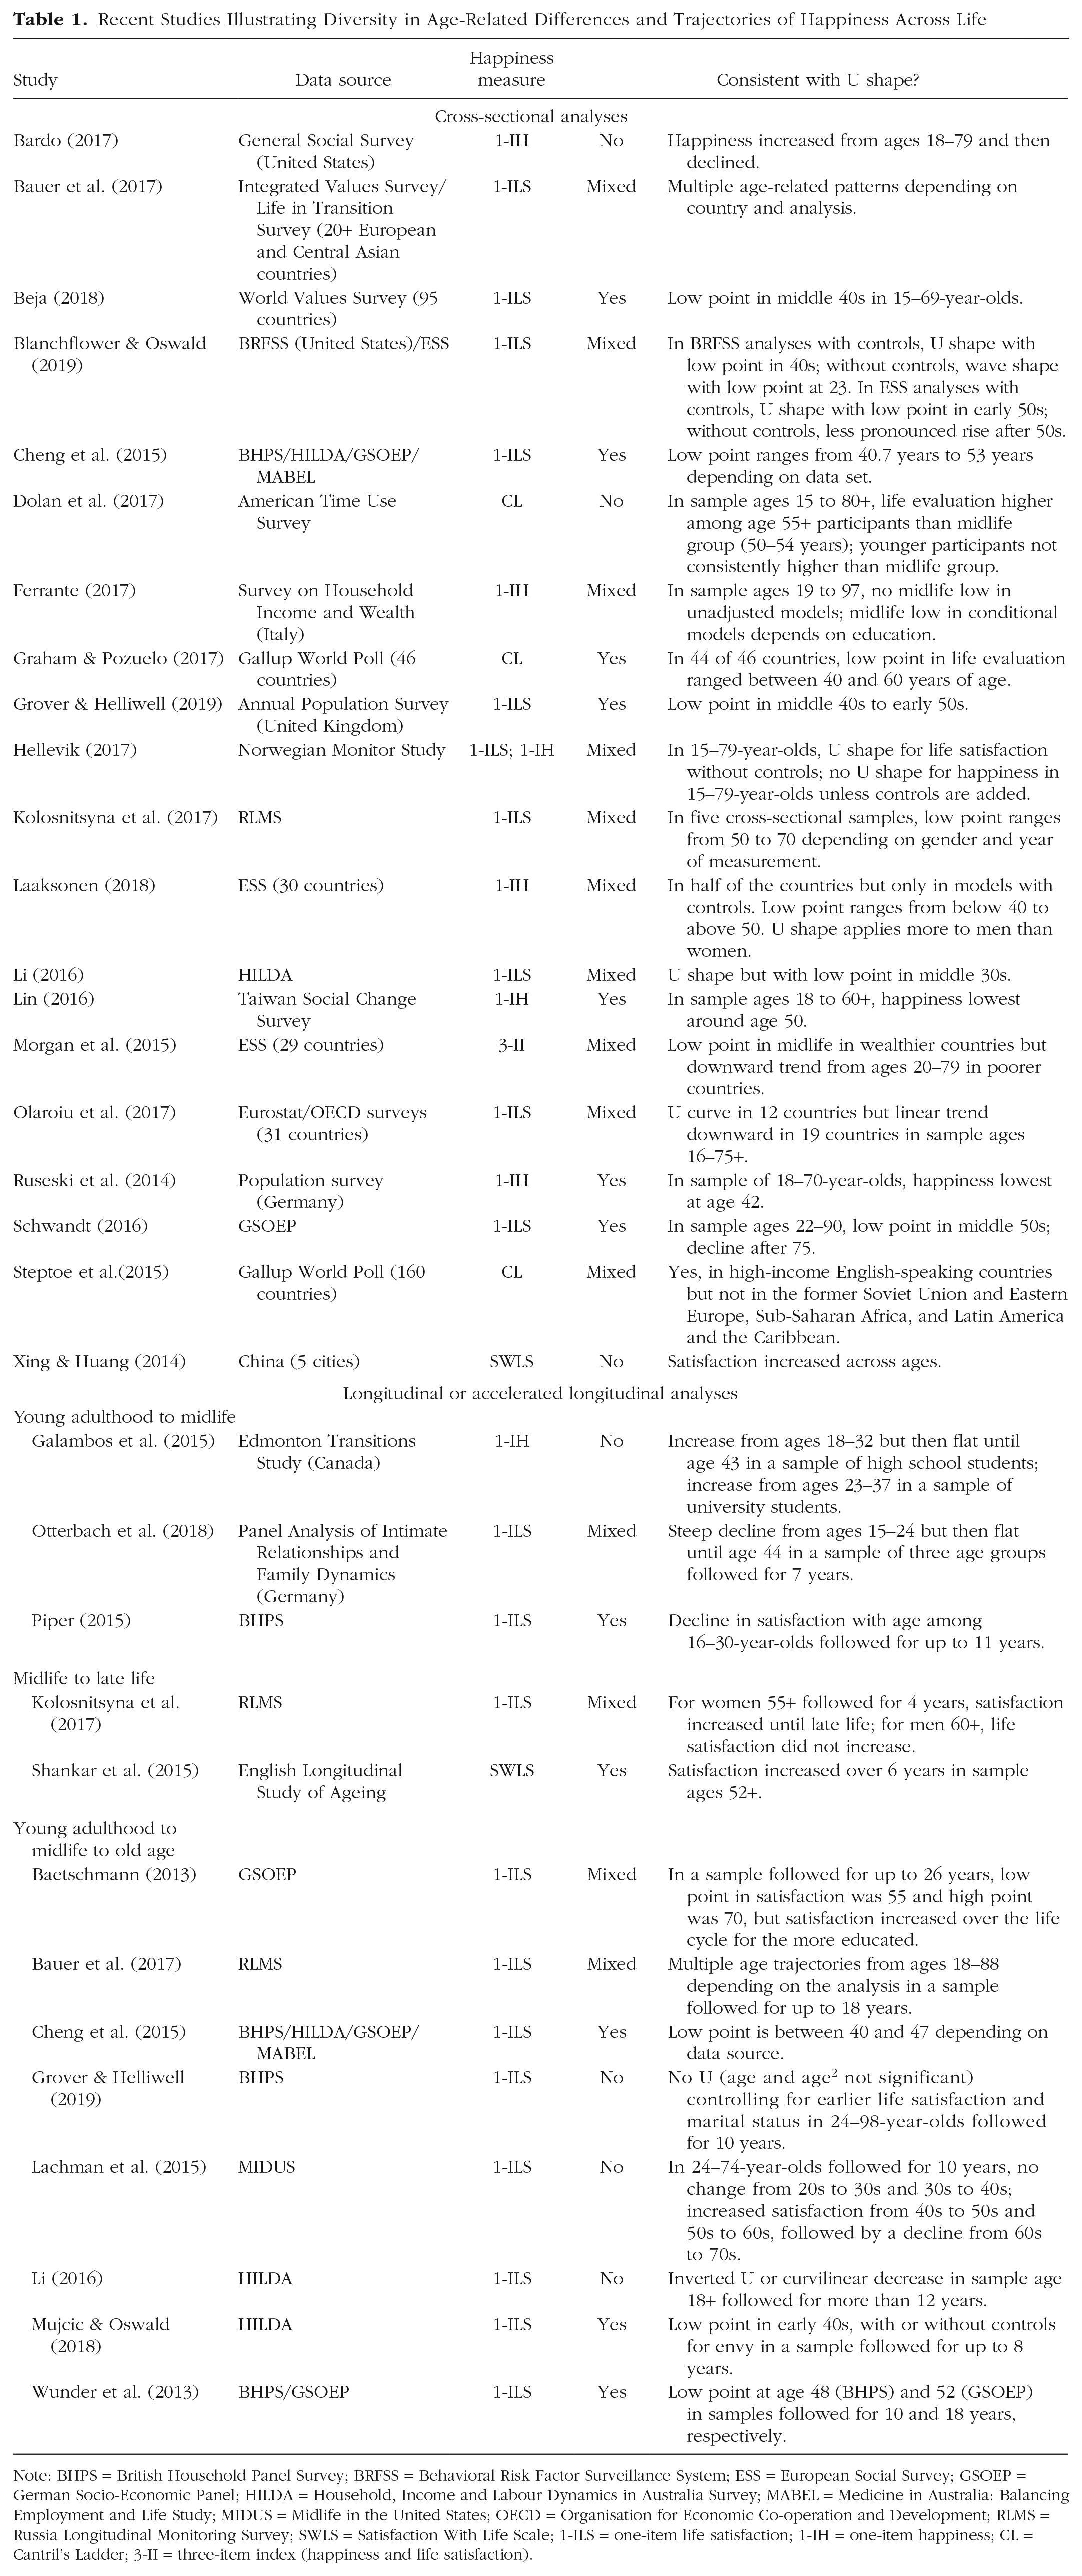
Note: BHPS = British Household Panel Survey; BRFSS = Behavioral Risk Factor Surveillance System; ESS = European Social Survey; GSOEP = German Socio-Economic Panel; HILDA = Household, Income and Labour Dynamics in Australia Survey; MABEL = Medicine in Australia: Balancing Employment and Life Study; MIDUS = Midlife in the United States; OECD = Organisation for Economic Co-operation and Development; RLMS = Russia Longitudinal Monitoring Survey; SWLS = Satisfaction With Life Scale; 1-ILS = one-item life satisfaction; 1-IH = one-item happiness; CL = Cantril’s Ladder; 3-II = three-item index (happiness and life satisfaction).
The Inadequacy of Cross-Sectional Research
A key issue in research on the U shape concerns the extent to which it is valid to draw conclusions about how people change over time (i.e., within-person or intraindividual change) on the basis of cross-sectional research. The shortcomings of cross-sectional research have long been recognized in economics and psychological research. For example, economist Herbert Parnes (1972), an original leader of the U.S. National Longitudinal Surveys on labor market behavior, argued, “For some kinds of research questions . . . a series of ‘snapshots’ of a changing population is inadequate. What is required is a ‘motion picture’ of the same group of individuals over time” (p. 11). Developmental psychologists have also argued that cross-sectional research is hardly defensible as a measure of within-person change and that longitudinal research following the same individuals over multiple occasions is required if the goal is to observe human behavioral change (Baltes & Nesselroade, 1979). Methodologically, cross-sectional analyses can only answer questions about differences between persons of different ages (Molenaar, 2008; Schaie, 2000). Nevertheless, U-shape proponents conclude, largely on the basis of cross-sectional research, that individuals will develop into less happy human beings as they age from their teens into their 40s, after which they will recover and experience increasing happiness into old age (Blanchflower & Oswald, 2008). Even a cross-sectional observational study on the subjective well-being of great apes in captivity is cited as proof of the cross-species ubiquity of the U shape (Weiss, King, Inoue-Murayama, Matsuzawa, & Oswald, 2012).
The flaws inherent in generalizing from age differences (i.e., between-person comparisons) to within-person (intraindividual) change trajectories were demonstrated in studies on marital satisfaction, a domain-specific indicator of SWB (Diener et al., 1999). Early cross-sectional studies of married people consistently found support for a U shape with a nadir in midlife (e.g., S. A. Anderson, Russell, & Schumm, 1983), leading N. D. Glenn (1990) to conclude “a curvilinear relationship between family stage and some aspects of marital quality is about as close to being certain as anything ever is in the social sciences” (p. 823). Later longitudinal data on couples revealed the U shape as an artifact of using between-person comparisons to infer intraindividual development (VanLaningham, Johnson, & Amato, 2001). Instead of a U shape, longitudinal studies revealed a linear decrease in marital satisfaction (e.g., Karney & Bradbury, 1997). Recent research has found that most couples maintain initial levels of marital satisfaction throughout their unions, with declines isolated to an initially less satisfied minority (J. R. Anderson, Van Ryzin, & Doherty, 2010; Lavner & Bradbury, 2010). We know from longitudinal research that unhappy couples that eventually divorced were not in the sample at older ages, so marital satisfaction appeared to be higher in later years (i.e., selection effect; VanLangingham et al., 2001). The implication for cross-sectional studies is that a sample will be biased at older ages toward more satisfied couples. Similar selectivity occurs with life satisfaction, such that people with lower life satisfaction are more likely to drop out of a study (Cheng, Powdthavee, & Oswald, 2015; Röcke & Lachman, 2008). As the notion of a U shape depends on an upward swing in happiness at older ages, it could be that selection effects explain such results more than true age-related increases.
Cross-sectional studies confound age and cohort differences (people born in the same period of time share unique experiences that people born at different times do not), a limitation commonly acknowledged in the literature (Baird et al., 2010; Bell, 2014; Easterlin, 2006). Using Household, Income and Labour Dynamics of Australia (HILDA) survey data, Li (2016) demonstrated that the U shape in cross-sectional data is a result of averaging levels of life satisfaction of different birth cohorts and that life satisfaction actually declined across the life course when appropriate within-person (fixed-effects) longitudinal analyses were conducted. Li argues that the age-happiness connection is in fact a “cohort-happiness” (p. 317) connection, a point that has also been made by others (Bell, 2014; Frijters & Beatton, 2012).
In addition to cohort and selection effects, measurement differences and choice of control variables likely account for conflicting results across studies exploring the U curve (N. Glenn, 2009; Laaksonen, 2018; Ulloa et al., 2013). Regardless of whether a U shape is found in cross-sectional data, people at different ages or in different age groups reporting different levels of happiness is not evidence of a developmental process that takes place within individuals across the life span. Longitudinal research is needed to investigate intraindividual change.
Cross-Sectional Support for the U Shape Is Mixed
Despite its limitations, cross-sectional research has been used to support claims of a midlife low in happiness, and even here, it is important to ask whether the data match the conclusion that the U shape is ubiquitous and robust. In a review of the literature on the U shape in well-being through 2012, Ulloa et al. (2013) concluded as follows: It is difficult to say with certainty whether the relationship between age and well-being across the lifespan is linear or convex. Given that theory and empirics in all disciplines seem to argue against an inverted U-shaped relation, the concavity hypothesis can most likely be dismissed. (p. 240)
More cross-sectional studies using measures of general life satisfaction and happiness have emerged since Ulloa et al. (2013), with results that also cast doubt on the pervasiveness of the U shape.
Table 1 reveals that several cross-sectional studies documented a U shape using life satisfaction, the Cantril ladder, and happiness items (Beja, 2018; Cheng et al., 2015; Daroudi, Rashidian, Zeraati, Oliyaeemanesh, & Sari, 2016; Graham & Pozuelo, 2017; Grover & Helliwell, 2019; Lin, 2016; Ruseski, Humphreys, Hallman, Wicker, & Breuer, 2014; Schwandt, 2016), but others found mixed evidence. That is, the shape (and associated nadirs and peaks) of the age-happiness connection varied depending on the country and region of the world (Bauer, Levin, Boudet, Nie, & Sousa-Poza, 2017; Laaksonen, 2018; Morgan, Robinson, & Thompson, 2015; Steptoe et al., 2015), whether control variables such as education and marital status were included in the analyses (Blanchflower & Oswald, 2019; Ferrante, 2017; Hellevik, 2017), year or period of time when the surveys were administered (Kolosnitsyna, Khorkina, & Dorzhiev, 2017; Olaroiu, Alexa, & van den Heuvel, 2017), and gender (Kolosnitsyna et al., 2017; Laaksonen, 2018). Some studies found a U shape, but the low point was outside of the typical range of midlife (defined as 40–60 years of age; Freund & Ritter, 2009), for example, in the 30s (Laaksonen, 2018; Li, 2016) or up to age 70 (Kolosnitsyna et al., 2017). One study found a wave shape with the lowest point at age 23 in a model without controls (Blanchflower & Oswald, 2019). Other studies found no evidence of a U shape on single-item happiness (Bardo, 2017), Cantril’s ladder (Dolan et al., 2017), and SWLS (Xing & Huang, 2014) measures. Altogether, the diversity in these studies was not a function of which item or measure was used to assess well-being. Such variability across studies illustrates not only that the U shape in cross-sectional data is not robust across geographic, sociocultural, historical, and demographic contexts but also that the low point in happiness is a moving target ranging between young adulthood and late life as well as within the 20-year period typically known as midlife.
Longitudinal Support for the U Shape Is Mixed
Frijters and Beatton (2012), noting that “either the psychologists have overlooked something important for a long time or . . . the methodology of economists begets different answers” (p. 526), analyzed longitudinal data from the German Socio-Economic Panel (GSOEP), British Household Panel Survey (BHPS), and HILDA to account for the difference in opinion. They found some support for the U shape in life satisfaction in pooled cross-sectional analyses, but the U shape vanished when selection (e.g., income, marriage) and time-in-panel effects were controlled via fixed-effects analyses. Kassenboehmer and Haisken-DeNew (2012) also documented the disappearance of the U shape in life satisfaction in the GSOEP after controls were introduced. Cheng et al. (2015) observed that “all attempts to replicate the [U-shape] pattern in genuinely longitudinal data have been a failure” (p. 127), highlighting the importance of further longitudinal research to draw conclusions about change trajectories in happiness.
Since 2013 more longitudinal studies on the U curve of happiness have emerged. Several have examined whether there is a downward slide in happiness from the teens or 20s into midlife—the first half of the U curve. Table 1 shows mixed evidence. On the one hand, the BHPS found a decline in life satisfaction over time among 16- to 30-year-olds tracked for 11 years (Piper, 2015). Data from the German Panel Analysis of Intimate Relationships and Family Dynamics (Otterbach, Sousa-Poza, & Møller, 2018) also showed a longitudinal decrease in life satisfaction across 7 years, but only in one cohort (ages 15–17 years at baseline); life satisfaction showed little change in two other cohorts (ages 25–27 and 35–37 years at baseline, respectively). On the other hand, self-reported happiness increased in the Edmonton Transitions Study (ETS), which followed a community sample of 18-year-old Canadians for 25 years as well as a sample of university graduates tracked from the ages of 23 to 37 (Galambos et al., 2015). Even at the recent age 50 follow-up of the ETS community sample, most participants described themselves as “very happy” and were obviously happier than they had been in their late teens and 20s (see Fig. 1).
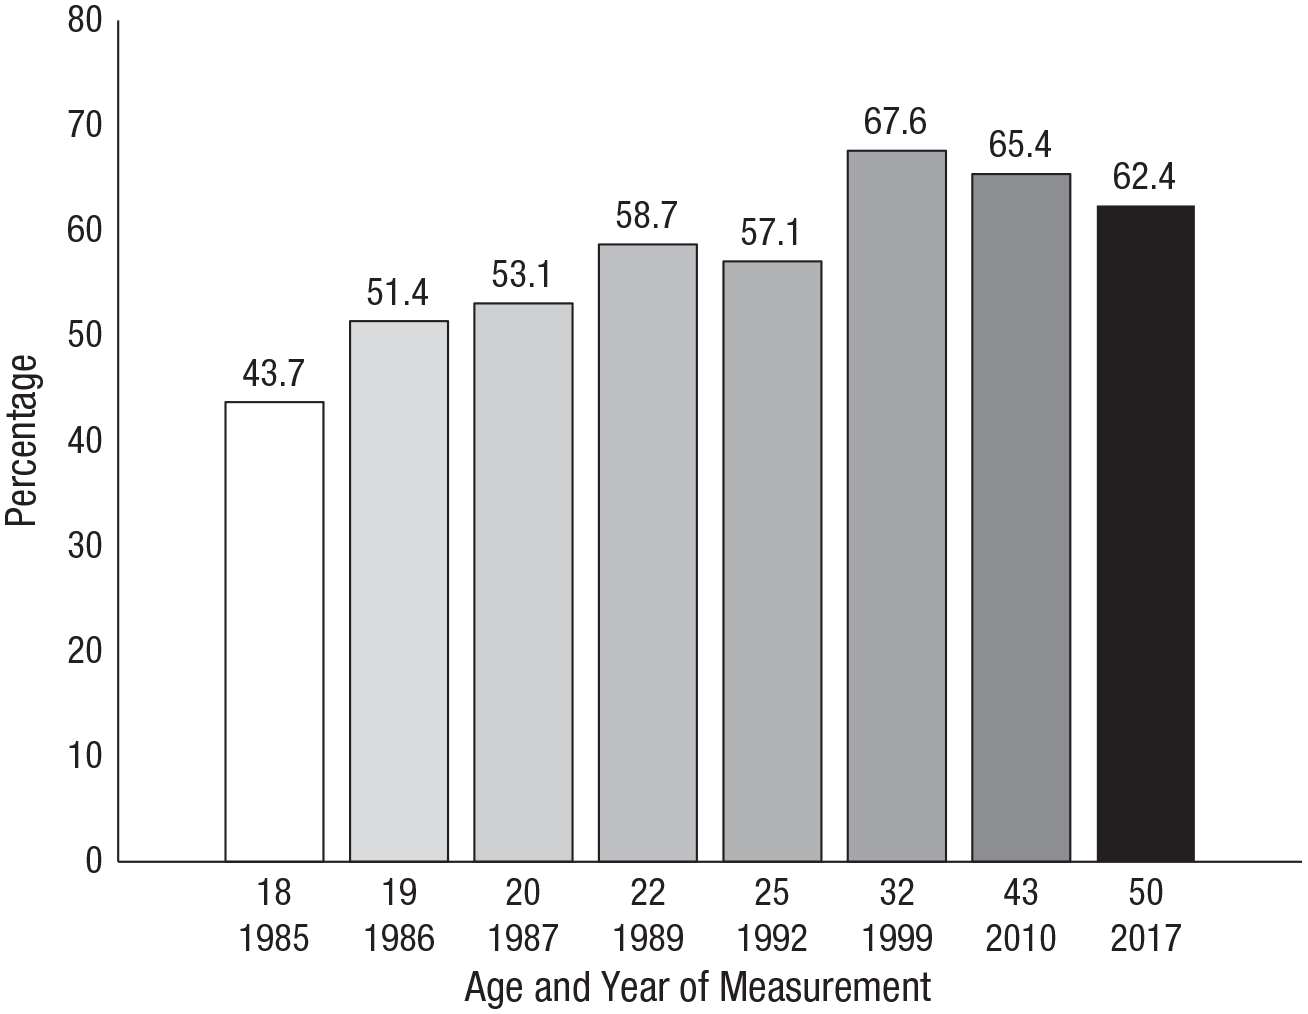
Percentage of participants who described themselves as “very happy” at each wave of the longitudinal study (N = 402–967; unpublished data).
With respect to an upswing between midlife and late life (the second half of the U curve), Table 1 shows mixed support. In a Russian sample, Kolosnitsyna et al. (2017) found that satisfaction increased until late life in women 55 years of age and older followed for 4 years. However, life satisfaction did not increase among men ages 60 and older. Shankar, Rafnsson, and Steptoe (2015) found that life satisfaction increased across 6 years in participants ages 52 and older in the English Longitudinal Study of Ageing, a result that is consistent with the second half of the U shape. Both studies differ from earlier results of Mroczek and Spiro (2005); their 22-year longitudinal study of American men ages 40 and older at baseline showed an increase in life satisfaction until the age of 65 that was followed by a decrease.
Accelerated longitudinal studies tracking multiple age cohorts over time can shed some light on the existence of a presumed decline in happiness from early adulthood to midlife followed by a rebound (see Table 1). In support of the U shape, data from Australian (HILDA), British (BHPS), and German (GSOEP) participants followed for a decade or more showed that life satisfaction reached a low point during the 40s or 50s (Cheng et al., 2015; Mujcic & Oswald, 2018; Wunder, Wiencierz, Schwarze, & Küchenhoff, 2013). However, there has been mixed or no support for the U shape in other GSOEP, BHPS, and HILDA studies. Baetschmann (2013), for example, called attention to the great heterogeneity in nadirs, peaks, and paths of life satisfaction in GSOEP, demonstrating that although, on average, life satisfaction declined to age 55 and then rose to age 70, highly educated people became more satisfied across the life course and the less educated slid downward. In a study using the GSOEP sample, Baird et al. (2010) reported stability in life satisfaction from age 16 until the 70s that was followed by a drop.
In a study using BHPS data, Grover and Helliwell (2019) found support for the U shape when earlier life satisfaction was not controlled (i.e., the effects of age and the age-squared terms were significantly negative and positive, respectively), but in models controlling for earlier life satisfaction (a methodologically rigorous approach), the age terms dropped to nonsignificance. Li (2016) conducted fixed-effects analyses to document decreasing life satisfaction across the life course in the HILDA sample, similar to the earlier report by Frijters and Beatton (2012). Such widely varying findings in more recent and earlier studies using the same data sources must give pause to the assumption of a single trajectory describing paths of happiness across the life span.
Given that so much of the (contradictory) longitudinal research on the U curve has been conducted on subsamples from the same data sources, it is refreshing to see results from other studies. The Midlife in the United States (MIDUS) study followed 10-year age bands of adults ages 25 to 75 for a decade; there was no change in life satisfaction from the 20s to the 40s, but life satisfaction increased from the 40s to the 60s and was followed by a decline until the age of 70 (Lachman, Teshale, & Agrigoroaei, 2015). Data from the Russia Longitudinal Monitoring Survey, which followed multiple age cohorts from the teens to the 80s, documented several age patterns in life satisfaction (U-shaped, S-shaped, downward, and upward) depending on the analysis (Bauer et al., 2017).
Altogether, longitudinal studies illustrate considerable diversity in happiness trajectories and fail to provide compelling evidence of an unequivocal decline in happiness from the early 20s into the 40s and 50s followed by a rebound up until later in life. Ample evidence shows the shape of the trajectory in longitudinal studies depends on the type of analysis (e.g., fixed effects vs. ordinary least-squares regressions) and the variables included or excluded in the analysis (e.g., education, marital status, socioeconomic status, cohort). Like cross-sectional studies, however, longitudinal designs have limitations, including attrition, time-in-panel, and selection effects, and they confound age-related change with time-of-measurement (period) effects (Baird et al., 2010; Frijters & Beatton, 2012; Li, 2016). The broad use of single-item measures of SWB in U-curve studies is another methodological limitation that could possibly lead to conflicting findings— although empirical arguments have been made to support their reliability, validity, and sensitivity to change (Baird et al., 2010; Diener et al., 2013). Nevertheless, for questions concerning within-person change across time, longitudinal designs are of vital importance.
Longitudinal Research on Other Well-Being Indicators Challenges the U Shape
Studies using subjective indicators of well-being (e.g., self-esteem, depression, anger, recent affective experiences) other than general happiness and life evaluations can provide useful insights into the validity of the U curve. Blanchflower and Oswald (2008), for example, found the U shape in cross-sectional analyses of depression (UK Labour Force Survey) and mental health (Eurobarometer). A comprehensive review of studies using such measures is beyond the scope of this article, but it is informative to take a glance at some recent studies because they provide longitudinal or accelerated longitudinal data from the teens to midlife or teens to late life.
It is interesting that several of these studies demonstrate adolescence and the early 20s, on average, as a low point in well-being, which improves into midlife. This has been shown with respect to trajectories of self-esteem (Orth, Maes, & Schmitt, 2015; Orth, Trzesniewski, & Robins, 2010), depression (Elovainio et al., 2012; Merikangas et al., 2003; Sutin et al., 2013), anger (Hakulinen et al., 2013), hostility (Siegler et al., 2003), psychological health (Jones & Meredith, 2000), and affect balance (Carstensen et al., 2011). Furthermore, several studies have found midlife (i.e., age 60) to be the peak in well-being across the life course (Orth et al., 2010, 2015; Sutin et al., 2013). Finally, a meta-analysis of longitudinal studies assessing emotional stability found increases especially between the ages of 20 and 40 (Roberts, Walton, & Viechtbauer, 2006). These studies challenge the generalizability of an average U-shaped trajectory characterized by enhanced well-being at the transition to adulthood compared with midlife.
It is important to note that these studies also demonstrate heterogeneity in trajectories of well-being depending on other variables in the equation. Baseline (e.g., gender) or time-varying predictors (e.g., physical health) are moderators that can move the trajectory up or down. Orth et al. (2010), for example, found that women had lower self-esteem than men in young adulthood, but the gender difference vanished by late life. In addition, physical health problems accounted for the decline in self-esteem from midlife to late life. Group-based modeling approaches intentionally highlight multiple trajectories in well-being across the life course (Musliner, Munk-Olsen, Eaton, & Zandi, 2016; Schulenberg et al., 2004). A meta-analysis of 25 longitudinal studies of depressive symptoms using group-based modeling (Musliner et al., 2016) identified between three and six latent class trajectories ranging from minimal symptoms across portions of the life span (most people) to chronically experienced symptoms (the rarest). Further evidence of diversity in trajectories arises when recently experienced emotions are assessed. Using longitudinal GSOEP data on sadness, anger, and happiness in the last 4 weeks, Kunzmann, Richter, and Schmukle (2013) documented widely varying trajectories: Happiness declined from 20 to 90, sadness was stable until age 70 and then declined, and anger rose from 20 to 30 and then declined until late life. Altogether, evidence drawn from indicators of subjective well-being other than global happiness and life satisfaction points to a multiplicity of possible pathways across life that defies the assumption of a single trajectory.
Reflections on the Past Highlight Midlife as Happy
Although ongoing assessment of the same individuals across the life span is optimal for examining happiness trajectories, it is intriguing to consider the reports of people who can tell us whether midlife is the nadir in happiness across the life course—those who lived it. We recently asked 404 Canadians in the ETS (average age: 50 years) the following question: “Thinking back, what was the best decade of your life?” The 40s received the highest endorsement (37%), and approximately a quarter endorsed the 30s (27%) and the 20s (25%). Few endorsed the teens (7%) or childhood (5%). A similar study conducted with older participants in Denmark found the 30s to be the most satisfying decade, with the 20s and 40s next highest in satisfaction (Mehlsen, Platz, & Fromholt, 2003). In a sample of young (24–29 years), middle-aged (49–54 years), and older adults (74–79 years) from Switzerland, the middle-aged group was most satisfied with life at present, and all three groups saw their teens as the low point in life satisfaction (Gomez, Grob, & Orth, 2013). Freund and Ritter (2009) found that midlife was the “preferred age” of older adults (60+) in their Swiss Internet study. Likewise, Lachman et al. (1994) reported that both middle-aged (M = 48 years) and older (M = 75 years) adults reported the “prime of life” to be between 31 and 52 years of age.
In another study, MIDUS data showed that although life satisfaction was relatively stable in rank order and mean levels across 9 years throughout adulthood, middle-aged adults recalled the past (10 years ago) as less satisfying than their quite highly satisfied present, and they expected the future to be even better (Lachman, Röcke, Rosnick, & Ryff, 2008; Röcke & Lachman, 2008). Finally, in a study of 59- to 80-year-olds in the United States who were asked about the most satisfying period of life, nominations were distributed relatively evenly across the 20s, 30s, 40s, 50s, and 60s, and the teens were seen as least satisfying (Field, 1997). Altogether, the lived experiences of many individuals who are in or have gone beyond midlife do not recall or portray it as the nadir in happiness.
We acknowledge that such retrospective reports would reflect the information-processing biases inherent in most recall tasks (see Karney & Frye, 2002). But it is not clear why, in the ETS and other studies (Field, 1997; Gomez et al., 2013), adolescence would be reported as the least satisfactory period in the life span, particularly if the midlife experience was comparatively worse. If midlife represents a true low point for most adults, we should not see so many recalling those years with fond memories in their autobiographical accounts.
The More Important Question Concerns Diversity in Happiness and Its Sources
We question the scientific and applied value of continuing to search for definitive evidence of a single trajectory in happiness. Emphasizing an average trend in happiness (if one could be found) is less important than discovering diversity in life paths and then identifying determinants of deviations from the average (Lachman, 2015; Whitbourne, 2010). The issue of how well-being changes from adolescence to late life is essentially a developmental question that can be approached from prominent life-span and life-course theoretical perspectives (Baltes, Lindenberger, & Staudinger, 2006; Elder, Johnson, & Crosnoe, 2003). Key assumptions of the life-span developmental perspective are that there is great diversity (interindividual differences) in within-person change across life, and this diversity can be captured with longitudinal research tracking individuals over time on multiple dimensions (e.g., multiple indicators of well-being). Multidimensionality leads to multidirectionality—observed characteristics even in the same domain will show different paths, ups, and downs rather than a single, unidirectional, universal trajectory (Baltes et al., 2006). The life-course perspective emphasizes historical, sociodemographic, and contextual influences on individual development, leading to a better understanding of how individual development is shaped by the forces of historical time, social change, culture, cohort, and the family into which one is born (Bardo, 2017; Elder et al., 2003). Life-span and life-course approaches consider the individual as an active agent who interacts with the context, and these interactions affect developmental change. From both perspectives, it is not surprising to see substantial evidence for heterogeneity in trajectories of happiness across measures, across studies, and among persons within studies.
What are the sources of differences across people in how their happiness changes across time? Studies tell us that happiness in any one person, sample, and nation is a result of unique, multiple, interacting determinants such as gender, socioeconomic background, and migration status; individual characteristics such as physical health; life events such as marriage, divorce, unemployment, and retirement; and community factors (e.g., corruption, social support, crime). Happiness also depends on macrolevel indicators such as economic recessions, natural disasters, and war (Galambos et al., 2015; Helliwell, Layard, & Sachs, 2018; Yap, Anusic, & Lucas, 2014). Olaroiu et al. (2017), for example, documented cross-sectional support for a U curve in life satisfaction among individuals in European countries in 2007 (prior to widespread economic recession) but considerably less support (more countries showed a downward trend) for the U shape in similar data from 2013 (postcrisis), possibly because the oldest cohorts were harder hit by the financial crisis.
Cultural background is a source of diversity that deserves more attention in research on age and well-being. Steptoe et al. (2015) showed stark national differences around the world on the Cantril ladder, with the U shape found only in high-income English-speaking countries. National differences are not equivalent to cultural differences, but culture could play a role in trajectories of SWB. Diener and Suh (1999), for example, argued that compared with people in individualist cultures, life evaluations of individuals in collectivist cultures are more determined by interpersonal than personal concerns, and SWB is lower in collectivist nations. Oishi (2010) drew attention to the complexities in considering well-being and culture, including cultural differences in concepts, measurement, and correlates of well-being. Identifying sources of short-term and longer-term variability in happiness trajectories is likely to lead to a more nuanced and precise understanding that will be more helpful for designing prevention/intervention programs and shaping social policies to increase well-being at all ages compared with pronouncing midlife as the low point in the life course.
To be sure, midlife can be a low point for some not only in terms of ratings of happiness but also as manifested in more serious trends. As reported in recent analyses of U.S. population data (Case & Deaton, 2015), morbidity and mortality are increasing dramatically among middle-aged men with less than a high school education. Suicide is highest between the ages 45 and 64 years (Suicide Prevention Resource Center, 2018). It is possible that a midlife dip in happiness at the population level could, in part, reflect these more serious cases of low well-being. Research is needed to learn more about the determinants and pathways to extreme midlife difficulties such as depression as well as to less severe manifestations of unhappiness captured in the U-shape research (Lachman, 2015). Some pathways will be rooted in earlier behaviors and histories, and changing social and economic contexts may shape some trends. Hence, it is critically important to not only conduct more research on midlife well-being but to take a long-term (i.e., longitudinal) perspective on its development.
Conclusions
Given the increasing attention by governments around the world to indicators of national well-being for informing and shaping social policies and programs (Diener, Kesebir, & Lucas, 2008; Helliwell et al., 2018), promoting the U shape in happiness as an accurate account of how people develop across the life course may be doing an injustice not only to the complexities of research but also to efforts to improve global well-being. Decisions about resource allocation demand appropriate conduct and interpretation of scientific studies based on methodologically rigorous designs and analyses. Given the body of evidence over recent years, we cannot conclude that there is a universal U shape in happiness. Furthermore, we are not the only researchers who have drawn this conclusion (see, e.g., Laaksonen, 2018; Li, 2016).
It is of limited scientific and applied value to attempt to identify a single curve describing how people move through the life course compared with examining individual differences in how and why people change across different segments of the life span in different contexts. Moreover, generalizing from small age differences (in primarily cross-sectional research) to reach conclusions about a universal crisis in midlife is misleading (Wethington, 2000; Whitbourne, 2010).
We believe that understanding happiness across the life course requires a multidisciplinary, collaborative approach that will move the field forward. Drawing distinctions between disciplines (i.e., psychologists vs. economists) is less helpful than agreeing to work toward better research designs, measurement of critical constructs, and statistical analyses. Authors of articles presented in Table 1 come from a variety of backgrounds, departments, institutions, and countries. Psychologists, economists, sociologists, and epidemiologists are among the many scholars who can contribute.
We have several recommendations for steps that researchers can take to facilitate understanding across disciplines with an eye toward establishing fruitful multidisciplinary collaborations:
In published work, include clear statements about study design (e.g., cross sectional, longitudinal, synthetic panel, accelerated longitudinal, sequential). Specifically, are the same people surveyed at multiple time points and, if so, for what length of time are they in a given study?
Report basic descriptive statistics (means, standard deviations, bivariate correlations, and percentage missing at any one point in time), which would allow readers to quickly determine how raw data compares to the results from more advanced modeling. Reporting descriptive statistics would also allow other researchers to attempt to replicate study findings on the basis of these summary data. Such information could be easily provided as supplemental information online.
Provide the full response scale on the y-axis in graphs depicting trajectories of happiness so the reader can comprehend the magnitude of any change over time.
In studies with many statistical models, provide fit statistics and/or comparisons of fit so that the best-fitting model is clear.
Use multiple measures of well-being, including multi-item measures and more general as well as experiential assessments, in longitudinal studies following several cohorts so that cohort, age, and period effects can be disentangled and to gain a finer understanding of trajectories in complementary dimensions of SWB.
Ultimately, it would be ideal if the results of research on happiness and well-being over the life course could be applied to understanding the variations within age groups with an eye toward addressing the sources and consequences of unhappiness.