
Abstract
We write in response to an article published in this journal, “The U Shape of Happiness Across the Life Course: Expanding the Discussion,” by Galambos, Krahn, Johnson and Lachman. The authors claim that “support for the purported U shape is not as robust and generalizable as is often assumed” and “we believe the conclusion that happiness declines from late adolescence to midlife (the first half of the U shape) is premature, and possibly wrong.” We respectfully disagree. The authors’ main evidence is based on summaries of 33 articles; they find 12 to have U shapes, seven to have none, and 14 to be mixed. We found that most of these articles are misclassified: Four of them are ineligible for inclusion, 25 find a U, and four are mixed. We then identified a further 353 articles, including 329 in peer-reviewed journals, that all found U shapes that were not identified in the literature review. This is a major omission. We also present our own evidence of midlife nadirs in well-being using around eight and a half million individual observations from nationally representative surveys for the United States and Europe. The midlife low occurs in the mid-40s and its drop is equivalent to roughly three quarters of the unprecedented drop observed in well-being during the COVID-19 pandemic.
We write in response to an article recently published in Perspectives in Psychological Science titled “The U Shape of Happiness Across the Life Course: Expanding the Discussion,” authored by Nancy Galambos et al. (2020). The authors suggest that the U shape is “purported” and that “the conclusion that happiness decline from late adolescence to midlife (the first half of the U shape) is premature, and possibly wrong” (p. 900). They also claim that “support for the purported U shape is not as robust and generalizable as is often argued” (p. 898). We respectfully disagree and argue that the finding of a U shape is, in our view, one of the most robust patterns in the data in social science.
The authors go on to suggest that It is of limited scientific and applied value to attempt to identify a single curve describing how people move through the life course compared with examining individual differences in how and why people change across different segments of the life span in different contexts. Moreover, generalizing from small age differences (in primarily cross-sectional research) to reach conclusions about a universal crisis in midlife is misleading. (p. 908)
As Blanchflower and Graham (2020) showed, the fall in well-being in midlife is large and significant, comparable in size to major life events such as losing a spouse or becoming unemployed. It is around three quarters of the size of the unprecedented drop in life satisfaction that has been observed around the world during the COVID-19 pandemic.
The U Shape
We have both published extensively on the topic of well-being and aging, our papers are cited in the Galambos et al. (2020) article, and one of us is even quoted directly. We are concerned that the Galambos et al. article—and the flawed methods therein—misrepresents the extensive literature showing that there is a significant dip in life-course well-being in the midlife years. We also believe that the literature summary that Galambos and coauthors provide is not an accurate reflection of the broader findings, given that we have found 353 additional studies that support a U shape. We provide evidence here of dips in well-being during midlife in the United States, the United Kingdom, Europe, and around the world, as well as in numerous other earlier published articles. This evidence also shows zeniths in unhappiness measures (Blanchflower, 2020a, 2020b, 2021; Blanchflower et al., 2013; Blanchflower & Graham, 2020; Blanchflower & Oswald, 2004a, 2004b, 2008, 2009, 2011, 2016, 2019, 2020; Graham & Pozuelo, 2017).
We used microdata on well-being and estimated regression equations to find the U shape by including (a) a quadratic in age in a well-being or unhappiness equation, (b) a group of banded age variables, or (c) a complete set of single-year age dummy variables (i.e., 20-year-olds, 21-year-olds, etc.). We did this with and without personal controls. Data files were often from nationally representative cross-section samples and frequently pooled across multiple years collected by government statistical agencies or by Gallup. Longitudinal analysis using these methods could also be conducted by tracking the same individual through time, but only a few countries have longitudinal surveys with long time runs of well-being data, principally the United Kingdom, Germany, the United States, China, Canada, and Australia. The results from cross-section and longitudinal data both confirmed the existence of U shapes. In some instances, and especially in third-world countries with lower life expectancy, there were turns in the data in old age as sample sizes fall, so we mostly restricted the samples to those of working age (i.e., from 16 to 70; Blanchflower, 2021). 1
Points of Disagreement
First, we disagree with a key statement in the Galambos et al. article asserting that “a focus on a single trajectory of well-being is of limited scientific and applied value because it obscures the diversity in pathways throughout life as well as its sources” (p. 898). Helliwell (2019) recently argued that “to use a single life satisfaction question in large population-based samples might represent the best use of survey resources” (p. 8). It entails a cognitive assessment about life-course well-being, extending well beyond momentary moods and affect—hedonic well-being (for details on well-being dimensions and best practice, see Stone & Mackie, 2013).
We should note, though, that estimates obtained using happiness and conglomerate measures such as the General Health Questionnaire (GHQ; Williams & Goldberg, 1988) or; Warwick-Edinburgh Mental Wellbeing Scales (WEMWBS; Tennant et al., 2007) also found U shapes (Bell & Blanchflower, 2021; Blanchflower et al., 2013; Blanchflower & Oswald, 2008). It also seems to make little difference whether the well-being variable is coded as a dichotomous yes/no variable or there are three, four, seven, 10, or even 11 options. We also show below in relation to four different life-satisfaction questions that it makes little or no difference how the question is asked or what measure is used, be it life satisfaction or happiness or even unhappiness.
Second, Galambos et al. do not distinguish clearly between analysis based simply on the raw data and analysis using socioeconomic and demographic controls (such as education, gender, employment status, and health). As was made clear in Blanchflower and Oswald (2009), in response to Glenn’s (2009) argument that controls should not be included, these distinct approaches are asking two different scientific questions.
The raw data show the effects of age on well-being over the life cycle without controlling for confounding factors, such as illness, labor market outcomes, or the death of a spouse. Although these things tend to happen as people age, such analysis does not prove that age “causes” these things; they could also be caused by poor health behaviors, risk taking, and other unrelated factors. Analysis including controls captures the pure effects of aging on well-being, accounting for these factors. For ease of interpretation, we—and most others—use a consistent set of controls, including time, state or country, gender, education, labor force, and marital status (Blanchflower, 2021). 2 Mixing and matching analyses based on the two different approaches simply confounds the discussion. Blanchflower and Graham (2020) provide further evidence.
Third, a section of the article titled “Reflections on the Past Highlight Midlife as Happy” (p. 906) uses recall data on elderly respondents who, on average, remember their midlife years favorably. Yet recall data, although informative, are hardly an accurate or robust measure. The sample has only 404 observations, and the authors do not present any statistical tests. Thus, the results are a set of anecdotes that, although interesting, are of limited generalizable value. One respondent—who may be old and sick and in poverty—will have a very different recall of the past relative to the present than will another respondent who is the same age but is healthy (age-adjusted) and in a decent financial situation. The results of the recall study are likely the consequence of present bias. 3 If people are happy in their 70s, then their present feeling will affect how they remember the past, which would explain why they might have misremembered how happy or unhappy they were during the midlife. If people are miserable in their 40s, they are likely to remember their childhood as miserable and project their future in the same manner.
Economic circumstances, along with health, can differ between individuals in midlife. Indeed, the point of including controls is so that you can disentangle the effects of age alone from those of disease, poverty, and unemployment, among others. In the regression framework, where data are pooled across countries and time, we also include fixed effects of country and year. Well-being data from 2008, when the unemployment rate was high and rising, for example, may well be different from data taken in later years as the labor market recovered.
Fourth, Galambos et al. acknowledge that there is a clear pattern of midlife despair and premature mortality in America, but they do not make the connection with the general pattern of midlife despair. Both of us have worked on these trends in premature mortality (deaths from drug and alcohol poisonings and suicide), and there are many reasons that they occur in the midlife years rather than earlier or later in life, reasons that coincide with the explanations for the midlife dip in well-being (Graham et al., 2018; Graham & Pinto, 2019). While they are compounded for those vulnerable to these deaths by low levels of education and labor market skills and by lack of social capital, they are clearly a part of the explanation. In America today, the elderly and the young both report that they have less pain than those in midlife (Case et al., 2020).
Blanchflower and Oswald (2020) reported on extreme mental distress in middle age on the basis of the proportion of Americans who say that all of the past 30 days were bad mental-health days. 4 They found that despair peaks in midlife. Blanchflower (2021) found that midlife zeniths in unhappiness in 20 different measures such as anxiety, worry, loneliness, sadness, stress, pain, strain, depression and bad nerves, phobias, and panic. Kessler et al. (2010) found midlife peaks in many depressive symptoms including Major Depressive Episodes (Table 1 in Kessler et al.), mood and panic disorders, alcohol and drug abuse, intermittent explosive disorder (Table 3 in Kessler et al.), headaches and pain (Table 4 in Kessler et al.), as well as treatment for emotional problems (Table 5 in Kessler et al.). In all cases, these trends in ill-being display as hump shapes rather than U shapes, for obvious reasons.
Fifth, Galambos et al. conclude that several articles did not find U shapes although the articles’ authors suggested that they did, according to direct quotes. We examine the evidence they present in their Tables 1 and 2, which we find is fully supportive of the existence of U shapes along with an additional 71 papers that found the same.
Finally, another key component of Galambos et al.’s analysis is based on a survey of a few hundred Americans. Sample sizes below 2,000 and even more so those below 1,000 just do not have enough explanatory power to generate statistically significant econometric results. 5 Thus, we are not convinced by Galambos et al.’s analysis, but we also are deeply concerned that their conclusions are dismissive of phenomena that truly affect the lives of millions of people around the world. It merits better understanding by both scholars and policymakers.
Galambos et al.’s Analysis of Cross-Section Happiness Studies
A central part of the article is a discussion of the findings in Table 1: studies that the authors found in a web search. 6 Galambos et al. classified the results as “yes,” “no,” or “mixed” on the basis of whether the study (a) appeared in a peer-reviewed journal, in English between 2013 and 2019; (b) tested for age differences; and (c) spanned the ages of teens or twenties into the sixties. We examined 33 papers discussed by Galambos et al. and found that four of them did not fit these eligibility conditions, 25 found U shapes, and four had mixed evidence. None found zero evidence of a U shape.
Remarkably, we then added an additional 169 articles that fit Galambos et al.’s criteria—articles that they missed—plus another 77 that fit the criteria but were published in peer-reviewed journals in 2020 and 2021 after the article’s publication date; 25 chapters, books, or working papers published since 2019; and a further 82 articles published in peer-reviewed journals in English before 2013. All 353 articles found U shapes in age, with lows in midlife, making 374 in all. 7 In our view, the conclusion that there is a U shape in well-being in age is neither “premature” nor “wrong.”
The first part of Galambos et al.’s Table 1 describes 20 cross-sectional studies from around the world that were found from a web search for papers published between January 2013 and June 2019, plus two others. 8
Above we noted the critical issue of whether studies included controls in their well-being equations. In several instances, they did not (Steptoe et al., 2015). For example, Ferrante (2017) found U shapes in models with controls but not in unadjusted models. The same was the case for Hellevik (2017). Overall, seven of the 20 are classified by Galambos et al. as “yes,” three are classified as “no,” and 10 as “mixed.” One of the “mixed” studies did not “test for age differences” (Olaroiu et al., 2017), which is one of Galambos et al.’s criteria for inclusion, so it is odd that it remains on the list.
Of the three that are classified as “no,” one (Dolan et al., 2017) should be a “yes,” given that the authors concluded that “the quadratic ‘U shape’ observed in other research was also evidenced here across measures. . . . . It was observed without and with controls” (p. 69). And later, “the age results for happiness are somewhat similar to prior research using single-item measures of yesterday’s affect from the US Gallup survey. A quadratic U-shaped relationship emerged in both our and Gallup results” (p. 69).
Another study that Galambos et al. say is a “no” (Xing & Huang, 2014) used three different measures of well-being, and with one of them, they argued they “found an approximate U-shape” in age with a low point at age 45 to 49. Thus, this should be coded as “mixed.” So should Bardo (2017) be: He used the General Social Surveys (GSS) from 1972 to 1994 without controls and claimed he did not find a U shape in the data but made no mention of several other peer-reviewed articles that found a U shape in the same GSS data with controls (including Blanchflower & Oswald, 2004a, 2019a). That leaves eight of these studies classified as “mixed.”
The remaining eight “mixed” studies should, in our view, all be classified as “yes.” That is not to say that they found U shapes for every subsample, but direct quotes from the articles seem relevant on their overall finding:
Li (2016) found a U shape in age in the late 30s.
Blanchflower and Oswald (2019b) found a U shape for 427,000 people in Behavioral Risk Factor Surveillance System (BRFSS) 2010 life-satisfaction data and concluded as follows: “This U-shaped pattern in psychological well-being is seen in other modern nations” (p. 39).
Bauer et al. (2017) reported that “our results generally confirm previous studies’ findings of a U shaped relation between subjective well-being and age for most of the lifecycle” (p. 125).
Ferrante (2017) wrote that “I detect a U-shaped age-happiness relationship, confirming previous empirical evidence” (p. 756).
Kolosnitsyna et al. (2017) wrote that “though the age/life satisfaction profiles vary slightly from year to year, the U-shape is quite steady” (p. 365).
Laaksonen (2018): “we find some support for the U-shape curve over 30 countries” (p. 478).
Hellevik (2017): “Is there a U-shaped relationship between age and subjective well-being? Based on the analysis of a Norwegian survey the answer is yes if we look at how satisfied people are with their lives” (p. 192).
Morgan et al. (2015) used the European Social Surveys and did find some differences between wealthier and less wealthy countries but overall concluded “our hypothesis that happiness-age trajectories would be U-shaped was supported” (p. 548).
So, of the 20 papers in the “cross-section analysis” part of Galambos et al’s Table 1, we excluded one, classified 16 as “yes,” and classified three as “mixed.”
Galambos et al. Analysis of Longitudinal Happiness Studies
We also examined the “longitudinal or accelerated longitudinal analyses” part of Galambos et al’s Table 1, which reports the results from 13 longitudinal studies (including four that were also in the cross-section part of the table). We should note at the outset that attrition bias is a major issue and that declining sample sizes cause the longitudinal files to become less representative over time. Kroh (2011) noted that in the case of the German Socio-Economic Panel (SOEP), less than half of the original 1984 sample remained after 2007. This matters because the most unhappy tend to drop out of the survey over time. This is why Galambos et al. (2015) found that nonparticipants in subsequent sweeps at baseline were less happy than those that continued to participate.
Five of the longitudinal studios in the table are reported by Galambos et al. as “yes,” four are “no,” and four are “mixed.” Two of the four “mixed”—Otterbach et al. (2018), Kolosnitsyna et al. (2017)—and one “no”—Galambos et al. (2015)—examined only subsets in age, which did not meet the authors’ own criteria for inclusion (i.e., that they “spanned the teens or twenties into the sixties”).
Two of the three remaining studies that are classified as “mixed” actually should be classified as “yes” on the basis of direct quotes from the articles:
Baetschmann (2013): “On average, life satisfaction is mildly decreasing up to age 55 followed by a hump shape with a maximum at 70. For men and women there is a minimum around fifty” (p. 404).
Bauer et al., (2017): “Our findings mostly support the existence of a U-shape in individual well-being” (p. 145).
Two of the remaining three studies that are classified as “no” should also be “yes”:
Grover and Helliwell (2019): “We find that the U-shape in the relationship between life satisfaction and age (Blanchflower & Oswald, 2008; . . . Graham & Pozuelo, 2017) exists for both the married and unmarried but is deeper for the unmarried” (p. 380).
Cheng et al. (2017) 9 used the same Household, Income and Labour Dynamics in Australia (HILDA) data that Li (2016) did and found a U shape.
The remaining “no” should instead be “mixed”: Lachman et al. (2015) wrote that “The MIDUS study data are consistent with . . . the U-bend trend for life satisfaction,” but the overall conclusions do show mixed evidence for the U shape.
Galambos et al. state that Cheng et al. (2017) “observed that ‘all attempts to replicate the [U shape] pattern in genuinely longitudinal data have been a failure,’ (p. 127), highlighting the importance of further longitudinal research to draw conclusions about change trajectories in happiness” (p. 904). This takes Cheng et al.’s findings entirely out of context and misrepresents what they said. They did not highlight the need for further research but made clear they had fixed the problem they identified, noting in the first two lines that “this article provides what appears to be the first longitudinal (fixed effects) multi-country evidence for a human nadir or midlife ‘crisis’” (p. 126).
In private communication with us, Nick Powdthavee confirmed this (personal communication, August 31, 2020). We present what he said to us below, with his permission.
I still find it quite astounding how many psychologists still reject the U-shape, given all the available evidence. . . And yes, they misquoted us here as well. When we said it was a failure, we had meant that there is a failure in the methodology (the infamous age + cohort + time problem . . .). We used the exact same data as previous studies that did not find the U-shape, applied our simple method to solve the age + cohort + year problem, and found evidence of U-shapes in all three data sets. So, I dare say that we have solved that problem, and showed that there’s longitudinal evidence of a midlife nadir in wellbeing.
Of the 13 longitudinal studies, three were ineligible, nine were “yes.” and one was “mixed.”
In Galambos et al.’s Table 1, with 33 studies, four are excluded as ineligible, 25 are “yes,” and four are “mixed.” A further 353 papers that find significant U shapes, making 374 in all and none against, under their own rules. In our view, Galambos et al. (2020) are thus entirely incorrect in their abstract when they claim that the evidence is “mixed”; it is not: cross-sectional evidence with respect to the ubiquity and robustness of the U shape in general levels of happiness and life satisfaction is mixed. . . . Longitudinal support for the U shape in happiness and life satisfaction is also mixed. (p. 898)
In what follows, we present new evidence from nationally representative surveys from around the world on the existence of U shapes in age using several measures of well-being. There are obvious patterns in the data from 8.5 million respondents.
Evidence of a U Shape in Age in Well-Being Data From Around the World
In the United Kingdom, the Office of National Statistics conducts a national Annual Population Survey each month. Since 2011, the ONS has been including four questions in a well-being supplement to its monthly national Annual Population Survey (Blanchflower, 2020b, 2021). One of these is a question on life satisfaction—“Overall, how satisfied are you with your life nowadays, where zero is ‘not at all satisfied’ and 10 is ‘completely satisfied’?” (ONS, 2020a). Table 1 reports the mean levels for different age bands for 2012 through 2017, and there is a minimum in the 50 to 54 age group. It is notable that in the raw data, there is a slight uptick in the late 20s.
ONS Estimates of Life-Satisfaction Averages, 2011 to 2017
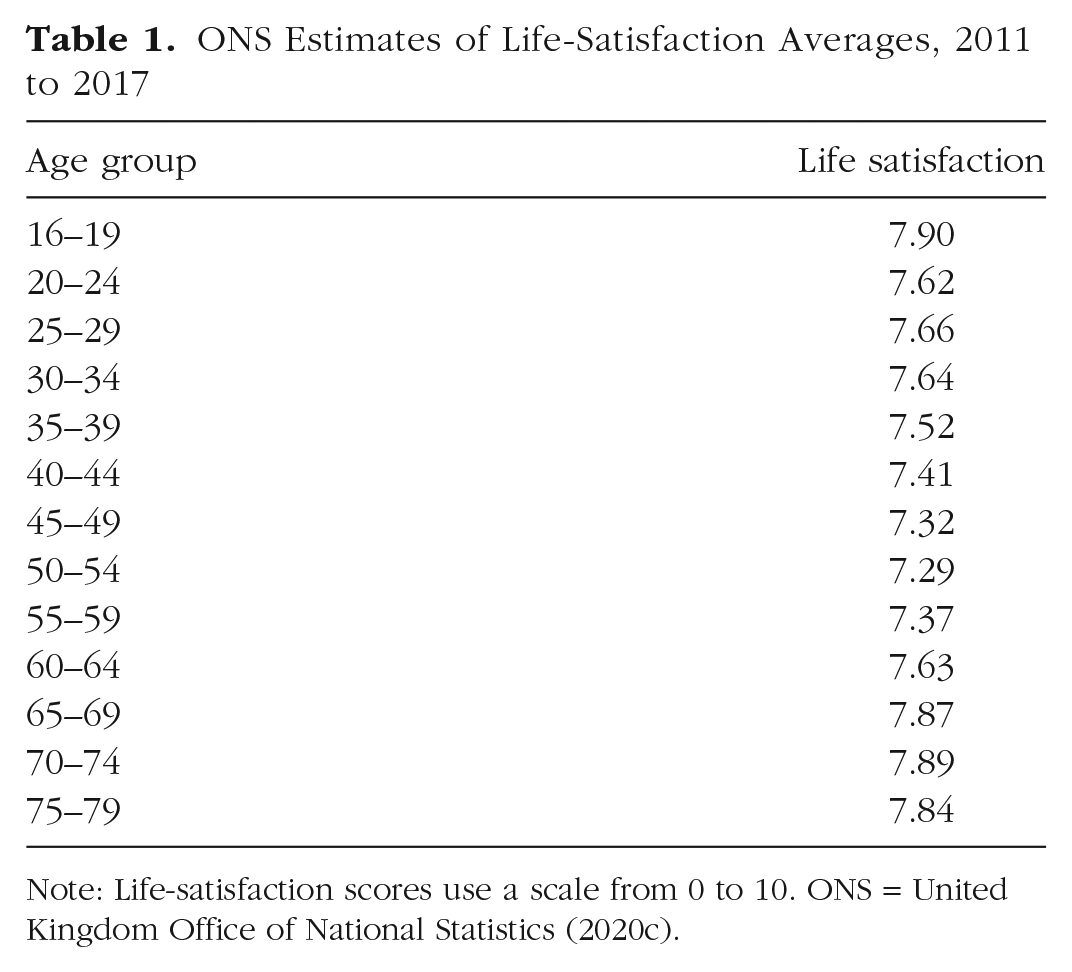
Note: Life-satisfaction scores use a scale from 0 to 10. ONS = United Kingdom Office of National Statistics (2020c).
The microdata for the most recent years available from these surveys (2016 to 2018; n = 269,569) were subjected to two ordinary least-squares regressions (both of which included a set of single-year age controls 10 ). These results are plotted in Figure 1. The “limited controls” plot includes 2-year dummy variables and 11 region dummy variables. 11 The “with controls” specification adds a gender dummy variable and controls for education, marital status, and labor-force status. In each case, the coefficient on each year of age variable is added to the constant and plotted. There are U shapes in age that minimize at around age 50. The “with controls” specification removes the early peak.
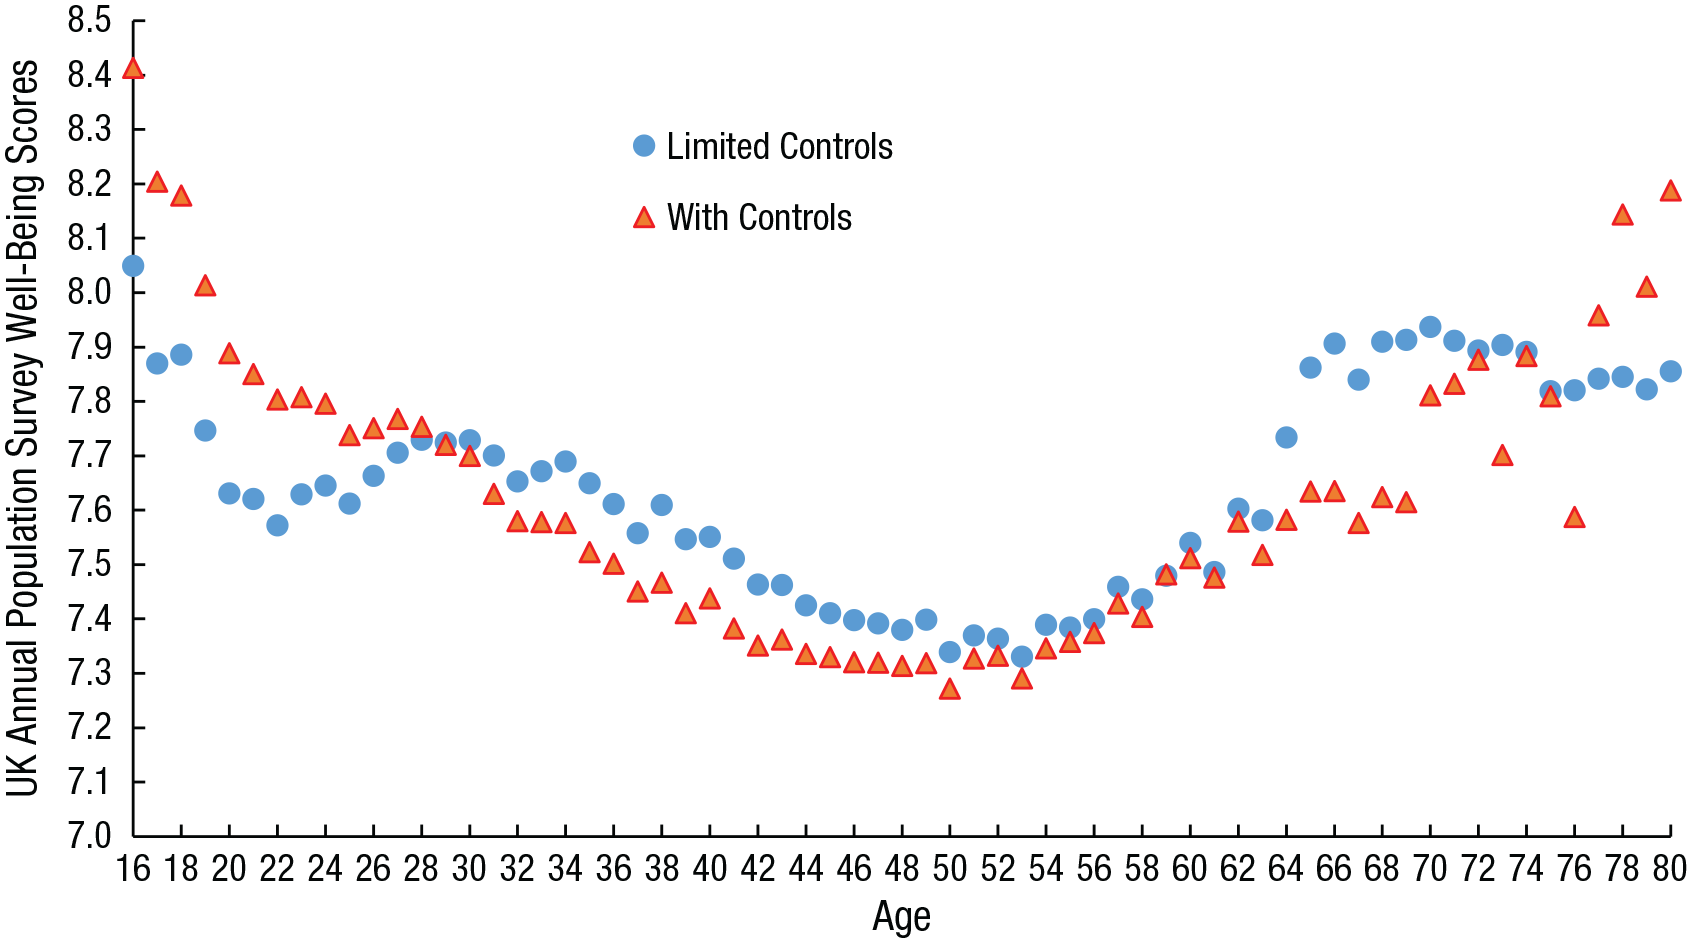
Life satisfaction in the United Kingdom (UK), 2016 to 2018. Data are from the Annual Population Surveys available from the UK Data Service (2021).
Figure 2 is similar to Figure 1 but uses a sample from the Eurobarometers data (Leibniz Institute for the Social Sciences, 2021), collected by the European Commission from 2009 through 2019 for 1.25 million people as used in Blanchflower and Clark (2021). This time, question asked was “On the whole, are you very satisfied, fairly satisfied, not very satisfied or not at all satisfied with the life you lead? Answers range from ‘not at all’ (1) to ‘very satisfied’ (4).” A life-satisfaction “limited controls” equation is estimated with a set of single-year age dummy variables plus year and country controls, and then one with controls for gender, education, labor-force status, and marital status. Both series show U shapes albeit more obviously so when controls are included. 12
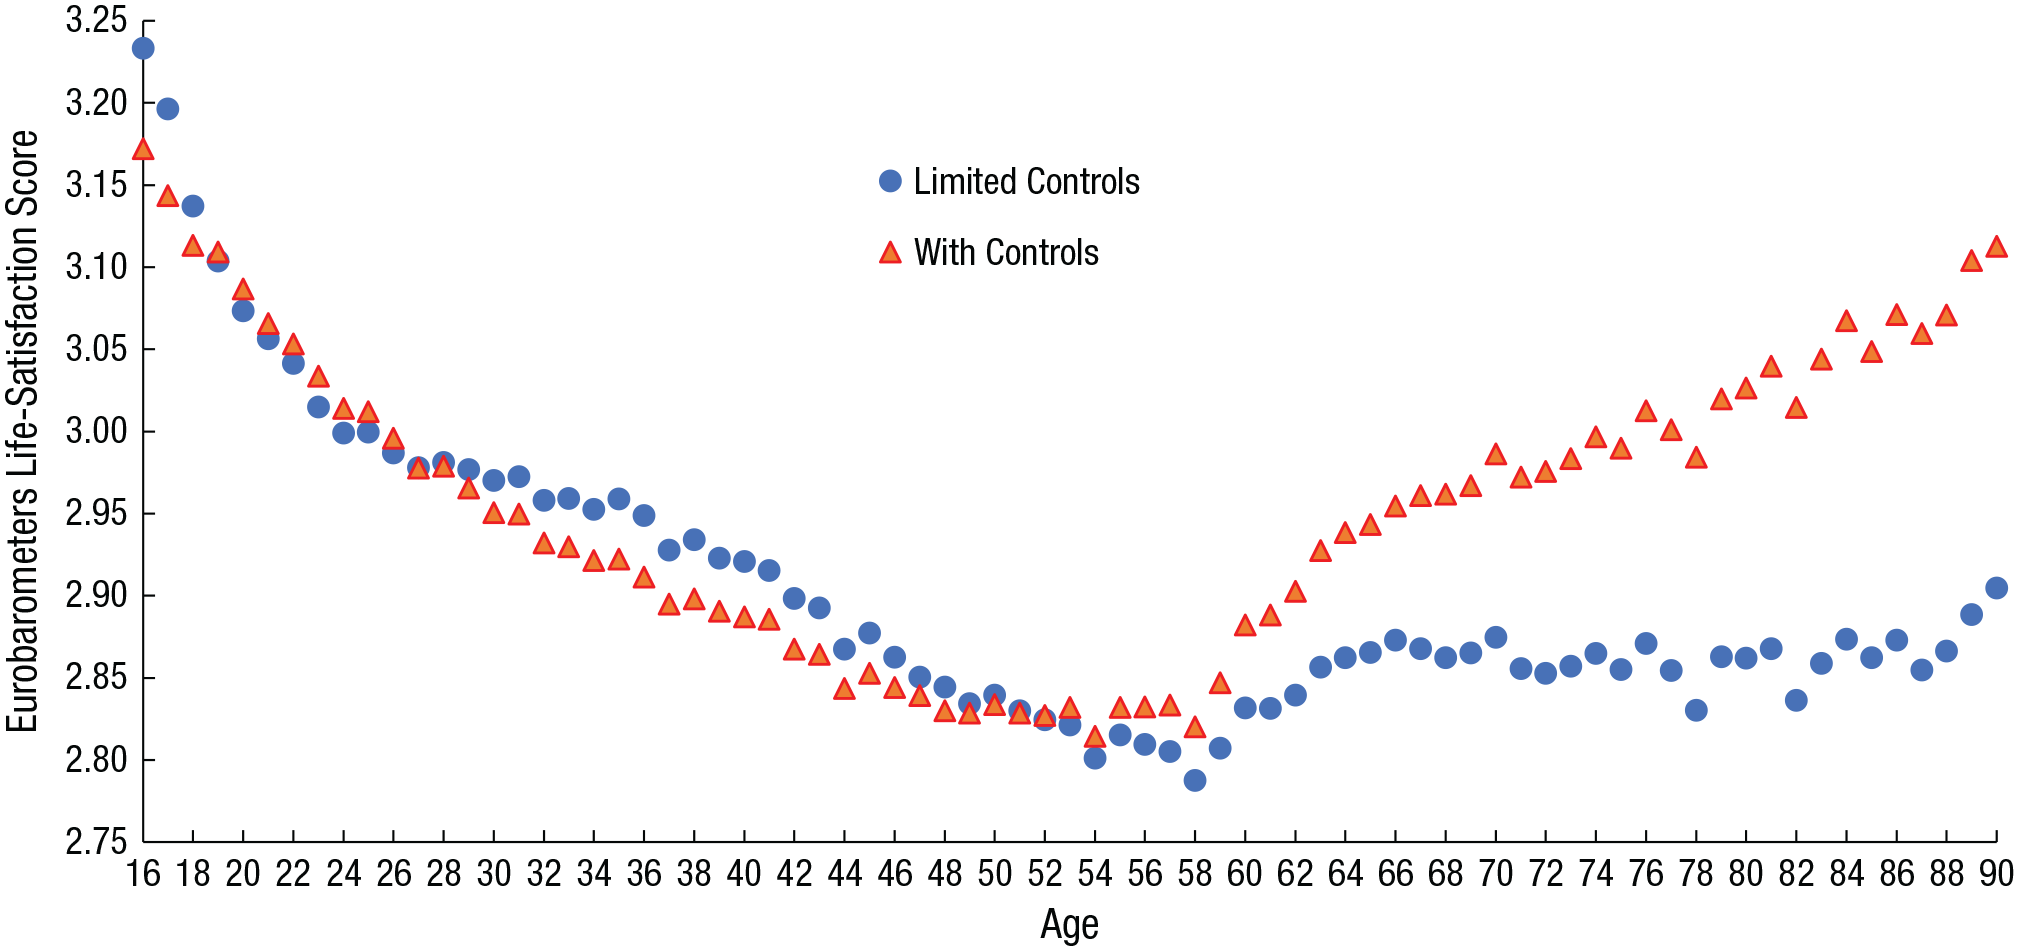
Life satisfaction in Europe, 2009 to 2019. Data are from Eurobarometers (Leibniz Institute for the Social Sciences, 2021).
Figure 3 is similar, but the data were obtained from Gallup’s U.S. Daily Tracker from 2009 through 2019 (2.5 million observations) with and without controls for gender, education, labor-force status, and marital status plus year and country controls. The dependent variable here is Cantril’s life-satisfaction ladder: Please imagine a ladder, with steps numbered from 0 at the bottom to 10 at the top. The top represents the best possible life for you and the bottom of the ladder represents the worst possible life for you. On which step of the ladder would you say you personally feel you stand at this time?

Life satisfaction in the United States, 2009 to 2019. Data are from Gallup’s U.S. Daily Tracker.
Until recently, there was a lack of consensus on how much evidence the Gallup World Poll (168 countries) provided across regions for U shapes, especially without controls. Table 2 gives data from 2005 to 2019 across 10 regions using the same Cantril’s life-satisfaction ladder question as above. There are limited controls (year and country), and there are controls adding education, marital status, and labor-force status. The sample was restricted to those under the age of seventy (n = 2,131,846). In every case, with and without controls, there was a minimum, meaning the age coefficient was significant and negative and the squared term was significant and positive. In two cases, the age minimum without controls was above 70. Overall, the minimum was at age 65 without controls and at age 51 with controls. Steptoe et al. (2015) found a U shape only for English-speaking countries in the Gallup World Poll data, but this finding is probably due to the fact that they used earlier years, fewer observations, and no controls.
Minima Estimated From Quadratics in Age Using Cantril’s Ladder, Gallup World Poll, 2005 to 2019 (n = 2,131,846)

Note: “Without controls” includes dummy variables for year and country. “With controls” adds education, marital status, and labor-force status. Sample restricted to age < 70 years.
Others worry that the U shape may not be present or stable across subgroups. In Table 3 (and in Fig. 4), we used data from the Behavioral Risk Factor Surveillance System (BRFSS; U.S. Centers for Disease Control and Prevention [CDC], 2021) survey series on life satisfaction, conducted from 2005 to 2019 (2.4 million observations). The question asked was, “In general, how satisfied are you with your life?” The answers ranged from very satisfied (4) to very dissatisfied (1). In each case, we estimated a life-satisfaction equation with controls for age and its square, month and year of interview, and state, and the same set of controls for education, gender, marital status, and labor-force status. The sample contained individuals ages 18 to 80 (anyone over 80 was classified as 80). We differentiated and solved the equation with respect to age, and, in every case, there was a minimum. We found a U shape for every racial group, for men and women, for the employed and the unemployed, and for the least and the most educated. The age minimum in the full sample was calculated to be age 44.
Life-Satisfaction Age Minima From the 2005–2017 BRFSS (n = 2,405,502)

Notes: Estimated from a life-satisfaction equation including controls for age and its square, gender, race, year and month of interview, state, education, marital status, and labor-market status.
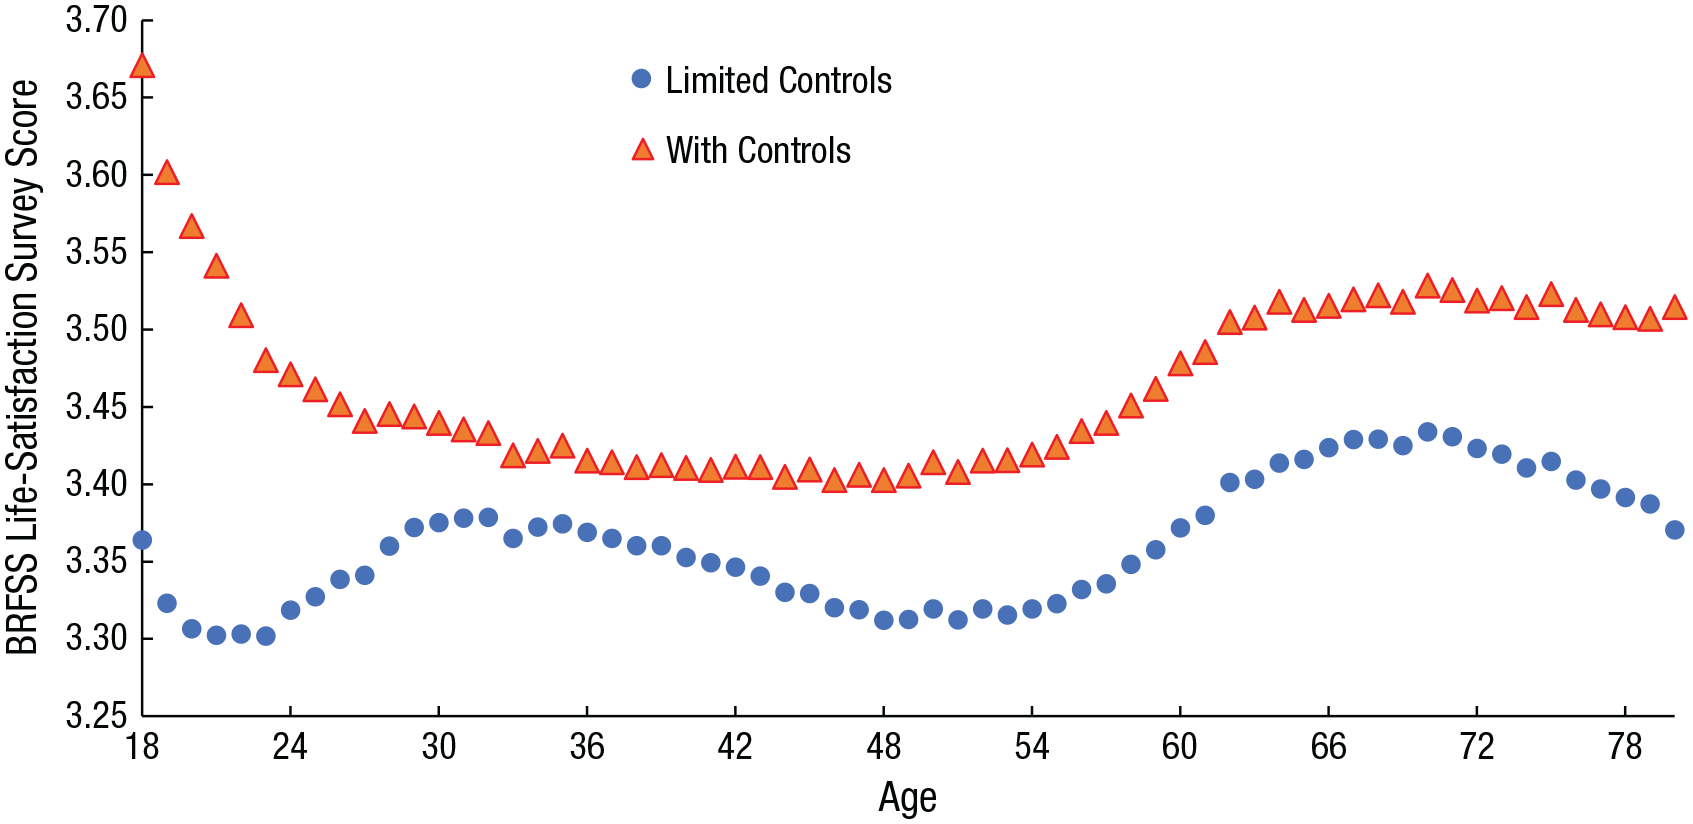
Life satisfaction in the United States, 2005 to 2019. Data are from the Behavioral Risk Factor Surveillance System (BRFSS; U.S. Centers for Disease Control and Prevention, 2021).
Galambos et al. argued that “generalizing from small age differences (in primarily cross-sectional research) to reach conclusions about a universal crisis in midlife is misleading” (p. 908). Another recent article by Jebb et al. (2020) similarly claimed, without foundation, that “much about the U shape has been overblown” (p. 302) and that even if there is a decline in well-being from youth to midlife, it was “trivial” and “quite small.” Figure 1 shows that life satisfaction in the United Kingdom declines from 8.1 at age 16 to 7.3 at age 50, or 0.8 life-satisfaction points. This drop is less than the difference in life satisfaction between being employed (7.8) to being unemployed (6.8) but more than the decline from being married (8.0) to being widowed (7.4). This does not look small or trivial.
As a result of the COVID-19 pandemic, the ONS started a new weekly Opinions and Lifestyle Survey in March 2020, one component of which was the same life-satisfaction question used for the data in Table 1 and Figure 1. There were 13 waves of the survey by mid-2020 (ONS, 2020b). The mean life-satisfaction score for the years 2017 to 2019 was 7.69. 13 Life satisfaction dropped to 6.6 in mid-April 2020. It rose to 7.2 at the end of May 2020 before falling back to 7.0 in the most recent data from mid-August 2020. The 0.8-point fall in life satisfaction that we observed from youth to the midlife in the United Kingdom is about three quarters of the 1.1-point drop in national life satisfaction during the pandemic (from 7.7 to 6.6 points)—not trivial.
Conclusions
There are U shapes in age in 146 countries, including developed and developing countries from every continent, every member country of the European Union, the G20, the member countries of the Organisation for Economic Co-operation and Development, and three quarters of the member countries of the United Nations. It seems hard to reconcile these findings of a broad-based pattern of a sense of lower well-being in midlife on a whole dimension of measures with Galambos et al.’s claim that the evidence “casts doubt on the pervasiveness of the U shape.”
The evidence we have presented is completely inconsistent with Galambos et al.’s claims that, all together, the diversity in these studies is not a function of which item or measure was used to assess well-being. They claim that such variability across studies illustrates not only that the U shape in cross-sectional data is not robust across geographic, sociocultural, historical, and demographic contexts but also that the low point in happiness is a moving target ranging between young adulthood and late life as well as within the 20-year period typically known as midlife. We disagree.
The robust and consistent evidence presented in the tables and the figures and many published studies runs contrary to Galambos et al. (2020)’s claim that the U shape is “not as robust and generalizable as often assumed” (p. 898). In our view, the evidence for a U shape in well-being is overwhelming. Happiness and life satisfaction both reach a minimum, whereas unhappiness maximizes in the mid-40s. This nadir in well-being is one of the most remarkable empirical patterns in social science. 14 There are U shapes in age in well-being.
Supplemental Material
sj-pdf-1-pps-10.1177_1745691620984393 – Supplemental material for The U-Shape of Happiness: A Response
Supplemental material, sj-pdf-1-pps-10.1177_1745691620984393 for The U-Shape of Happiness: A Response by David G. Blanchflower and Carol L. Graham in Perspectives on Psychological Science
Footnotes
Acknowledgements
We thank Nick Powdthavee, Doug Staiger, and the editor and referees for helpful comments and Emily Dobson for editorial assistance.
Transparency
Action Editor: Laura A. King
Editor: Laura A. King
Notes
References
Supplementary Material
Please find the following supplemental material available below.
For Open Access articles published under a Creative Commons License, all supplemental material carries the same license as the article it is associated with.
For non-Open Access articles published, all supplemental material carries a non-exclusive license, and permission requests for re-use of supplemental material or any part of supplemental material shall be sent directly to the copyright owner as specified in the copyright notice associated with the article.