



Abstract
Change of direction (COD) is an important component of athlete performance and measuring and comparing athletes is an integral aspect of strength and conditioning practice. This article aimed to determine pro-agility shuttle utility, by quantifying variability and normative values for different sports, skill-levels and positions. Limitations of the pro-agility shuttle are identified, as are future research directions. A total of 67 studies were included for review. Pro-agility shuttle reliability was reported in 10 studies across 6 sports; however, comprehensive reliability statistics were absent in most papers. Additionally, only reliability of total-time from stopwatch and timing lights were reported. Data of 32,891 subjects in 12 sports (American football, basketball, cricket, general athletes, hockey, lacrosse, recreational athletes, resistance-trained athletes, rugby, soccer, swimming, and tennis) were extracted and aggregated, establishing sport, skill-level (elite, sub-elite, and novice) and positional normative values, where practical. Elite athletes showed the fastest performance times, whereas sub-elite and novice athletes showed similar spreads in performance, suggesting similar athletic capabilities. In conclusion, the pro-agility shuttle currently has limited diagnostic value and the variability of smaller performance sub-components within pro-agility shuttle should be examined. Furthermore, the value of other technologies such as smart phone, inertial sensor or radar should be investigated.
Introduction
Change of direction (COD) ability is one of the key determinants of successful athletic performance in both field and court-sport athletes.1,2 The ability to change direction efficiently provides an indication of an athlete's underlying physiological capabilities, such as multi-directional reactive strength and anaerobic power3,4 and can be vital during key instances within a game which influence winning or losing (i.e. line breaks in rugby. 5 ) Therefore, the assessment of COD ability has become important in many sporting codes.6–9 One of the most common tests to measure COD ability is the pro-agility shuttle test. 10 Providing insight into acceleration, deceleration and COD, the pro-agility test is comprised of two 180° changes of direction over a total of 18.28 m (20 yards).11–14
The pro-agility has been used to determine team sport athletes’ COD performance in sports such as basketball, 6 cricket, 15 ice hockey, 16 lacrosse,17,18 and rugby. 19 In some studies, the pro-agility test has also been used to distinguish positional differences in athletic qualities between sporting codes, for example, soccer and lacrosse.20,21 The pro-agility has also been used to benchmark individual athlete ability against other athletes for talent identification and recruitment within the American football combine.6,15,22,23 This is due to the sharing of similar game-related movements, such as performing short accelerated sprints with rapid deceleration and high degrees of COD when transitioning from attacking to defending.18,24,25 In order for practitioners to benefit from performance assessment, they need to be knowledgeable as to whether the tests they use are reliable and accurately assess athlete performance. To be assured in the tests used reliably reflect athlete performance, tests must be deemed consistent across multiple testing occasions. 26 However, despite its widespread use there is little understanding as to the validity and reliability of the pro-agility test and therefore is a focus of this review.
One of the goals of collecting sport performance data is to gather normative information that provides insight into the representation and spread of typical performance, relative to the sport, performance level or individual. 27 By providing normative data, it enables practitioners to make appropriate comparisons between player performance to those of other groups (i.e. player positions and skill level). Additionally, practitioners can use the established values to advise practical and feasible goal setting. 10 Therefore, establishment of pro-agility normative values is critical for the identification, monitoring and development of athlete performance and provides a focus of this review.
Existing reviews in the area of COD have been conducted, providing summaries of the different testing and training qualities of COD.12,24,28 Unfortunately, they fail to discuss the utility of specific COD tests, such as the pro-agility, with previous work only focusing on the broader literature. Despite the use of pro-agility as a performance assessment, little thought or critique has been given to the utility of the test Given the preceding information, the aims of this review were:1) to quantify the variability associated with the pro-agility test; 2) establish normative data; and, 3) identify current limitations and future research directions. By taking such an approach, users of the pro-agility will have a better appreciation of the utility and limitations of this test
Methods
Study design
A systematic review was conducted in accordance with the Preferred Reporting Item for Systematic Reviews and Meta-analysis (PRISMA) guidelines 29 and was defined by the Population, Intervention, Comparison, and Study Design (PICOS) model. This review aimed to determine the utility of the pro-agility, through quantifying variability and reliability, establish normative performance values of different sports, skill levels and player positions, and identify limitations and areas of future research for the pro-agility shuttle.
Search strategies
A systematic search of four electronic data bases (SPORTDiscus, PubMed, ScienceDirect, and OVID journals) was undertaken between January and May 2020 to identify original research articles published from the earliest available records up to and including May 2020. The keywords ‘pro-agility’, OR ‘20 yard shuttle’, OR ‘5-10-5 shuttle’ were used in Boolean logic for query. The reference sections of the selected studies were also examined for identification of other applicable studies.
Study and screening selection
To be included studies needed to meet the following criteria; 1) measurement of the pro-agility; 2) a detailed description of the methods and technology used; 3) state the number of subjects and descriptive statistics of characteristics (age, height, and body mass); and 4) state the sport and skill level of the subjects. Studies that included the pro-agility were initially included in the first screening phase (n = 282). Additionally, studies must have been written in English. The initial search of the literature was conducted by the author. A second search of the literature, using the same parameters, was conducted by a second author, resulting in 4.47% fewer articles than the initial search. The discrepancy in number of articles found was solved via consensus to use the results of the initial search. All potentially applicable articles were included in a database, where afterwards they were read in full by one author. Specific aspects of the articles were then discussed to establish and ensure a consensus was reached with the other authors, regarding the article(s) inclusion, where relevant. To determine the number of eligible studies a three-stage screening process was implemented; 1) Removal of duplicate studies (n = 127); 2) Screening of article title and abstract. Studies that were deemed to be ‘out of scope’ (did not contain pro-agility time data) were excluded (n = 65); and, 3) Exclusion of studies that did not meet the inclusion criteria after screening the full text (n = 31). An additional eight eligible articles were included after reference checks, resulting in 67 studies included for analysis in this review. The selected studies comprised of 38 acute studies, 16 intervention studies, and 13 archival data (stored data) studies (Figure 1).

Flow diagram of study selection process.
Data extraction
One author extracted the data using a custom designed standardised excel database (version 16.0, Microsoft, Redmond, WA, USA). A second author validated a cross-section of these ratings for quality assessment control. Consensus was attained for the quality score of each article. In this case, an additional reviewer was not required for resolution of scoring issues. General study information (i.e. author, year), subject characteristics (i.e. sample size, gender, age, body mass, height, sport, performance level), type of study (i.e. acute, training, archival), methods of assessment (i.e. testing equipment, surface), and primary outcome measures (i.e. means and standard deviations of velocity or time) were extracted. Descriptive information relating to the sport and performance level were used to categorise each of the participants. Subjects who were not identified with a sport were grouped as “general athletes”. In the case that data for different sports was reported in an article, performance results were categorised in the appropriate sport for analysis. There is a wide array of definitions for elite, sub-elite, and novice athletes. 30 Therefore, in order to clearly differentiate between groups, skill level was defined by the competitive level of athletes in their respective sport in this review. Elite athletes were classified to be competing at National Collegiate Athletic Association (NCAA) divisions 1 or 2, national, international, or professional competitive levels. Sub-elite athletes being those of NCAA division 3 athletes,17,30 regional level club athletes, or undrafted athletes. With novice athletes being classed high school or recreational athletes.
Study quality assessment
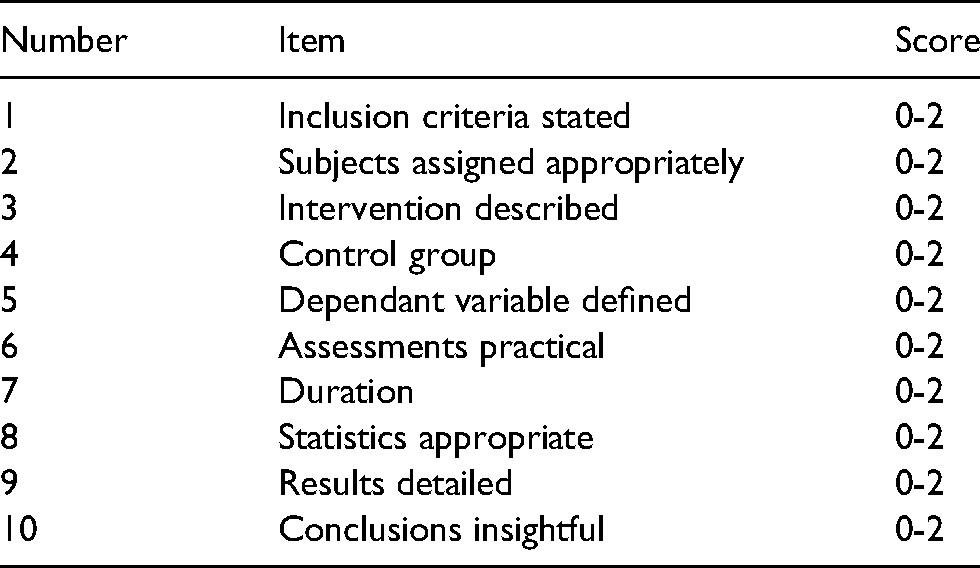
To assess the standard of the included studies, a quality scale designed to evaluate research conducted in athletic-based environments, was implemented. 31 This scale was modified and utilised based upon the scale created by Brughelli, Cronin, 32 using a combination of items from the Cochrane, Delphi, and PEDRO, as shown in Table 1. The quality of each study was evaluated on 10 items (2 points per item): inclusion criteria stated, subject assignment, intervention description, control groups, dependent variables definition, assessment methods, study duration, statistics, results section, and conclusions. The total quality score for each study ranged between 0 to 20, where a score of 0 = clearly no; 1 = yes, not detailed; and 2 = yes, clearly detailed.
Study quality score. 32
Data analysis
IBM SPSS statistical software package (version 25.0; IBM Corporation, New York, USA) was used to analyse the data from the studies collected. Data was reported using mean and standard deviation (±SD). Subjects were grouped by sport, skill level (novice, sub-elite, and elite), and position where appropriate. The level of relative reliability intraclass correlation coefficient (ICC) was described as: ≤0.50 poor, 0.50–0.75 moderate, 0.75–0.90 good, and
Results
Overview of studies
A summary of the included studies for this review can be found in Table 2. Data was gathered from 11 different sports in 68 population samples over 67 studies as summarised in Table 3 and herewith; most sports were found in the sub-elite and novice skill level, however, there appears to be an ample spread of data through the three skill levels. The 67 studies comprised a sample size of 32,891 subjects of different skill levels (elite: 6,631, sub-elite: 382, novice: 25,878), with an average sample size of 472.79 ± 1193 (range 12–4603) for elite, 27.3 ± 19.7 (range 12–84) for sub-elite, and 924.21 ± 2505 (range 11–9203) for novice subjects. The most common sport was American football (Table 3), with the least common sports being basketball, cricket, ice hockey, resistance-trained athletes, and tennis.
Description of the studies in the review.
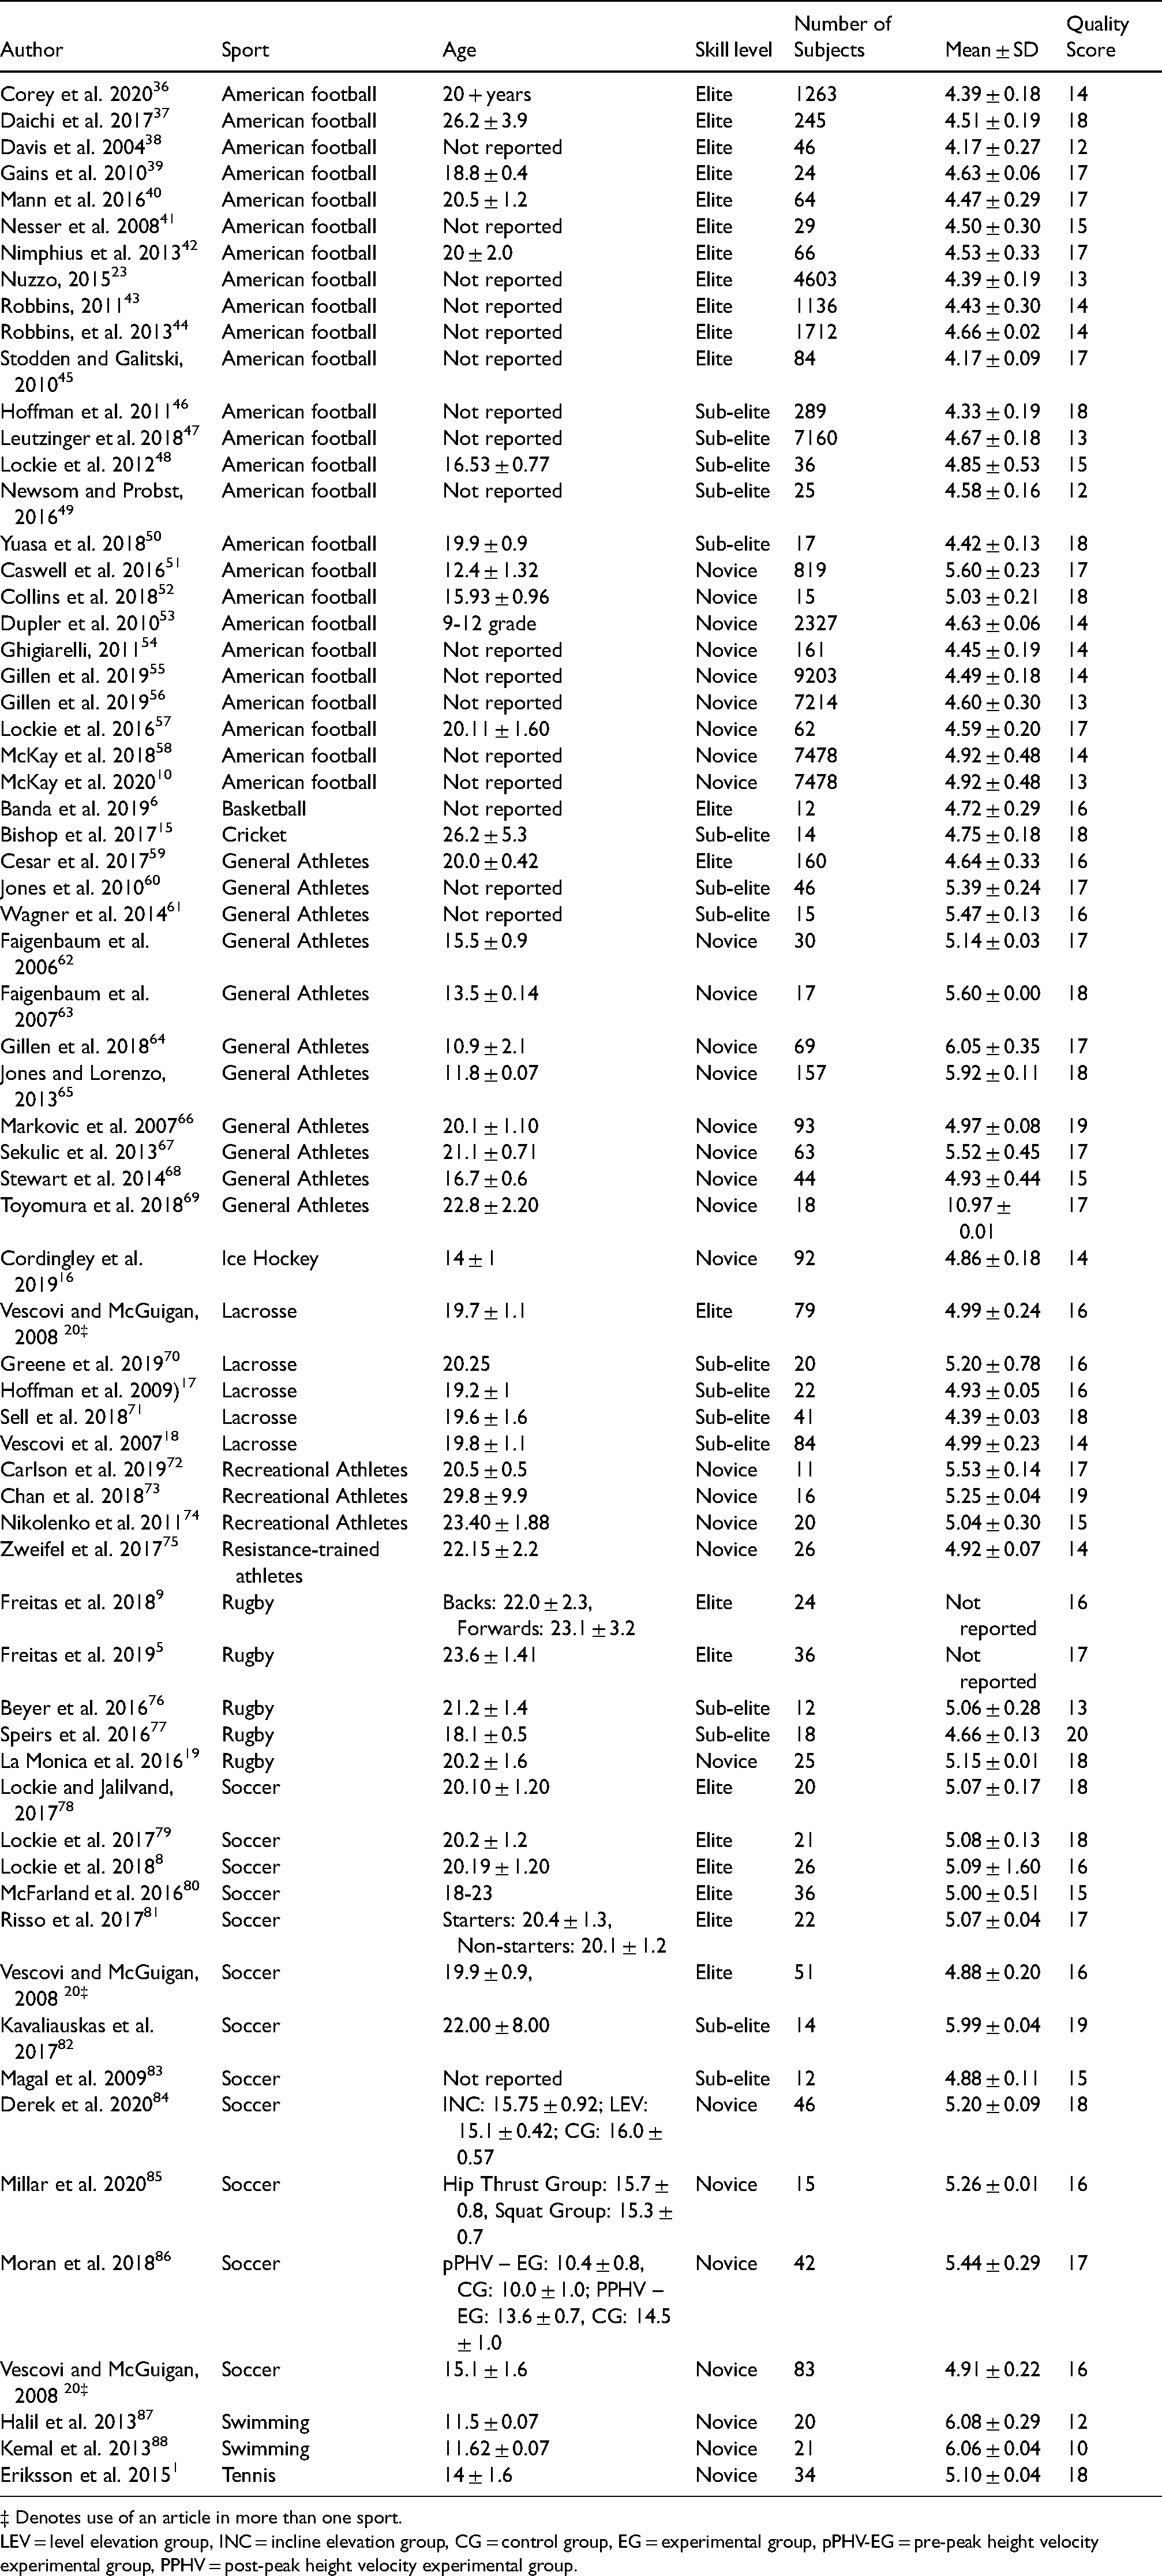
‡ Denotes use of an article in more than one sport.
LEV = level elevation group, INC = incline elevation group, CG = control group, EG = experimental group, pPHV-EG = pre-peak height velocity experimental group, PPHV = post-peak height velocity experimental group.
Number of population samples by sport and skill level.

Quality score
For acute studies items 3 and 4 on the modified scale could not be assessed, additionally archival studies, where data collection came from historical archives, items 3, 4, and 7 on the modified scale could not be assessed and was excluded for these studies, therefore, these studies are assessed on a scale of 0 to 16 and 0 to 14, respectively. Quality score for all studies averaged 15.9 (± 2.09). Acute studies averaged 14.2 (± 1.72) out of 16, for intervention studies 17.5 (± 1.51) out of 20, and for archival data studies a 13.4 (± 0.77) out of 14 (Table 1). Acute study quality was affected by the inclusion or exclusion of item 1 and 9 in Table 1 (i.e. inclusion criteria stated, and use of results detailed). Of the 38 acute studies four did not state inclusion criteria, and 14 of the 38 studies ‘maybe’ stated inclusion criteria. Seventeen of the 38 acute studies ‘maybe’ stated detailed results (i.e. results lacked detail or were not presented clearly). Intervention study quality was affected by the inclusion or exclusion of item 4 and 8 (Table 1) (i.e. use of a control group (CG), and appropriate use of statistics). Nine of the 16 intervention studies included the use of a CG, as it was practical to use this study design in the tested population (e.g. randomised-control trial). Five of the 16 intervention studies did not use appropriate statistical analysis, where inferential statistics, within-group or between-group reliability, or effect size (ES) analysis may not have been conducted. Quality score for archival studies averaged 13.4 ± 0.77 out of 14 (Table 1). Archival study quality was affected by inclusion or exclusion of item 1, 2, and 6 in Table 1 (i.e. inclusion criteria clearly stated, the assignment of subjects, and results detailed). Ten of the 13 archival studies clearly described inclusion criteria for the subjects. Eleven of the 13 archival studies assigned subjects appropriately, based on playing position and skill level. Three of the 13 archival studies reported results in insufficient detail (i.e. reporting between group differences).
Reliability and technology
Reliability of the pro-agility was found to be reported in five different sports and in general athletic populations (Table 4). The change in mean denotes the systematic bias or random error of measurement, 35 and only three studies have reported the change in mean over multiple testing occasions.15,40,64 The change in mean varied by 0.60% to 1.71%. The greatest change in the mean was found in general athletes, 64 the smallest change was noted in elite American football athletes. 40
Reliability and technology.
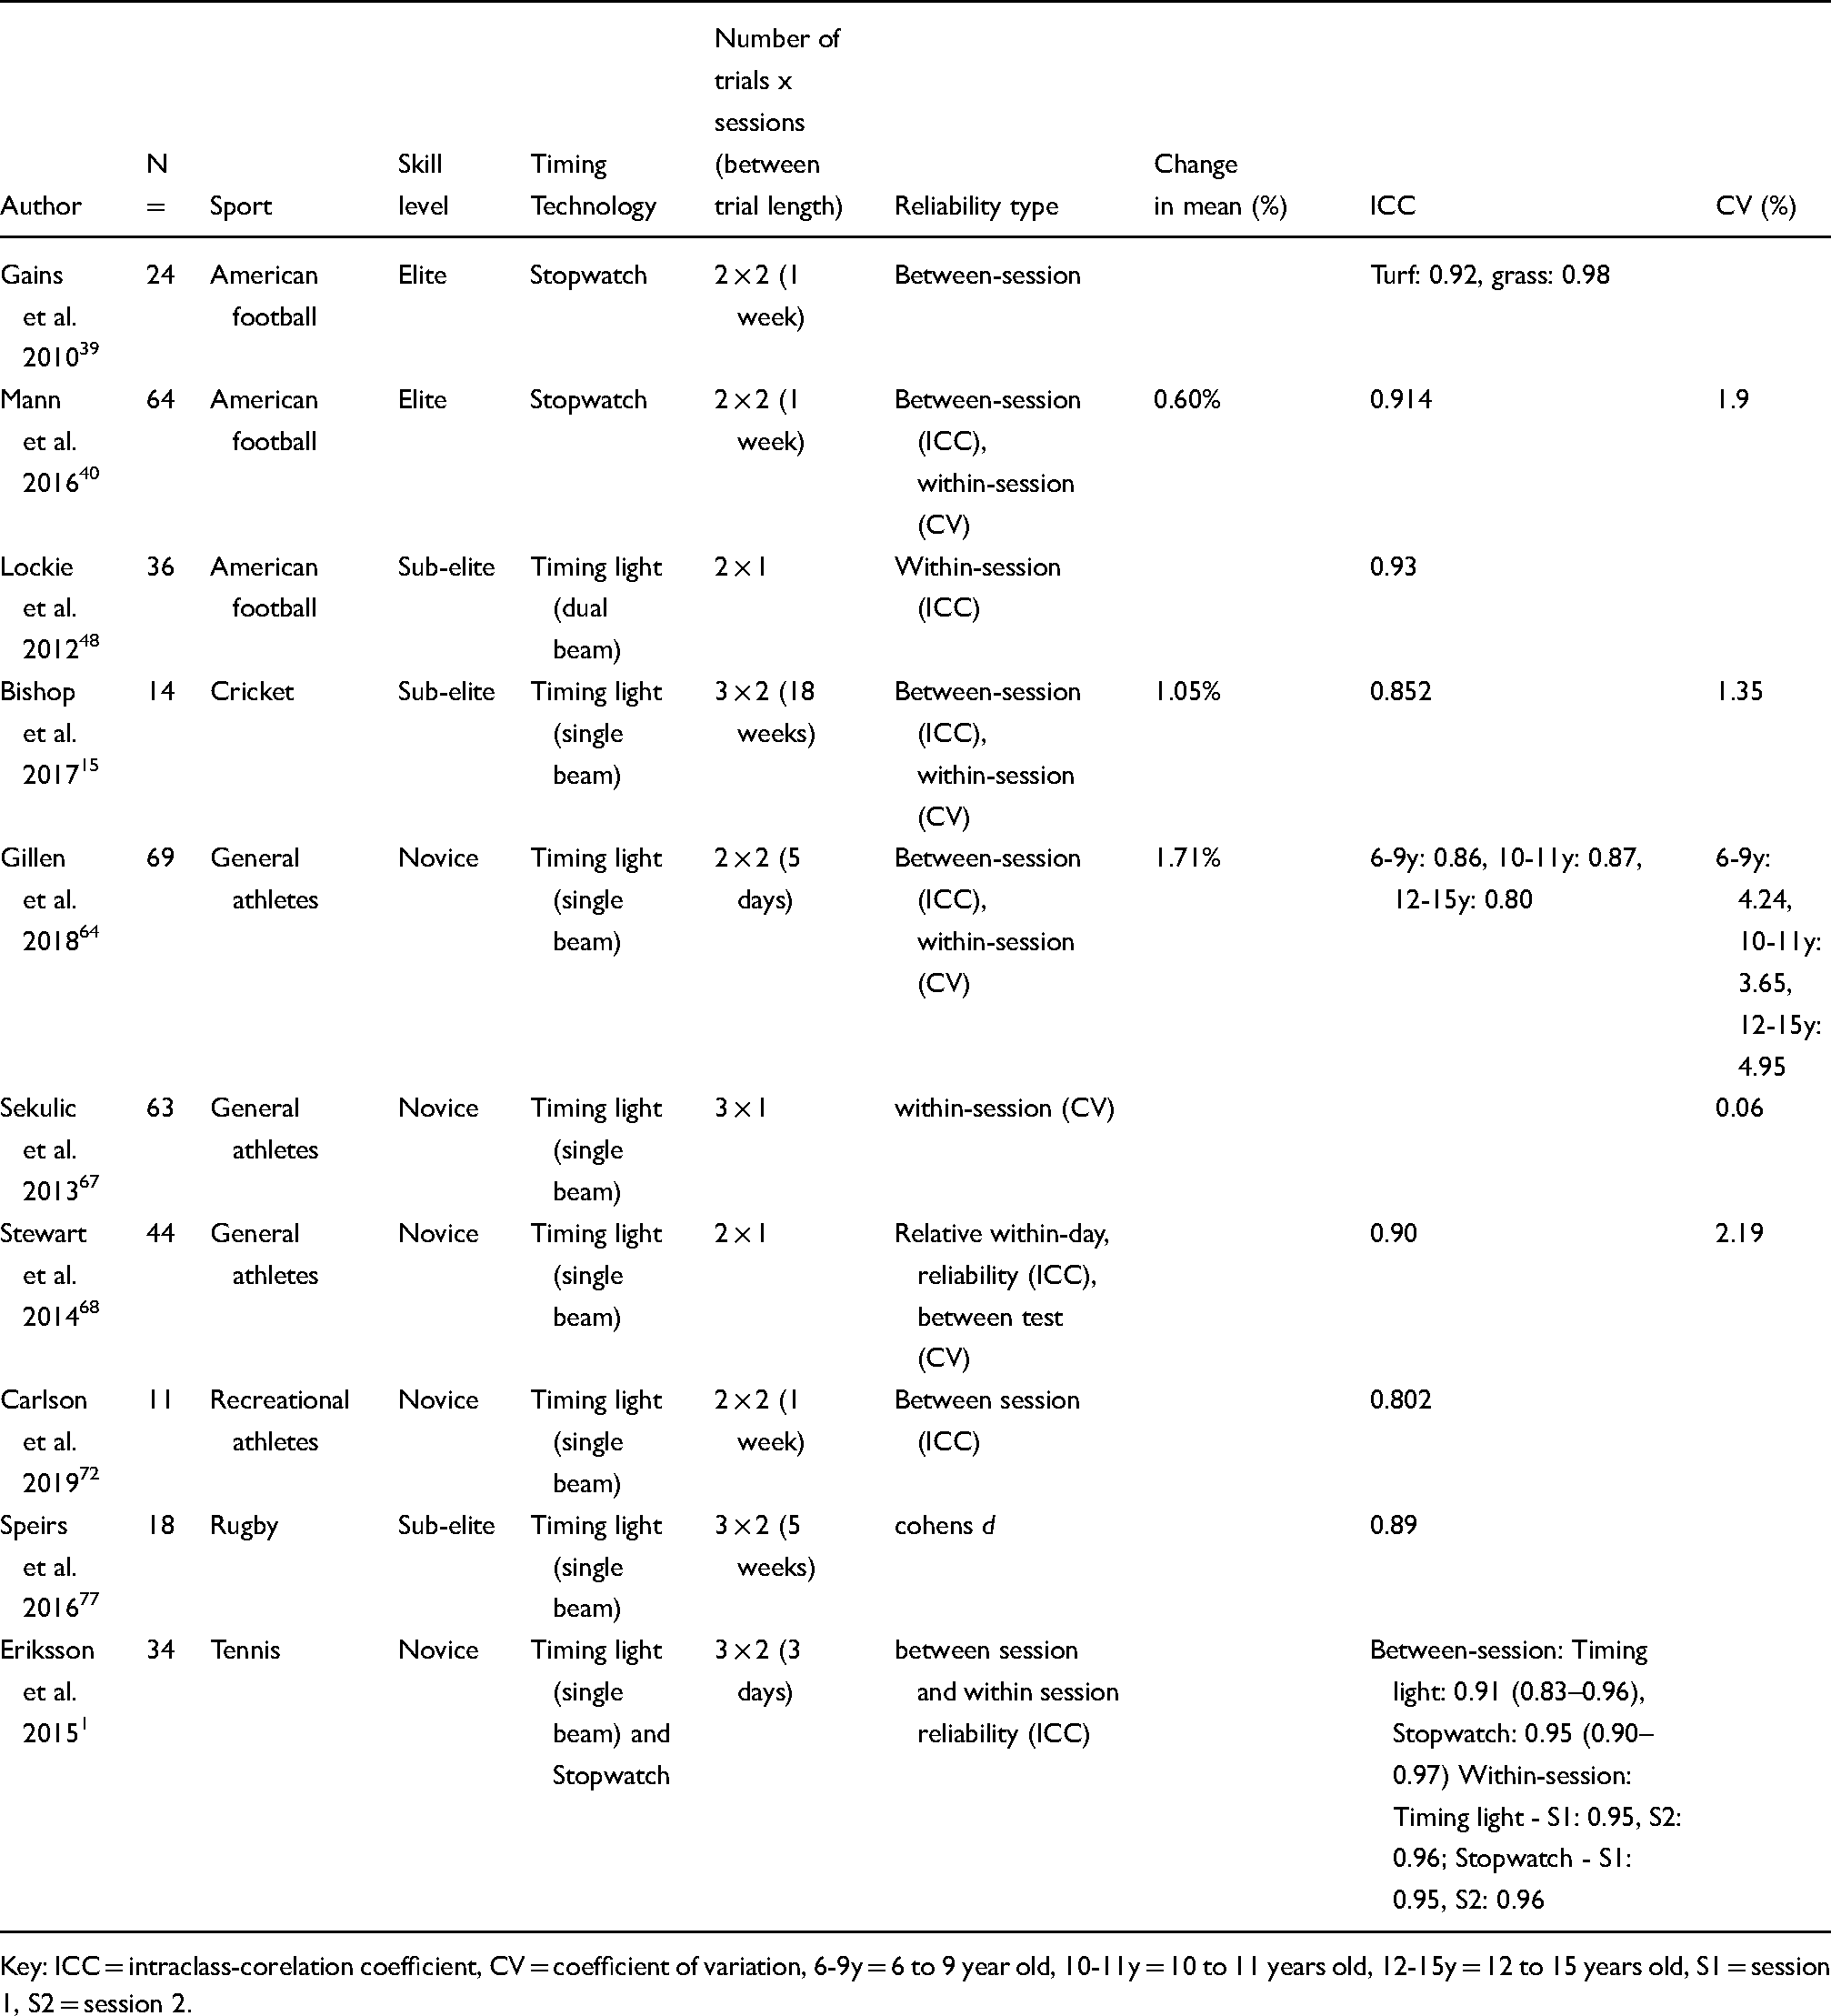
Key: ICC = intraclass-corelation coefficient, CV = coefficient of variation, 6-9y = 6 to 9 year old, 10-11y = 10 to 11 years old, 12-15y = 12 to 15 years old, S1 = session 1, S2 = session 2.
The ICC gives insight into rank order consistency between repeated testing occasions. 33 Nine studies reported ICCs,1,15,39,40,48,64,68,72,77 with seven studies reporting between-session reliability.1,15,39,40,64,68,72 The ICC ranged from 0.80 to 0.98, the lowest reliability was found in a novice general athlete population, 64 the highest ICC reported in an elite American football populations. 39
The CV provides insight into the absolute consistency of measures and is calculated as a ratio of the SD to the mean 35 and presented as a percentage. Only five studies reported the CV for within-day reliability.15,40,64,67,68 The CV ranged from 0.06% to 4.95%. The lowest and highest CVs were found in novice general athletes,64,67 indicating low individual consistency and high variability of within-session measurement within the novice population.
In terms of the reliability associated with the various technologies, it seems that infrared timing light technology (ICC = 0.80–0.96; CV = 0.06% - 4.95%) is less stable than stopwatch measures (ICC = 0.91–0.98; CV = 1.9%). In saying this, if variability in performance is picked up by a more accurate technology (i.e. infrared timing lights) it may be resultant of biological error (i.e. fluctuation in performance) which stopwatch is unable to detect. It should be noted that most studies used single beam timing light technology. Seven of these studies1,15,64,67,68,72,77 reported the reliability of single beam timing lights, only one study 48 reported the reliability of dual beam timing lights, and three studies1,39,40 reported reliability of stopwatches.
Overview of skill level
Mean pro-agility time across all studies was 5.00 ± 0.86 s, ranging from 4.17 to 6.06 s (Figure 2A). Averaged times for skill levels were 4.61 ± 0.29 s in elite, 4.91 ± 0.44 s in sub-elite, and 5.32 ± 1.14 s in novice athletes. When examining the performance times of each skill level, an overlap in pro-agility performance range was observed between the sub-elite and novice skill levels (Figure 2B). However, when using an averaged trendline, it was observed that there was a 0.30 s difference in mean pro-agility time between elite and sub-elite (4.61 ± 0.29 and 4.91 ± 0.44 s, respectively) and a 0.41 s difference between sub-elite and novices (4.91 ± 0.44 and 5.32 ± 1.14 s, respectively).
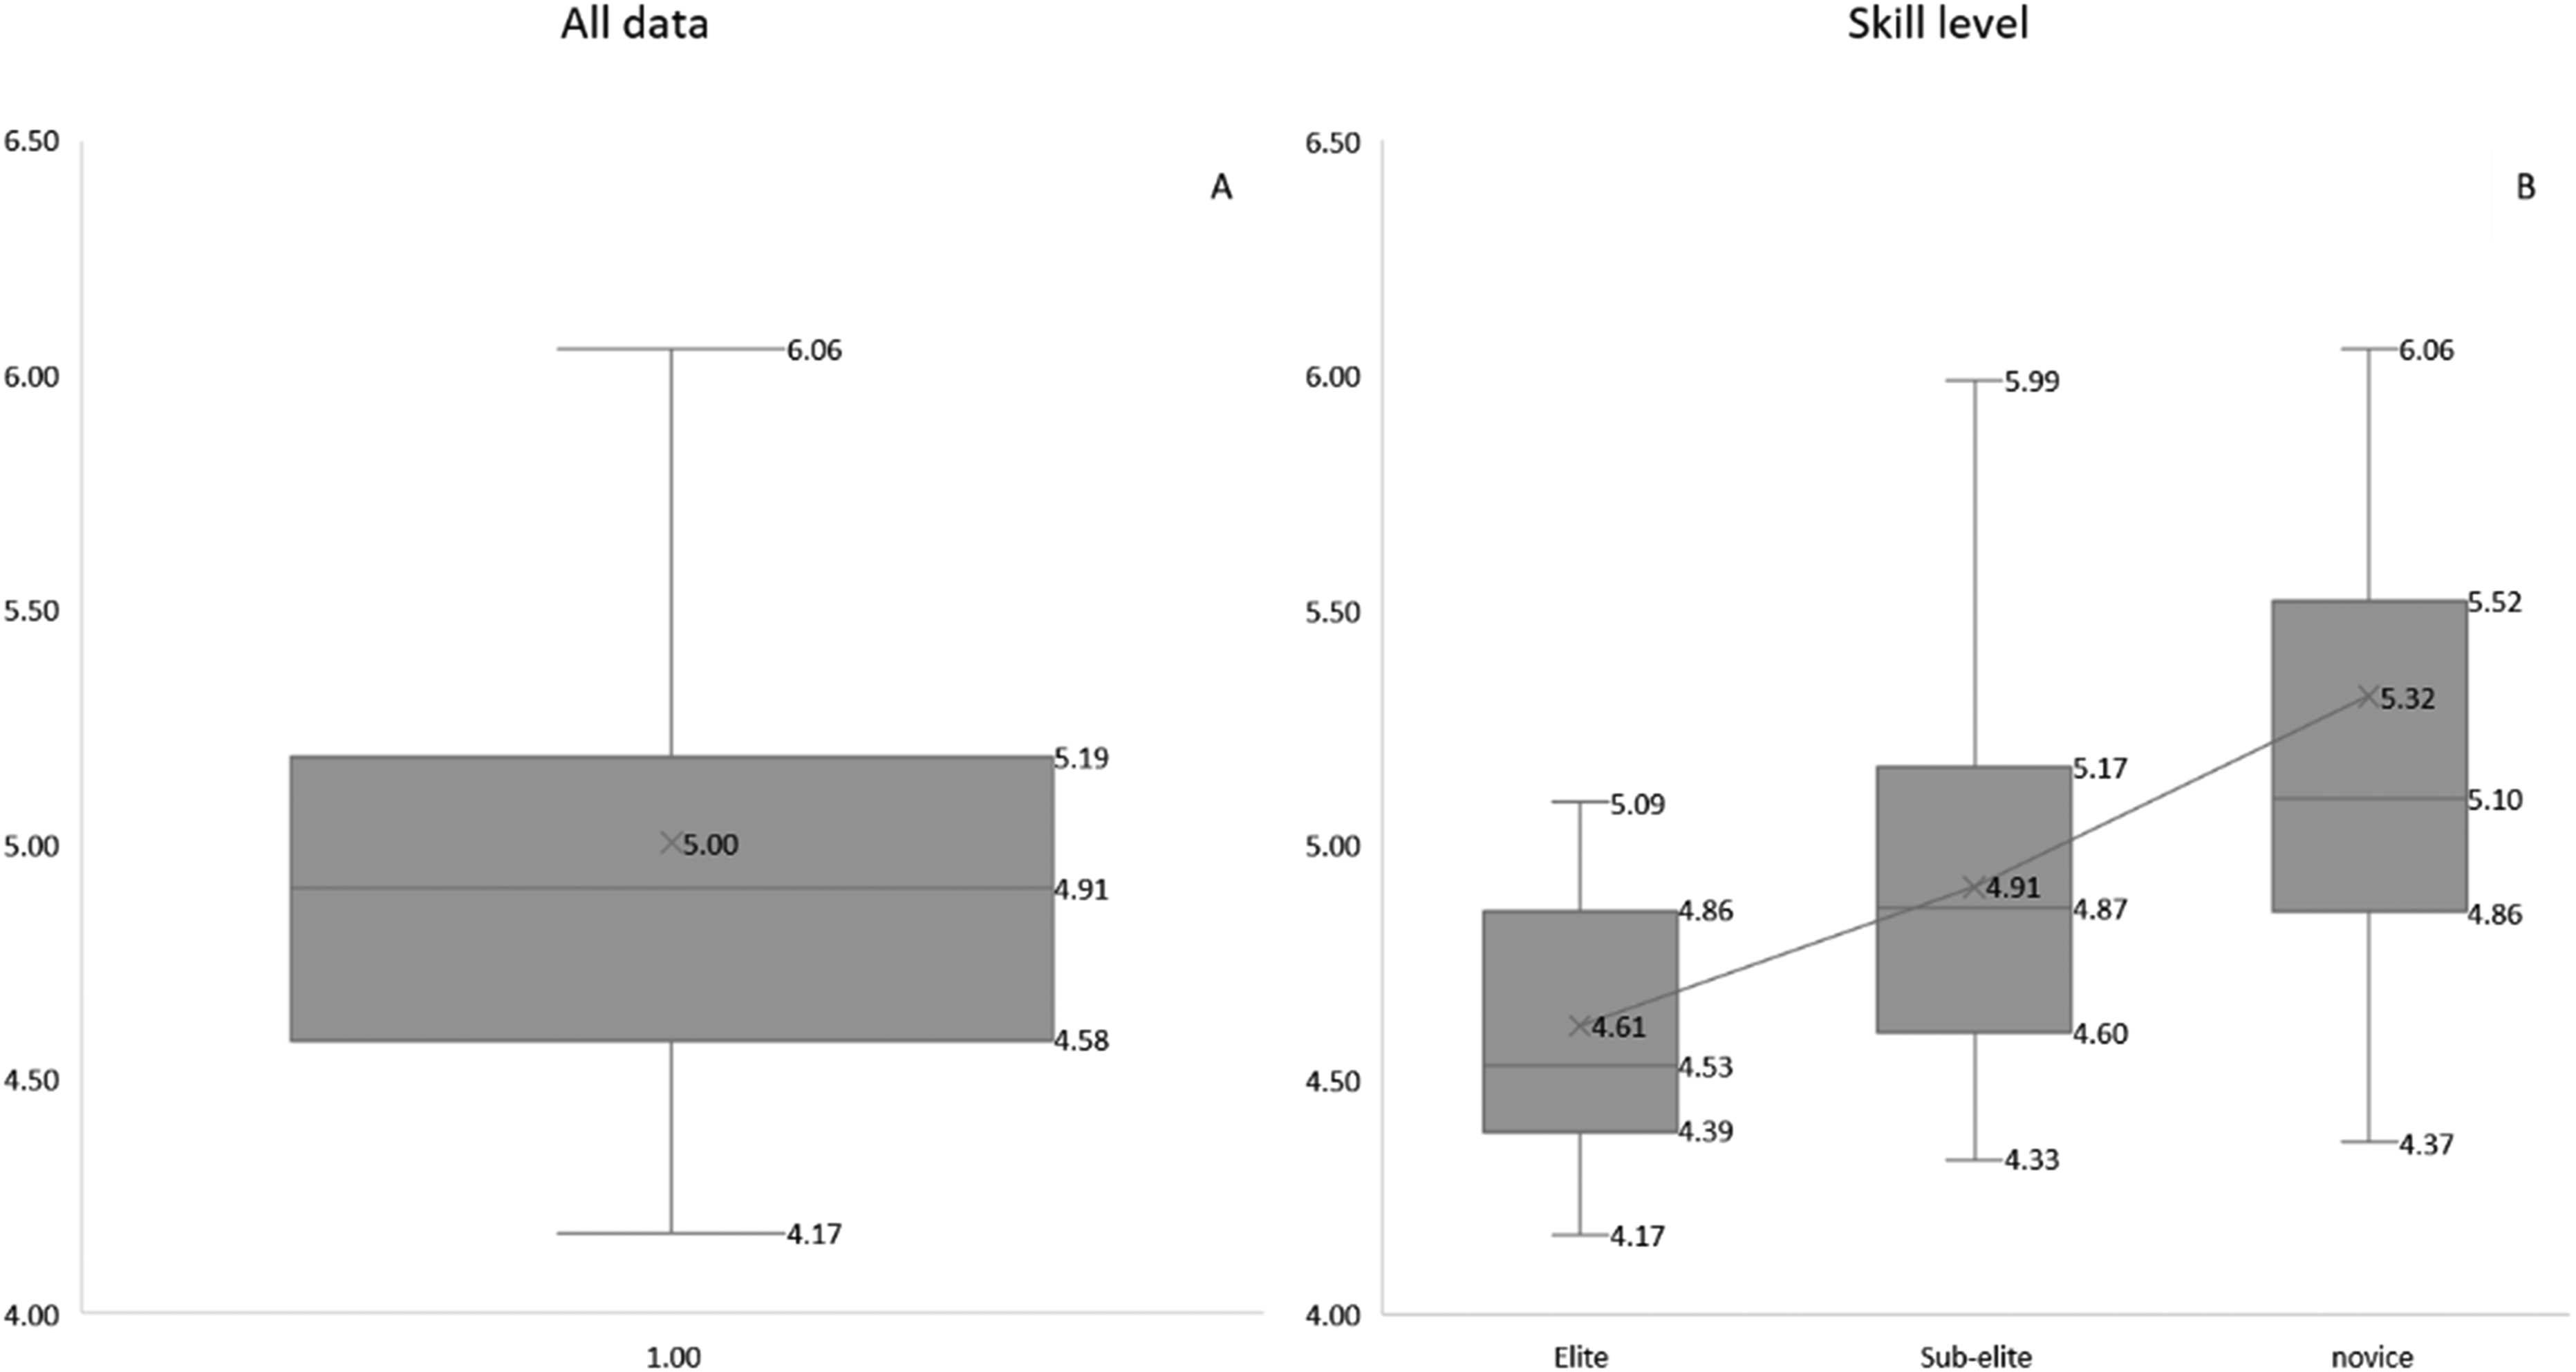
Averaged and skill level performance quartiles.
In Figure 2A quartiles for averaged data across all studies are presented. The lower quartile can be observed between 4.17–4.58 s and represents the fastest 25% of pro-agility times, with the middle 50% of times between 4.58–5.19 s, and the slowest 25% between 5.19–6.06 s presented in the upper quartile. The quartile rankings for each skill level (elite, sub-elite, and novice) are presented in Figure 2B. The fastest 25% of performance times for each skill level are between 4.17–4.39 s in elite athletes, 4.33–4.60 s in sub-elite athletes, and 4.37–4.86 s in novice athletes.
Overview of sports
An overview of the performance times per sport is shown in Figure 3. Based on percentile ranks of all included literature, the fastest 25% (lower quartile) of pro-agility times include elite and sub-elite American football athletes. The middle 50% of all times was represented by elite general athletes (4.64 ± 0.33 s), basketball (4.72 ± 0.29 s), cricket (4.75 ± 0.18 s), novice American football (4.80 ± 0.42 s), ice hockey (4.86 ± 0.18 s), sub-elite and novice rugby athletes (4.86 ± 0.28 and 5.15 ± 0.01 s, respectively), elite and sub-elite lacrosse athletes (4.99 ± 0.24 and 4.88 ± 0.34 s, respectively), resistance-trained athletes (4.92 ± 0.07 s), elite soccer (5.06 ± 0.04 s), and tennis athletes (5.10 ± 0.04 s). With the slower 25% (upper quartile) of athletes being recreational athletes, (5.27 ± 0.25 s), novice soccer (5.30 ± 0.12 s), novice general athletes (5.94 ± 1.81 s), and swimming athletes (6.05 ± 0.12 s).
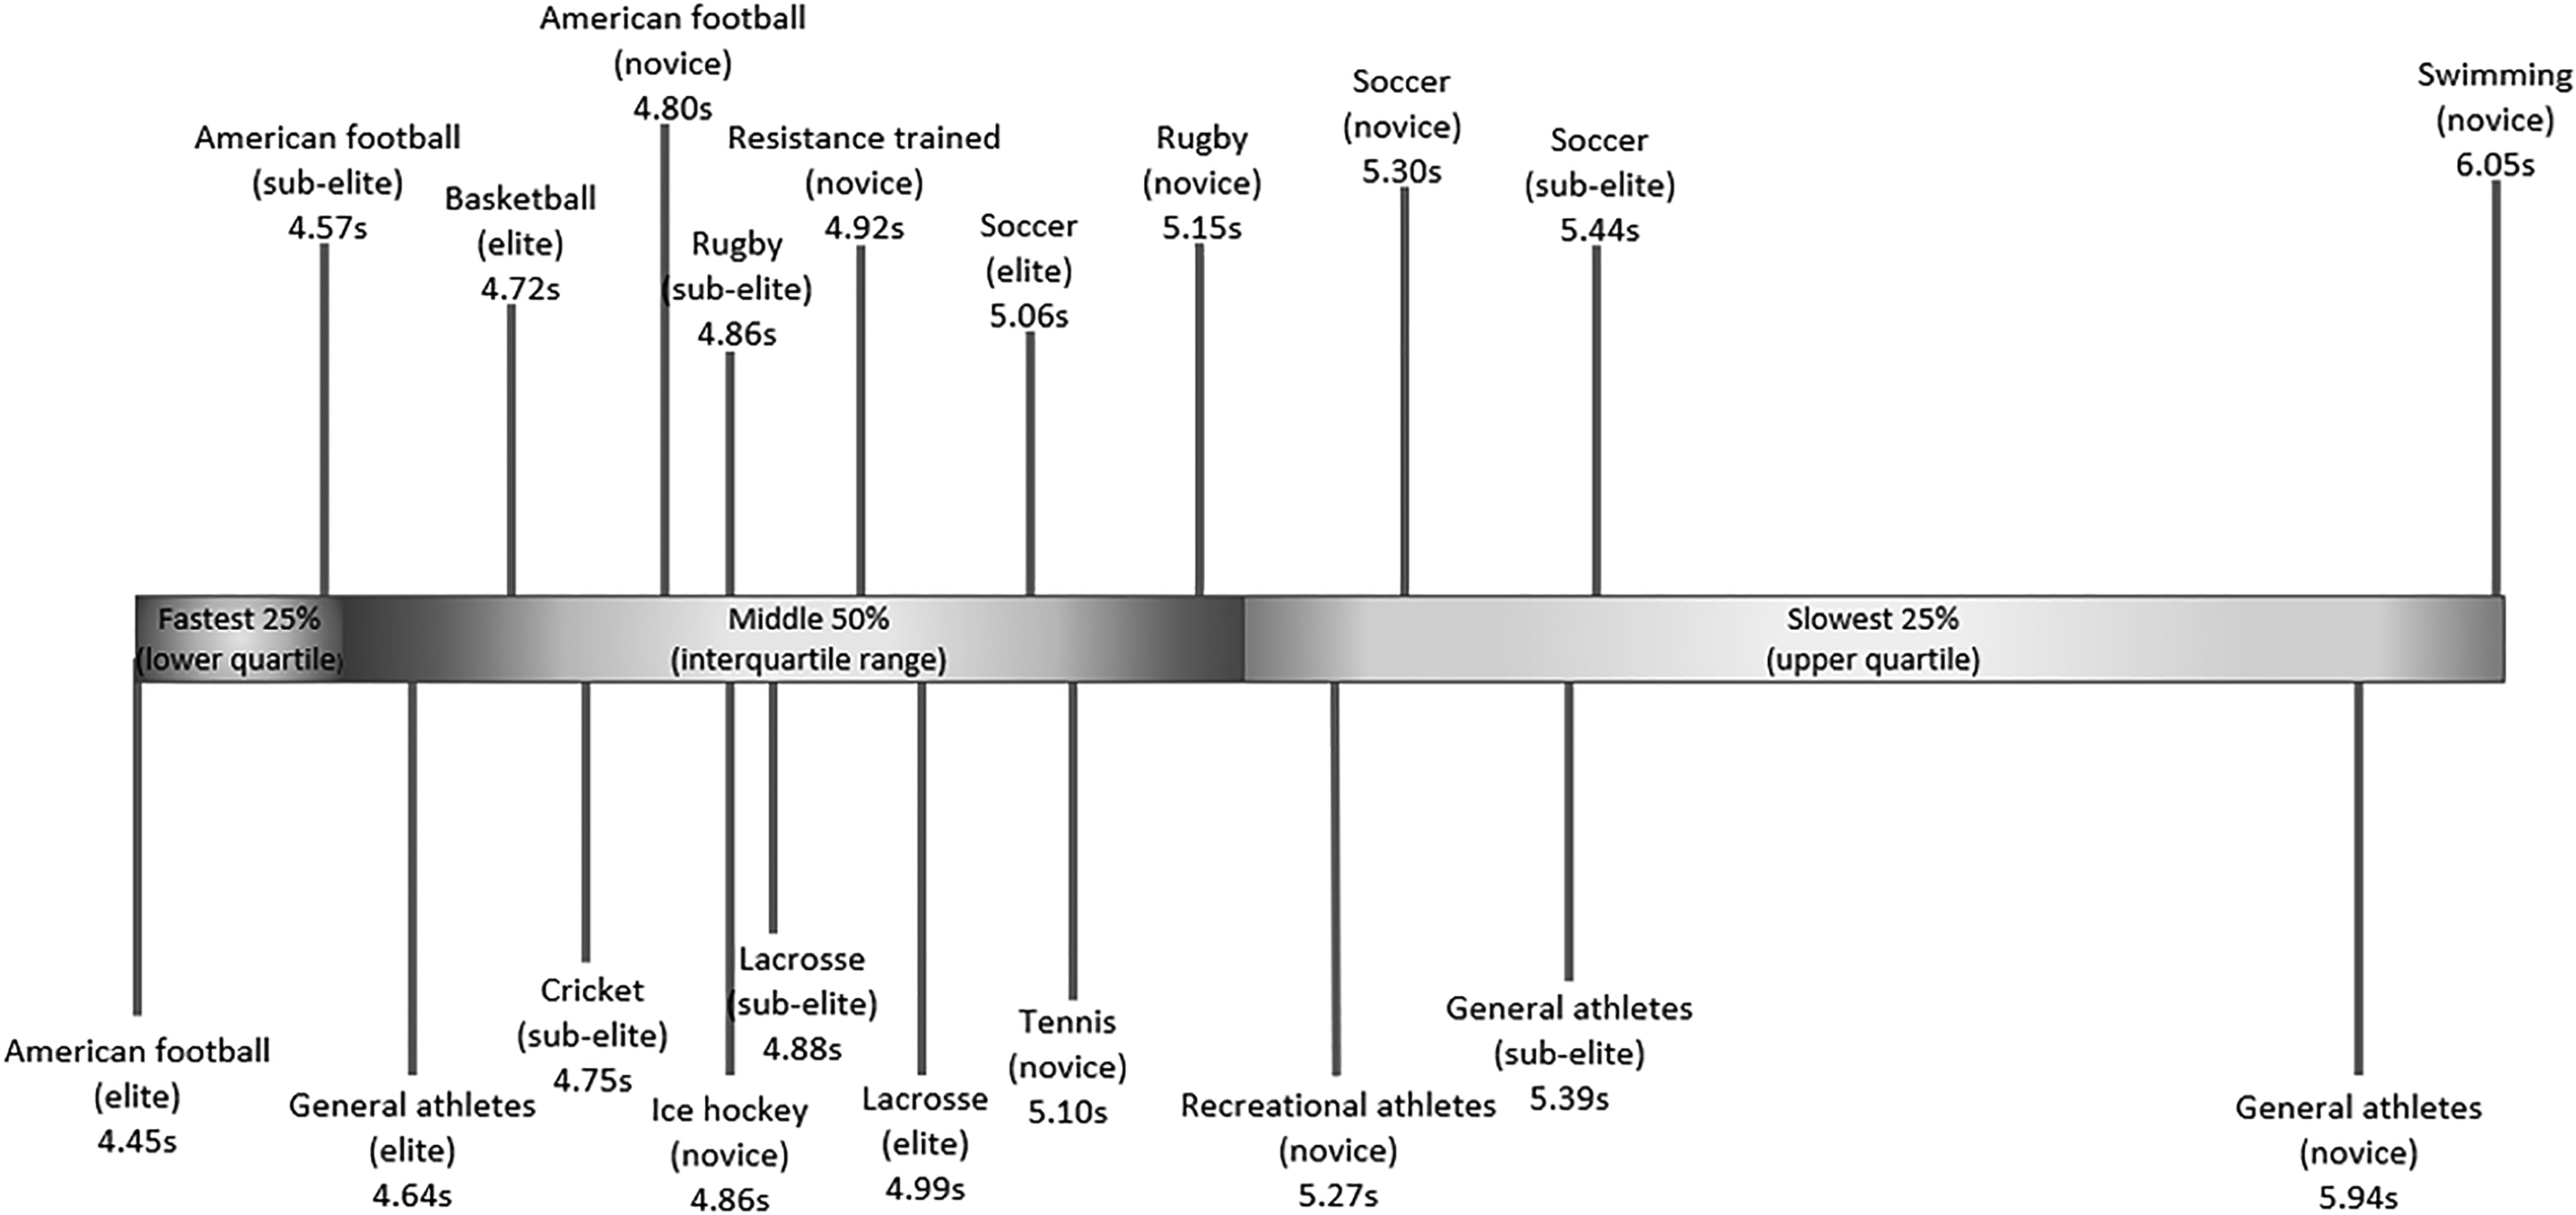
Normative performance timeline.
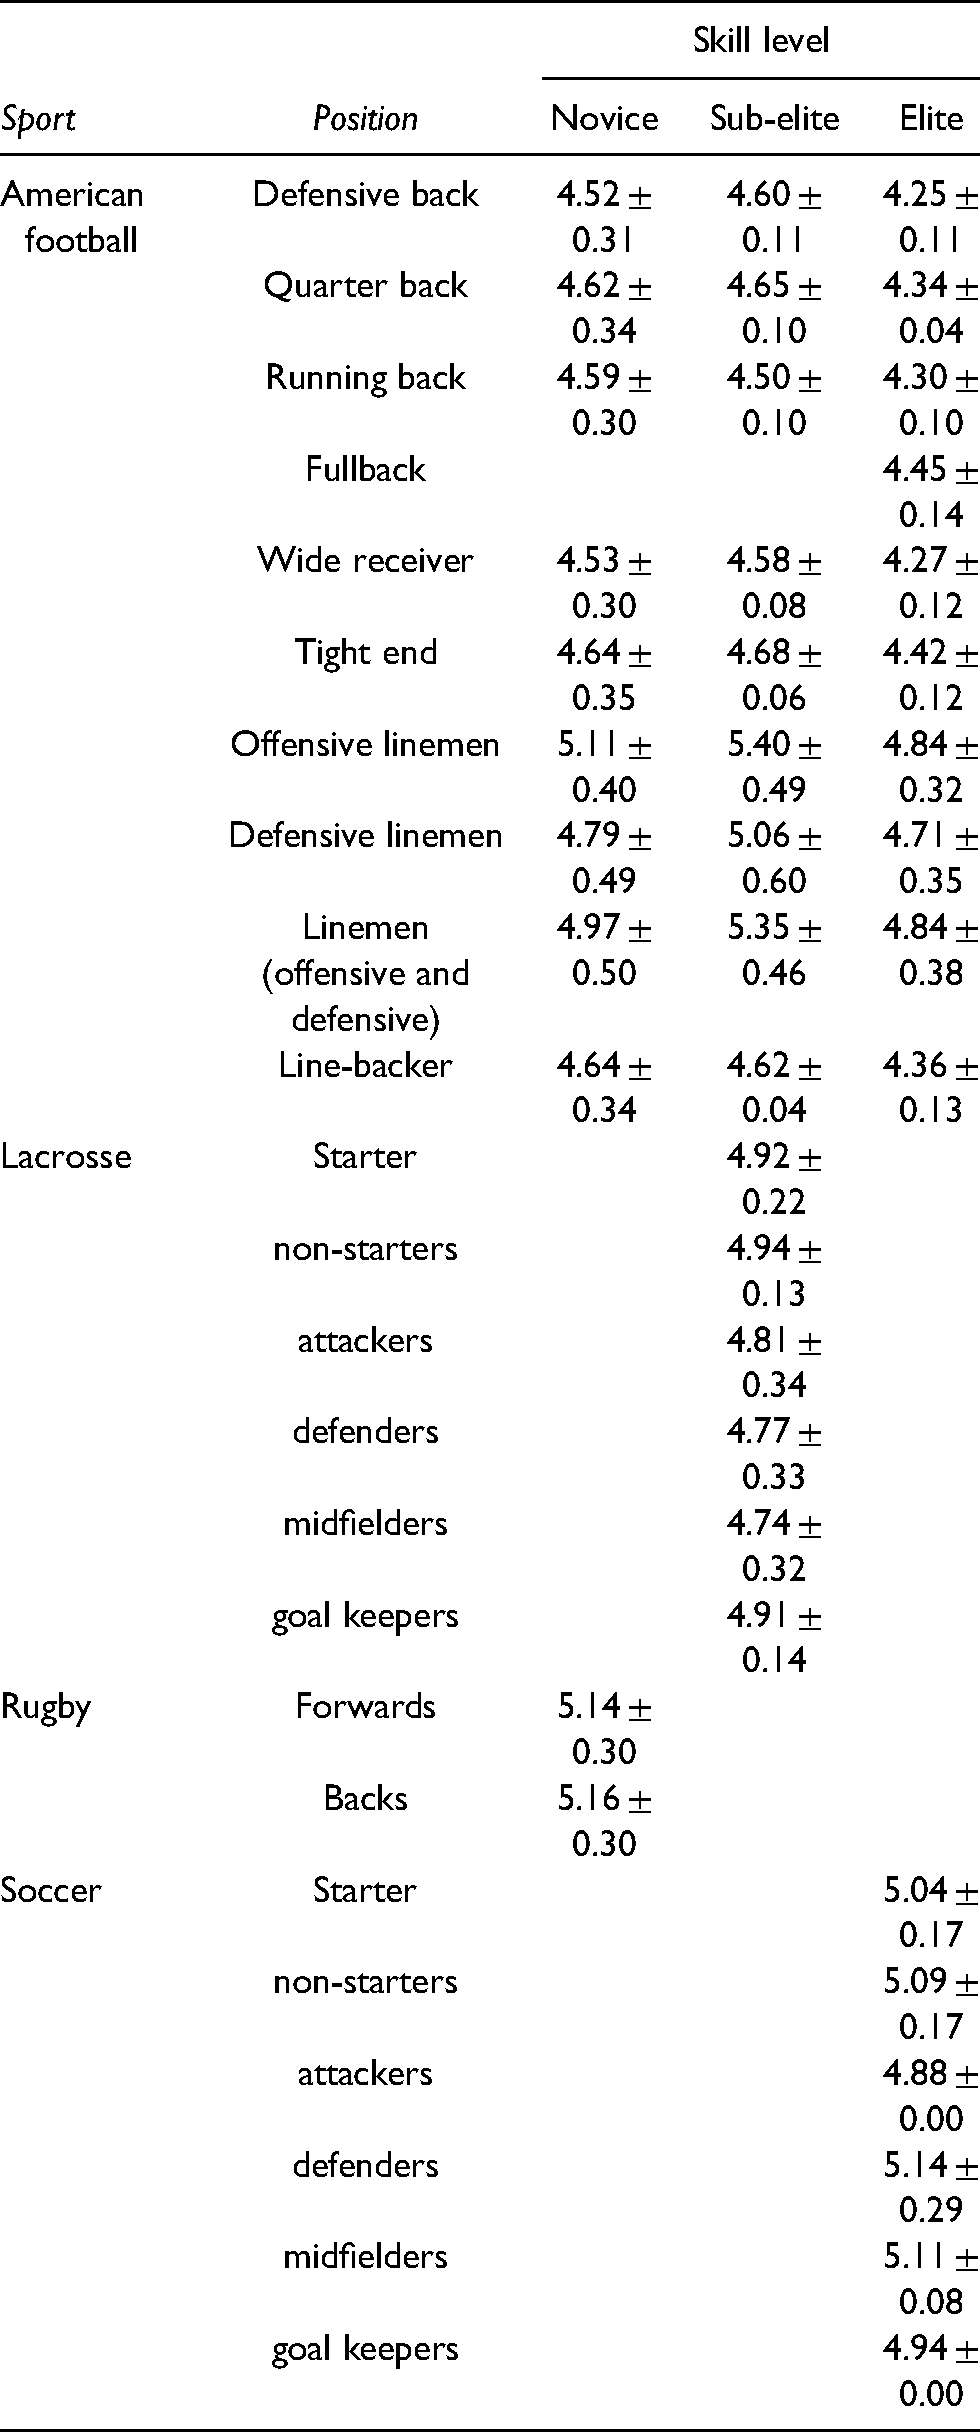
As for positional performance findings (Table 5), American football was the only sport to provide pro-agility times in novice, sub-elite, and elite skill groups. Interestingly, at both novice and sub-elite levels pro-agility time was not reported in the fullback position. In lacrosse, only sub-elite positional performance was reported. Similarly, the same was observed in novice rugby and elite soccer players.
Pro-agility positional differences.
Discussion
This systematic review aimed to identify the reliability and established normative values for performance time in the pro-agility shuttle from the available literature. To the authors knowledge, this was the first study to establish variability and normative data of pro-agility performance across different sports, skill levels, and positions. Pro-agility times from relevant literature have been collated and synthesised to provide an overview of test variability, categorical performance values, and guide identification of ability relative to sport, skill level, or player position in the pro-agility shuttle (where applicable). 27 However, there was limited data pertaining the use of the pro-agility shuttle test across the different skill levels in each sport.
Hopkins, 35 believes measures of change in mean, relative (ICC), and absolute (CV) consistency need to be reported to fully understand the reliability of measures.35,89 Only three studies15,40,64 reported all three measures of reliability, only one study 68 reported the CV and ICC, and six studies1,39,48,67,72,77 reported a single reliability measure.
To quantify the repeatability of measures for a given performance task, reliability of measures should be determined over multiple testing occasions i.e. test-retest reliability. Additionally, to understand the effectiveness of a training programme, coaches must be confident that the tests they use are consistent across multiple testing occasions. Generally, three testing occasions are needed to observe whether changes in measures are becoming more consistent. Only seven studies1,15,39,40,64,72,77 reported test-retest reliability and these were only conducted over two testing occasions. All other studies calculated within session reliability. Furthermore, the pro-agility as it stands provides limited diagnostic value due to total-time being a single measure of performance. 12 Whereas advancing diagnostic capabilities of the pro-agility to differentiate between acceleration, deceleration, and COD measures would provide further insight into the capabilities of underlying physiological components is of value to applied practitioners, and may be used to guide COD programming.
From this review, it appears that stopwatches and timing lights are the most commonly used technologies to measure performance time of the pro-agility shuttle (Table 4). While these technologies are portable and easily available resources to applied practitioners, the technologies reported in these articles are not without limitations. It would be logical to assume that measures from infrared timing light technology would be more stable than stopwatch measures. This assumption is not supported with the presented data, as there is greater variability reported for infrared timing light technology, compared to stopwatch measures. However, data pertaining to infrared timing light technologies was represented more in novice and sub-elite athletes. This may increase variability due to less developed neuromuscular capacity to perform more complex movement patterns resulting in more variation in performance.90,91 Additionally, stopwatch measures reliability was limited to two sporting populations (American football and tennis). Therefore, while present data does not support the above assumption, we suggest additional research be conducted to establish a meaningful conclusion.
Interestingly, a single study quantified performance using dual beam timing light technology. 48 While timing lights provide practitioners with more precise measurement of time, Cuthbert, Dos’ Santos 92 reported moderate to relative reliability in single-beam timing lights (ICC = 0.63–0.86), acknowledging this could be improved with the use of dual beam timing lights. 93 Previous sprinting studies with dual beam timing lights have been shown to elicit greater accuracy of measurement compared to single beam lights94,95 as dual beam systems are thought more accurate and reliable due to both lights having to be broken to record a time i.e. mitigating false triggers such as a hand breaking the infrared beams. However, this was counter to findings in this review, as dual beam was observed to be less reliable (ICC = 0.76) in sub-elite American football athletes, 48 compared to studies using single beam lights (ICC = 0.80–0.90) in sub-elite cricket and rugby, and novice general athletes.15,16,64,67,68,72,77
While some single beam timing lights have built-in software to prevent false triggers from occurring, such as the SPARQ XLR8 timing system (SPARQ Products, Oconomowoc, WI, USA) used by Carlson, Fowler, 72 other studies using single beam timing lights did not utilise this technology.1,15,64,67,68,77 Therefore, while both single and dual beam timing lights can be used reliably, it is clear that dual beam timing lights provide more accurate measures. However, single beam and stopwatches can be used, through practitioners should take caution when interpreting results with regards to consistency of the technology used to measure pro-agility performance.
Some scientists have arbitrarily chosen an analytical goal of the CV being 10% or below and ICC greater than 0.70 for measures to have acceptable reliability. 26 In terms of this review all studies measuring reliability reported acceptable levels of reliability for the pro-agility shuttle., However, more variability was observed in novice athletes and general athlete populations, compared to elite and sub-elite American football (Table 4). Therefore, it is recommended that practitioners be aware of the performance variability associated with the pro-agility in novice and general athlete population.
The results show the pro-agility shuttle is used in practice and research across a number of sports.1,10,48,50,67,68,87,88 American football comprised nearly 40% of all reviewed studies and 95% of all subjects. This could be due to the fact that most American football testing batteries include the pro-agility shuttle, and test performance has implications for NFL draft status.10,22,23,36,47 However, since other sports, such as soccer, cricket, and tennis include many changes of direction,7,15,96,97 the utility of the pro-agility shuttle could benefit sports which require multiple high degree directional changes, as a measure of repeated 180° COD ability.
From the review, it is clear that skill level plays an important factor in pro-agility performance (see Figure 2B). As would be expected, elite athletes have been found to complete the pro-agility faster than sub-elite and novice athletes, across all sports, excluding lacrosse (Table 2). Elite athletes are likely faster as a result of more developed neuromuscular systems, enabling greater force capacity to perform more complex movement skills with high synergistic muscle activation and high rates of force development.90,91 Interestingly, findings from the similar spread in performance, indicate that sub-elite and novice athletes are characterised by similar athletic capabilities when it comes to 180° COD performance. 82 It is important to note however, the variation in number of studies found for the data presented in each sport, in terms of skill level and player positions. For example, lacrosse performance data gathered was mostly in sub-elite athletes,17,18,70,71 with elite athlete performance being reported in a single study. 20 Therefore, we recommend caution to be taken when interpreting values representative of single studies or skill levels.
The type of sport athletes participate in also appears to influence pro-agility performance. This is because each sport has specific requirements for performance. American football athletes had the fastest pro-agility time in comparison to any other sports reported in this review. These faster performance times may be due to the historic use of the pro-agility in the NFL combine to identify specific components of athletic fitness.22,36,98 American football athletes perform better than other sports because it either might represent sport specific movement patters for this sport, or because these athletes spend more time practicing this movement. For example, because match performance may be more reliant on short accelerative and decelerative ability in American football athletes, sprints are shorter than that performed by rugby athletes.13,99,100
Additionally, applied practitioners need to select and administer performance assessments appropriately based on the context of the sport and physiological capabilities to be measured. 101 It would be thought that the pro-agility shuttle's current diagnostic capabilities are inefficient and limit the applicability of this test across a variety of sports, due to requiring large horizontal forces for multiple fast lateral movement over a small distance over ground.11,12,98 However, research has reported use of the pro-agility in novice youth swimmers to assess athlete ability to efficiently apply vertical and horizontal forces to initiate movement, and change direction relating to start and quick turn performance.87,88,102 Therefore, maximising ground reaction force and minimising ground reaction time should be a focus of programming for strength and conditioning coaches who are looking to develop athlete COD capabilities. 103
It is also of great importance for applied practitioners and coaches to understand the differences in performance values between the playing position of their athletes, and why these differences exist Robbins 43 substantiated this posit by concluding that athletic capabilities are partially moderated by playing position. The normative results of this review also indicate that mean performance times for each player position differ for American football, lacrosse, rugby, and soccer (Table 5). Therefore, positional normative values for the pro-agility should be used by practitioners who wish to be able to discern between positional performance differences.
A recent study by LaPlaca and McCullick, 98 found the pro-agility shuttle to be correlated to player performance. They concluded certain performance test results are significant for different player positions in American football. The study reported the pro-agility shuttle was correlated with better grades for offense. In offensive positions, pro-agility performance for players in the fullback position showed a correlation to the ability to avoid more tackles (r = −0.753). However, pro-agility performance weakly correlated with number of games played in centre and quarterback positions (r = −0.29, −0.34, respectively). This weaker correlation may be explained, for example, by being in the middle of the offensive line creating the nonessential need for centres to perform 180° degree change of directions, due to the amount of support which can be offered by nearby teammates. 98 In defensive positions, they reported weak correlations to pro-agility shuttle performance in defensive tackle position with more pressure, hits, and sacks per pass rush snap count (r = −0.22, −0.23, −0.25, respectively). Faster pro-agility shuttle performance was correlated, although weakly, with more interceptions per pass coverage snap count (r = −0.29). Additionally, in the strong safety position slower pro-agility shuttle performance was correlated with tackling performance (r = 0.37). However, these findings are unsurprising, due to the performance demands of playing in defensive positions does not inherently require high 180° COD ability (i.e. ability to decelerate and change direction suddenly).23,43,98
Pro-agility times for rugby players (novice backs and forwards) has been reported in one study only. 19 There was no observable difference in pro-agility times between the two positional groups (5.14 ± 0.3 and 5.16 ± 0.3 (respectively)). In the case for lacrosse athletes, where minimal differences were observed between attack, midfield, and defender positions, with goal keepers reported to be the slowest of the sub-elite athletes. While attackers, midfielders, and defence players cover the field, the goal keepers cover the goal, thereby moving the least of all players. Goals in lacrosse are smaller than those used in hockey. Therefore, first step quickness may be more influential than 180° COD (i.e. they can stay in the frontal plane more instead of transitioning between sprinting, decelerating, and turning). This would be the opposite for soccer athletes; individual position times for goal keep (4.94 ± 0.00), defenders (5.14 ± 0.29), midfielders (5.1 ± 0.08), and attackers (4.88 ± 0.00) were reported in elite athletes. 8 Interestingly, faster pro-agility times were reported in goal keep and attacker positions. The physical and technical constraints imposed upon goal keepers may explain this, as they are required to perform high-intensity lateral movements and sprints over 5 m with a high rate of force development and application, while being co-ordinated.104,105 As for swimming athletes, they presented the slowest times (6.05 ± 0.12). It would be expected for swimmers to present the slowest times over all sports, as assessments should reflect the demands of the sport, and swimmers may have the slowest times because of the limited applicability of over ground assessment to water sports. Nonetheless, further research needs to be conducted into positional differences in other sporting codes at the different skill levels before a comprehensive analysis of positional differences can be determined.
This review was the first to establish normative performance values for the pro-agility shuttle, across different sporting codes. While being the catalyst, this also presented itself as a limitation for this review. Given the limited data presented in literature, comprehensive identification of normative pro-agility times could not be established, except for American football, throughout the range of sports and their respective skill levels. Therefore, an overview of pro-agility performance was identified, with normative values for each skill level and player position being reported where appropriate. Additionally, values represented by few or single studies should be interpreted with caution. Given the paucity of research in basketball, cricket, ice hockey, resistance trained athletes, and tennis athletes future research into pro-agility performance in these sports is recommended. Additional evidence in the aforementioned sports would be valuable to further understand the representation of pro-agility performance and better establish pro-agility normative values. It should also be noted that athletes from different genders, specific training methods, and training ages were not characterised in this review. Future research should explore the inclusion of other technologies, such as additional timing lights, smartphone camera, inertial sensor or radar technology to provide advancement to the diagnostic protocol of the pro-agility test Nonetheless, future analysis of pro-agility performance and diagnostic protocol advancement presents itself to be necessary in order to establish comprehensive normative data within a wide range of sports and provide insightful value to applied practitioners.
The results of this review demonstrate the utility of the pro-agility shuttle, concluding the test to be reliable when using stopwatch and timing light measurement technology. It would seem from the data reviewed that a comprehensive understanding of the reliability of the pro-agility is yet to be established. Test-retest methodologies that use a comprehensive suite of reliability statistics are essential to fully understand the reliability of the pro-agility test Furthermore, establishing variability between single and dual beam timing lights, and the reliability associated with other technologies such as smartphone camera, radar, contact mat, etc. is needed. This review provided normative values that practitioners can use to understand performance in sport, skill level, and player positions. It was also the first to collectively provide normative pro-agility performance data across a range of sports and present areas requiring investigation. It was apparent the sporting context influenced pro-agility performance. However, whether the movement patterns associated with these sports is assessed specifically within the pro-agility is unclear i.e. the ecological validity of the pro-agility across these sports for quantifying COD capability. Additionally, the current diagnostic value of the pro-agility is limited as it provides practitioners with a total-time. Higher level diagnostics could be achieved by breaking the test into sub-components; however, the reliability, validity, and utility of these sub-component performance measures would need to be established. Additionally, whether other technologies such as inertial sensors, smartphone videography, and radar can add value to the diagnostics needs to be explored.
Practical applications
Practitioners wishing to understand their athletes’ 180° COD ability should look to use the pro-agility shuttle to assess repetitive 180° COD ability. The pro-agility shuttle can help provide insight into acceleration, deceleration, and 180° COD capabilities: critical movements in most field and court sports. As such, practitioners should look to use normative values as guidelines to compare relative performance to gauge and monitor athlete performance. Furthermore, practitioners should think about maximising ground reaction forces while minimising ground reaction time in order to develop pro-agility performance. In addition, the normative values established, across the various sports examined, may be used to set attainable goals appropriate to the sport, position, and skill level in context. While practitioners should utilise the technology available to them for pro-agility shuttle assessment. We recommend practitioners use dual beam timing lights as a first choice for talent identification and athletic development, as they have the greatest accuracy of measurement, however, for daily monitoring stopwatches are sufficient, and best practice guidelines should be followed. For example, some single beam timing lights may have different software to prevent false triggers from occurring. Therefore, practitioners should utilise the same timing technology to allow for consistency of measurement.
Footnotes
Declaration of conflicting interests
The author(s) declared no potential conflicts of interest with respect to the research, authorship, and/or publication of this article.
Funding
The author(s) received no financial support for the research, authorship and/or publication of this article.
