
Abstract
This study examined whether baseball pitchers at different competitive levels exhibit distinct fatigue patterns in ball speed and lower-limb neuromuscular function during a prolonged simulated game. Twenty right-handed collegiate pitchers (ten Division I, ten Division II) completed a seven-inning simulated game, throwing 15 fastballs per inning. Ball speed was recorded for every pitch, and countermovement jump (CMJ) and rating of perceived exertion (RPE) were assessed pre-game and between innings. A mixed-design ANOVA (Group × Inning) was used to analyze ball speed, CMJ variables, and RPE. Ball speed showed a significant Group × Inning interaction (p = .04): Division I pitchers displayed only a small, non-significant decline across innings (Δ = −2.88%), whereas Division II pitchers demonstrated a significant reduction beginning in the third inning (Δ = −5.73%). In contrast, key CMJ mechanical variables showed significant main effects of Inning, with similar declines in both groups, and RPE increased progressively. These findings indicate that extended pitching induces comparable lower-limb neuromuscular fatigue across competitive levels, but only lower-level pitchers express this fatigue as an early decline in ball speed. CMJ may therefore serve as a sensitive, objective tool to complement ball speed when monitoring fatigue and managing pitching workload.
Keywords
Introduction
Baseball is a high-intensity, intermittent sport in which pitching has a decisive influence on performance and forms the core of defensive strategy. The pitcher's performance often determines the game outcome, and ball speed is widely regarded as a key indicator of pitching ability.1,2 However, effective pitching depends not only on velocity but also on the ability to manipulate pitch movement. Skilled ball-sport athletes can adjust their mechanics to influence ball trajectory, thereby enhancing deception and overall pitching effectiveness. 3 Pitching is a complex whole-body skill that depends on an efficient kinetic chain to transfer force from the lower to the upper extremities in order to generate high ball speed while maintaining stability and accuracy.4–6 In addition, the ground reaction forces (GRFs) produced by the lower limbs are an important determinant of ball speed, with greater GRFs associated with faster pitches, 7 underscoring the indispensable role of the lower extremities in pitching. As competitive standards in baseball have risen, average pitching velocity has increased. However, higher ball speed has also been linked to a greater risk of upper-extremity injury. 8
Pitching workload has been recognized as a key factor influencing both performance and injury risk. Excessive workload and accumulated fatigue can reduce ball speed and control while increasing mechanical load on the upper extremity and the risk of overuse injuries. 9 However, a pitcher's total workload is not limited to in-game pitches; it also includes pre-game practice and warm-up throws between innings, and ∼40% of pitches thrown on a game day are not captured in the official pitch count. 10 In practice, pitch count and ball speed are commonly used to monitor fatigue, but relying solely on these measures may underestimate the true physiological load and fail to fully capture the underlying fatigue status. 11 Exercise-induced impairment of neuromuscular function, termed neuromuscular fatigue (NMF), is characterized by reductions in maximal voluntary force and rate of force development, together with altered motor-unit recruitment and firing patterns, thereby compromising maximal strength and explosive power. 12 Such neuromuscular impairments may negatively affect on-field performance in baseball athletes.13,14 Previous studies have shown that NMF can adversely affect pitching-related outcomes, including reduced ball velocity, increased pain and perceived fatigue, and altered pitching mechanics.14–17 Because pitching force is generated through a coordinated proximal-to-distal sequence, and lower-extremity GRF is closely related to ball velocity, 18 reduced efficiency in the proximal segments may disrupt the kinetic chain. This may increase upper-extremity compensation and mechanical loading, 19 accompanied by greater elbow varus torque. 17 In addition, lower-extremity strength may decline as pitch count increases and has been significantly associated with reduced ball velocity. 20 These findings suggest that NMF not only impairs force production but may also increase compensatory movement and injury risk. If not properly monitored, it may substantially affect performance and increase the risk of musculoskeletal injury.21,22
The countermovement jump (CMJ) is one of the most commonly used methods for monitoring NMF in both individual and team sport settings.23,24 It has been shown to effectively assess lower-extremity neuromuscular status, 25 and several CMJ-derived variables have been associated with baseball pitch velocity and injury risk to varying degrees. 26 Among these, peak power (PP) and concentric impulse (CIP) have been shown to be related to fastball velocity and momentum-generation capacity in Division I collegiate pitchers, while studies in professional pitchers have also supported the association between lower-extremity jump performance and pitch velocity.27,28 In addition, variables related to peak force (PF), eccentric rate of force development (ERFD), and CIP have also been linked to elbow loading and injury risk.13,29 As for the modified reactive strength index (mRSI), direct evidence in baseball pitchers remains limited; therefore, it was included in the present study as a supplementary indicator of rapid force-production strategy. Overall, CMJ is a practical tool for monitoring lower-extremity neuromuscular status in pitchers and may reflect both acute and accumulated NMF. Given its ease of use across devices ranging from portable systems to laboratory-grade force plates, CMJ has been widely adopted in applied and research settings and was therefore selected in the present study. As force plate technology becomes increasingly integrated into applied sport settings, some systems can now provide relevant mechanical variables in real time, further improving the feasibility and practical value of this monitoring approach.
Prior research has shown that baseball pitchers of different ages and competitive levels exhibit distinct fatigue profiles during extended pitching. In youth pitchers, increasing pitch count is associated with reduced ball velocity, greater pain, and higher perceived exertion, whereas upper-extremity kinematics remain relatively stable. At the same time, changes in knee flexion at ball release and hip–shoulder separation suggest that fatigue may emerge earlier in the lower extremities and trunk rather than in the upper extremity.17,30 In higher-level pitchers, ball velocity often remains stable despite accumulated pitching, but clear changes are still observed in lower-extremity kinematics, center-of-mass control, and stride mechanics. This suggests that pitchers may use compensatory movement strategies to maintain performance, potentially at the cost of greater upper-extremity loading and injury risk. 31 This pattern is also supported by evidence from cricket fast bowling. Previous studies have shown that skilled athletes may use functional movement variability and individualized grip and body-kinematic strategies to maintain delivery speed and ball-release characteristics.32,33 Therefore, maintaining ball velocity under fatigue does not necessarily indicate the absence of fatigue, but may instead reflect better movement adaptability. Consistent with this view, recent studies using CMJ to monitor simulated games have shown that lower-extremity NMF can still be detected even when ball velocity remains unchanged. This suggests that relying only on ball velocity or pitch count may underestimate true fatigue status. 34 Therefore, CMJ monitoring may provide a practical method for tracking fatigue and reducing injury risk in applied settings.
In summary, although previous studies have suggested that accumulated pitching workload may produce different fatigue responses across competitive levels, direct comparisons of ball velocity, perceived fatigue, and lower-extremity NMF during extended simulated games remain limited. Therefore, this study compared Division I and Division II collegiate pitchers using CMJ and related fatigue indicators to examine whether pitchers at different competitive levels exhibit different lower-extremity NMF responses under accumulated pitching workload. We hypothesized that pitchers across competitive levels would demonstrate lower-limb NMF, but that the trajectory of ball-velocity changes would differ between levels.
Materials and methods
Subjects
This study recruited ten Division I collegiate baseball pitchers (age 19.06 ± 2.04 years, body mass 74.70 ± 5.45 kg, height 178.62 ± 5.96 cm) and ten Division II collegiate baseball pitchers (age 22.20 ± 2.75 years, body mass 73.50 ± 9.40 kg, height 175.73 ± 5.65 cm). All pitchers were right-handed and used an overhand pitching style, defined as a delivery in which the throwing arm is positioned above shoulder level at ball release. 35 Inclusion criteria were: (1) being designated as a pitcher by the team coaching staff, (2) active participation in regular team training and official external competitions, and (3) no history of upper- or lower limb injury within the previous six months. Exclusion criteria were: (1) players who were not classified as pitchers or did not regularly participate in team training and competition, and (2) any upper- or lower-limb injury in the past six months. Each participant attended a single laboratory session. Before testing, the entire protocol was explained in detail, and the testing session, including warm-up and familiarization, lasted approximately 1.5 h. If a participant was unable to complete the training or testing protocol due to injury or any other reason, their personal data and measurements were excluded from the analysis. Prior to data collection, all procedures were thoroughly explained to the athletes, and written informed consent was obtained from each participant. The study protocol was reviewed and approved by the Institutional Review Board of National Taiwan Sport University (NTSUIRB-112-028), and all procedures were conducted in accordance with the ethical principles of the Declaration of Helsinki.
Pitching protocol
In the simulated game protocol of the present study, participants pitched from an indoor mound with the distance between the pitching rubber and home plate set at 18.4 m. A catcher was positioned in front of home plate at the center of the strike zone and served as the primary target for the pitchers. Although the catcher provided a fixed reference point, pitchers were not required to throw the ball into the strike zone; instead, they were instructed to aim precisely at the catcher's glove to standardize the pitching task and ensure that all pitchers completed the same number of pitches.
Before the experiment, each participant first performed a full-body warm-up according to their usual pre game routine, followed by approximately 10 min of catch play indoors to familiarize themselves with the pitching environment. According to the study protocol, each pitcher was required to complete seven innings of pitching, throwing 15 maximal-effort fastballs per inning, for a total of 105 pitches. The interval between successive pitches was not permitted to exceed 20 s, and a fixed 6-min rest period was provided between innings (including the other pitcher's throws and the time required for the catcher to return the ball). Prior to the start of the simulated game, up to 20 warm-up pitches were allowed, and no more than 10 warm up pitches were permitted between innings. The ball speed of the final five pitches immediately before the first inning was recorded and used as each pitcher's baseline velocity.
Following the formal warm-up and during each inter-inning rest period, pitchers were required to perform a CMJ test and provide a rating of perceived exertion (RPE) on a 1–10 scale to assess lower-limb fatigue and subjective exercise intensity. Two pitchers were tested simultaneously in each simulated game; therefore, given the sample size in this study, a total of 10 simulated games were conducted.
Pitch velocity
Ball speed (miles per hour) was measured using a commercially available radar-based tracking system (Pitching 2.0, Rapsodo, Inc., Brentwood, MO, USA). The device was set up and calibrated according to the manufacturer's instructions and positioned at the regulation pitching distance of 18.4 m between the pitcher's mound and home plate, facing the pitcher. The system provided real-time detection and recording of ball speed for each pitch, and these data were used for subsequent analyses.
CMJ test
During the CMJ testing, participants stood with their hands placed on their hips and their feet positioned on separate force plates to measure ground reaction forces (GRFs). Participants were instructed to remain still on the plates for approximately 3 s and then perform a vertical jump in response to the verbal cue “3, 2, 1, jump.” One second of stable standing data was used to determine body weight, calculated as the mean vertical GRF over that interval. The depth of the countermovement was not constrained; however, participants were instructed to minimize the time spent in both the downward and upward phases and to jump “as fast and as high as possible.” Each participant performed three maximal-effort CMJs, separated by approximately 1 min, and the mean value of the three trials was used for subsequent statistical analyses.
Ground reaction forces were recorded using a force plate (9260AA; Kistler Ltd, Switzerland) at a sampling frequency of 1000 Hz, which captured the time course of force throughout the CMJ. Take-off and landing instants were identified when the vertical GRF decreased below or increased above a 20 N threshold relative to quiet standing. The raw data were processed in MATLAB to compute key CMJ variables, including JH, PF, PP, CIP, eccentric rate of force development (ERFD), and the modified reactive strength index (mRSI). JH was calculated from flight time (FT) using standard free-fall equations; PF was defined as the maximal vertical force during the concentric phase prior to take-off; PP was obtained as the dot product of vertical GRFs and the velocity of the body's center of mass; mRSI was calculated as JH divided by time to take-off (TTT); CIP was computed as the time integral of net vertical force during the concentric phase (i.e., mean force multiplied by phase duration); and ERFD was calculated as the change in vertical force over the corresponding change in time (ΔF/Δt) during the eccentric phase.
RPE scale
To assess perceived fatigue during the simulated game, the Borg 0–10 Rating of Perceived Exertion (RPE) scale was used. The scale ranges from 0.5 (“very, very light”), 1 (“very light”), 2 (“light”), 3 (“moderate”), 4 (“somewhat hard”), 5 (“hard”), 7 (“very hard”), to 10 (“very, very hard”), reflecting the individual's global perception of exercise intensity at a given moment. At the end of each inning, participants were asked to immediately report their RPE to quantify the accumulated fatigue for that inning. Recording RPE on an inning by-inning basis allowed us to track the progression of subjective fatigue with increasing pitching volume and to examine its relationship with potential declines in pitch velocity. 36
Statistical analysis
All statistical analyses were performed using SPSS software (IBM Corp., Armonk, NY, USA). Group (Division I and Division II pitchers) was treated as the between-subjects factor, and Time (Pretest and seven consecutive innings) was treated as the within-subjects repeated-measures factor. For each inning, the mean value of the 15 pitches was used as the representative ball velocity measure. Normality was assessed using the Shapiro–Wilk test separately within each group at each time point, and homogeneity of variance between groups was examined using Levene's test. Variables satisfying these assumptions were analyzed using a two-way mixed-design ANOVA to examine the main effects of Group and Time, as well as the Group × Time interaction, on ball velocity and countermovement jump (CMJ) variables. The assumption of sphericity for the repeated-measures factor was evaluated using Mauchly's test, and the Greenhouse–Geisser correction was applied when necessary. When a significant main effect or interaction effect was observed, Bonferroni-adjusted post hoc comparisons were performed to examine simple main effects. For variables that did not fully satisfy the normality assumption, supplementary non-parametric analyses were conducted. Within-group repeated measurements were analyzed using the Friedman test, followed by Wilcoxon signed-rank tests for post hoc comparisons when appropriate, whereas between-group differences at each time point were examined using the Mann–Whitney U test. Effect sizes for ANOVA were expressed as partial eta squared (η2). Statistical significance was set at p < 0.05, and data are presented as mean ± standard deviation (SD).
Results
For variables that did not fully satisfy the normality assumption, supplementary non-parametric analyses were conducted. As the non-parametric results were consistent with those of the original two-way mixed-design ANOVA and did not alter the main findings, the following results are presented primarily based on the two-way mixed-design ANOVA.
Regarding pitch velocity, the two-way mixed-design ANOVA revealed a significant Group × Inning interaction for ball speed (F₇,₁₂₆ = 3.69; p < 0.01; η2 = 0.17). Post hoc comparisons showed that Division II pitchers exhibited a significant decline in ball velocity beginning in the third inning.
For CMJ variables, no significant Group × Inning interactions were observed; however, PF, JH, CIP, PP, and ERFD all showed significant main effects of Inning, indicating decrements with accumulating pitching volume. From pretest to the last inning, PF decreased from 1322.04 ± 200.92 N to 1209.57 ± 167.16 N in Division I (Δ% = −8.51) and from 1202.35 ± 161.54 N to 1104.99 ± 220.07 N in Division II (Δ% = −8.10) (F₇,₁₂₆ = 11.70; p < 0.01; η2 = 0.37). JH decreased from 0.41 ± 0.04 m to 0.39 ± 0.04 m in Division I (Δ% = −4.88) and from 0.35 ± 0.06 m to 0.33 ± 0.06 m in Division II (Δ% = −5.71) (F₇,₁₂₆ = 14.44; p < 0.01; η2 = 0.05). CIP decreased from 211.04 ± 23.19 N·s to 203.74 ± 23.03 N·s in Division I (Δ% = −3.46) and from 195.34 ± 26.03 N·s to 188.43 ± 23.18 N·s in Division II (Δ% = −3.54) (F₇,₁₂₆ = 6.48; p < 0.01; η2 = 0.02). PP decreased from 4679.35 ± 633.22 N·m·s−1 to 4437.32 ± 624.92 N·m·s−1 in Division I (Δ% = −5.17) and from 4255.59 ± 561.15 N·m·s−1 to 4030.72 ± 482.60 N·m·s−1 in Division II (Δ% = −5.28) (F₇,₁₂₆ = 26.90; p < 0.01; η2 = 0.02). ERFD decreased from 7061.42 ± 1980.45 N·s−1 to 5840.85 ± 1745.99 N·s−1 in Division I (Δ% = −17.29) and from 6022.11 ± 948.12 N·s−1 to 4279.73 ± 1020.08 N·s−1 in Division II (Δ% = −28.93) (F₇,₁₂₆ = 15.95; p < 0.01; η2 = 0.03). RPE increased from 2.05 ± 0.82 to 8.35 ± 1.58 in Division I (Δ% = 307.32) and from 2.71 ± 1.71 to 8.85 ± 0.96 in Division II (Δ% = 226.57) (F₇,₁₂₆ = 88.92; p < 0.01; η2 = 0.12). For mRSI, no significant Group × Inning interaction or main effect of Inning was detected. From pretest to the last inning, Division I decreased from 0.59 ± 0.06 to 0.58 ± 0.05 (Δ% = −1.69), and Division II changed from 0.50 ± 0.09 to 0.58 ± 0.05 (Δ% = −2.00) (F₇,₁₂₆ = 0.07; p = 0.99; η2 = 0.01).
Discussion
This study compared pitch velocity and lower-limb neuromuscular fatigue patterns in collegiate baseball pitchers of different competitive levels during a prolonged simulated game. As pitching volume accumulated, both Division I and Division II pitchers showed clear lower-limb neuromuscular fatigue, but their ball-velocity responses differed. Division I pitchers maintained relatively stable ball speed, whereas Division II pitchers showed a marked decline from the third inning onward. Previous research in cricket fast bowling suggests that skilled athletes may use functional movement variability to adjust coordination and maintain delivery speed, while individualized movement strategies may also influence ball-release characteristics.32,33 Thus, the ability of Division I pitchers to maintain ball speed despite fatigue may reflect better movement adaptability rather than the absence of fatigue. In the two-way mixed-design ANOVA, ball speed showed a significant Group × Inning interaction, whereas PF, JH, CIP, PP, and ERFD showed significant main effects of Inning. These findings suggest similar lower-limb fatigue in both groups, but only lower-level pitchers showed a significant decline in ball speed.
Although several studies have suggested that vertical jump tests are practical tools for monitoring NMF, the CMJ is more commonly used to assess changes in neuromuscular function following high-intensity or repetitive exercise.23,24 Recent studies have also shown that the CMJ can effectively reflect neuromuscular responses under different training conditions or acute fatigue states. In addition, the CMJ and its derived variables have been associated with ball velocity, momentum generation, and injury risk in baseball pitchers,13,26–29 and the test is highly practical in applied settings. Nevertheless, to our knowledge, studies examining changes in lower-extremity NMF in collegiate baseball pitchers during extended pitching remain limited, as most previous research has primarily focused on the effects of accumulated pitching workload on kinematic variables.
Previous simulated-game studies have shown that reduced knee flexion during pitching may indicate lower-limb fatigue, 37 and later studies further examined fatigue-related changes in pitching kinematics.16,38 More recent research in higher-level pitchers has shown that even when ball speed remains relatively stable during prolonged pitching, whole-body center-of-mass (CoM) control changes markedly. Specifically, the anteroposterior CoM position at stride-foot contact increased from 38.69 ± 18.30 cm to 52.31 ± 30.12 cm (Δ% = + 35), while CoM variability increased by 150% in the anteroposterior direction and 344% in the vertical direction. These changes may reflect fatigue-related reductions in hip and knee extensor strength, forcing pitchers to complete support and braking in a less stable posture. Fatigue of the hip rotators and internal rotators may further impair postural control, increasing body sway and CoM displacement at stride-foot contact. 31 Our findings are consistent with this pattern. In higher-level pitchers, ball speed did not decline significantly after the prolonged simulated game, whereas several CMJ mechanical variables decreased significantly, indicating clear lower-limb fatigue. Similar studies also reported significant declines in PF, JH, CIP, PP, and ERFD, despite non-significant changes in mRSI and ball speed, alongside increased RPE. 34 This is consistent with our findings. In both Division I and Division II pitchers, CMJ testing showed lower-extremity fatigue. As shown in Table 1, PF, JH, CIP, PP, and ERFD showed no significant Group × Inning interactions, but all showed significant main effects of Inning (p < .01). PF decreased by 8.51% in Division I and 8.10% in Division II; JH by 4.88% and 5.71%; CIP by 3.46% and 3.54%; PP by 5.17% and 5.28%; and ERFD by 17.29% and 28.93%, respectively. RPE also increased by 307.32% and 226.57%, respectively (p < .01). These results showed a consistent decline in lower-extremity neuromuscular function across innings in both groups. Because no significant interaction effects were found, Figure 1 presents the combined main effects from pretest to the last inning to illustrate the decline in CMJ variables and the increase in RPE during the simulated game. Previous studies have shown that ball velocity is closely related to ground reaction force during pitching, and greater lower-extremity force production is essential for increasing pitching velocity.39–42 In the present study, CMJ variables clearly indicated substantial lower-extremity NMF after prolonged pitching. Whether this fatigue was reflected in ball-velocity changes, and whether the pattern differed by competitive level, is a key finding of this study.
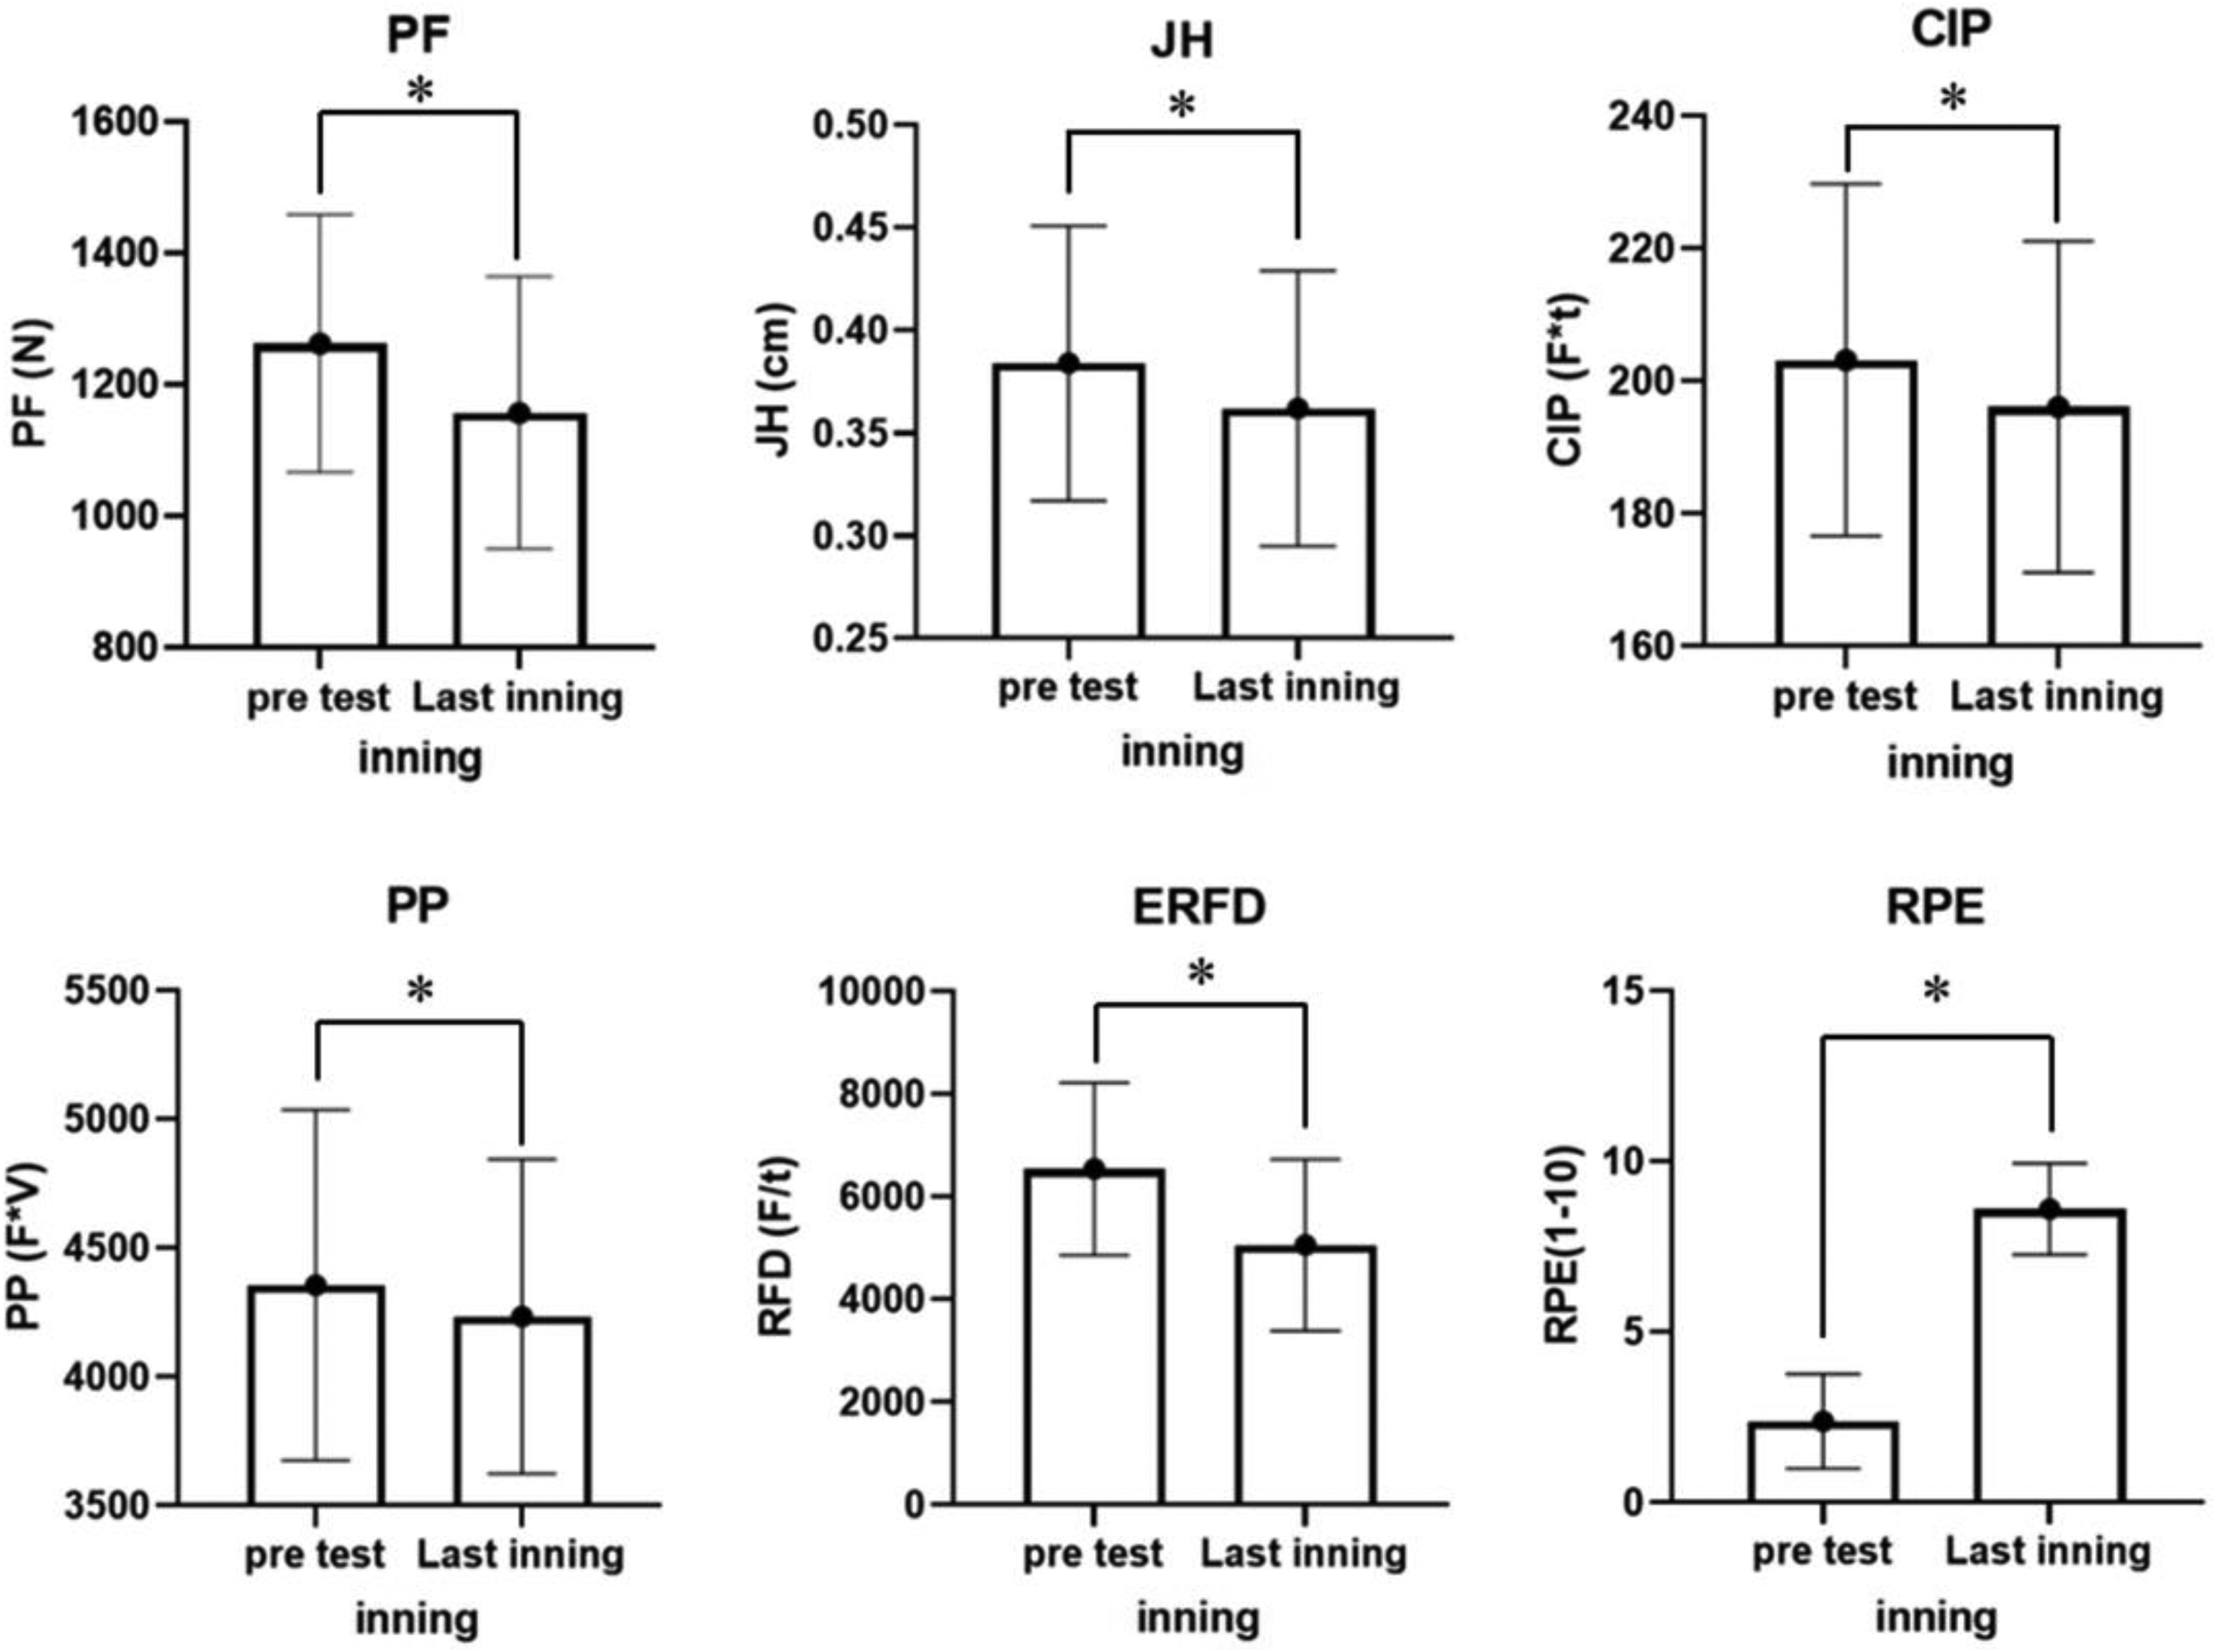
Main effects for CMJ variables and RPE. PF: peak force; JH: jump height; RSI: modified reactive strength index; CIP: concentric impulse; PP: peak power; ERFD: eccentric rate of force development; RPE: rate of perceived exertion.
Two-way mixed-design ANOVA results.
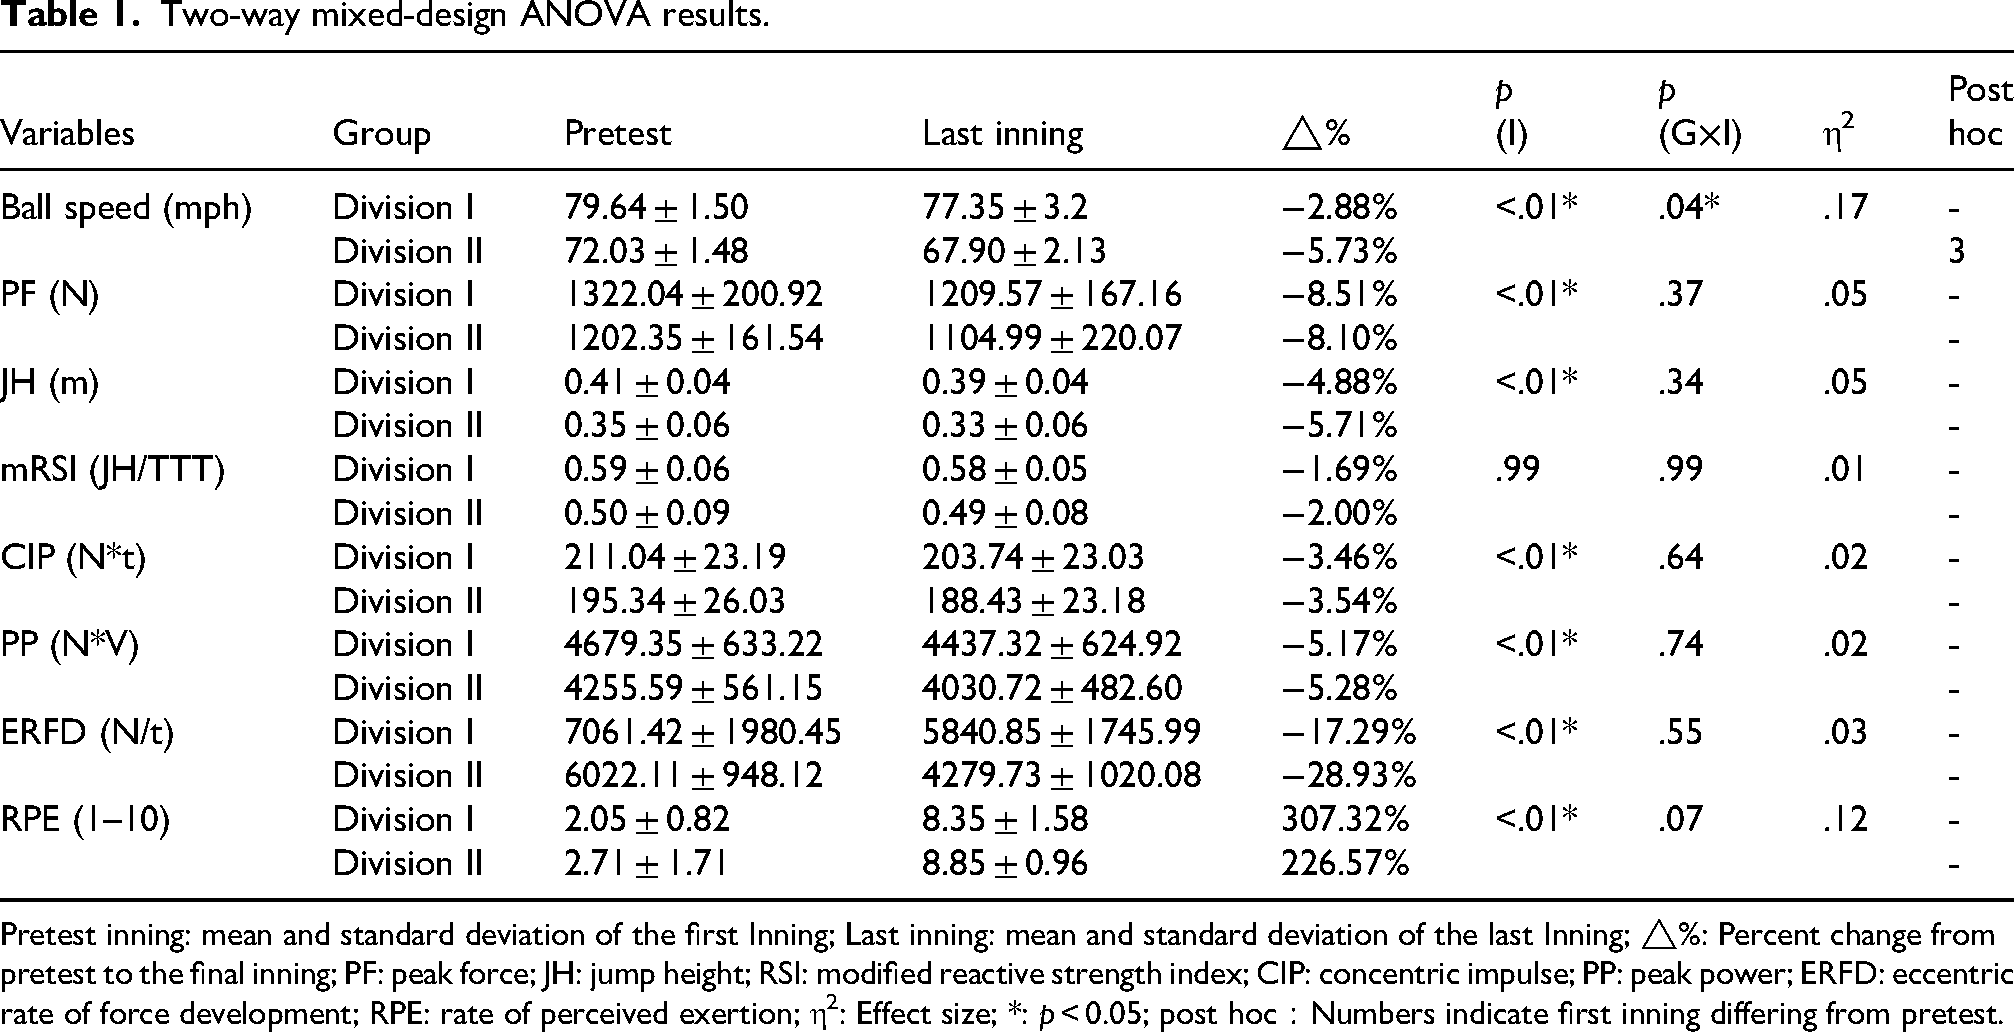
Pretest inning: mean and standard deviation of the first Inning; Last inning: mean and standard deviation of the last Inning; △%: Percent change from pretest to the final inning; PF: peak force; JH: jump height; RSI: modified reactive strength index; CIP: concentric impulse; PP: peak power; ERFD: eccentric rate of force development; RPE: rate of perceived exertion; η2: Effect size; *: p < 0.05; post hoc:Numbers indicate first inning differing from pretest.
Interestingly, the present study revealed distinct patterns of ball speed change between competitive levels, despite all participants being collegiate pitchers within a similar age range. As shown in Table 1, ball velocity showed a significant Group × Inning interaction in the two-way mixed-design ANOVA (p = .040), indicating that accumulated pitching workload affected the two competitive levels differently. Post hoc comparisons and Figure 2 showed that Division I pitchers maintained relatively stable ball velocity from pretest to the final inning, with an overall decline of only 2.88%. Although a downward trend was observed, the change was not statistically significant. In contrast, Division II pitchers showed a significant decline in ball velocity beginning in the third inning, with an overall reduction of 5.73% by the final inning. These findings suggest that Division II pitchers experienced an earlier decline in ball velocity as pitching workload accumulated, reflecting different fatigue-response patterns across competitive levels. From a motor-control perspective, higher-level pitchers may be better able to optimize kinetic-chain coordination and adjust stride strategy to redistribute load across the body.31,43 As a result, ball velocity may remain near baseline even when lower-extremity performance indicates accumulated fatigue. In contrast, when lower-extremity performance declines across innings, Division II pitchers may have less capacity to compensate through strength or technical strategies, causing fatigue to be expressed more directly as reduced ball velocity. These findings suggest that lower-level pitchers may have poorer tolerance to prolonged pitching workload. Once lower-extremity NMF develops and accumulates, relatively lower strength, explosive power, and neuromuscular control may make it more difficult for them to maintain stable and efficient kinetic-chain function under fatigue.17,20
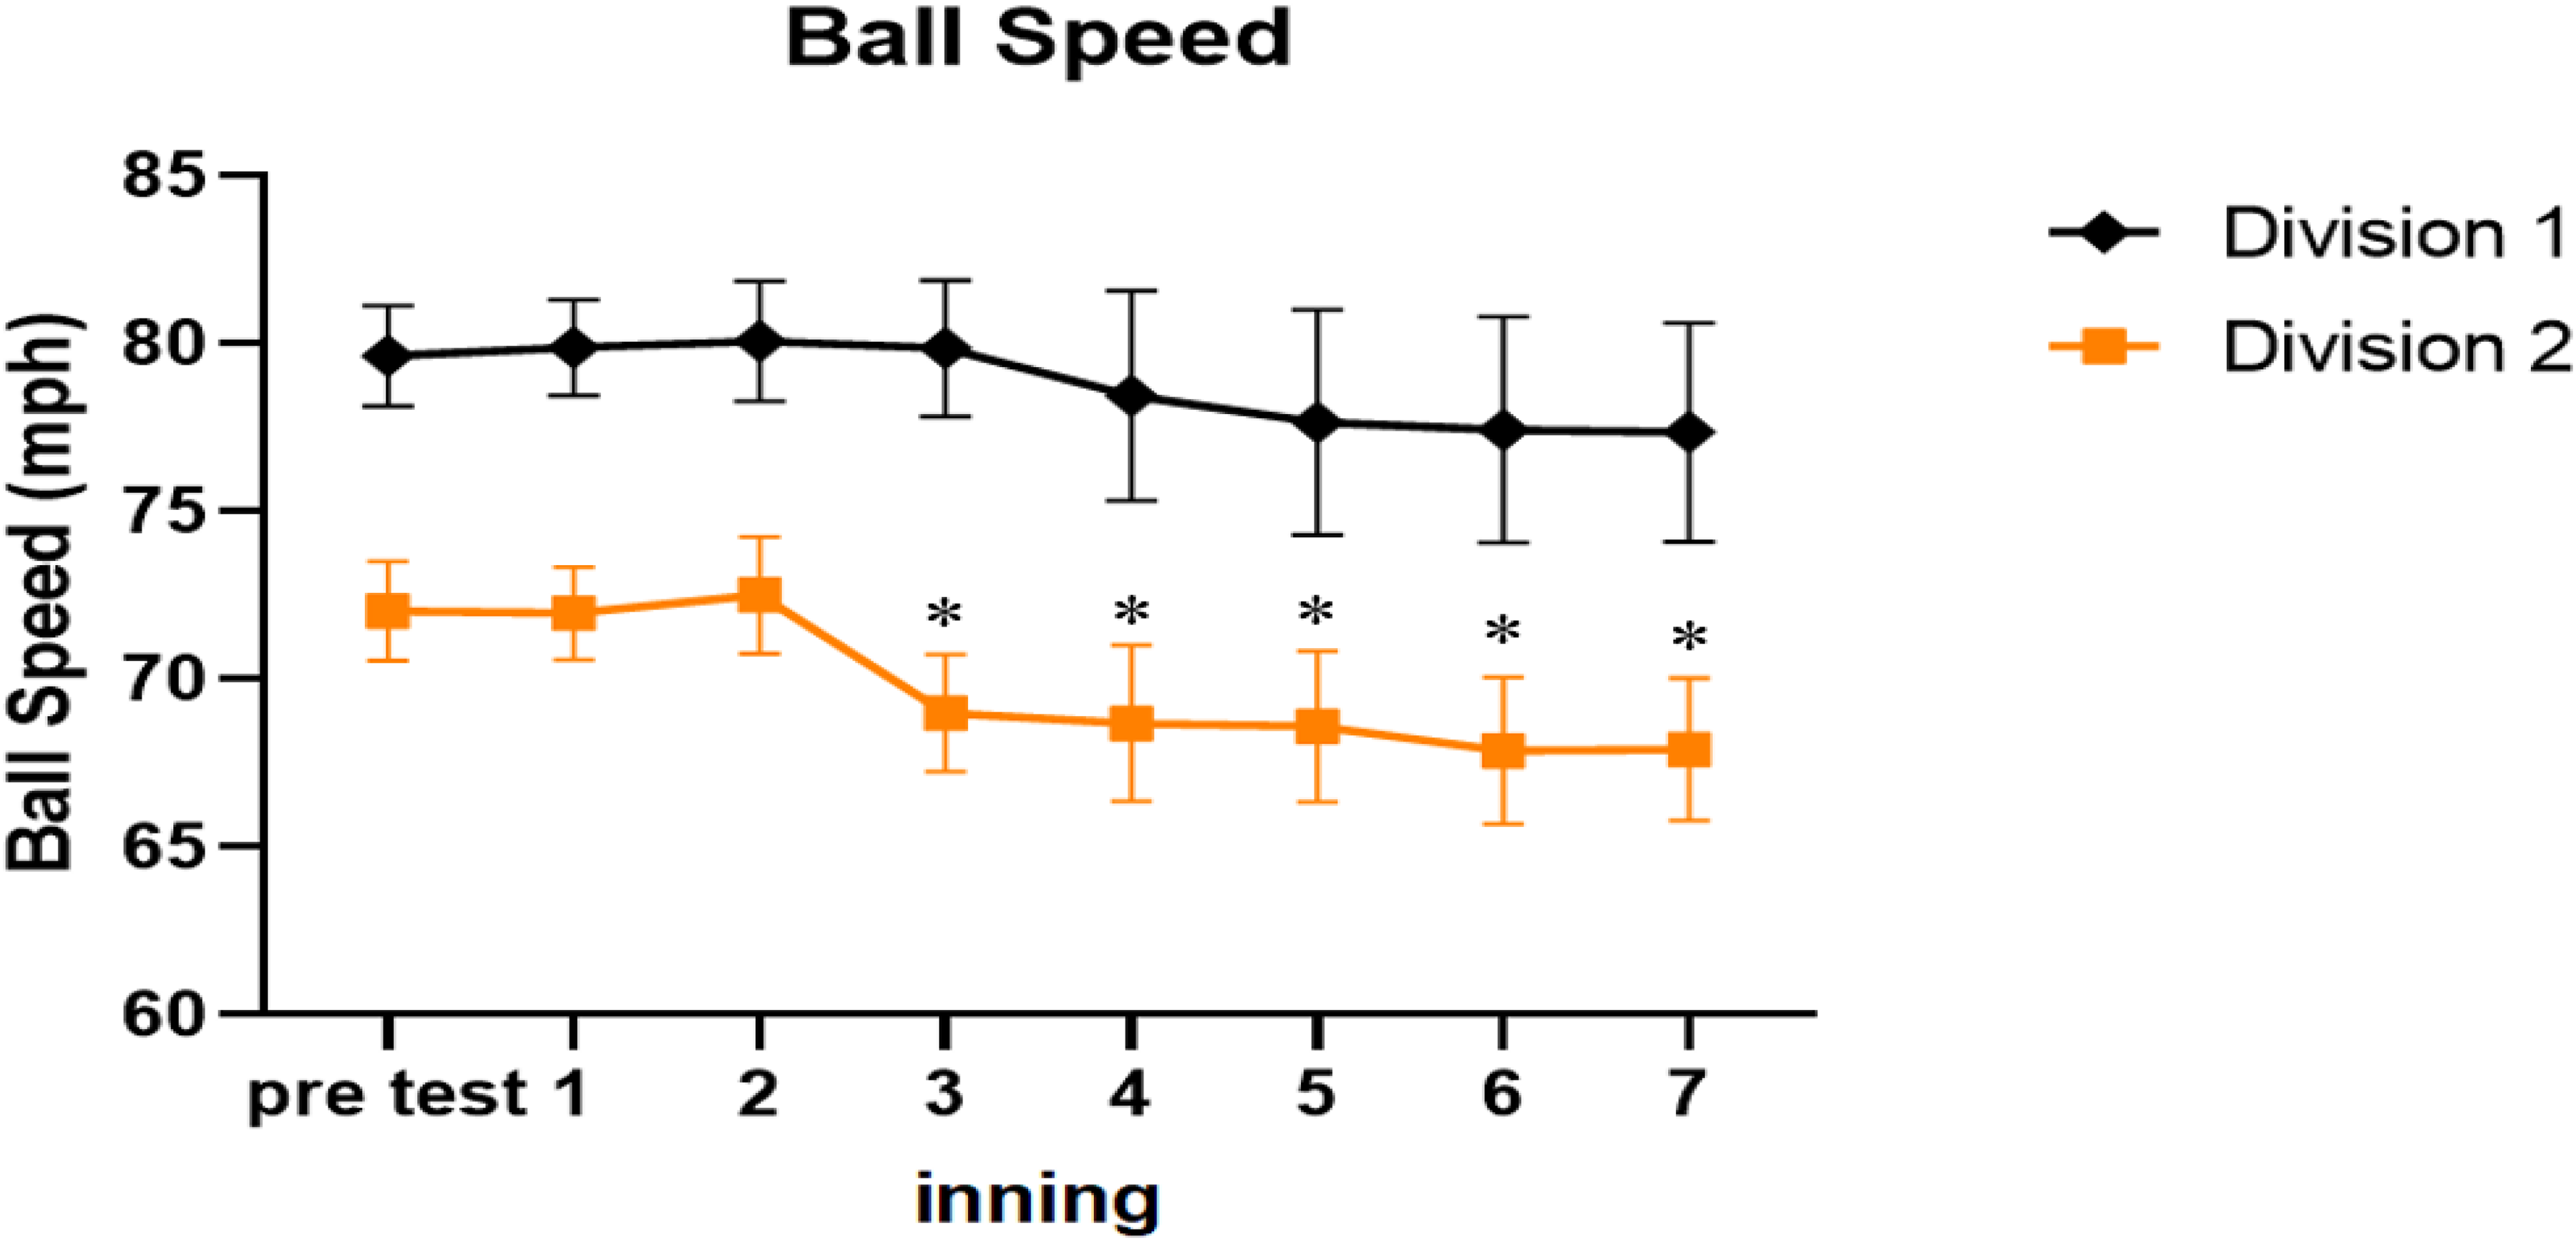
Post hoc comparisons of ball speed.
Regarding injury risk, the lower extremities play a key role in decelerating upper-extremity motion and distributing pitching loads. 44 When lower-extremity support and energy transfer decline, the shoulder and elbow may absorb more load, increasing overuse injury risk. For Division I pitchers, maintaining near-baseline ball velocity despite lower-extremity fatigue does not necessarily indicate lower risk. Instead, preserved ball velocity may reflect compensatory strategies that shift mechanical stress to the upper-extremity joints.18,19 For Division II pitchers, fatigue may be more directly expressed as reduced ball velocity and functional imbalance. Previous studies have also shown that, as fatigue accumulates, ball velocity may decrease while elbow varus torque increases. 45 Thus, injury risk should not be overlooked in either group during prolonged, high-volume pitching, although the risk profiles may differ. Division I pitchers may accumulate hidden load while maintaining ball velocity, whereas Division II pitchers may show more direct ball velocity decline and increased joint loading. These findings suggest that using ball velocity alone to assess fatigue may underestimate true fatigue status. In addition, the simulated-game design should be interpreted cautiously because actual games involve pitch selection, tactics, and psychological stress.
This study has several limitations that should be acknowledged. First, the prolonged pitching protocol was conducted in an indoor simulated-game setting using a simulated-game protocol of 15 fastballs per inning thrown at fixed intervals. Although this design allowed strict control of pitching volume and testing time points, it still differed from actual competition in several aspects, including psychological pressure, pitch-type variation, tactical context, opponent level, and high-pressure situations such as pitching with runners on base. Future studies are therefore needed to validate the present monitoring framework under actual game conditions. Second, CMJ and RPE were used as the primary fatigue indicators. While these measures reflect lower-limb NMF and subjective load, they do not directly capture joint kinetics or electromyographic activity during pitching. Incorporating three-dimensional motion analysis and surface electromyography in future research would enable a more comprehensive characterization of compensatory strategies adopted by pitchers of different competitive levels under fatigue and further incorporating ground reaction force time-series data and statistical parametric mapping (SPM) analysis may provide a more detailed understanding of fatigue-related biomechanical changes. Finally, the sample consisted solely of collegiate pitchers, and the present findings may not be generalized to youth or professional players. Subsequent studies should include broader age ranges and competitive standards and further examine how fatigue responses differ across training backgrounds.
This study showed that collegiate pitchers at different competitive levels exhibit distinct patterns of ball-velocity change during prolonged pitching. In Division I pitchers, ball speed declined only slightly and did not reach statistical significance, whereas several CMJ-derived mechanical variables decreased significantly, indicating that CMJ is a sensitive in-game tool for monitoring lower-limb neuromuscular fatigue in higher-level pitchers. In contrast, Division II pitchers showed both CMJ-based fatigue and a significant decline in ball speed beginning as early as the third inning. These findings suggest that fatigue may be expressed differently across competitive levels and should not be assessed solely by ball speed or any single indicator. In practice, objective performance tests should be combined with subjective fatigue measures. Future research should examine the timing of lower-limb fatigue and ball-speed decline across levels and upper-extremity strength assessment may further improve fatigue evaluation in players with relatively low upper-extremity strength.
Footnotes
Ethical considerations
This study was reviewed and approved by the Institutional Review Board of National Taiwan Sport University (NTSUIRB-112-028). All procedures were conducted in accordance with the ethical principles of the Declaration of Helsinki.
Consent to participate
Written informed consent was obtained from all participants prior to data collection.
Consent for publication
Not applicable.
Contributors
All authors discussed and formed up this study. The manuscript was drafted by En-Yu Chang. All authors reviewed and approved the final version of the manuscript before submission.
Funding
The authors received no financial support for the research, authorship, and/or publication of this article.
Declaration of conflicting interests
The authors declared no potential conflicts of interest with respect to the research, authorship, and/or publication of this article.
Data availability
All data analysed in this study are included in the main text, tables, and figures of this article.