
Abstract
Objectives
This study aimed to identify longitudinal predictors of clubhead speed (CHS) in elite junior golfers and investigate the associations between physical development and habitual dietary patterns across 5 years.
Design
Five-year longitudinal study.
Method
Elite junior golfers (n = 323; aged 11–17 years; approximately 50% male) were assessed for CHS, lean body mass (LBM) and dietary intake via a validated questionnaire. The final analysis used n = 244 observations obtained through a standardised CHS measurement protocol. Principal component analysis was used to identify key dietary patterns. Linear mixed models were employed to identify CHS predictors, incorporating age, LBM, sex and dietary factors as fixed effects.
Results
LBM emerged as the strongest modifiable predictor of CHS (β = 0.43, p < 0.001), with a standardised coefficient threefold greater than chronological age (β = 0.14, p < 0.001). Each 1-kg increment in LBM predicted a 0.21 m/s increase in CHS (B = 0.21). Total energy intake positively predicted CHS (β = 0.09, p = 0.029), whereas a dietary pattern marked by comparatively lower protein and fat intake was negatively associated with improvements (β = −0.07, p = 0.041). Overall, the cohort exhibited a mean energy deficit of 8%.
Conclusions
CHS development in elite junior golfers is predicted by functional muscle mass gains rather than passive maturation. For coaches, long-term athletic development programmes may benefit from integrating strength-focused training alongside strategies ensuring adequate energy, protein and fat intake.
Introduction
In competitive golf, clubhead speed (CHS) is a critical predictor of playing level and driving distance, accounting for a substantial proportion of the variance in tee shot performance. 1 As the sport shifts toward a high-velocity performance model, the ability to generate high CHS has become essential for professional and elite junior golfers. Accordingly, CHS is regarded as a key performance indicator in the long-term development of golfers. 2 Mechanistically, maximising CHS requires optimised rotational power and efficient kinetic chain energy transfer, both dependent on sufficient lean body mass (LBM) to generate and stabilise explosive movements, alongside neuromuscular coordination and technical proficiency.3,4 Furthermore, CHS should not be interpreted solely in terms of structural and muscular development. Motor coordination, sequencing efficiency and precise segmental timing within the kinetic chain are also important contributors associated with CHS optimisation, particularly during adolescent growth.
Although studies in adult professionals have demonstrated associations among neuromuscular strength, body composition and rotational power,1,5 a prior systematic review and meta-analysis confirmed that multiple physical attributes are associated with CHS; however, most evidence remains cross-sectional. 6 Such designs are limited because they do not capture longitudinal performance trajectories across maturation, failing to distinguish within-person changes from between-person variance. 2 Although a meta-analysis of paediatric fitness showed that youth development follows individualised, non-linear and sex-specific patterns, robust scaling models examining LBM or muscle mass remain scarce. 7 Consequently, longitudinal evidence describing the physiological progression of elite junior golfers is limited. This research gap largely reflects the logistical difficulty of recruiting highly skilled cohorts with sufficient technical proficiency; in less proficient players, CHS often reflects technical inconsistency or swing compensatory mechanisms rather than underlying physical capacity. 8 Therefore, identifying the physiological predictors of CHS in elite youth is essential for developing evidence-based training models aligned with biological maturation. 9
LBM accretion and maintenance depend on adequate energy availability. 10 In elite junior athletes, metabolic demands are compounded because biological maturation coincides with high-volume training. Although the pubertal hormonal environment enhances anabolic potential, insufficient caloric intake forces physiological prioritisation of maintenance and linear growth over skeletal muscle hypertrophy. Given the high prevalence of relative energy deficiency in sport (REDs) among youth athletes—widely recognised as a critical risk factor during adolescent growth phases 11 —many may not reach the metabolic threshold required for optimal musculoskeletal development. This is further supported by associations between low energy availability surrogates and adverse REDs outcomes in male athletes. 12 Despite these physiological risks, although the associations of energy sufficiency and dietary patterns with LBM have been investigated in broader youth athletic populations, longitudinal research tracking these relationships specifically in elite junior golfers remains scarce.
The primary objective of the present study was to clarify CHS developmental trajectories in elite junior golfers (n = 244) using a 5-year longitudinal design. Unlike cross-sectional studies, which often conflate inter-individual differences with true development, a longitudinal approach enables isolation of within-person LBM accretion and dietary patterns while accounting for the non-linear effects of maturation and sex. By tracking the same elite cohort through critical growth periods, this study aimed to quantify the relative contributions of structural development and energy status to performance enhancement beyond natural maturation. The findings establish evidence-based benchmarks, specifically quantifying the relationship between LBM gains and CHS, to inform a predictive model for long-term elite athlete development. This predictive model may be operationalised in applied settings as a decision-making tool, offering practitioners growth-adjusted targets and nutritional monitoring thresholds.
Methods
Study design and participants
This retrospective study analysed 5-year longitudinal data (2022–2026) from elite junior golfers designated as “developmental athletes” by the Kanto Golf Association (Japan). The study was conducted according to the Declaration of Helsinki and approved by the Ethics Committee of Musashigaoka Junior College (No. 25-3) and the Medical Department Meeting of the Kanto Golf Association Golf Promotion Committee. Owing to its retrospective design, the requirement for written informed consent was waived by the ethics committee, and an opt-out procedure was implemented, allowing participants and their guardians to decline data use. Of the 323 participants with complete dietary records, 4 outliers (> ± 3 standard deviations) were excluded based on energy-adjusted residuals, 13 leaving 319 participants for dietary pattern identification via principal component analysis (PCA). To ensure data stringency, 75 of these participants were excluded, retaining only records obtained under a strictly standardised CHS measurement protocol. The final sample for linear mixed model (LMM) analysis included 244 golfers (128 males and 116 females; Figure 1).
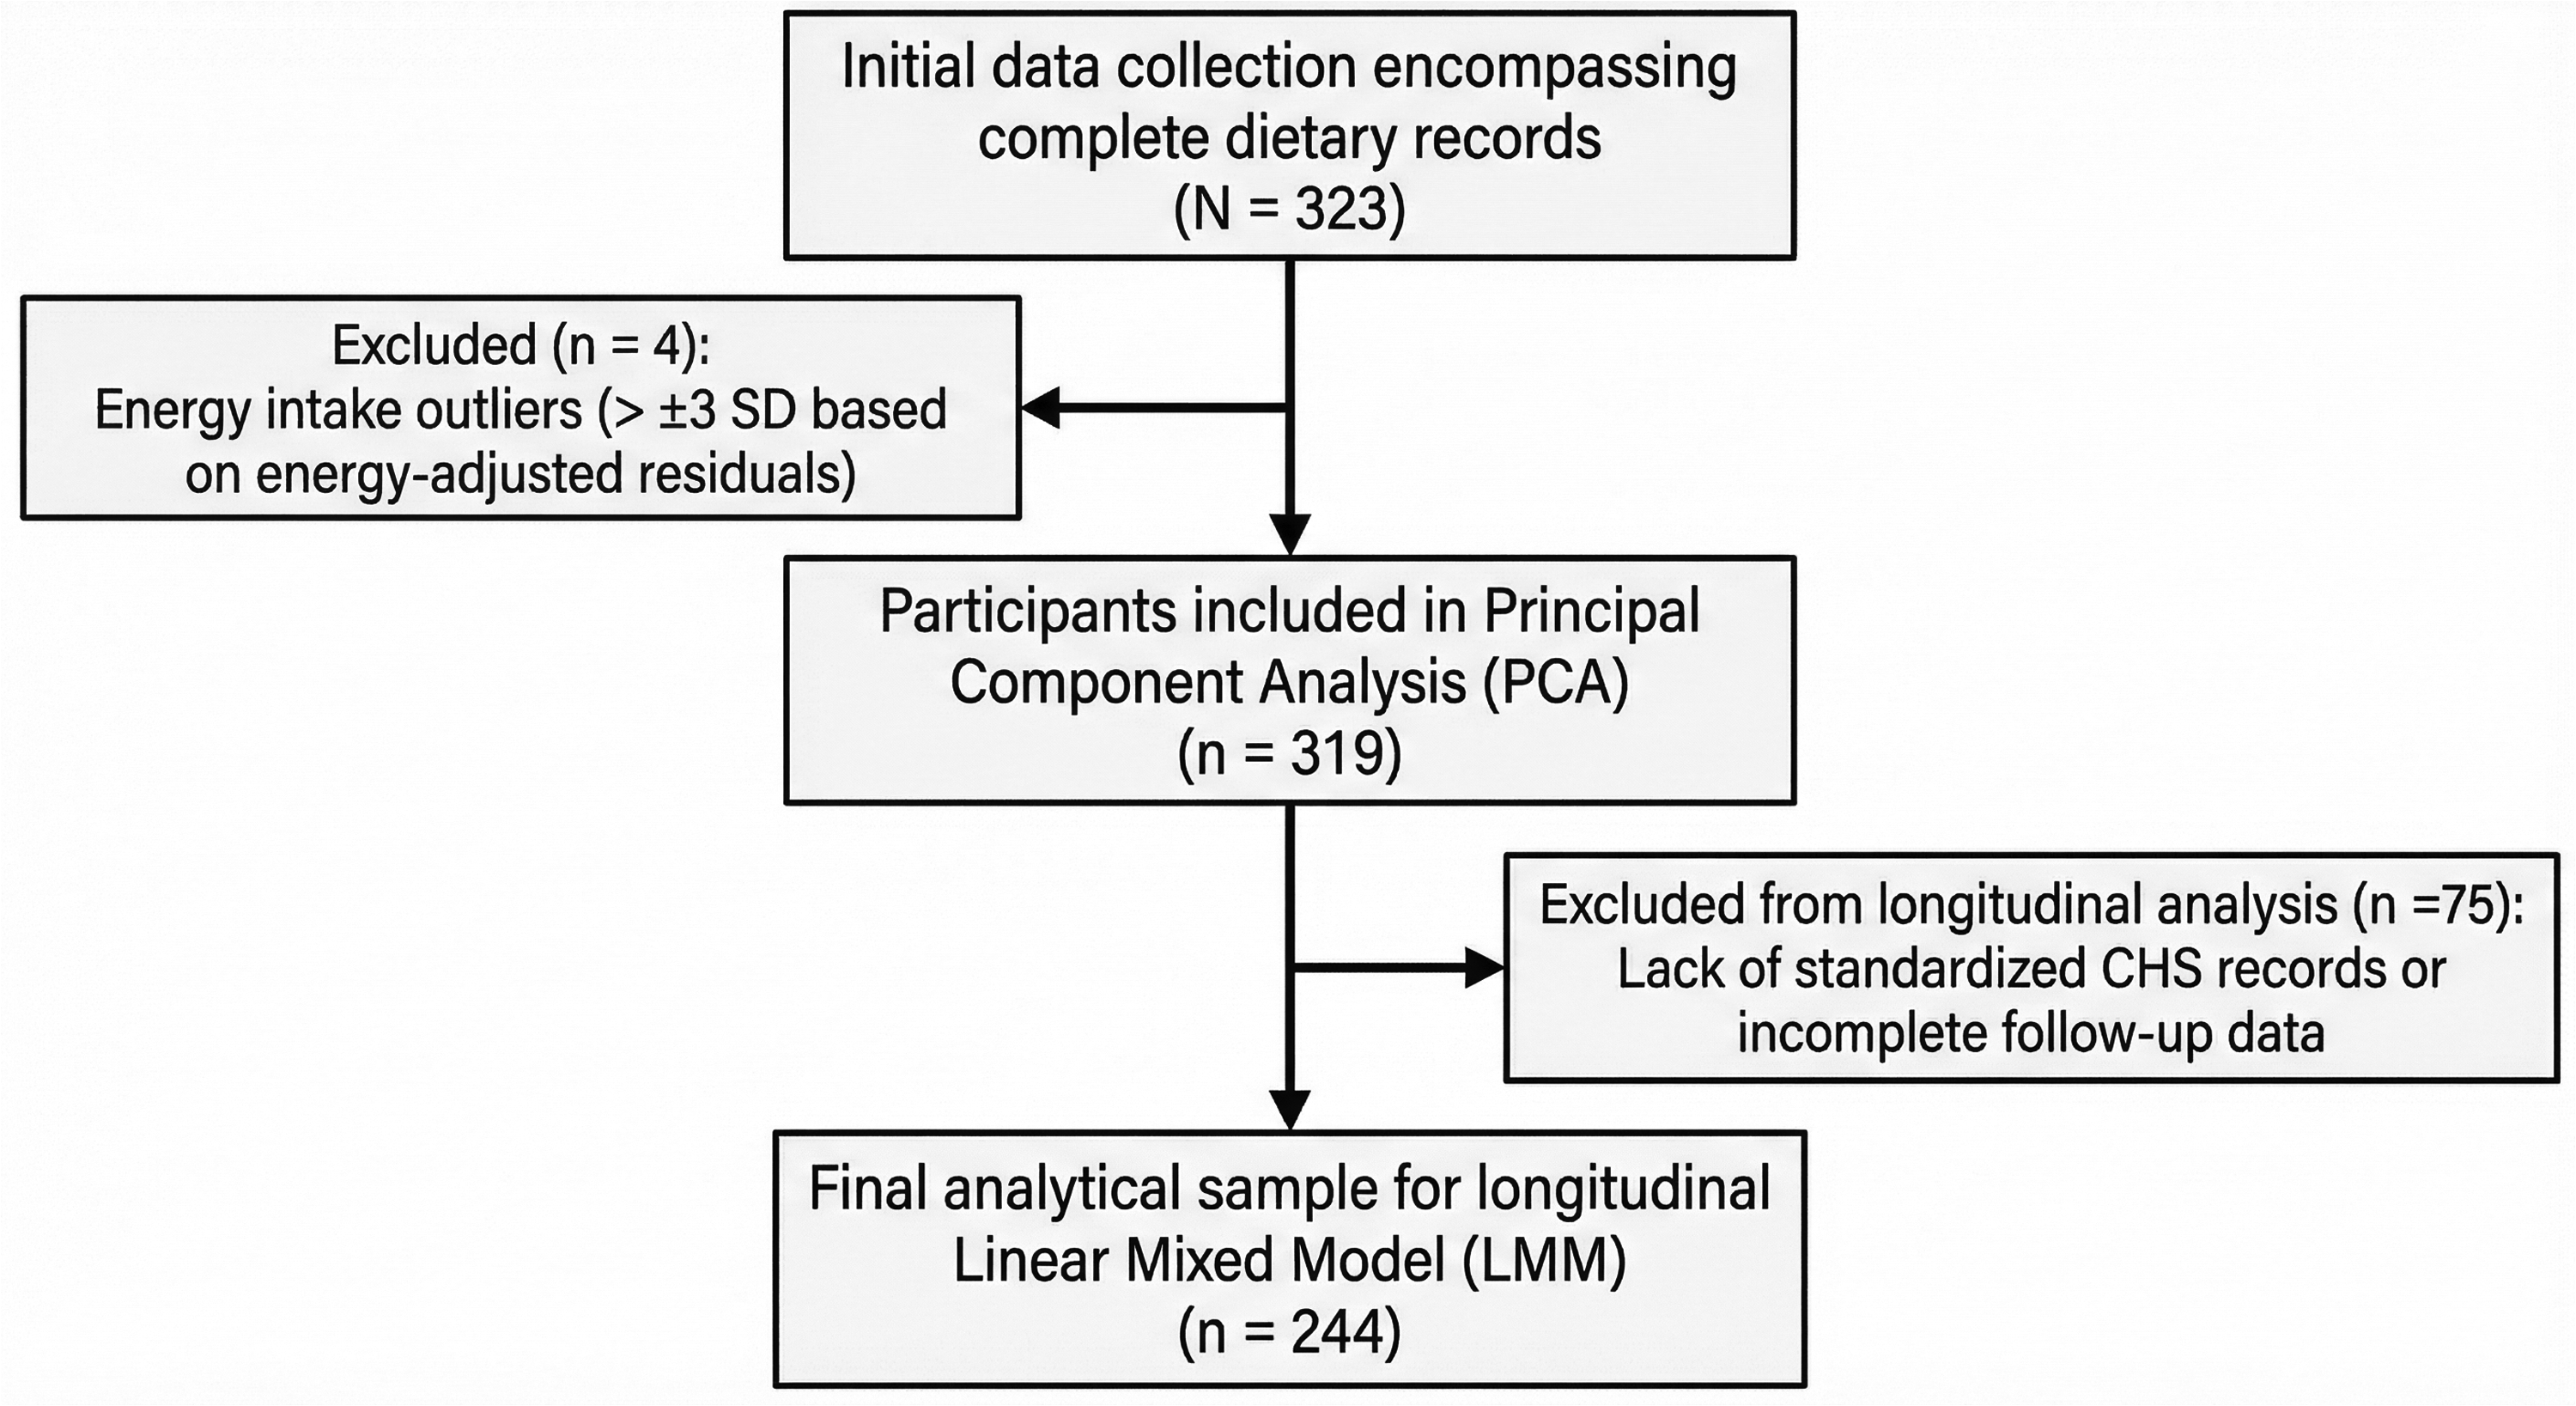
Flow diagram of participant selection and analytical sample derivation. In total, 323 elite junior golfers initially provided complete dietary data; however, 4 participants were excluded as outliers based on energy-adjusted residuals (>±3 standard deviations). The remaining 319 participants were included in the dietary pattern identification using principal component analysis. Of these, 75 were excluded from the longitudinal analysis owing to missing standardised clubhead speed (CHS) records or incomplete physical assessment data during the early study phase. The final longitudinal sample comprised 244 participants with complete and standardised dietary and physical performance data for linear mixed-effects modelling.
Elite junior golfers were defined as athletes selected by the Kanto Golf Association development programme. Selection followed a multi-stage process incorporating competitive results at national-level tournaments or higher, alongside comprehensive physical fitness evaluations. The cohort was stratified by age (11–17 years) and sex (approximately 5–6 participants per group). This rigorous screening produced a homogenous elite cohort with high technical proficiency, ensuring that CHS measurements reflected physical capacity rather than swing inconsistency.
Measurements
CHS
CHS was assessed during outdoor full-swing trials at a driving range in Hirakawa Country Club, Chiba, Japan. Measurements were taken under identical environmental conditions across the 5-year period using standardised range balls. Doppler radar technology (Trackman 4; Trackman A/S, Vedbæk, Denmark) was employed to capture CHS, as this system's within- and between-session reliability for quantifying golf swing kinematics in high-level golfers has been validated. 14
To ensure ecological validity, participants used their personal driver. Following a standard 10-min warm-up routine, including dynamic stretching 15 and graduated practice swings, as well as five sub-maximal preparatory swings, participants performed five maximal-effort trials with 30-s rest intervals. To minimise “noise” from technical inconsistency, participants were instructed to maximise CHS while maintaining proper technique to ensure a viable strike; only trials with a “centred impact” were retained for analysis. Peak CHS (m/s) across the five trials was used for analysis to capture the athlete's maximal neuromuscular capacity, thereby minimising the confounding effects of transient technical errors or acute fatigue that might skew mean values. This rigorous protocol ensured that longitudinal changes primarily reflected physiological development, including LBM accretion and stature growth, rather than technical or environmental variability.
Anthropometrics and body composition
Chronological age and sex were recorded via standardised self-report. Assessments occurred in a controlled environment at the Chiba Prefectural General Sports Center (Chiba, Japan).
Standing height was measured to the nearest 0.1 cm (YHS-200D; YAGAMI Inc., Nagoya, Japan). Body mass and LBM were quantified using multi-frequency bioelectrical impedance analysis (InBody 570; InBody Japan Inc., Tokyo), a validated method for estimating LBM in adolescent and athletic populations. 16 Participants were barefoot in minimal athletic clothing, following a standardised protocol including pre-assessment voiding and avoidance of prior strenuous exercise. Using the derived LBM values, resting metabolic rate (RMR) was estimated using the Cunningham equation. 17 Estimated energy requirement was then calculated by applying a physical activity level of 2.0 to the RMR, reflecting the high training load in this elite cohort. 18
Biological maturation was assessed via maturity offset [years from peak height velocity], calculated using validated sex-specific equations incorporating age, height and body mass.2,9 This maturity offset served as a somatic maturity indicator for characterising the cohort's physiological status.
Physical fitness parameters
Physical fitness tests were conducted at the same facility, assessing upper-limb isometric strength and lower-limb explosive power as key predictors of CHS in elite junior golfers. 4
Grip strength (kg), reflecting upper-limb isometric strength and neuromuscular status, 19 was measured using a digital dynamometer (T.K.K.5101; Takei Scientific Instruments, Tokyo). Participants performed two maximal trials per hand while standing with arms extended downward; the average of the peak values from each hand was analysed.
Standing long jumps (cm) were used to evaluate horizontal explosive power and body mass acceleration. 20 Following warm-up and practice, participants performed two maximal jumps on a standardised mat, with distance measured to the nearest 0.1 cm from the take-off line to the rearmost heel. The maximum distance achieved was retained for analysis.
Dietary assessment
Nutritional intake was recorded at Musashigaoka Junior College (Saitama, Japan) using a validated, self-administered diet history questionnaire (DHQ). 21 The DHQ evaluates consumption frequency, portion size, dietary behaviours and cooking methods over the preceding month. A 60-min briefing was conducted for the “parent–athlete dyad” (participants and primary guardians) to ensure accurate reporting, including portion estimation and school lunches. Completed surveys were analysed at the DHQ Support Center (Gender Medical Research, Tokyo) using an algorithm based on the Standard Tables of Food Composition in Japan 2020 (Eighth Revised Edition). 22
The DHQ's validity for junior athletes has been established, showing strong correlations with 3-day dietary records for energy and nutrient intakes. 23 To isolate dietary patterns independent of total energy intake, food group intakes (g/day) were energy-adjusted using the residual method. 13 These residuals, reflecting nutrient density and quality, served as primary input variables for PCA.
Statistical analysis
Dietary patterns were identified using PCA with Varimax rotation applied to energy-adjusted residuals 24 from 18 food groups (n = 319; 4 outliers excluded as described in section 2.1). Factors were retained based on eigenvalues > 1.0, scree plot inspection and clinical interpretability. Loadings ≥ 0.30 defined each pattern.
LMMs were applied to identify longitudinal CHS predictors (n = 244 golfers). Participant ID was included as a random intercept to account for repeated measurements. Fixed effects included LBM, age, sex, total energy intake and dietary pattern scores. Formal multicollinearity diagnostics using the variance inflation factor (VIF) were performed to assess conceptual overlap among chronological age, biological maturation and LBM. The analysis identified substantial multicollinearity, with VIF values of 25.2 and 33.6 for chronological age and maturity offset, respectively. Consequently, maturity offset 9 was excluded from the final model to minimise multicollinearity and maintain model stability and parsimony.
Model fit was evaluated using Nakagawa's coefficient of determination (R2), reporting marginal and conditional values. 25 Analyses were performed using JMP Pro 18.2.2 (SAS Institute Inc., Cary, NC), with significance set at p < 0.05.
Results
Participant characteristics and energy status
Participant selection is summarised in Figure 1. The final longitudinal sample included 244 golfers (128 males and 116 females) after exclusions for outliers and data stringency. Cohort characteristics and performance metrics are presented in Table 1 (mean age: 14.4 ± 2.0 years). Consistent with biological maturation (maturity offset), males exhibited significantly greater standing height and LBM relative to females. These physiological profiles were associated with higher performance across all measures, including grip strength, standing long jump and CHS (males vs. females: 47.6 ± 4.1 vs. 42.0 ± 2.2 m/s).
Physical characteristics, physical fitness, performance and energy status of elite junior golfers (n = 244).
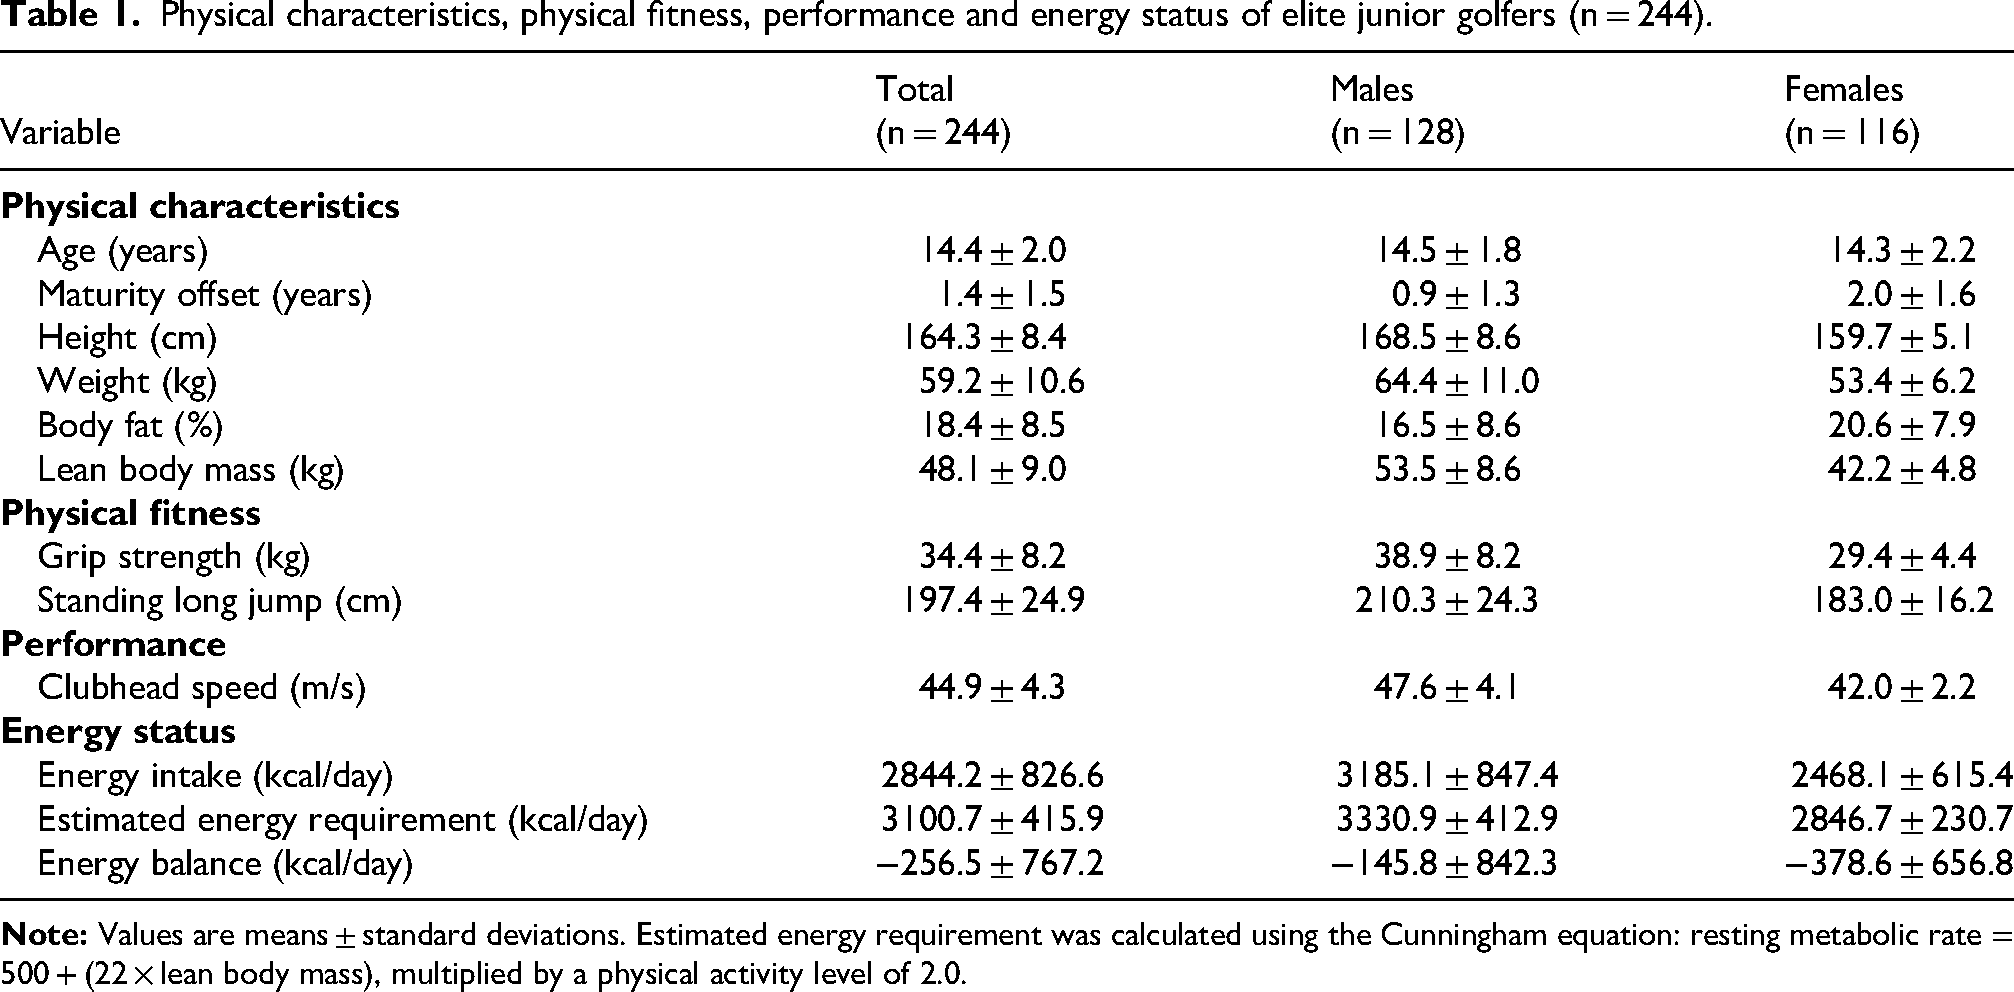
Regarding nutritional status, mean daily energy intake (2844.2 ± 826.6 kcal/day) was ∼8% below the estimated energy requirement (3100.7 ± 415.9 kcal/day), resulting in a mean energy balance of −256.5 ± 767.2 kcal/day. Females exhibited a more pronounced deficit compared with males (females vs. males: −378.6 ± 656.8 vs. −145.8 ± 842.3 kcal/day).
Dietary pattern identification
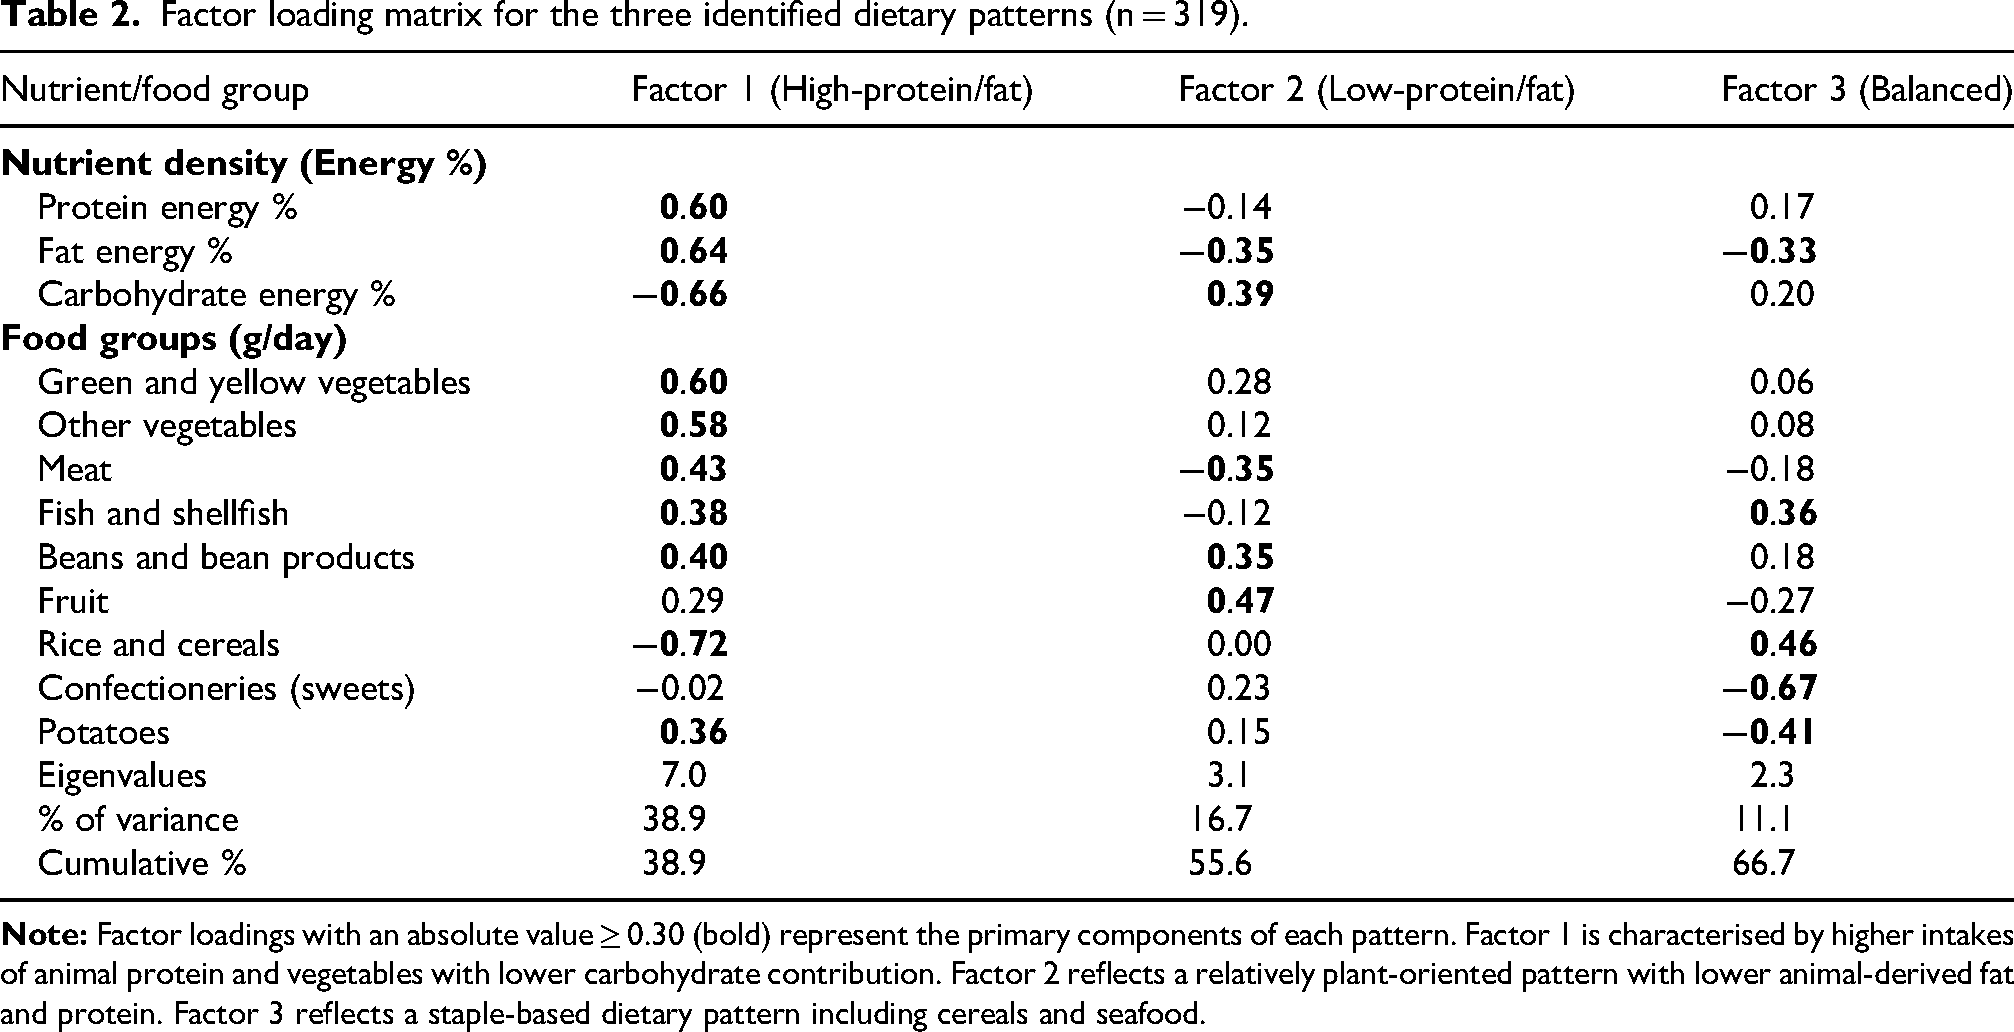
PCA with Varimax rotation identified three primary dietary patterns, accounting for 66.7% of total variance (Table 2). Factors were defined by food groups with absolute loadings ≥ 0.30.
Factor 1: High-protein/fat pattern (38.9% variance) had strong positive loadings for protein energy % (0.60), fat energy % (0.64), vegetables (0.60, 0.58), meat (0.43), beans (0.40), fish (0.38) and potatoes (0.36), as well as negative loadings for carbohydrate energy % (−0.66) and rice/cereals (−0.72). This pattern represents a nutrient-dense diet emphasising musculoskeletal anabolic substrates. Factor 2: Low-protein/fat pattern (16.7% variance) featured high loadings for fruit (0.47), beans (0.35) and carbohydrate energy % (0.39), with negative loadings for fat energy % (−0.35) and meat (−0.35), reflecting a plant-oriented intake with lower animal-based nutrient density. Factor 3: Balanced pattern (11.1% variance) displayed high loadings for rice/cereals (0.46) and fish (0.36), counterbalanced by negative loadings for confectioneries (−0.67), potatoes (−0.41) and fat energy % (−0.33), representing a traditional combination of staple carbohydrates and seafood-based protein.
Factor loading matrix for the three identified dietary patterns (n = 319).
Univariate correlations with CHS
CHS demonstrated significant positive correlations with all physical and body composition variables (all p < 0.001; Table 3). The strongest associations were observed between CHS and LBM (r = 0.81) as well as markers of total and explosive power, i.e., grip strength (r = 0.83) and standing long jump distance (r = 0.76).
Pearson correlation coefficients among primary variables (n = 244).
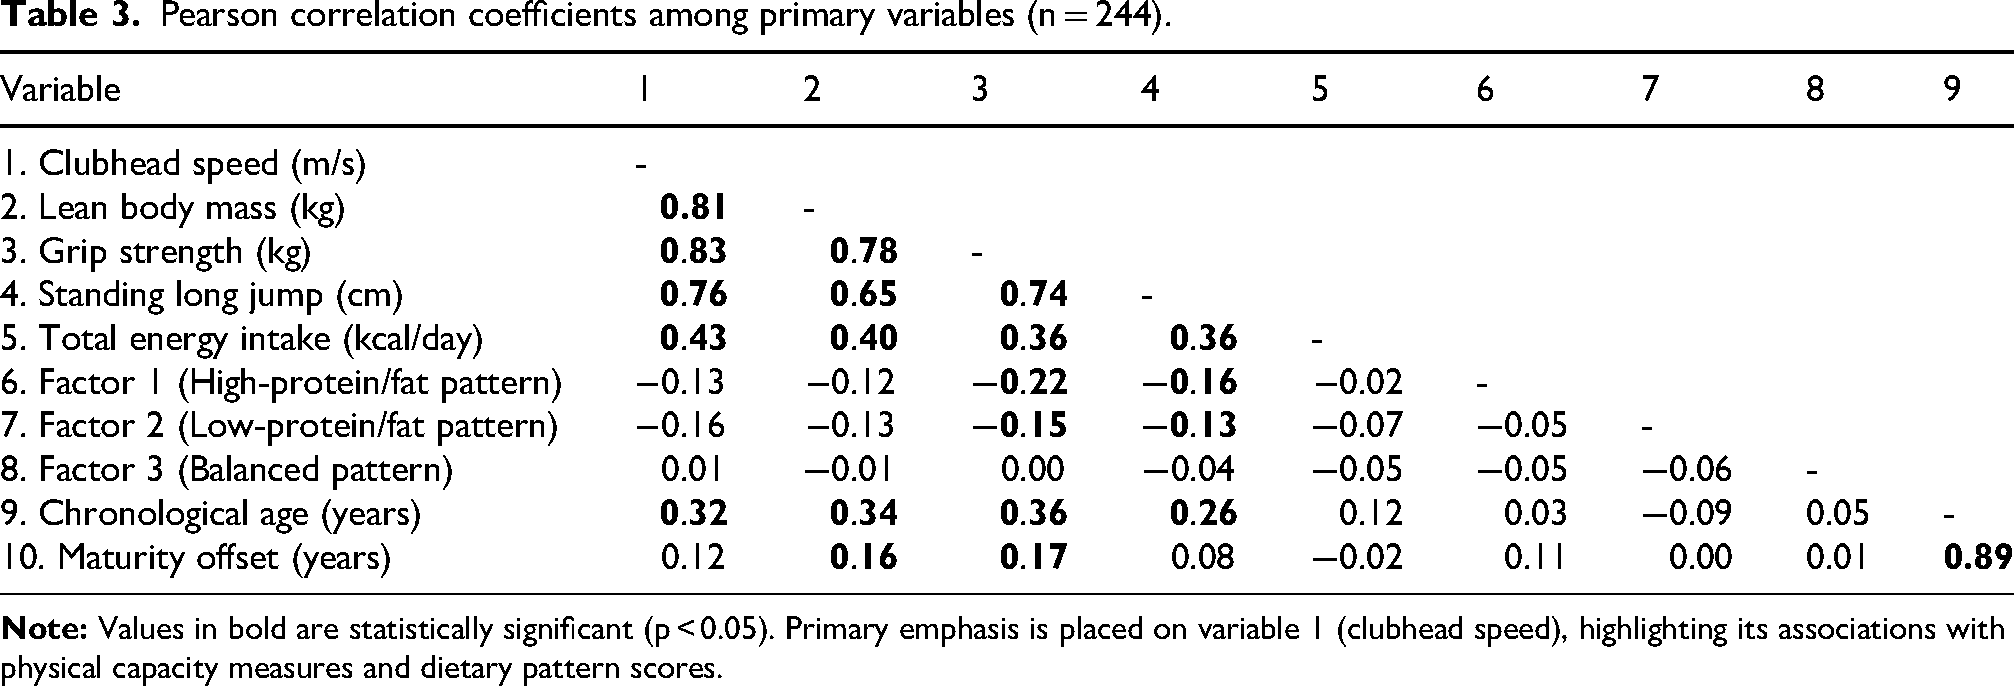
Among nutritional and maturation variables, total energy intake (r = 0.43, p < 0.001) and chronological age (r = 0.32, p < 0.001) were significantly associated with CHS, whereas maturity offset was not (r = 0.12). Chronological age and maturity offset were highly correlated (r = 0.89), justifying exclusion of maturity offset from multivariate models to maintain parsimony. No significant correlations were observed between CHS and dietary pattern scores (Factor 1: r = −0.13; Factor 2: r = −0.16; Factor 3: r = 0.01).
Longitudinal predictors of CHS
Preliminary diagnostics revealed substantial multicollinearity among developmental markers, with VIF values of 25.2 for chronological age and 33.6 for maturity offset. This confirms a significant conceptual overlap among age, biological maturation and body size. Although LBM emerged as a robust predictor of CHS in our longitudinal model, this association likely reflects the combined contributions of underlying maturation and functional muscle adaptation. Accordingly, the observed relationships are interpreted with caution, acknowledging the interplay between structural growth and athletic development.
The final LMM showed high explanatory power. Fixed effects explained 51% of CHS variance, and the full model, including participant-specific random effects, accounted for 75%. Variance component analysis indicated that 24% of total variance was attributable to between-participant differences, supporting inclusion of participant ID as a random effect.
Longitudinal predictors of CHS are summarised in Table 4 and illustrated in Figure 2. Sex was a highly significant overall predictor of CHS (B = 2.37, 95% CI: 1.37 to 3.37, p < 0.001). Among modifiable factors, LBM was the most significant positive predictor (B = 0.21, 95% CI: 0.16 to 0.25, p < 0.001), with a standardised coefficient (β = 0.43) approximately threefold larger than that of chronological age (B = 0.31, 95% CI: 0.15 to 0.48, p < 0.001; β = 0.14), highlighting its central contribution to performance development.
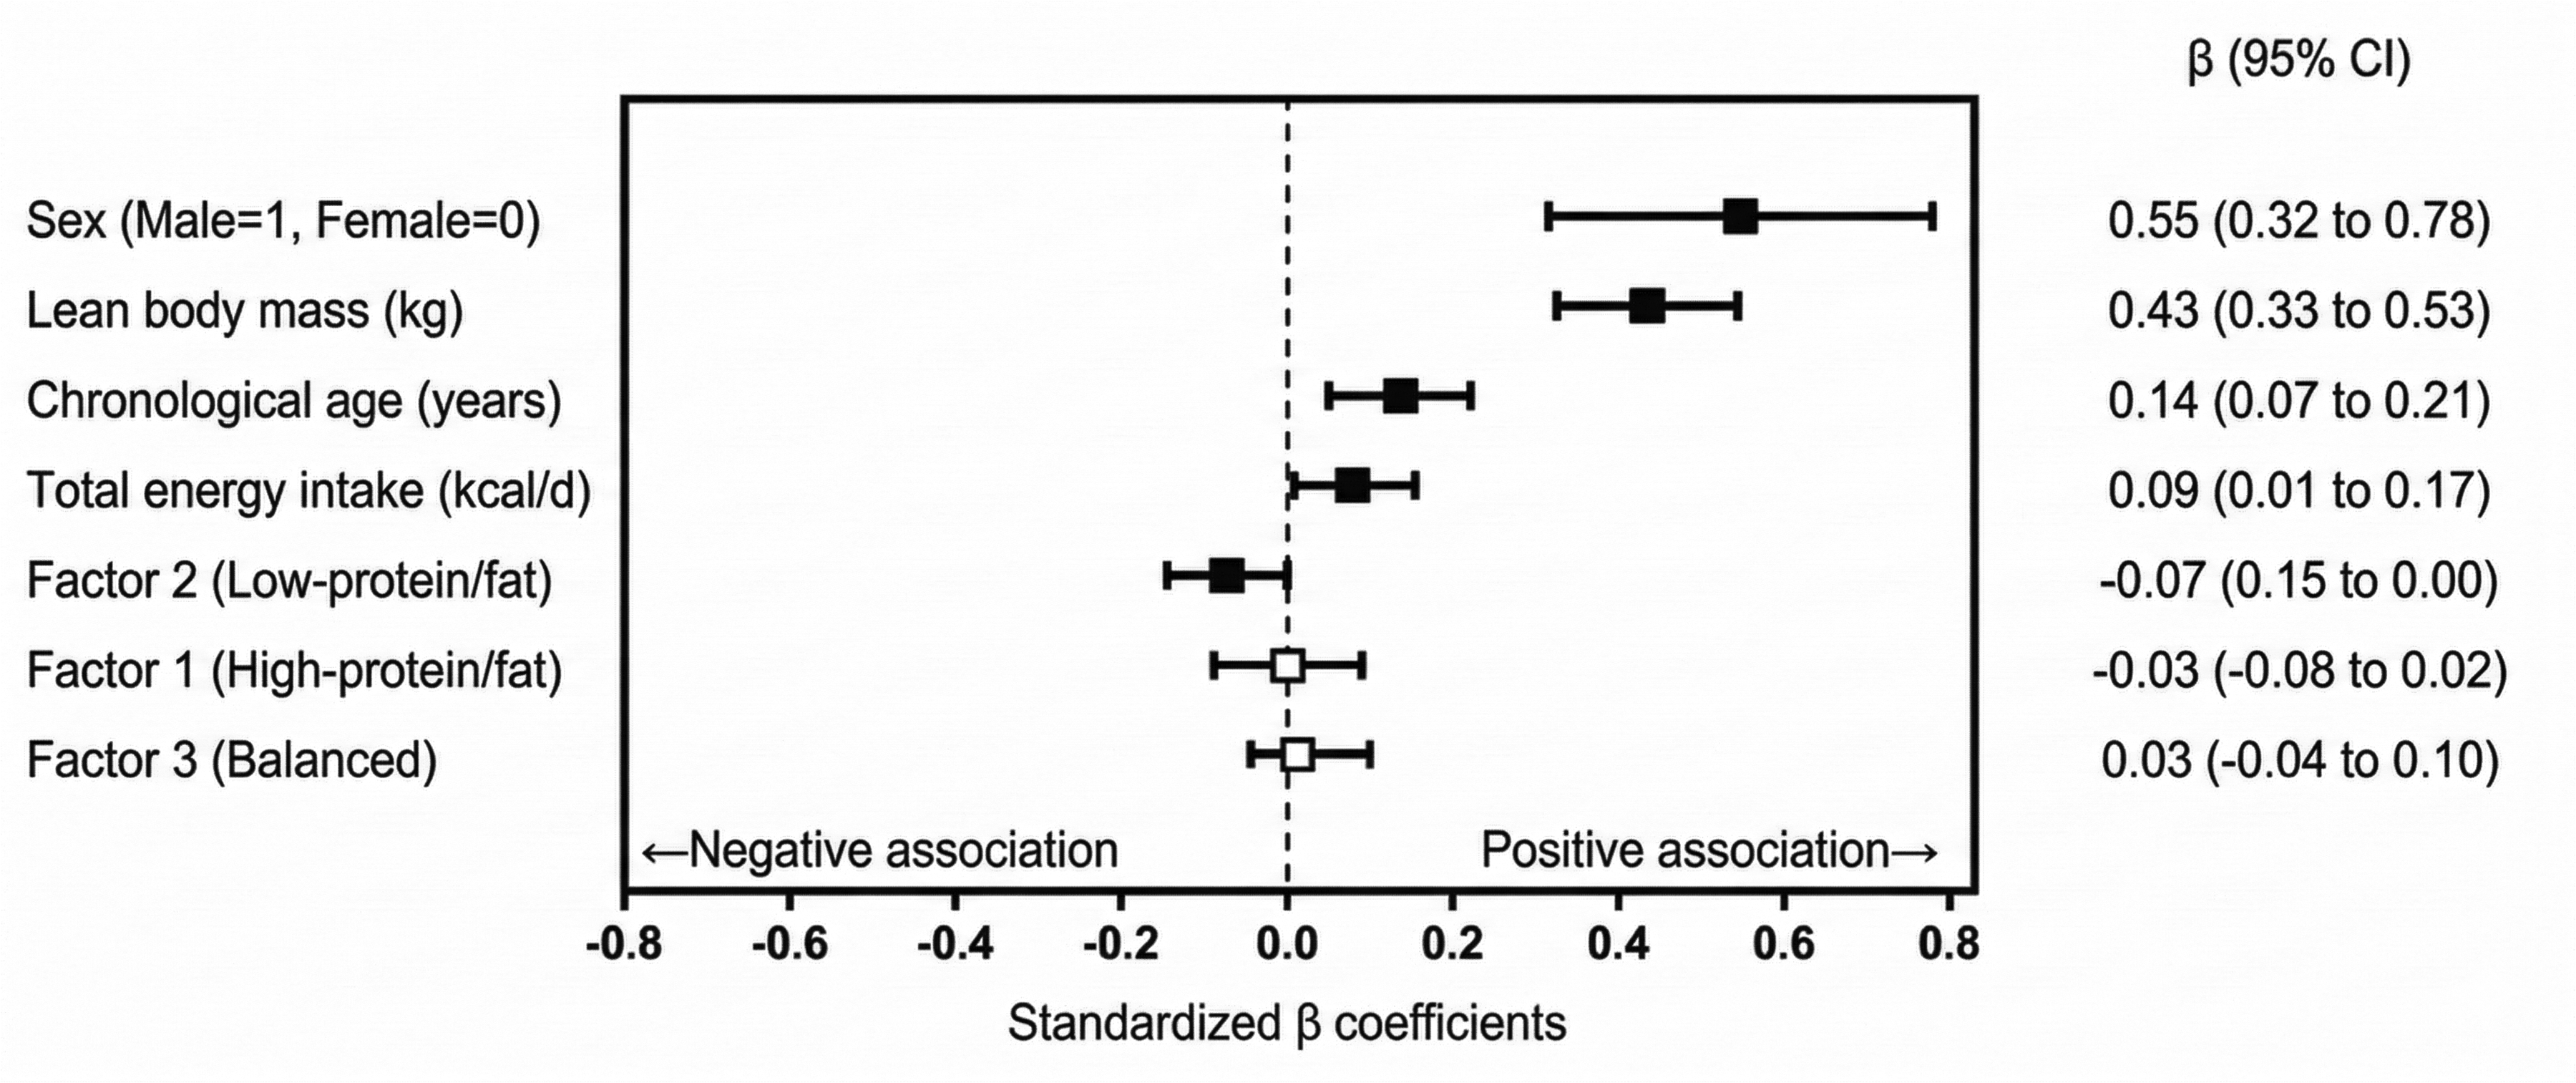
Standardised regression coefficients (β) and 95% confidence intervals (CIs) from the linear mixed-effects model predicting clubhead speed (CHS). The model included sex, lean body mass, age, total energy intake and the three identified dietary patterns as fixed effects, with participant ID included as a random effect to account for repeated measurements across 5 years. Solid squares denote statistically significant predictors (p < 0.05), whereas open squares with grey CIs indicate non-significant predictors. Vertical dashed line at β = 0 represents the null value. Variables positioned to the right of this line indicate positive associations with CHS, whereas those to the left indicate negative associations. Note: β coefficients and 95% CIs are rounded to two decimal places. The exact value for Factor 2 was β = −0.073 (95% CI: −0.145 to −0.002).
Linear mixed-effects model predicting clubhead speed (n = 244).
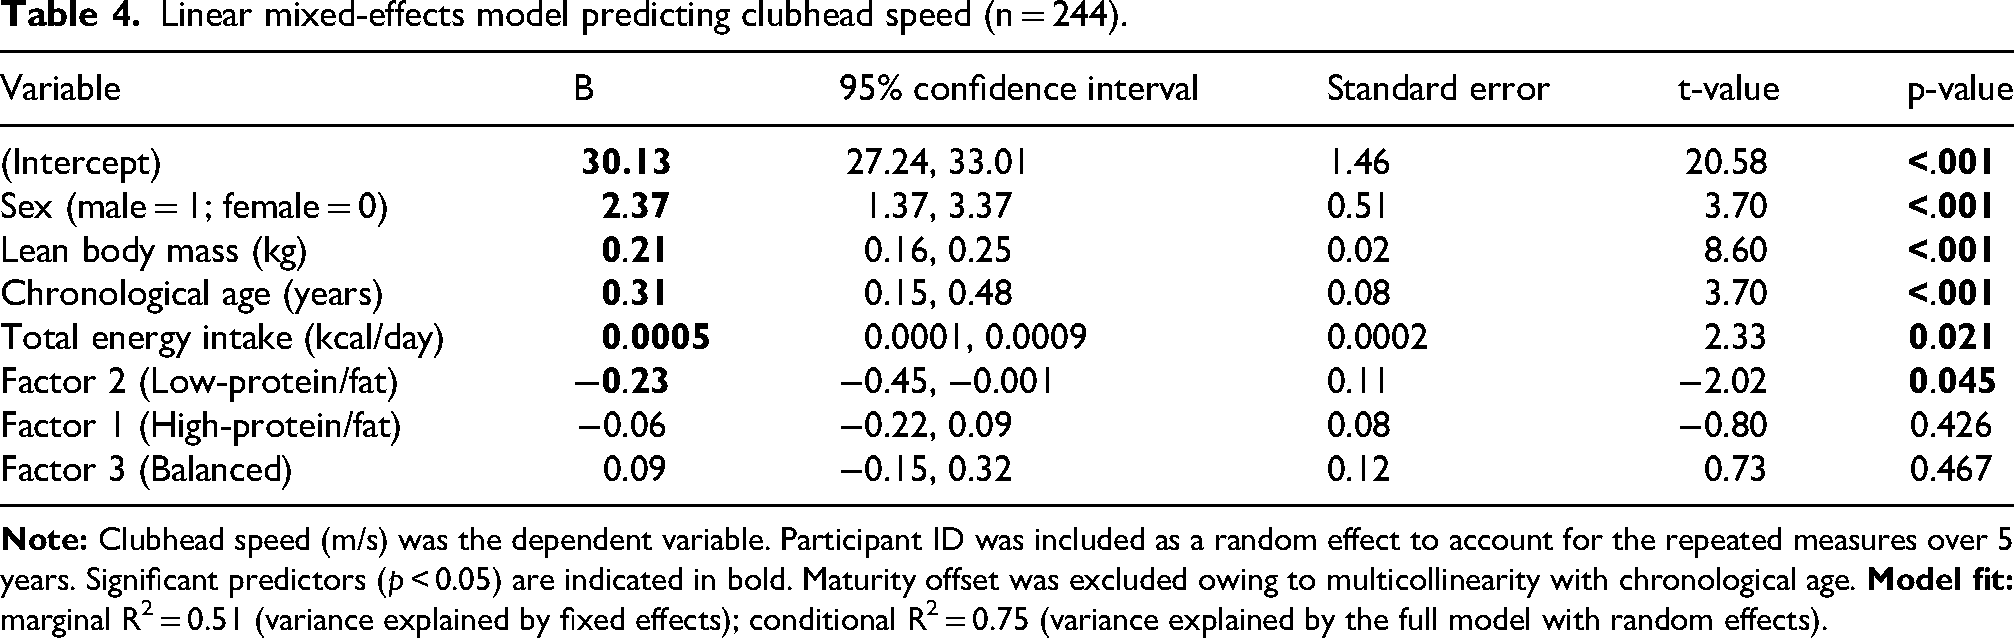
Regarding nutritional factors, total energy intake significantly positively predicted CHS (B = 0.0005, 95% CI: 0.0001 to 0.0009, p = 0.021; β = 0.09). Notably, although statistically significant, the practical importance of total energy intake for predicting CHS development appeared modest compared with the predominant contribution of LBM (β = 0.43). Meanwhile, the low-protein/fat dietary pattern (Factor 2) significantly negatively predicted CHS (B = −0.23, 95% CI: −0.45 to −0.001, p = 0.045; β = −0.07), suggesting that lower protein and fat intake relative to carbohydrates was associated with attenuated long-term performance development. Factors 1 and 3 were not significantly associated with CHS (p > 0.05). Sensitivity analysis confirmed the robustness of the results; substituting chronological age with maturity offset yielded consistent findings, with LBM, energy intake and Factor 2 maintaining statistical significance (Table S1).
Discussion
The present 5-year longitudinal study demonstrated that LBM is the primary modifiable predictor of CHS development in elite junior golfers, showing a standardised coefficient approximately threefold greater than that of chronological growth. Our LMM established a clear longitudinal benchmark: every 1-kg increment in LBM was associated with a 0.21 m/s increase in CHS (B = 0.21). Accounting for 75% of the total variance in speed development, the explanatory power of this model is remarkably high compared to similar longitudinal studies in youth sports, which typically report variances between 40% and 60%.12,20 This study provides a high-precision predictive model that advances beyond prior cross-sectional evidence. The findings also highlight the dual role of nutrition: total energy intake provides the caloric foundation (β = 0.09) while a dietary pattern characterised by relatively lower protein and fat intake (Factor 2) significantly attenuates performance gains (β = −0.07), even after accounting for total caloric intake. Collectively, these results suggest that proactive, strategic accumulation of functional muscle mass, supported by macronutrient-dense nutrition, exerts a far greater contribution to speed development in elite junior golfers compared with passive reliance on biological maturation. Although biological growth and structural maturation contribute to adolescent performance, the present findings indicate that the ‘quality’ of growth, specifically increases in LBM, is a superior predictor of elite-level velocity gains.
Our findings directly address the critical knowledge gaps identified by Giuriato et al. 7 Although their review highlighted a global lack of longitudinal evidence on LBM in adolescent athletes, our data fill this “empirical void” in the context of elite junior golf. Longitudinal analysis confirmed LBM as the most potent modifiable predictor of CHS, with a standardised coefficient (β = 0.43) tripling that of chronological age (β = 0.14). Sensitivity analysis, substituting chronological age with maturity offset yielded consistent results, reinforcing the independent role of LBM. By confirming that each 1-kg LBM gain corresponds to a 0.21 m/s increase in CHS (B = 0.21), these findings move the field from theoretical assumptions 7 to a precise, evidence-based predictive model. Although biological maturation naturally increases height and limb length, extending the lever arm of the golf swing, 4 our data indicate that active accumulation of functional muscle mass, rather than passive structural growth, is a primary contributor to CHS.
The physiological basis for the observed relationship likely involves increased capacity for force generation and efficient utilisation of ground reaction forces associated with higher LBM. As noted in a previous study, 26 the muscular system functions as the primary power generator in the golf swing, where fat-free mass provides essential contractile tissue to support high-velocity movements. Modern biomechanical models show that elite speed is generated by transferring ground reaction forces efficiently through the kinetic chain, 27 a process dependent on a robust “functional engine” that converts lower-body power into rotational velocity. In our cohort, this is evidenced by strong longitudinal correlations between CHS and muscle power proxies, such as grip strength (r = 0.83) and standing long jump (r = 0.76), mirroring the physical profiles of elite adult professional golfers. 1 These results confirm that elite juniors share reliance on the same mechanics of speed generation with adults, provided they possess sufficient LBM.
A key finding of this study is the divergent associations of dietary quantity versus quality on longitudinal CHS development. By examining dietary patterns rather than isolated nutrients, the study provides novel insight into long-term CHS progression. Total energy intake was a positive predictor (β = 0.09), 10 confirming that meeting basic metabolic demands is essential for athletic growth. In contrast, the “low-protein/fat” dietary pattern (Factor 2; β = −0.07) attenuated performance development. This pattern, characterised by high fruit and carbohydrate intake but lower contributions from protein- and fat-rich food groups, represents a suboptimal nutritional balance that limits long-term power development, even when caloric intake is statistically controlled.
Physiologically, the negative association of Factor 2 on CHS likely reflects two physiological pathways related to the “metabolic constraints” of the functional engine. First, reduced protein intake may limit substrate availability required for muscle protein synthesis, lowering the efficiency of LBM accretion, the primary predictor for CHS.11,28 Second, lower fat intake diminishes dietary energy density, making it challenging for elite junior athletes to meet the caloric demands of growth and high-intensity training. Given our cohort's mean negative energy balance (−256.5 ± 767.2 kcal/day), which was more pronounced in females (−378.6 ± 656.8 kcal/day), athletes may be at risk of low energy availability, a core feature of REDs.10,29 This dietary imbalance may further compromise the anabolic environment required for muscle development, indicating that dietary “quality,” particularly sufficient protein and energy density, rather than overall food volume is more important for performance development.
These findings provide an evidence-based roadmap for long-term development in elite junior golfers. LBM emerged as the primary modifiable predictor of CHS progression (β = 0.43), establishing a physical benchmark where each 1-kg LBM increase corresponds to a 0.21 m/s CHS gain (B = 0.21). 26 Considering the 5-year adolescent growth spurt, a 10-kg LBM gain is a realistic physiological target for elite male juniors through appropriate training and nutrition. According to our model, this increase could yield a 2 m/s CHS gain, translating to an estimated 14-yard increase in driving distance (∼7 yards per 1 m/s CHS), 1 assuming standardised environmental conditions and equipment specifications.
Although LBM provides a critical foundation, the cohort's explosive power (mean standing long jump: 197.4 cm) remains comparable to the national average (∼194 cm), indicating scope for targeted training interventions. Practitioners should integrate power and plyometric interventions30,31 while maintaining the “anabolic environment” through energy-dense, protein-rich and fat-rich nutrition.10,28 Prioritising dietary quality supports LBM accretion and hormonal health, enabling CHS progression to translate structural growth into enhanced on-course performance.
This study's primary strength lies in its unprecedented 5-year longitudinal design, following a rare cohort of elite junior golfers. This approach overcomes cross-sectional limitations, providing robust insights into the associations of LBM and nutrition on adolescent performance. PCA-based dietary pattern analysis provided a more holistic understanding of nutritional quality in the context of athletic progression, moving beyond isolated nutrient metrics. Nevertheless, several limitations of the study must be acknowledged. First, dietary data were self-reported, potentially introducing under-reporting and recall bias. 32 Future studies using objective monitoring of energy expenditure via wearable accelerometers 33 or validated digital dietary assessment tools would improve accuracy. Second, although chronological age was controlled in our primary model and biological maturation accounted for through the inclusion of maturity offset in sensitivity analysis, 9 maturation was not directly measured via gold-standard clinical methods, such as bone age assessment. As highlighted by Malina et al., 34 discrepancies between estimated and actual maturation may affect interpretation of growth-related performance gains; therefore, incorporating direct maturation markers in future longitudinal models is essential for isolating pure training effects from biological spurts. Furthermore, LBM was used as a surrogate for physical capacity, but neuromuscular quality and rate of force development, both key predictors of explosive power in golf, were not assessed.35,36 Furthermore, these findings should be interpreted within a broader biomechanical framework. Although our longitudinal model highlights the predominant contribution of LBM, CHS development in elite juniors is also associated with maturation of motor coordination and sequencing efficiency. As proposed in prior biomechanical models, 7 the capacity to effectively utilise ground reaction forces and optimise segmental timing within the kinetic chain likely develops alongside structural growth. Future research integrating high-speed 3D motion analysis with physiological tracking will be essential to clarify how these neuromuscular and technical proficiencies interact with LBM accretion to maximise explosive performance. Accounting for technical evolution and equipment changes will also provide a more comprehensive picture of modern golf performance development. Finally, potential survival bias suggests that our findings primarily apply to highly resilient elite subgroups; broader investigations across diverse performance levels are warranted to generalise these developmental principles. Despite these limitations and research gaps, the present study offers critical insights into the interplay between physical development and nutritional quality in elite junior golfer progression.
Conclusion
In conclusion, this 5-year longitudinal study identifies LBM as a prominent modifiable predictor of CHS development in elite junior golfers, exerting a greater contribution than chronological age (β = 0.43 vs. 0.14). Our model indicates that each 1 kg increase in LBM corresponds to a 0.21 m/s rise in CHS (B = 0.21). Furthermore, while total energy intake provides a foundation for growth, specific macronutrient composition appears to be a key factor, as a dietary pattern relatively low in protein and fat was associated with attenuated CHS gains. Given these findings and the energy deficits observed in this cohort, these longitudinal associations provide valuable insights for coaches and sports nutritionists. Specifically, long-term athletic development programmes in junior golf may benefit from educational strategies promoting adequate total energy intake, along with sufficient protein and fat intake, to support LBM accrual and subsequent CHS development.
Practical implications
Supplemental Material
sj-docx-1-spo-10.1177_17479541261457580 - Supplemental material for Five-year longitudinal predictors of clubhead speed in elite junior golfers: Predominant contribution of lean body mass and dietary patterns
Supplemental material, sj-docx-1-spo-10.1177_17479541261457580 for Five-year longitudinal predictors of clubhead speed in elite junior golfers: Predominant contribution of lean body mass and dietary patterns by Yosuke Nagashima, Keigo Tsuchiya, Teruhiko Hisaoka, Tomonori Sato, Yoshitomo Ehara, Akiko Horikawa, Akiyo Shiohara, Ayana Mitsume, Shigeru Mineo and Hiroaki Yoshida in International Journal of Sports Science & Coaching
Footnotes
Abbreviations
Acknowledgments
We extend our sincere gratitude and deep appreciation to all study participants and their guardians, the Kanto Golf Association, and the Chiba Prefectural General Sports Center for their invaluable cooperation in this research investigation.
Ethical considerations
This study was conducted in accordance with the Declaration of Helsinki and was approved by the Ethics Committee of Musashigaoka Junior College, Japan (No. 25-3, February 9, 2026) and the Kanto Golf Association Junior Development Committee.
Consent to participate
The requirement for written informed consent was waived by the institutional review board due to the retrospective and observational nature of the study. Instead, an opt-out method was employed, allowing participants and their parents/guardians to refuse the use of their data at any time.
Consent for publication
Not applicable.
CRediT author statement
Funding
The authors received no financial support for the research, authorship, and/or publication of this article.
Declaration of conflicting interests
The authors declared no potential conflicts of interest with respect to the research, authorship, and/or publication of this article.
Data availability
The datasets generated and/or analysed during this study are not publicly available because our ethical approval did not include the use of these data by other researchers. The materials pertinent to this study are available from the corresponding author upon reasonable request.
Declaration of generative AI and AI-assisted technologies in the writing process
During the preparation of this work, the authors used Gemini (Google) in order to improve the English expression and logical flow of the manuscript. After using this tool, the authors reviewed and edited the content as needed and take full responsibility for the content of the published article.
Supplemental material
Supplemental material for this article is available online.
References
Supplementary Material
Please find the following supplemental material available below.
For Open Access articles published under a Creative Commons License, all supplemental material carries the same license as the article it is associated with.
For non-Open Access articles published, all supplemental material carries a non-exclusive license, and permission requests for re-use of supplemental material or any part of supplemental material shall be sent directly to the copyright owner as specified in the copyright notice associated with the article.