
Abstract
Assessing running biomechanics is crucial for optimising performance and supporting rehabilitation in field-based team sports. While marker-based three-dimensional motion capture systems are considered the reference standard for assessing kinematics in controlled environments, their high cost and limited feasibility restrict on-field application. Recent advancements in computer vision offer more accessible, non-invasive alternatives. This study evaluated the accuracy and concurrent validity of VueMotion, a 2D camera-based computer vision system, for measuring sprinting kinematics. Twenty-five elite and sub-elite athletes completed four maximal 10-metre fly efforts (100 total trials), with their kinematics measured concurrently by VueMotion and a 3D motion capture system integrating infrared cameras and force plates. Root mean square errors for VueMotion peak velocity, ground contact time (GCT), and flight time were 0.19
Introduction
The ability to generate effective acceleration is critical in field-based team sports, where athletes are frequently required to perform brief repeated high-intensity sprint efforts.1,2 Acceleration performance is governed by the interaction between kinetic factors and kinematic characteristics.3,4 The capacity of an athlete to accelerate in a forward direction to displace their centre of mass (COM) is largely dependent on their ability to overcome inertia, whether starting from a stationary or moving position. 5 This capacity is primarily determined by the magnitude and orientation of ground reaction forces and the resulting propulsive impulses, particularly in the horizontal direction. These mechanical outputs are strongly associated with key spatiotemporal gait-related characteristics, including ground contact time (GCT), flight time, step length, and step frequency.6–8
In field-based team sports, sprinting actions typically involve rapid, high-speed movements performed repeatedly and under varying directional demands. 1 Consequently, the accurate and valid assessment of sprinting and acceleration-related biomechanical metrics is essential for monitoring performance adaptations and identifying mechanical inefficiencies or asymmetries that may predispose athletes to injury. 9 Therefore, the availability of valid and reliable biomechanical assessment tools is critical for practitioners to allow informed decision-making and targeted training interventions that both enhance sprint performance and reduce injury risk in athletes.
Technological advancements have significantly transformed biomechanical methods for capturing human movement. These methods have evolved from manual image annotation to marker-based optical systems, inertial sensors, and, more recently, markerless systems that employ advanced body models, computer vision, and machine-learning techniques.10,11 In sports biomechanics, marker-based three-dimensional (3D) motion capture systems are widely regarded as the reference standard for quantifying kinematic data during dynamic athletic movements in controlled, artificial laboratory environments. When appropriately calibrated and implemented, these systems have demonstrated sub-millimetre spatial accuracy in tracking reflective markers.11,12 Although techniques such as bi-planar video radiography can provide more precise measurements of skeletal motion, their application is typically restricted to highly controlled experimental settings and limited capture volumes. 13 As such, 3D motion capture systems remain the most commonly used benchmark for validating emerging biomechanical measurement technologies in sport-specific movement analyses. This is largely attributable to the systems’ capacity to estimate the position and orientation (pose) of human movements based on six degrees of freedom: three relating to translation (i.e., forward and backward, up and down, left and right) and three defining orientation (i.e., roll, pitch, and yaw).10,14 Complementing 3D motion capture, ground-embedded force plates are widely regarded as the criterion standard for measuring temporal gait events, including GCT and flight time, due to their capacity to resolve ground reaction force profiles with high temporal precision. Typically operating at sampling frequencies of 1000–2000 Hz, force plates enable accurate detection of foot strike and toe-off events by applying vertical force thresholds, providing precise gait event detection that is not affected by observer-dependent marker placement or optical tracking constraints.15,16 However, the practical deployment of both 3D motion capture and force plates systems in sport-specific environments is constrained by their operational and setup costs and restrictions to laboratory or purpose-built facilities, limiting their use within many sporting organisations.12,17 Hence, further investigation into the application of low-cost, easy-to-administer, markerless assessment systems for evaluating spatiotemporal gait-related metrics during running is warranted.
In recent years, markerless motion capture technologies have emerged to address the challenges associated with laboratory-based systems.10,18 These systems commonly employ human pose estimation techniques based on two-dimensional (2D) or 3D video data streams. 19 However, within applied sports settings, single (sagittal view) or double (sagittal and frontal views) 2D camera-based approaches are often preferred due to their ability to capture essential kinematic and kinetic parameters, as well as spatiotemporal gait-related metrics without hindering the athlete or altering their natural movement patterns; this being recognised as an essential criterion for effective on-field biomechanical analysis.10,19 Typically, these systems utilise high-definition, high-frame-rate digital video recording devices such as smartphones, tablets, or action cameras (e.g., GoPro), reducing reliance on expensive instrumentation and enabling more practical, scalable deployment in field environments.10,18,20 Consequently, 2D camera-based markerless systems are increasingly regarded as viable tools for biomechanical assessment in real-world settings and have been widely adopted for analysing sprint performance and sport-specific movement patterns in applied practice. 13 Nonetheless, the validity and reliability of these systems for accurately capturing biomechanical variables under dynamic, sport-specific conditions remain largely under-investigated and require further research.
Aligned with this shift in technologies are recent advancements in the automated digitisation of human movement that leverage deep learning techniques for pose estimation, which have now been integrated into 2D camera-based markerless systems. This progression in automative technologies has provided a more accessible, time-efficient, and streamlined alternative to traditional manual frame-by-frame movement digitisation.21,22 However, unlike 3D motion capture systems, automated 2D systems typically operate by capturing only two degrees of freedom per tracked point. 10 Therefore, they lack the capability to measure depth or rotational movements around any axis unless these parameters are estimated indirectly or derived through specific assumptions. This inherently limits 2D analyses to movements confined to a single anatomical plane (e.g., sagittal or frontal) and restricts their ability to fully capture 3D joint kinematics and segmental orientations required to infer spatiotemporal gait-related metrics.18,21 Computer vision algorithms appear to have addressed some of the limitations traditionally associated with 2D camera-based markerless systems, with several studies reporting strong agreement between these technologies and criterion marker-based motion capture systems.14,23,24 However, research on 2D camera-based computer vision approaches has predominantly focused on assessing standard walking gait or dynamic tasks that differ substantially from the biomechanics of running.10,19,25 Thus, the precision and quality of these systems compared to more established motion analysis technologies for evaluating running biomechanics remain unclear.26,27 As such, further research is needed to validate the accuracy and applicability of 2D camera-based computer vision systems for capturing the complex biomechanical demands of running in field-based team sports.
VueMotion is a commercially available 2D camera-based markerless system that employs computer vision techniques to estimate and evaluate human movement kinematics. Despite its increasing applications in sports, no studies to date have examined the accuracy of kinematics and spatiotemporal gait-related metrics generated by VueMotion relative to criterion reference systems during sprinting. Guided by the Sport Technology Quality Framework, 28 this study aims to establish the accuracy and concurrent validity of VueMotion-derived measurements of GCT and flight time against force plate-derived reference values, and of step length, step frequency, peak velocity, and instantaneous velocity and acceleration against a VICON 3D infrared camera motion capture system. In doing so, this study sought to determine the quality of VueMotion outputs for running biomechanics assessment and their suitability for applied field-based contexts.
Materials and methods
Participants
Twenty-five elite and sub-elite athletes participated in the study, including 16 females and 9 males (22.9 ± 5.34 years). The sample comprised Australian footballers (n = 19), soccer players (n = 4), and track and field sprinters (n = 2), providing a heterogeneous cohort of athletes with varying levels of sprint-specific technical training and ability relevant to the validation of running biomechanics measures. Participants’ training regimes ranged from three to five moderate-to-high-intensity sessions per week, including on-field running and gym-based training. Prior to participation, all participants were screened using the Exercise and Sports Science Australia (ESSA) Adult Pre-exercise Screening System 29 to determine whether they had any recent injuries (i.e., last 6 months) or underlying adverse medical conditions that may affect their ability to exert maximum effort during each sprint trial. The study received ethical approval from the university Human Research Ethics Committee (HRE24-044), and participants provided written informed consent before participation.
Procedure
A set warm-up, including mobility exercises, dynamic stretching, and running strides activation, was completed prior to three familiarisation sprint trials at 70%, 80%, and 90% of the participant's maximal velocity. Following the warm-up, participants were asked to perform four maximal linear sprinting accelerations (10 m fly), with a two-to-three-minute recovery period provided between each max repetition. Maximal efforts were initiated from an approach distance of 10 m prior to entering the flying 10 m area situated over an instrumented runway of force plates (Figure 1), followed by 10 m deceleration to a complete stop. During data collection, participants wore a custom Lycra and Velcro VICON motion capture lower-body suit, with 18 retro-reflective spherical markers (14 mm diameter) and four four-marker rigid body clusters placed onto key body landmarks (i.e., hips, upper legs, lower legs, and feet). Marker placement was guided by the VICON Plug-In Gait (PiG) lower body model for 3D motion analysis, 30 with the addition of rigid body clusters on the thigh and shank of the participants. As VueMotion derives gait-related variables with reference to the hips and toes, the PiG VICON model was selected as it best aligned with the key tracking landmarks of VueMotion. 3D spatiotemporal metrics were collected via a 38-infrared camera 3D motion analysis system (12 × MX T40-S, 9 × Vantage 5, 15 × Vantage 8, 2 × Vantage 16; Vicon Motion System Ltd, Oxford, UK), capturing at 100 Hz. In addition, 10 ground-embedded force plates (AMTI BMS600900; AMTI, Watertown, MA, USA), capturing at 1000 Hz (Figure 1), were used to determine GCT. Cameras and force plates were synchronised via VICON Nexus software (version 2.15; Vicon Motion System Ltd, Oxford, UK), with all trials recorded through Nexus. Furthermore, four VICON reflective spherical markers (25 mm diameter) were placed adjacent to each start and finish cone to allow the 3D motion analysis system to identify the 10 m fly capturing space.
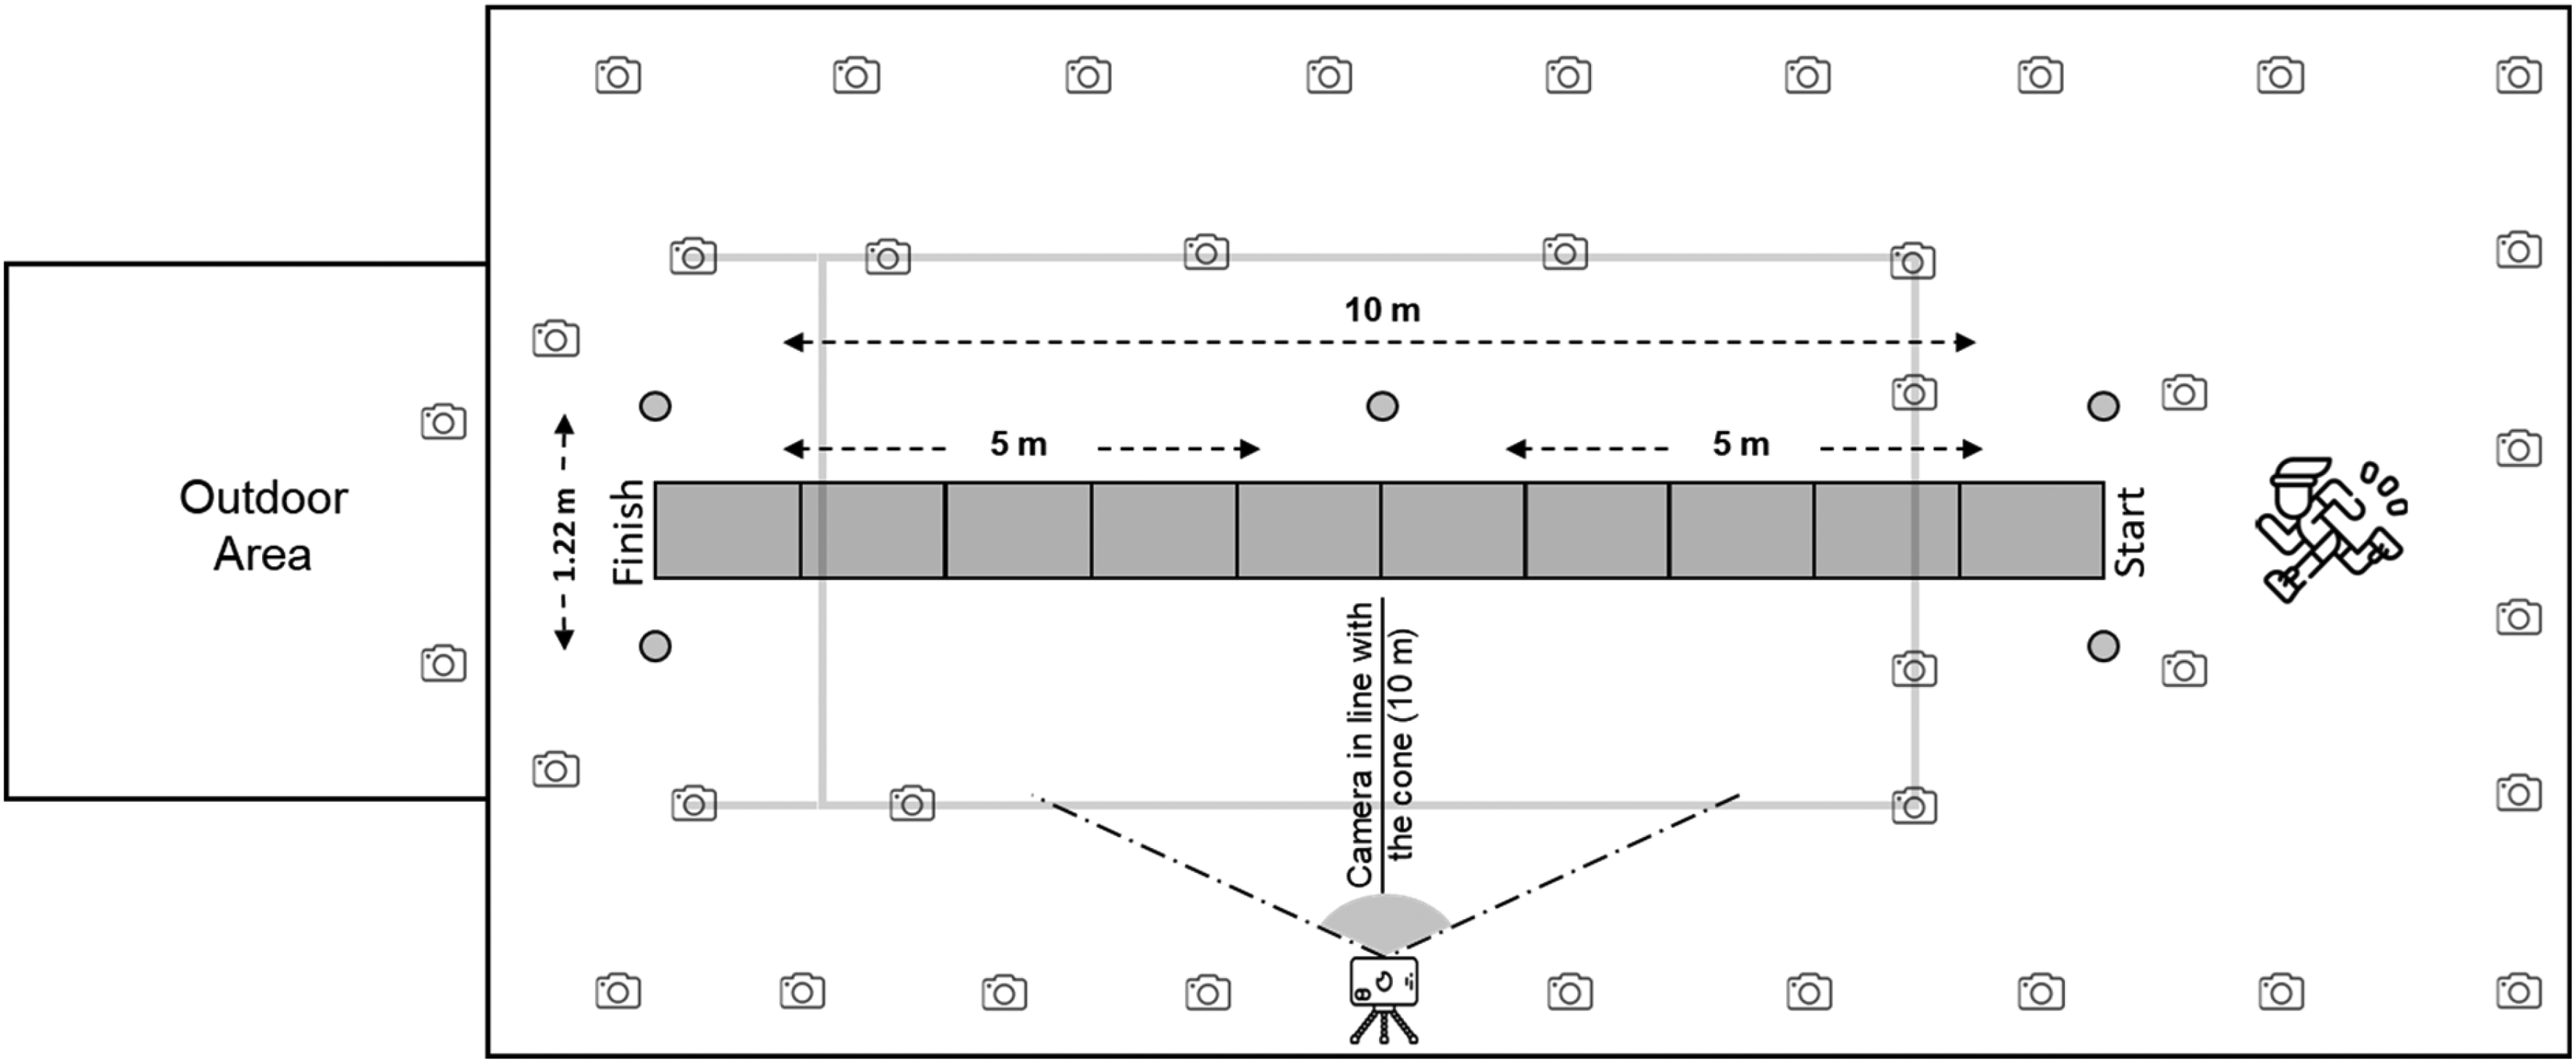
Biomechanics laboratory setup highlighting the VueMotion system, including the iPhone and cones positioning, and the 3D motion capture system.
Concurrently, body landmarks were tracked in 2D using VueMotion. As per manufacturer recommendations, the VueMotion system setup comprised an iPhone 11 (iOS 17.6.1; Apple Inc., Cupertino, CA, USA) configured to record at 4 K (3840 × 2160 pixels) at 60 frames per second (fps). The iPhone was mounted on a tripod at a height of 1.60 m and positioned approximately 10 m in line from the midpoint mark of the capturing 10 m zone. The capturing area was demarcated using one set of cones at 0 m (start) and 10 m (finish), with an additional cone positioned at the 5 m mark on the far side of the runway aligned with the iPhone's location. The two cones in each set were placed 1.22 m apart (Figure 1). Raw video files were uploaded to the cloud-based VueMotion platform for processing. The system applies proprietary algorithms to detect key action events and estimate body pose points, enabling the calculation of spatiotemporal kinematic parameters. These outputs were then compiled into an end-user report for comparison with VICON data.
Data processing
Before extracting data from VICON Nexus, each trial was gap-filled using the Woltring spline algorithm over gaps of five frames maximum. Subsequently, all trials were manually labelled. Force plates’ vertical force traces (1000 Hz) were used to determine foot strike and toe-off events to infer gait-related variables of interest according to VueMotion's definitions. 31 A threshold of 50 N was used to determine the onset of foot contact on the force plates, as per best-practice recommendations.15,16 Specifically, GCT was computed as the duration between foot strike and toe-off events for the same foot. Flight time was determined as the interval between the toe-off event of one foot and the subsequent foot strike of the opposite foot. Step length was calculated as the cumulative distance covered over two consecutive steps (i.e., left-right or right-left) using the toe markers from VICON as reference. Step frequency was calculated as the number of steps per second. 31 Furthermore, events were created to establish the entry and exit points for participants in the flying 10 m area. These events were determined using the frame corresponding to when the participant crossed the capturing space (0 m) with the anterior foot toe marker and when they exited the space (10 m) with the posterior foot toe marker. No smoothing filter was applied to the VICON data prior to extraction.
VICON and VueMotion data were downloaded and imported into customised Microsoft Excel™ (Microsoft Corporation, Santa Rosa, CA, USA) spreadsheets, with processing and synching executed using RStudio® statistical computing software (version 2024.09.1; RStudio, Boston, MA, USA). VICON trial exports were cut to include only data collected within the capturing space and wrangled using readr, zoo, data.table, tidyr, dplyr, and signal R packages.32–37
Prior to data synchronisation, VICON COM linear velocity components from the x, y, and z axes (automatically computed by VICON Nexus via the World Root joint function) were converted to a resultant value to account for force applications and COM displacement occurring horizontally, vertically, and laterally as participants moved in a forward linear direction.7,38 The resultant COM acceleration was subsequently derived from the resultant velocity by numerically differentiating the velocity signal using a central difference method and reported and reported as
Data synchronisation between VueMotion and VICON was computed exclusively for instantaneous velocity and acceleration metrics. This process used the VICON system's reference time corresponding to when participants were within the 10 m capture zone. VueMotion data was up-sampled from 60 Hz to 600 Hz, and subsequently down-sampled to 100 Hz to match the sampling frequency of the VICON system. Instantaneous velocity and acceleration data from both technologies were aligned and shifted to the smallest root mean square error (RMSE) utilising shiny, ggplot2, plotly, data.table, and tidyverse R packages.34,42–47 The time shift was capped at 0.1 s to minimise data distortion due to the short duration required for participants to complete the 10 m fly trials. GCT, flight time, step length, and frequency were compared without synchronisation, relying solely on the experimental technology's efficacy to provide data across the entire 10 m. As this study aimed to assess VueMotion variables provided to the end user, no backend data was analysed.
Statistical analyses
A total of 100 sprints were collected across all trials. The GCT analysis occurred using 475 steps. Flight time, step length, and step frequency were computed on 375 steps, as VueMotion requires data preceding the first step to compute these metrics for the subsequent step (Table 1). Peak velocity, instantaneous velocity, and instantaneous acceleration were analysed for each sprint using the synchronised and aligned data. The distribution of each variable was assessed using the Kolmogorov-Smirnov test. VueMotion's GCT, flight time, and step frequency, as well as instantaneous velocity and acceleration from both VueMotion and VICON systems, were non-normally distributed. Therefore, non-parametric statistical analyses were employed for all variables. Descriptive analyses, mean absolute error (MAE), RMSE and mean bias, along with the 95% limits of agreement (LoA), were employed to assess the average magnitude of errors between predicted and actual values, as well as any systematic overestimation or underestimation in the VueMotion system.28,48 For the calculation of the LoA, only the first trial from each participant was used to avoid the dependency associated with including multiple sprints from the same individual. Results from the pooled dataset, incorporating all sprint efforts, were also obtained for comparison (Table 2). Spearman rank-order correlation coefficients (ρ) were computed to evaluate the linear relationship between technologies for all variables.49,50 The criteria for determining the correlation magnitude were established as follows: small, 0 to ≤ 0.69; medium, 0.70 to ≤ 0.89; large, ≥ 0.90. 51 Additionally, Bland-Altman plots with 95% LoA, including all sprint efforts, were produced to visually represent the agreement and distribution of differences both between and within participants across the two systems (Figure 2). Statistical analyses and plots were computed using readr, purrr, data.table, ggplot2, irrICC, lmtest, and tidyverse R packages.32,34,42,45,52,53
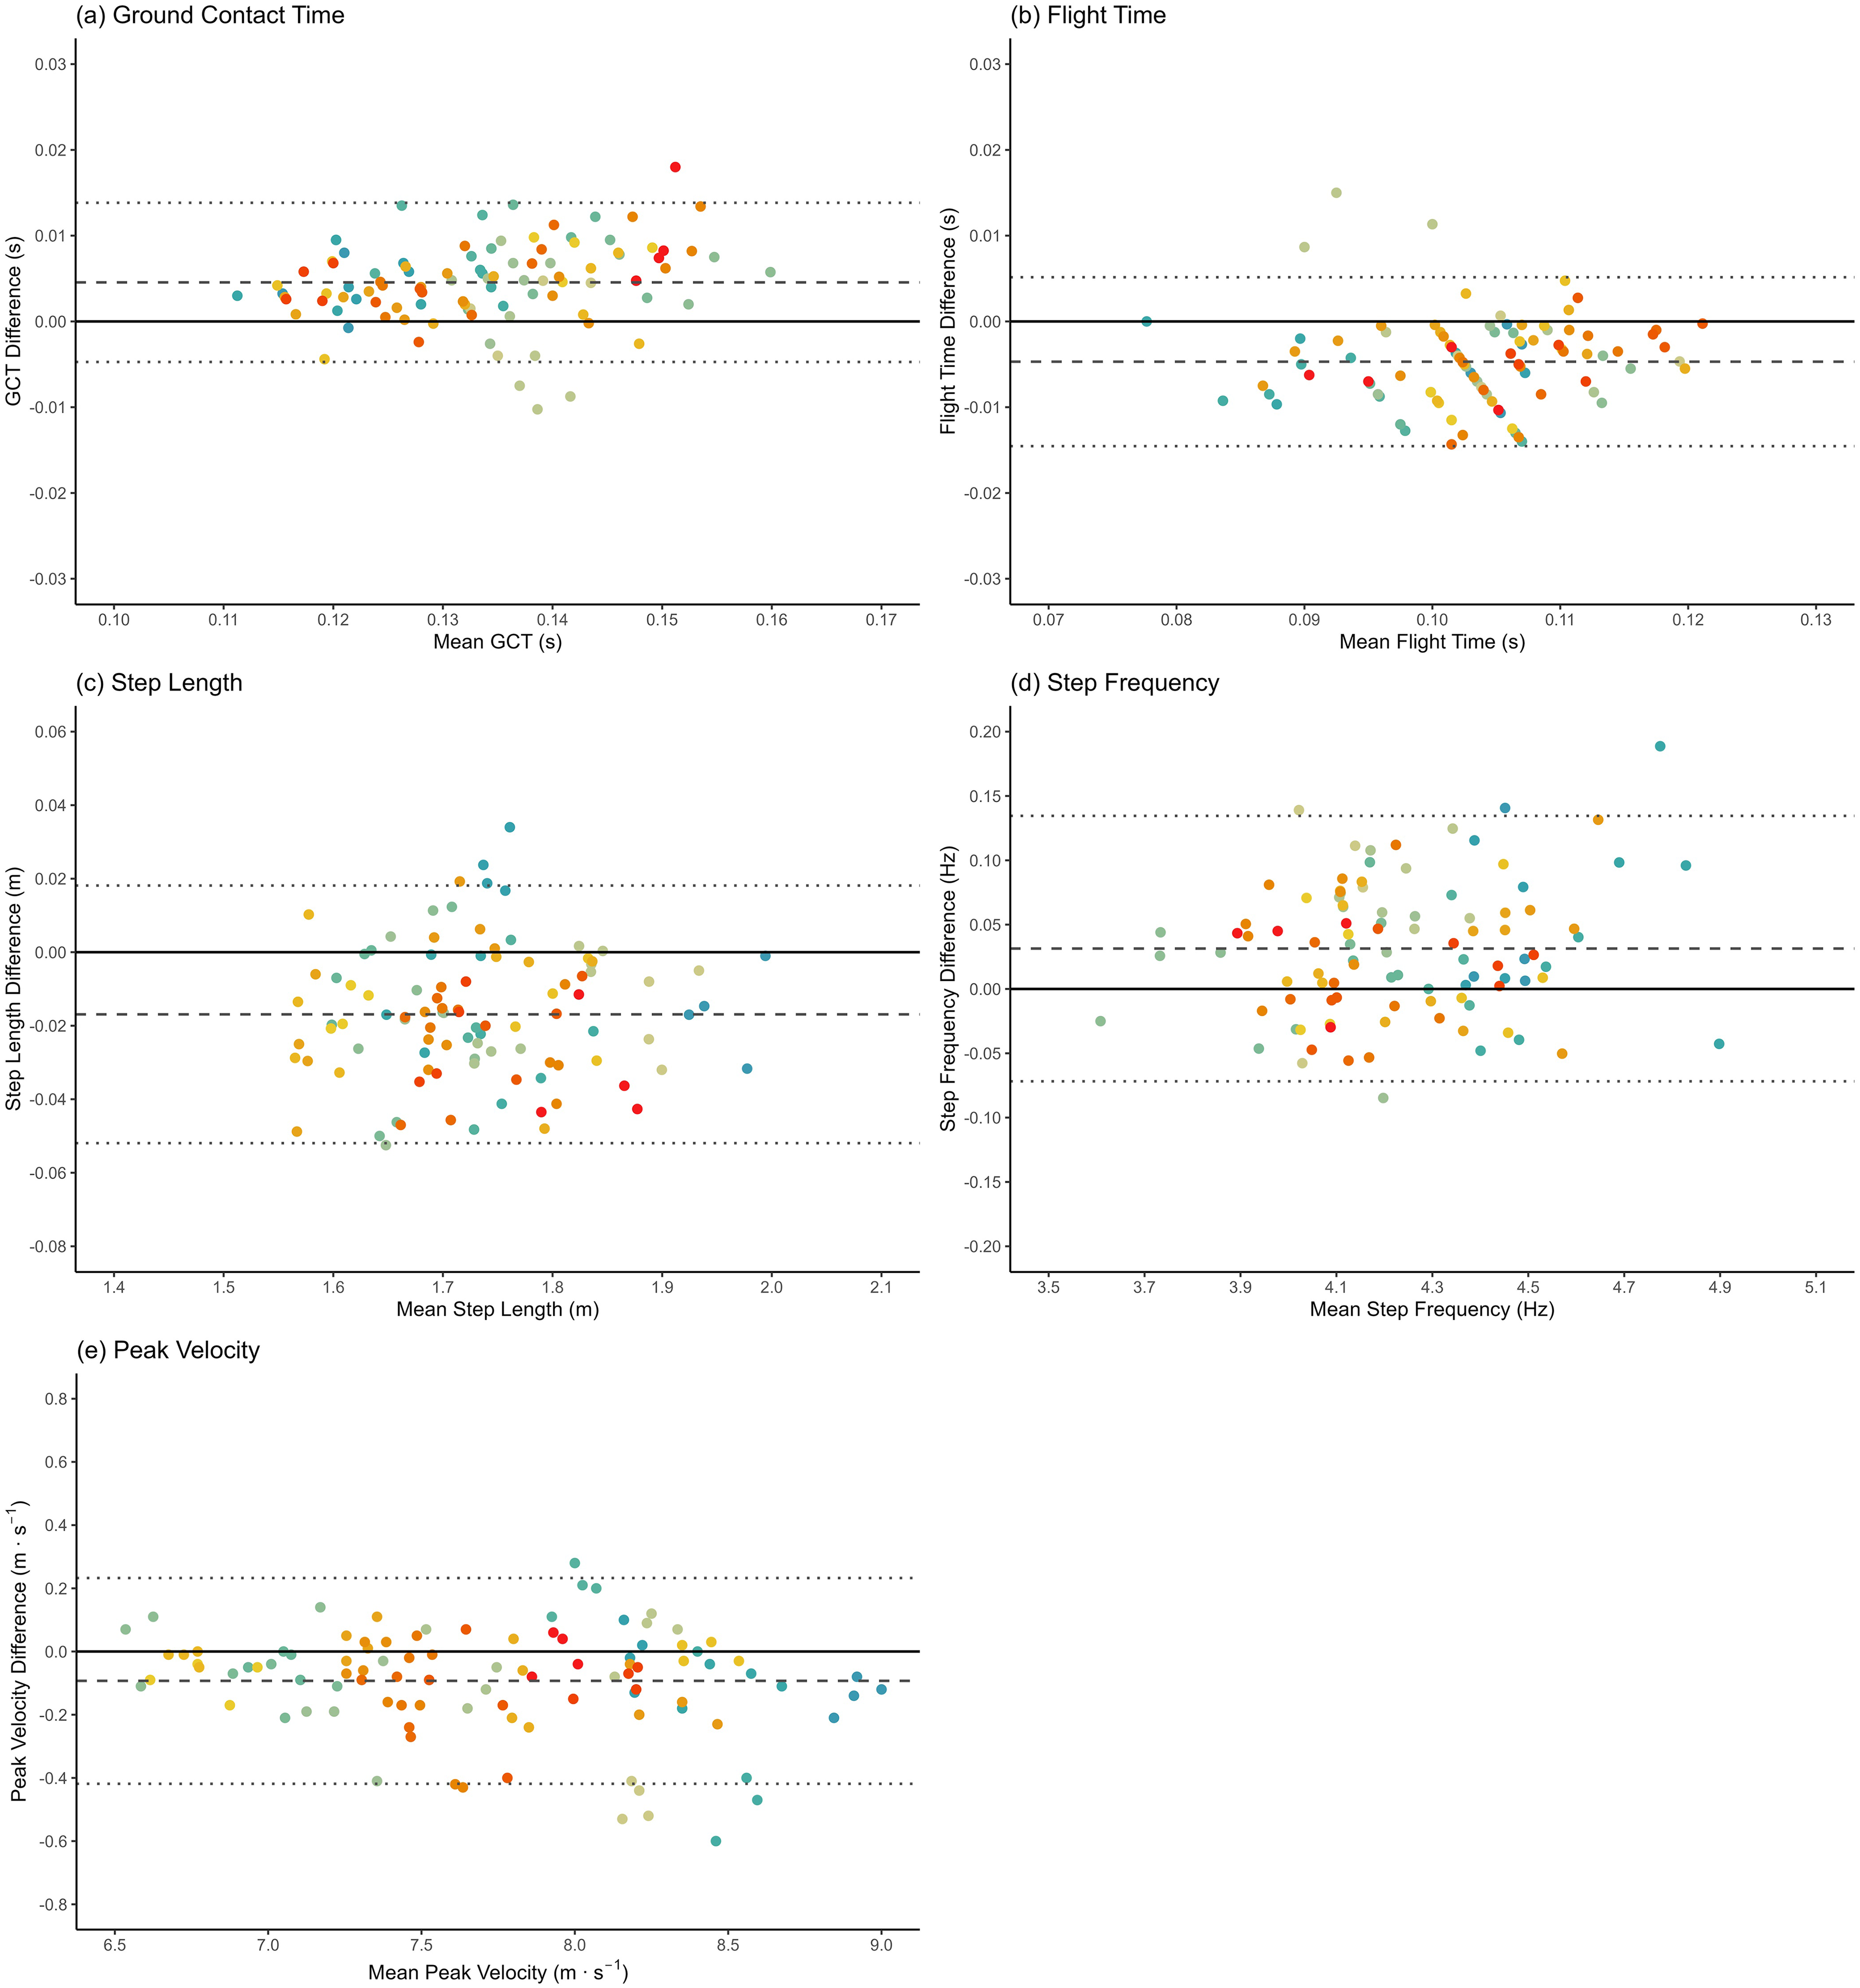
Bland-Altman plots comparing VueMotion and its respective reference systems for peak velocity and spatiotemporal gait-related metrics reporting mean difference and 95% LoA for all sprint efforts (n = 100). Note: (a) ground contact time; (b) flight time; (c) step length; (d) step frequency; (e) peak velocity. Dashed line = mean difference; dotted lines = 95% LoA (±1.96 × standard deviation of differences). Each colour represents a participant.
Participants’ sprints and steps classification.
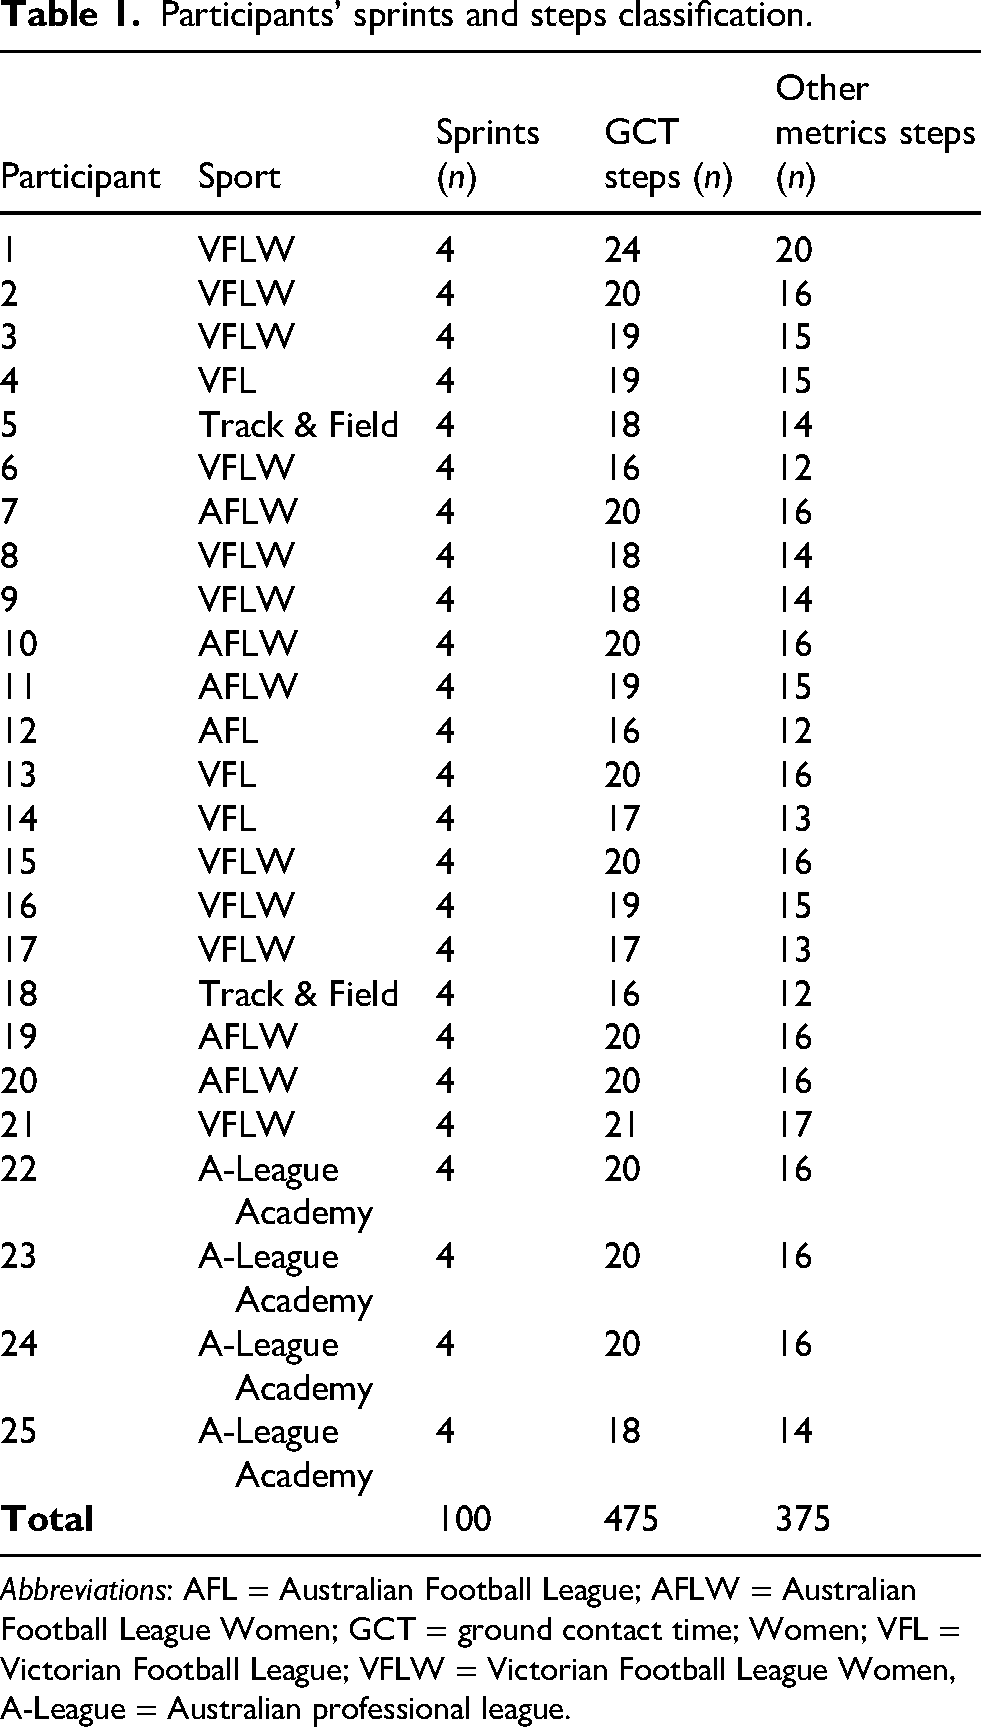
Abbreviations: AFL = Australian Football League; AFLW = Australian Football League Women; GCT = ground contact time; Women; VFL = Victorian Football League; VFLW = Victorian Football League Women, A-League = Australian professional league.
Accuracy and concurrent validity results.
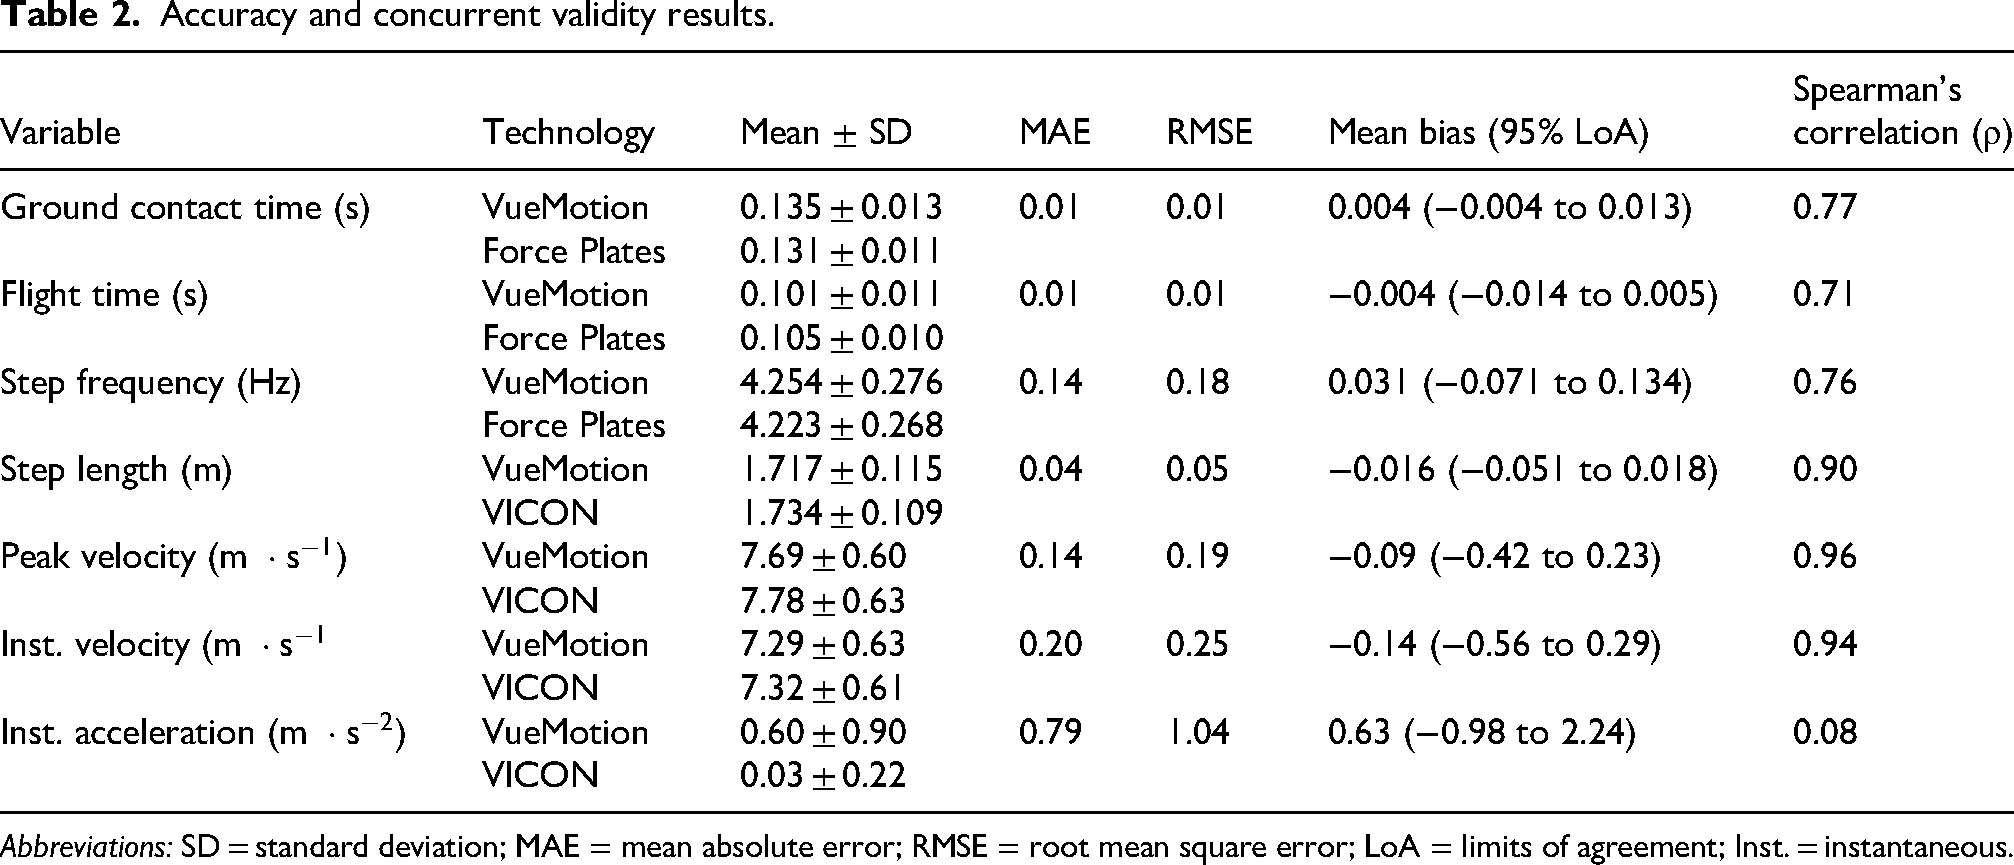
Abbreviations: SD = standard deviation; MAE = mean absolute error; RMSE = root mean square error; LoA = limits of agreement; Inst. = instantaneous.
Instantaneous velocity and acceleration were also analysed using statistical non-parametric mapping (SnPM). This technique facilitates frame-by-frame statistical comparison across the entire time series while preserving the temporal structure and continuity of the data. SnPM accounts for multiple comparisons across time points by applying random field theory, thereby enabling valid statistical inference across the whole waveform.54,55 Prior to analysis, signals were truncated to a maximum length of 110 frames for instantaneous velocity and 86 frames for instantaneous acceleration to ensure a consistent waveform length across trials. Each waveform was subsequently time-normalised using linear interpolation to represent 0–100% of the sprint duration, after which all trials were aggregated for analysis. Paired SnPM{t} tests were performed using permutation-based inference (10,000 iterations; two-tailed α = 0.05). SnPM test statistic trajectories were plotted alongside the corresponding critical threshold to identify significant clusters across the time-normalised sprint. SnPM data processing, statistical analysis, and visualisation (Figure 3) were conducted using dplyr, readr, reticulate, ggplot2, tidyr, purrr, and zoo R packages.32,33,35,36,42,56,57
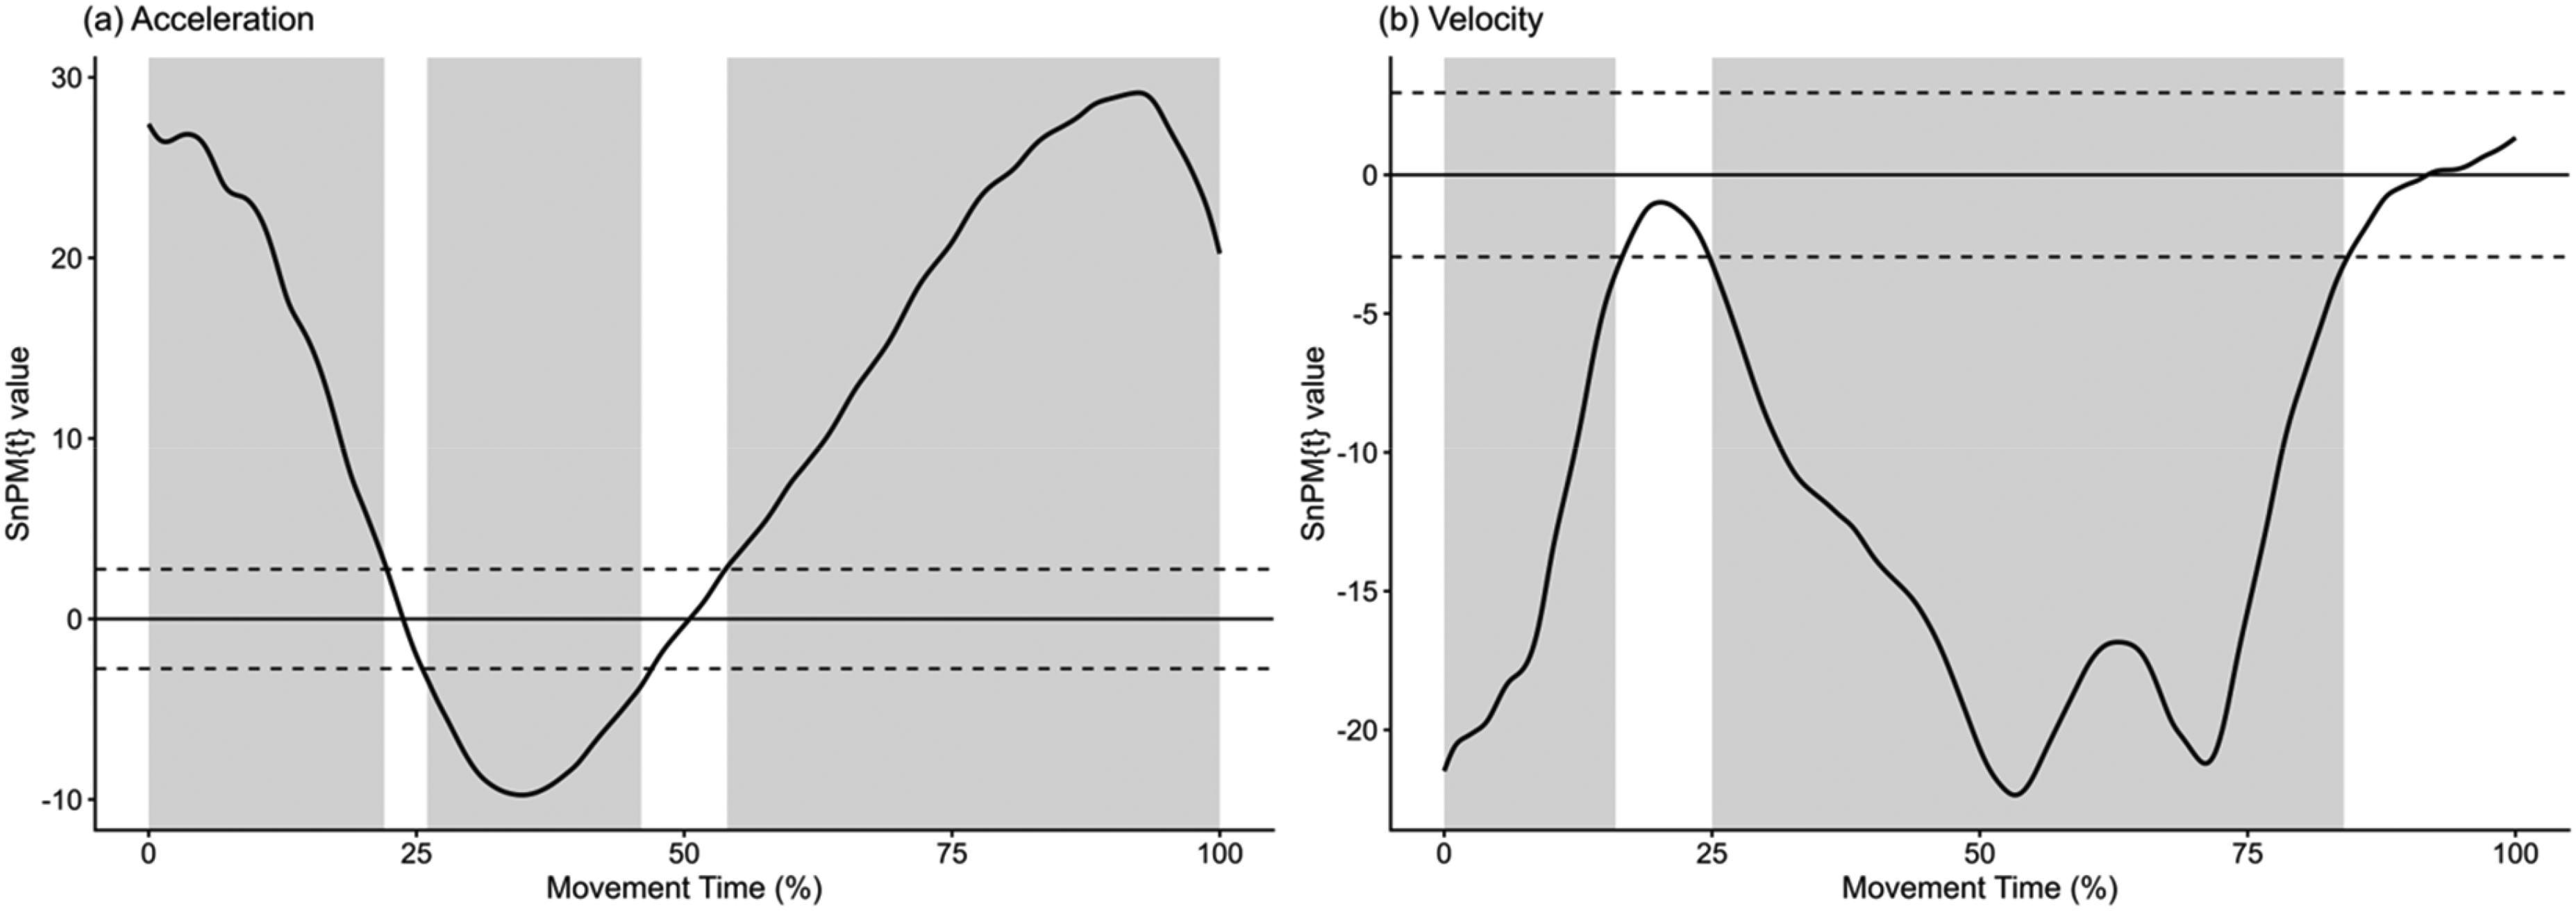
Statistical non-Parametric Mapping (SnPM) comparisons for instantaneous acceleration and instantaneous velocity across the normalised movement time between VueMotion and VICON 3D motion capture system. Note: (a) acceleration; (b) velocity. Dashed line = alpha threshold of 0.05; shadow area = region exceeding critical threshold.
Results
Table 2 presents the results from comparisons between velocity, acceleration, and spatiotemporal gait-related metrics obtained from VueMotion and their respective reference systems. Spearman's rank-order correlation coefficients indicated medium correlations for GCT, flight time, and step frequency, while step length, peak velocity, and instantaneous velocity demonstrated large correlations between technologies. In contrast, instantaneous acceleration exhibited a small correlation. Analysis of mean bias revealed that VueMotion systematically underestimated step length, flight time, and peak and instantaneous velocity while overestimating GCT, step frequency, and instantaneous acceleration. Moreover, step-related and velocity-based metrics were associated with relatively small MAE and RMSE values. Conversely, instantaneous acceleration demonstrated larger MAE and RMSE values.
Below, the 95% LoA derived from the first sprint of each participant (n = 25) is reported for each variable. Secondary results, presented in parentheses, represent the values obtained when the pooled dataset was included (n = 100), thereby displaying multiple sprints per participant. These are also shown in Figure 2. For GCT, flight time, and step length, the LoA were −0.006 to 0.014 s (−0.004 to 0.013), −0.013 to 0.006 s (−0.014 to 0.005), and −0.043 to 0.014 m (−0.051 to 0.018), respectively, reporting narrow ranges. In contrast, the LoA ranges for both peak and instantaneous velocity and instantaneous acceleration were larger. These were −0.42 to 0.26
SnPM analysis identified significant differences between VueMotion and VICON 3D motion capture system in instantaneous acceleration across the time-normalised sprint waveform (α = 0.05; critical threshold t* = 2.79). Specifically, three clusters of significance were detected spanning 0–22%, 26–46%, and 54–100% of the sprint trial. Acceleration estimates from VueMotion were higher than the reference system during the early and late phases of the waveform but lower during the mid-phase. Similarly, a comparable pattern of divergence was observed for instantaneous velocity. At α = 0.05 (t* = 2.98), two significant clusters were identified, spanning 0–16% and 25–84% of the normalised movement time. In both regions, velocity estimates obtained from VueMotion were consistently lower than those measured by the reference system (Figure 3).
Discussion
This study evaluated the accuracy and concurrent validity of velocity, acceleration, and spatiotemporal gait-related metrics obtained from VueMotion, compared with those from the VICON 3D motion capture system and force plates. The findings indicated generally close agreement between VueMotion and its respective reference systems, except for instantaneous acceleration. Notably, the magnitude of the correlations varied across variables, indicating that the extent to which VueMotion preserved the relative ordering of individuals or trials was not consistent across all outputs.
The minimal mean bias, along with low MAE and RMSE observed for GCT and flight time, indicates that VueMotion estimates are closely aligned with those of the force plate reference system. The small average errors and narrow LoA further support the measurement consistency between systems. A similar pattern was observed for step frequency, where low bias and absolute error indicate that VueMotion can reasonably quantify cadence-related variables. Whilst correlation coefficients for these variables were modest, this may reflect some limitations in capturing trial-to-trial or individual-level variability, which may be amenable to differences in sampling frequency between the two technologies used to estimate gait parameters. 58 Specifically, the VueMotion system operates at 60 Hz, corresponding to a sampling interval of approximately 0.016 s, whereas the force plate system records at 1000 Hz, resolving data at approximately 0.001 s. This difference in temporal resolution likely contributed to the zonal linear decrease pattern observed in the Bland–Altman plots for GCT and flight time. At 60 Hz, gait events can only be detected at discrete frame intervals, meaning temporal estimates are effectively quantised to the nearest available frame. As the force plate-derived value changes continuously within each quantisation interval, the VueMotion estimate remains fixed until the next frame boundary, producing the characteristic banded pattern in which differences decrease linearly within each zone before stepping to the next. This phenomenon has been previously described in low-frame-rate camera systems and represents an inherent limitation when lower temporal resolution technologies are used to measure precise gait timing events.58,59 Accordingly, although VueMotion can report spatiotemporal gait-related outputs to three decimal places, this level of numerical granularity should not be interpreted as evidence that the system provides valid or practically meaningful estimates at that degree of precision. Rather, VueMotion temporal outputs should be evaluated in the context of the inherent frame-level quantisation associated with the system's sampling frequency.
In contrast to the temporal gait variables, step length, as a spatial parameter, showed relatively higher correlation coefficients despite similarly low mean bias, MAE, and RMSE. This may reflect the reduced sensitivity of spatial measures to sampling rate discrepancies across systems. These observations are consistent with findings by Fallahtafti, Wurdeman, and Yentes,58 who employed sample entropy to quantify the complexity or predictability of time-series data to investigate the impact of sampling frequency on the detection of gait-related variability. Their results indicated that while higher temporal resolution is essential for accurately capturing the variability of timing-related gait parameters, spatial measures are more robust to reductions in sampling frequency and, therefore, less affected by temporal quantisation.58,60,61 Specifically, consistent spatial variability was observed at sampling frequencies ≥ 120 Hz, whereas lower frequencies led to increased variability in temporal parameters, likely due to insufficient resolution to capture fine timing fluctuations within the gait cycle. 58 The temporal quantisation effect has also been examined by Yamamoto et al.,59 who observed a loss of critical lower-limb joint angle data during fast movements when using camera-based systems with low frame rates (i.e., 30 fps), due to insufficient temporal resolution, whereby longer intervals between frames failed to capture rapid changes in joint kinematics. 59 Hence, these findings highlight the importance of considering the limitations of lower-frame-rate camera-based systems when capturing rapid motion events or precise temporal events. In this context, VueMotion appears well-suited for estimating group-level averages relative to VICON 3D motion capture and force plate reference systems. However, caution is advised when monitoring subtle individual changes, particularly where high temporal precision is required, such as in performance assessment or rehabilitation decision-making.
VueMotion demonstrated close agreement with the criterion system for velocity measures, with small systematic underestimation, low error magnitudes, and high correlations for both peak and instantaneous velocities. This agreement may be partly due to the relatively similar sampling frequencies between systems (VueMotion at 60 Hz and VICON at 100 Hz) used to derive COM velocity measures. Additionally, the application of appropriate filtering methods, such as a 4th-order Butterworth low-pass filter used for VICON data, in comparison with the VueMotion's internal proprietary smoothing algorithms, likely enhanced comparability between the systems. However, it was noted that instantaneous acceleration exhibited large errors, high variability, and no meaningful correlation between systems. This difference reflects the enhanced sensitivity of acceleration to high-frequency content; therefore, these filter-related differences are expected to have a greater impact on acceleration than on velocity.62,63 Differences in filtering approaches between systems, particularly in handling high-frequency components, likely compounded this issue. Furthermore, the lower sampling rate of VueMotion limits its ability to capture the rapid fluctuations characteristic of acceleration, especially during high-speed tasks like sprinting. Such challenges are further compounded by the inherent constraints of 2D markerless systems, which may struggle to accurately represent complex movements, particularly in the transverse plane, due to the restricted degrees of freedom inherent to such technologies. 10 Together, these factors help explain the strong agreement in velocity metrics but reduced accuracy in acceleration estimates. However, it is important to note that VICON acceleration was derived from velocity, whereas the same process was not applied to the VueMotion data, as the intent of this study was to evaluate the outputs as they are provided to end users. Future research should therefore investigate whether standardising acceleration derivation and filtering procedures across systems improves agreement and helps distinguish measurement error from processing-related differences.
Instantaneous velocity and acceleration were further analysed using SnPM, revealing substantial discrepancies across the flying 10 m trials’ time series. Although SnPM has been increasingly adopted in human biomechanics, particularly in analysing the running gait cycle concerning foot biomechanics, training load, and injury risk, 64 its application to continuous sprinting has been limited. Consequently, this constrains direct comparisons with research focused on sprint-specific acceleration and velocity. A key methodological consideration that may contribute to the scarcity of such literature is the challenge associated with accurately aligning time-series data across successive gait cycles. For example, variability in running velocity and individual anthropometrics means that gait events like foot strike and toe-off may not occur at consistent time points across trials, leading to temporal misalignment that can impact frame-by-frame comparisons and the validity of statistical inferences.55,65 In the present study, SnPM was applied to continuous sprinting data encompassing multiple successive gait cycles normalised by percentage of movement time rather than a single cycle. Therefore, the result of such analysis should be interpreted with caution, acknowledging the influence of within- and between-subject variability. Despite this limitation, using SnPM represents a meaningful advancement toward a more comprehensive statistical application for evaluating instantaneous kinematic variables such as velocity and acceleration. Unlike traditional discrete-point statistics that reduce complex time-series signals into isolated summary measures, the SnPM preserves the temporal structure of data, allowing for a continuous evaluation of movement patterns over time. 64 Furthermore, the implementation of SnPM in this study's context offers a methodological foundation for future research, encouraging more refined evaluations of how different technologies capture temporal movement dynamics. Building on this proposed application, future investigations should prioritise the development of advanced time-alignment and normalisation techniques that account for inherent within- and between-individual differences in movement patterns, thereby enhancing the interpretive power and generalisability of statistical findings in sprint performance analysis.
This study presented several limitations. A primary constraint was the spatial constraint of the testing environment, which restricted trials to 10 m. While this space was sufficient to capture fundamental kinematics features associated with sprinting performance, this distance limited the acquisition of a more comprehensive dataset for robust analysis of movement dynamics. This limitation was particularly impactful for evaluating instantaneous velocity and acceleration, as the VueMotion system provides these metrics with delays of 0.25 and 0.50 s, respectively, from the trial onset, potentially reducing its capacity to accurately capture and represent early movement phases. Additionally, the inter-tester variability may have caused inconsistencies in marker placement on anatomical landmarks, introducing errors in VICON motion capture, even when using standardised models like the VICON PiG. This is particularly consequential for transverse plane motion, where minor marker placement deviations can amplify errors in derived kinematic outputs. Finally, data collection was conducted indoors under artificial lighting. In low-light conditions, the recording camera may default to slower shutter speeds, resulting in longer exposure times. Consequently, as participants’ body segments rapidly change position while the shutter remains open, it may lead to motion blur during high-speed movements. Therefore, this artefact could impair VueMotion's ability to track anatomical landmarks, a limitation potentially exacerbated by participants wearing black suits. Future studies should address these limitations by using extended running distances, enhancing marker placement consistency, and controlling environmental conditions to improve motion capture accuracy.
Conclusion
This study demonstrated that VueMotion provides close agreement with criterion reference systems for GCT, flight time, step length, step frequency, peak velocity, and instantaneous velocity. In contrast, instantaneous acceleration showed larger errors, greater variability, and trivial rank-order agreement. While VueMotion may serve as a practical tool for assessing and monitoring selected biomechanical variables during running, the application of computer vision systems in applied settings requires careful consideration of the accuracy demands specific to human movement assessment, as subtle movement variations may have meaningful implications for evaluating and monitoring neuromuscular function. However, there is no clear consensus on the minimum acceptable level of agreement for on-field motion analysis systems, with acceptable measurement error being highly context-dependent and influenced by factors such as testing environment and movement task. Practitioners and sports performance stakeholders should critically evaluate the operational context in which they deploy these technologies to determine whether VueMotion's measurement fidelity meets the demands of their specific performance assessment or rehabilitation objectives.
Footnotes
Ethical considerations
The study was conducted in accordance with the Declaration of Helsinki and approved by the Victoria University Human Research Ethics Committee (HRE24-044).
Informed consent
All participants provided written informed consent prior to participating in the study.
Author contributions
All authors have read and agreed to the published version of the manuscript. Individual contributions included: Conceptualisation, M.D., J.H. and S.R.; methodology, M.D., J.H. and S.R.; data synchronisation and processing, M.D. and G.D.; formal analysis, M.D., J.H. and S.R.; writing - original draft preparation, M.D.; writing - review & editing, J.H., S.R. and G.D.; supervision, J.H. and S.R.; project administration, M.D., J.H. and S.R.
Funding
The authors received no financial support for the research, authorship, and/or publication of this article.
Declaration of conflicting interests
The authors declared no potential conflicts of interest with respect to the research, authorship, and/or publication of this article.