
Abstract
Evidence does not support the claim that observers universally recognize basic emotions from signals on the face. The percentage of observers who matched the face with the predicted emotion (matching score) is not universal, but varies with culture and language. Matching scores are also inflated by the commonly used methods: within-subject design; posed, exaggerated facial expressions (devoid of context); multiple examples of each type of expression; and a response format that funnels a variety of interpretations into one word specified by the experimenter. Without these methodological aids, matching scores are modest and subject to various explanations.
Let us define the universality thesis as the claim that certain human facial expressions are signals of specific basic emotions—such as happiness, surprise, fear, anger, disgust, and sadness—signals universally recognized by human beings whatever their cultural background or spoken language. Reviewers of data relevant to this claim have gone back and forth. Early reviewers were critical, Izard (1971) and Ekman, Friesen, and Ellsworth (1972) supportive, Russell (1994) critical. We examine evidence published since Russell’s (1994) review.
Both proponents and critics of the universality thesis agree that human beings derive information relevant to emotion from the faces of others. The question is: What evidence would support the universality thesis over alternative accounts of what information the face conveys? To support the universality thesis specifically, matching scores (the percentage of observers matching the face to the specific predicted emotion) must be (a) high and (b) universal, that is, reasonably invariant across culture, language, method, and so on. As proponents Haidt and Keltner (1999, p. 238) wrote, “If the universality thesis is correct then those expressions that are pancultural should elicit very high recognition rates, generally in the 70–90% range . . . even when methodological constraints are relaxed.”
We searched PsychInfo for all peer-reviewed journal articles published between 1992 and 2010 that included the words emotion* and cultur* in the title, abstract, or keywords. From the resulting 6,566 entries, we selected all studies that were not reviewed by Russell (1994), that included a cross-cultural comparison, that had nonclinical adult samples, and that examined recognition of adult facial expressions that met criteria specified by Ekman and Friesen (1978). (This last criterion excluded studies on facial dialects in which individuals posed cultural-specific expressions; see Elfenbein, 2013.) The result was 21 studies that provided 57 sets of data.
Cross-Cultural Judgment Studies
Of the 57 data sets that met our criteria, 39 had a similar enough method to allow statistical comparisons and are listed in the Appendix. The remaining 18 sets are discussed in later sections. The 39 sets used what we call the standard method: at least four of the hypothesized basic emotions, posed facial expressions, a forced-choice response format, and a within-subjects design.
Table 1 compares the newer data sets seen in the Appendix with the older ones reviewed by Russell (1994). Newer studies yielded similar but slightly lower matching scores. This change is difficult to explain. Newer studies were carried out by new experimenters with new photographs of perhaps less intense expressions (e.g., Beaupré & Hess, 2005). Or perhaps the greater amount of data now simply provides a better estimate of matching scores.
Average matching scores for Western literate, non-Western literate, and isolated illiterate samples based on the standard method
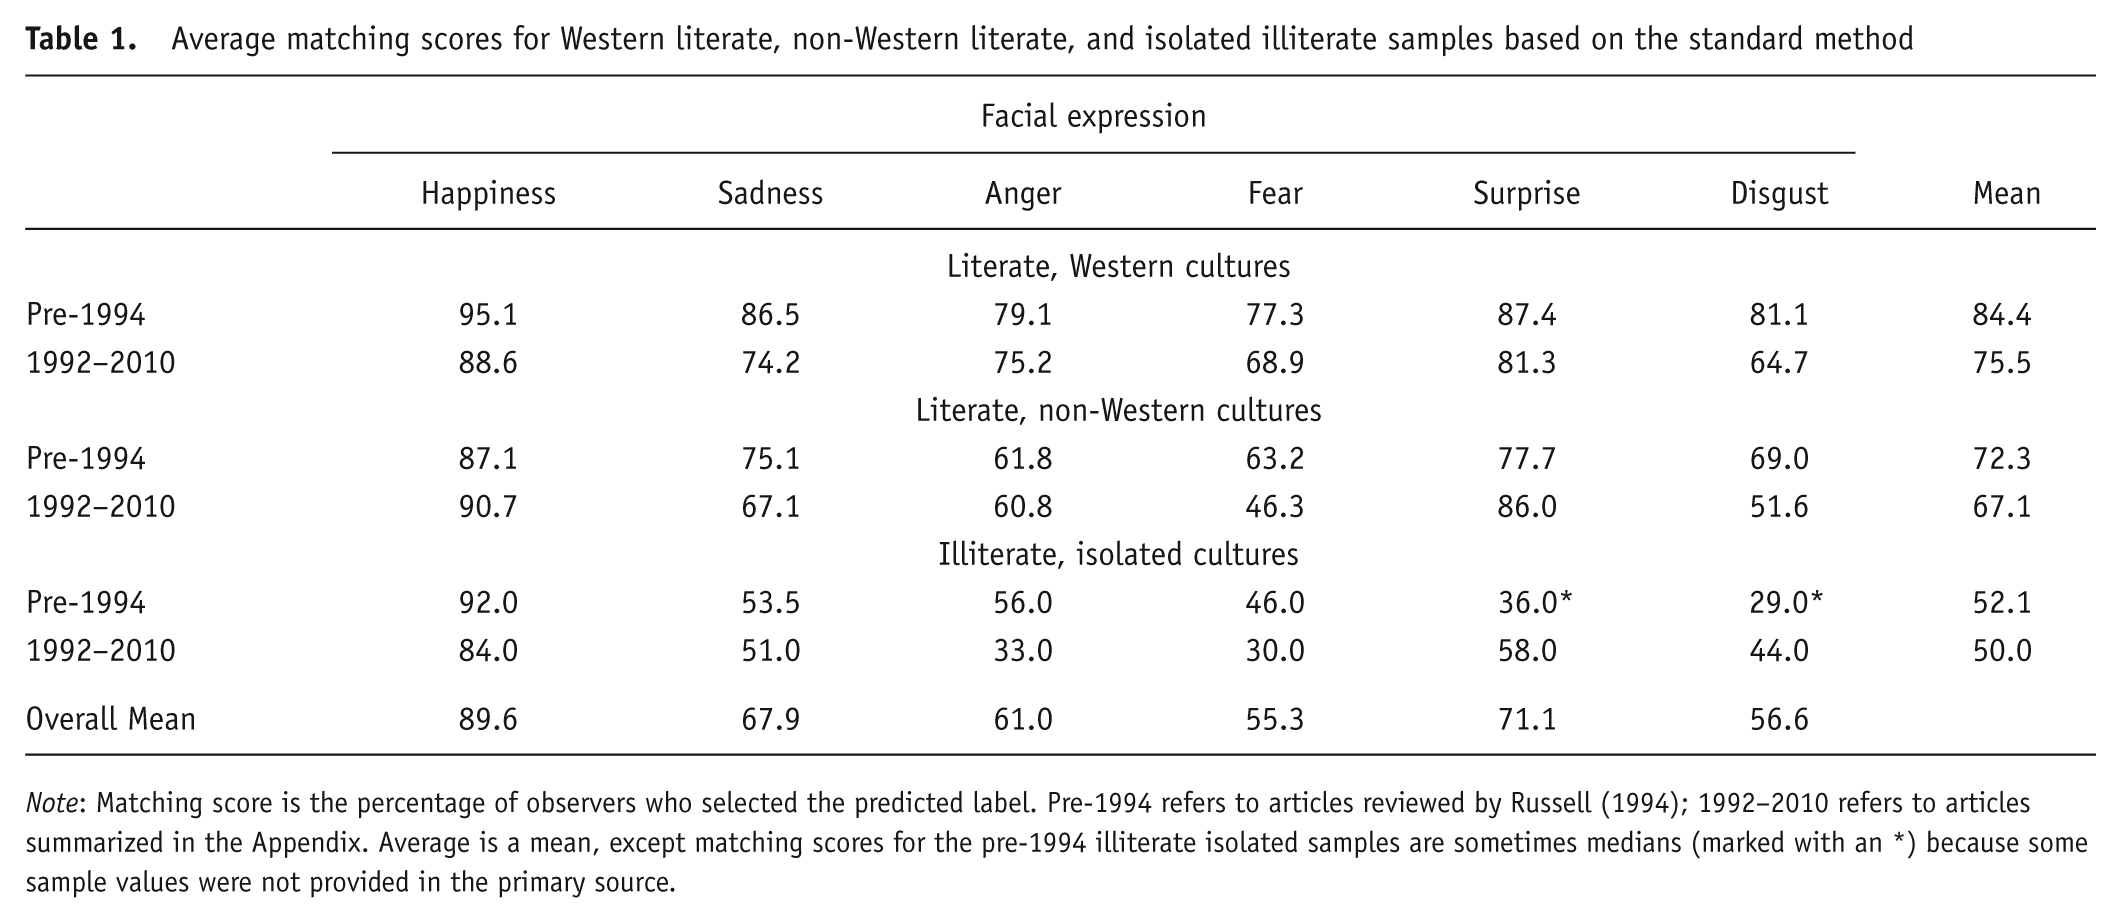
Note: Matching score is the percentage of observers who selected the predicted label. Pre-1994 refers to articles reviewed by Russell (1994); 1992–2010 refers to articles summarized in the Appendix. Average is a mean, except matching scores for the pre-1994 illiterate isolated samples are sometimes medians (marked with an *) because some sample values were not provided in the primary source.
In the newer studies (those listed in the Appendix), matching scores varied with culture: For each emotion, Figure 1 shows matching scores for Western literate, non-Western literate, and isolated illiterate observers. Reliability of the large differences seen in Figure 1 was verified in several ways. The nine studies from the Appendix that included both Western and non-Western literate observers are listed in Table 2. In all nine studies, mean matching score was higher in the Western than non-Western literate sample. “Happiness” and “surprise” expressions showed no reliable cultural difference (with a two-tailed sign test, all ps > .18), but for “sadness,” “anger,” “disgust,” and “fear” expressions, non-Western matching scores were reliably lower (all ps < .01).
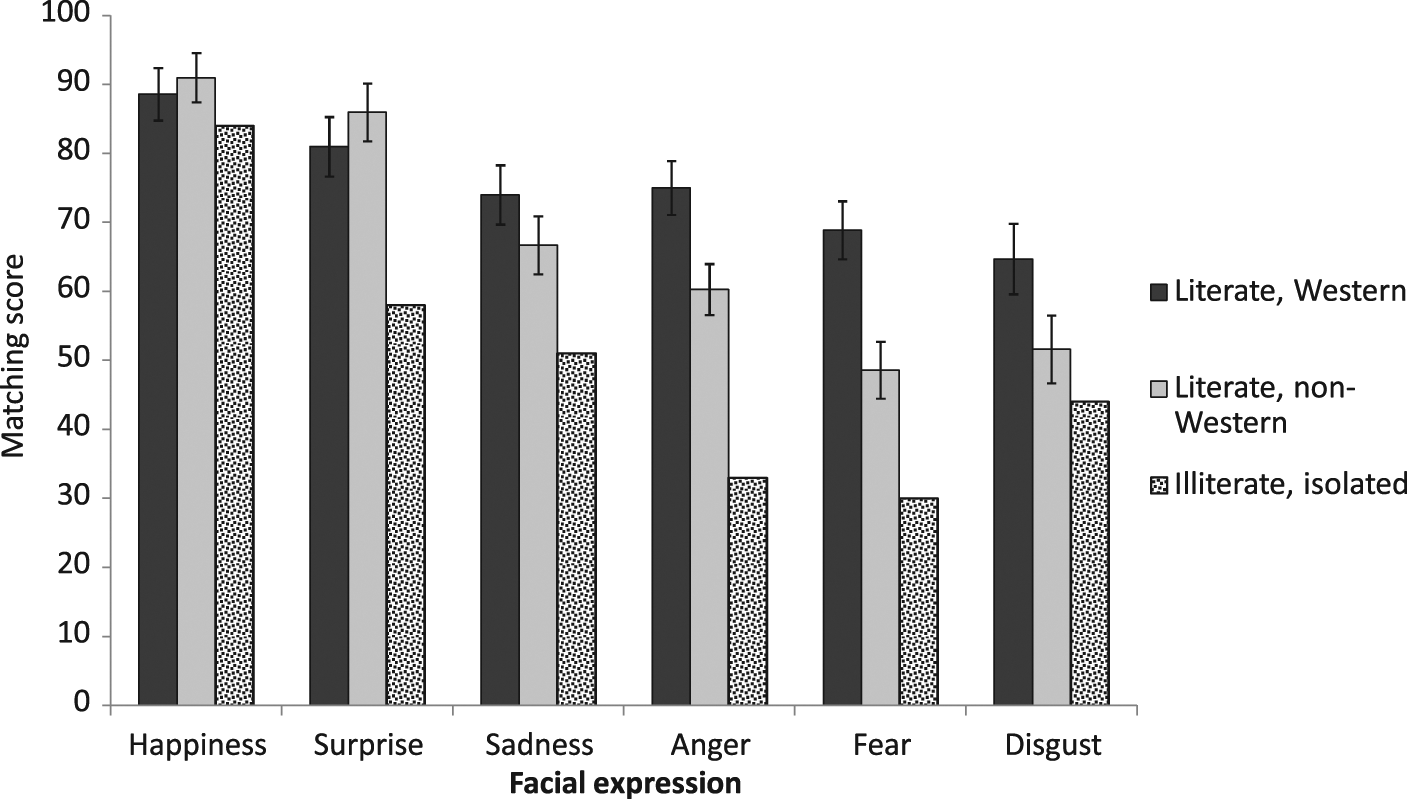
Matching scores are the percentage of observers who selected the predicted label of studies in the Appendix (i.e., studies published between 1992 and 2010) for six facial expressions. Error bars represent standard error, except for the illiterate isolated sample, for which there is but one sample.
Literate Western (bold) versus literate non-Western comparisons of matching scores

Note: Matching score is the percentage of observers who selected the predicted label.
We next updated Russell’s (1994) statistical comparison of Western literate versus non-Western literate samples. Matching scores from 54 samples (those reviewed by Russell together with those listed in the Appendix) were analyzed with a mixed-design two-factor analysis of variance. Each sample was treated as a single case (n = 31 for Western cultures and n = 23 for non-Western cultures). Culture (Western or non-Western) was a between-subjects factor. Type of expression (“happiness,” “surprise,” “sadness,” “anger,” “fear,” or “disgust”) was a within-subject factor. Greenhouse-Geisser corrections for lack of sphericity were used where needed. The effect of culture was significant, F(1, 52) = 14.90, p < .001, as was the effect of type of expression, F(5, 245) = 46.33, p < .001. The Culture × Expression interaction was also significant, F(5, 245) = 8.01, p < .001. A simple effects analysis pursued the interaction effect. When experiment-wise alpha level was determined by Bonferroni’s method, there were no significant effects of culture for “happiness,” “surprise,” and “sadness” expressions, but Western observers’ matching scores were higher than were non-Western observers’ scores for “anger,” F(1, 52) = 25.05, p < .001, “fear,” F(1, 52) = 28.39, p < .001, and “disgust,” F(1, 52) = 12.02, p = .001. In short, the pattern reported by Russell (1994) remained intact with the addition of new data: Matching scores varied reliably with culture for three of six expressions.
Because our search found but one study of isolated, illiterate observers, that sample was not included in the statistical comparisons reported above. Still, as emphasized by Ekman (1980), such studies are a necessary test of the universality thesis. Table 3 provides matching scores from the three studies in the earlier review plus those from the Tracy and Robins (2008) study, in which high matching scores for the “happiness” expression (84%) showed that these observers understood the task presented to them. Matching scores for all other expressions were lower: M = 43.2%.
Matching scores from isolated illiterate observers, based on the standard method
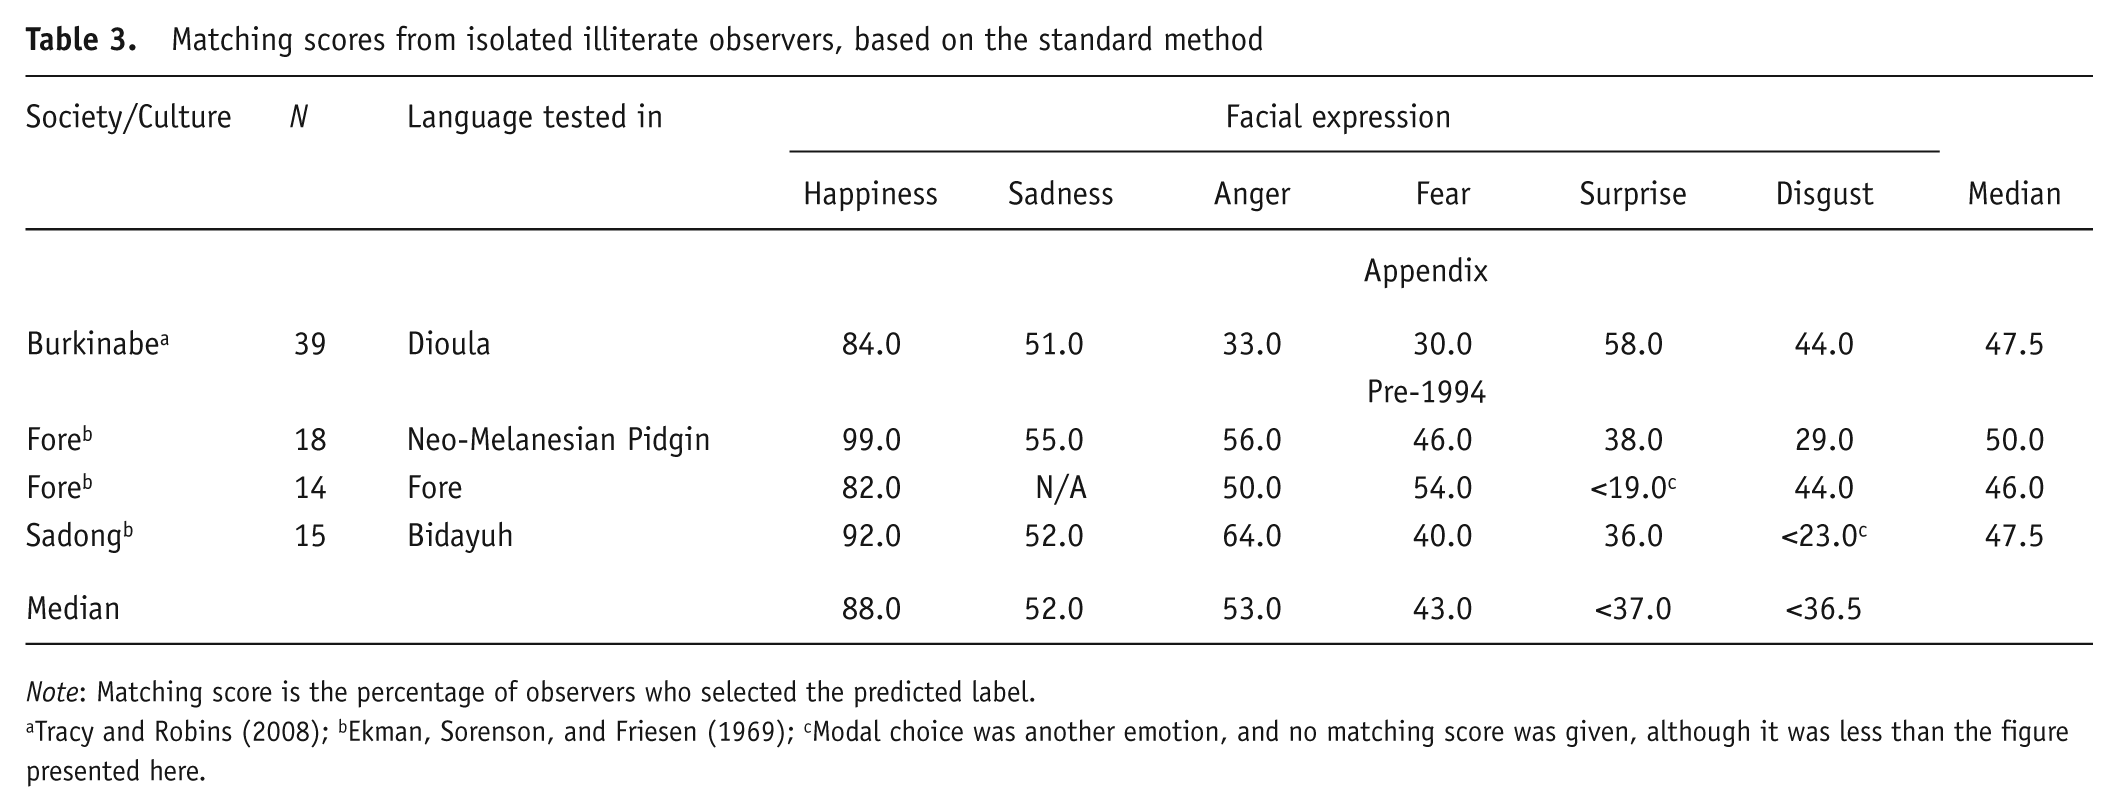
Note: Matching score is the percentage of observers who selected the predicted label.
Tracy and Robins (2008); bEkman, Sorenson, and Friesen (1969); cModal choice was another emotion, and no matching score was given, although it was less than the figure presented here.
Matching scores also varied with language. Of the studies listed in the Appendix in which we could determine the language used for testing, there were 29 samples tested in an Indo-European language (all 20 Western samples and nine of the 19 non-Western ones) and eight samples in a non-Indo-European language. Treating each expression as a separate case resulted in 204 data points. Matching scores were higher with an Indo-European language (158 data points; M = 73.2%) than without (46 data points; M = 63.4%), t(202) = 3.03, p = .002. Table 4 gives a more specific comparison of studies that tested observers from the same culture in more than one language—with the same result.
Differences due to language: Mean matching score of within-study comparisons of language
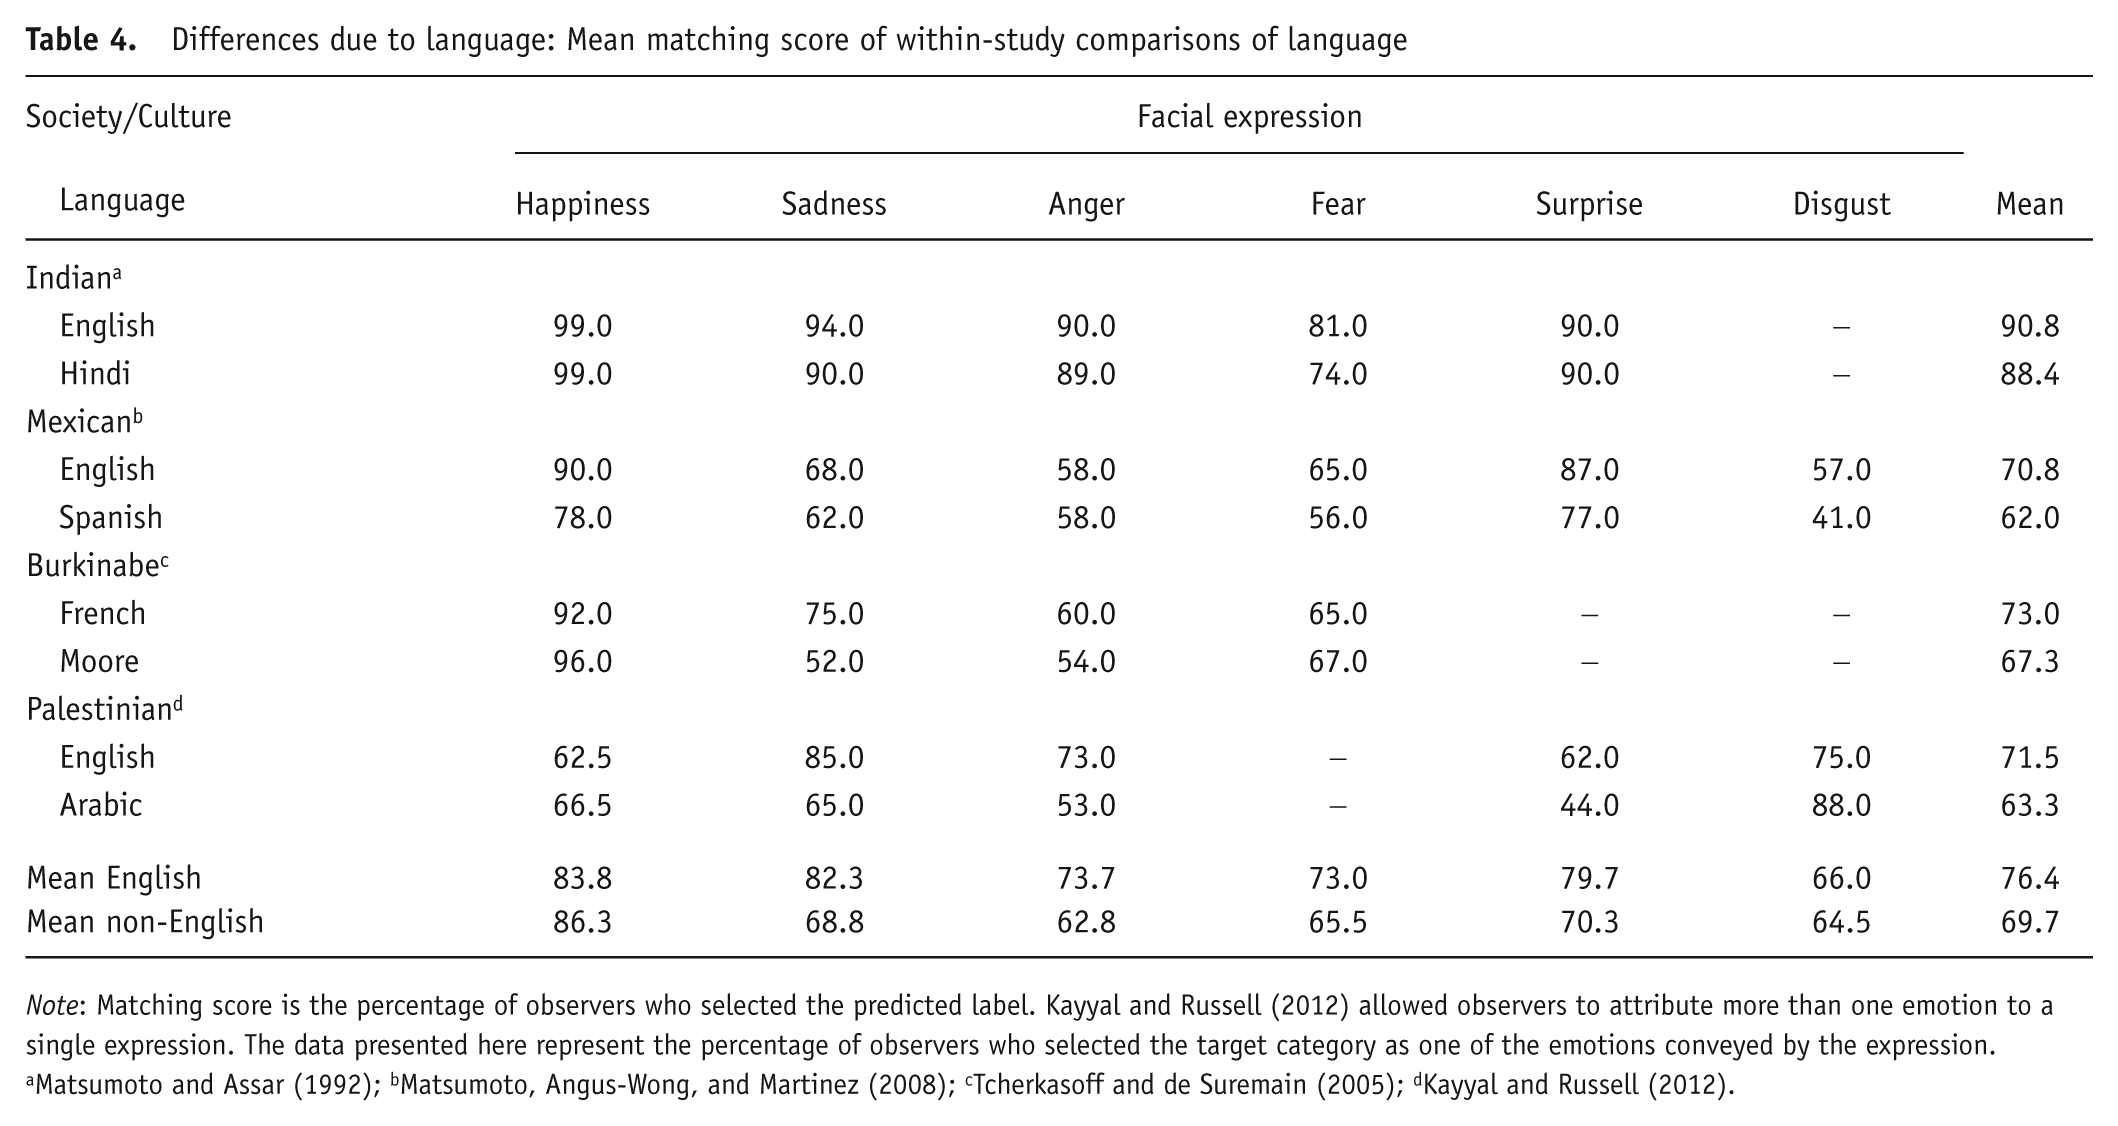
Note: Matching score is the percentage of observers who selected the predicted label. Kayyal and Russell (2012) allowed observers to attribute more than one emotion to a single expression. The data presented here represent the percentage of observers who selected the target category as one of the emotions conveyed by the expression.
The Standard Method Inflates Matching Scores
The matching scores discussed so far cannot be taken at face value, according to Russell’s (1994) argument that such scores are inflated by method factors. Each of several aspects of the standard method pushes scores higher by some amount. Combined, these method factors can produce highly exaggerated scores. The rebuttal that each individual method factor produces only a small effect is factually incorrect, and it misses the point that, even if each effect were small, their cumulative impact can be large. The magnitude of the matching scores as they change with method is thus a key issue. Here we consider recent evidence on three of those factors.
Posed Facial Expressions
The universality thesis is about emotions and facial expressions that occur spontaneously. However, the standard method uses expressions posed with the purpose of conveying a single emotion as clearly as possible and then selected from a larger set as the best at doing so. Our search turned up two studies of spontaneous expressions. Shown photos of spontaneous expressions predicted to convey a single basic emotion, British, American, and Japanese observers yielded matching scores ranging from 31% to 35% (Matsumoto, Olide, Schug, Willingham, & Callan, 2009). Similarly, shown photos of spontaneous expressions provided by Ekman (1980) to illustrate the universality thesis, American observers yielded a mean matching score of 35% (Naab & Russell, 2007). Both studies produced matching scores noticeably lower than the overall mean (70.9%) from studies in the Appendix, which used posed expressions. Use of posed expressions inflates matching scores relative to spontaneous expressions.
Presentation of Multiple Expressions
In the standard method, observers are shown more than one facial expression (an average of 47 for studies in the Appendix) through previewing, practice trials, or a within-subjects design. Principles of perception predict that observers judge one facial expression relative to others (Russell, 1991). Especially with a forced-choice response format, observers may come to realize which types of expressions are being presented and can then use a process of elimination to help make their judgments. Empirically, the commonly used within-subjects design results in higher matching scores than does a between-subjects design (Russell, 1994). Yik, Widen, and Russell (2012) found that high matching scores (M for three samples = 67.5%) for the “disgust expression” depended on having recently seen an “anger expression”; otherwise, the mean dropped to 35%. With the 20 data sets in the Appendix that included all six emotions, matching scores were higher for observers who had viewed more faces (30 or more; n = 10; M = 78%) than those who had viewed fewer (6–24 faces; n = 10; M = 67%), F(1, 18) = 9.026, p = .007.
Response Format
The standard method uses a forced-choice response format in which observers select one emotion from a short list provided by the experimenter. This format creates many problems. Here, we highlight three. First, the observer’s spontaneous interpretation of a facial expression is not limited to emotions. Observers reliably report social messages (Yik & Russell, 1999), incipient actions (Tcherkassof & de Suremain, 2005), and the antecedent situation (Widen, 2013) or its appraisal (Scherer & Grandjean, 2008). The standard forced-choice format channels all interpretations into an emotional one.
Second, when observers were allowed to attribute more than one emotion to an expression, they did so. In one study, they selected for each face, on average, four of the eight available emotions (Kayyal & Russell, 2012). Quantitative ratings similarly show that observers see multiple basic emotions in the same face, albeit to different degrees (Beaupré & Hess, 2005; Mandal, Bryden, & Bulman-Fleming, 1996; Tcherkassof & de Suremain, 2005). Observers reliably rate faces on broad bipolar dimensions such as pleasure–displeasure and arousal–sleepiness (Gao, Maurer, & Nishimura, 2010). When observers were allowed to provide any emotion label they wanted for a given face, they generated many (Haidt & Keltner, 1999; Rosenberg & Ekman, 1995). Thus, the forced-choice format shoehorns each observer’s full attribution of various emotions into one of a few preselected categories.
Third, with a forced-choice format, a majority of observers attribute qualitatively different basic emotions to the same face, depending on the options available (Russell, 1993). Frank and Stennett (2001) showed that with the word surprise omitted from the list in the traditional format, the “surprise expression” was called happy by 61% of observers. They concluded that the standard forced-choice format can “demand agreement” (2001, p. 83).
Russell (1994) noted that the traditional forced-choice format does not allow observers to select no emotion, an emotion not on the list, or more than one emotion. Frank and Stennett (2001) agreed that a “none” option was needed and found that 7.8% of observers chose “none” in response to posed expressions of hypothesized basic emotions—evidence that indeed some observers do not find any of the available options applicable. In the 39 sets of data in the Appendix, only seven provided a “none” option. Although adding “none” is useful, it is no panacea: The full range of each observer’s interpretation is still funneled into one category, although now including “none” as an additional category. The observer still cannot provide their own spontaneous interpretation of the expression, nor can they indicate that the expression conveys multiple emotions, an emotion not on The list, or nonemotional information. Thus, even with a “none” option, the forced-choice format funnels a range of responses into one option, thereby oversimplifying the observer’s response and inflating the matching score.
Do Humans Universally Recognize Basic Emotions from Facial Expressions?
Like the evidence before it (Russell, 1994), the evidence reported between 1992 and 2010 (listed in the Appendix) shows that for only one emotion—happiness—did a large percentage of observers (89.6%) match it to the predicted facial expression across cultures and languages. For negative emotions (sadness, anger, fear, and disgust), Western observers gave the highest matching scores (M = 71%). Non-Western but still literate observers gave lower scores (57%), and illiterate observers isolated from the West lower still (39%). Both non-Western groups failed to reach Haidt and Keltner’s (1999) 70–90% criterion. Furthermore, these observed matching scores, low as they are, were inflated by the method used to gather them.
Shariff and Tracy (2011, p. 407) defended the universality thesis, writing of “easily recognizable signals” even in “geographically and culturally isolated populations.” Against the objection that matching scores are low, vary with culture and language, and are inflated by method, they pointed to the statistical significance of matching scores: “we believe these findings should be held to the same accepted standard of statistical significance as other empirical results.” This “statistical-significance” defense rests on an elementary error of statistical inference. That the data reach “statistical significance” rules out the null hypothesis that observers matched expressions with emotions randomly, but does not rule out various substantive alternative hypotheses or the possibility of method artifacts. Ruling out the null hypothesis does not rule in any one interpretation of the data. There are many alternative interpretations of nonrandom responding; Russell (1994) listed eight, and there are undoubtedly others. These alternatives all predict that matching scores are statistically significant, and therefore statistical significance cannot decide among them.
Evidence does not support the claim that facial expressions are preinterpreted signals for specific basic emotions universally recognized by human beings. But neither are humans clueless when interpreting a face. When asked what emotion a face expresses, humans do not answer randomly; they figure out an answer. Faces might provide information on core affect, social messages, incipient actions, situations, or appraisals; and from that information, observers might figure out the expresser’s emotion. We see no use for further studies using the standard method to discover that humans are not random when matching expressions with emotions. Rather, we see the need for hypotheses and evidence on the specific processes involved when an observer interprets another’s facial expression.
Footnotes
Appendix
Matching scores from cross-cultural judgment studies, 1992 to 2010
| Society/Culture | N | No. of expression sets | Language | Facial expression |
||||||
|---|---|---|---|---|---|---|---|---|---|---|
| Happiness | Sadness | Anger | Fear | Surprise | Disgust | Mean | ||||
|
|
||||||||||
| Canadian a | 20 | 12 | French | 67.0 | 56.0 | 50.0 | 33.0 | – | 56.0 | 52.4 |
| Canadian b | 20 | 8 | French | 88.0 | 71.0 | 72.0 | 68.0 | – | 62.0 | 72.2 |
| Canadian c | 30 | 1 | English | 100.0 | 86.7 | 73.3 | 66.7 | 76.7 | 56.7 | 76.7 |
| French d | 96 | 4 | French | 97.0 | 83.0 | 88.0 | 85.0 | – | – | 88.3 |
| Hungarian e | 45 | 8 | Hungarian | 98.0 | 83.0 | 87.0 | 74.0 | 94.0 | 84.0 | 86.7 |
| Indian f | 50 | 4 | English | 99.0 | 39.5 | 65.0 | 75.0 | 78.0 | 53.5 | 68.3 |
| Indian g | 40 | 1 | Oriya | 45.0 | 42.5 | 80.0 | 55.0 | 42.5 | 82.5 | 57.9 |
| Indian h | 100 | 8 | English | 99.0 | 94.0 | 90.0 | 81.0 | 90.0 | – | 90.8 |
| Indian h | 100 | 8 | Hindi | 99.0 | 90.0 | 89.0 | 74.0 | 90.0 | – | 88.4 |
| Mexican i | 274 | 8 | English | 90.0 | 68.0 | 58.0 | 65.0 | 87.0 | 57.0 | 70.8 |
| Mexican i | 274 | 8 | Spanish | 78.0 | 62.0 | 58.0 | 56.0 | 77.0 | 41.0 | 62.0 |
| Polish e | 75 | 8 | Polish | 98.0 | 88.0 | 85.0 | 69.0 | 89.0 | 83.0 | 85.3 |
| American j | 37 | 16 | English | – | 80.0 | 89.0 | 63.8 | 89.9 | – | 80.7 |
| American f | 50 | 4 | English | 93.5 | 54.0 | 79.0 | 77.0 | 82.0 | 34.5 | 70.0 |
| American g | 40 | 1 | English | 73.0 | 88.0 | 83.0 | 55.0 | 80.0 | 78.0 | 76.2 |
| American k | 138 | 4 | English | 93.3 | 65.7 | 52.3 | – | 78.7 | – | 72.5 |
| American l | 72 | 11 | English | 93.0 | 77.0 | 65.0 | 74.0 | – | – | 77.3 |
| American l | 102 | 11 | English | 89.0 | 82.0 | 80.0 | 78.0 | – | – | 82.3 |
| European m | 13 | 8 | English | 99.0 | 89.0 | 89.0 | 88.0 | 84.0 | 88.0 | 89.5 |
| European l | 30 | 11 | English | 84.0 | 85.0 | 71.0 | 70.8 | – | – | 77.7 |
|
|
||||||||||
| Burkinabe d | 48 | 4 | French | 92.0 | 75.0 | 60.0 | 65.0 | – | – | 73.0 |
| Burkinabe d | 48 | 4 | Moore | 96.0 | 52.0 | 54.0 | 67.0 | – | – | 67.3 |
| Chinese n | 32 | 4 | Mandarin | 97.0 | 72.0 | 57.0 | 21.0 | 74.0 | 54.0 | 63.0 |
| Chinese a | 20 | 12 | French | 71.0 | 38.0 | 45.0 | 28.0 | – | 49.0 | 46.2 |
| Chinese o | 237 | 7 | Chinese | 92.0 | 77.0 | 66.0 | 56.0 | 76.0 | 50.0 | 70.0 |
| Chinese j | 38 | 16 | English | – | 81.0 | 75.3 | 61.2 | 90.0 | – | 77.0 |
| Gabonese b | 20 | 8 | French | 80.0 | 41.0 | 63.0 | 50.0 | – | 32.0 | 53.0 |
| Japanese f | 50 | 4 | Japanese | 98.5 | 68.5 | 51.5 | 49.5 | 92.5 | 20.0 | 63.0 |
| Japanese k | 137 | 4 | English | 89.4 | 47.8 | 54.7 | – | 88.6 | – | 70.0 |
| Japanese p | 123 | 8 | English | 94.8 | 66.6 | 56.3 | 44.5 | 89.2 | 63.7 | 69.0 |
| Japanese c | 30 | 1 | Japanese | 100.0 | 80.0 | 56.7 | 53.3 | 93.3 | 30.0 | 69.0 |
| Hong Kong c | 30 | 1 | Cantonese | 100.0 | 76.7 | 46.7 | 23.3 | 83.3 | 56.7 | 64.0 |
| Sumatran e | 32 | 8 | ? | 99.0 | 81.0 | 79.0 | 57.0 | 89.0 | 76.0 | 80.0 |
| Tibetan n | 11 | 4 | Mandarin | 86.0 | 75.0 | 61.0 | 16.0 | 73.0 | 66.0 | 63.0 |
| Vietnamese e | 34 | 8 | ? | 99.0 | 80.0 | 81.0 | 67.0 | 92.0 | 58.0 | 80.0 |
| African l | 30 | 11 | English | 79.0 | 70.0 | 50.0 | 76.0 | – | – | 69.0 |
| Sub-Saharan African a | 20 | 12 | French | 76.0 | 29.0 | 49.0 | 27.0 | – | 46.0 | 45.4 |
| East Asian m | 13 | 8 | English | 99.0 | 90.0 | 80.0 | 64.0 | 91.0 | 69.0 | 82.0 |
|
|
||||||||||
| Burkinabe q | 39 | 2 | Dioula | 84.0 | 51.0 | 33.0 | 30.0 | 58.0 | 44.0 | 50.0 |
| Overall mean | 89.6 | 70.2 | 67.3 | 58.5 | 82.5 | 57.3 | 70.9 | |||

Note: Matching score is the percentage of observers who selected the predicted label.
Beaupré and Hess (2005); bElfenbein et al. (2007); cYik and Russell (1999); dTcherkasoff and de Suremain (2005); eBiehl et al. (1997); fElfenbein et al. (2004); gHaidt and Keltner (1999); hMatsumoto and Assar (1992); iMatsumoto et al. (2008); jElfenbein (2006); kMatsumoto et al. (2002); lWickline et al. (2009); mJack et al. (2009); nElfenbein and Ambady (2003); oHuang, Tang, Helmeste, Shioiri, and Someya (2001); pShioiri, Someya, Helmeste, and Tang (1999); qTracy and Robins (2008).
Author note:
This research was supported by two grants from the National Science Foundation: No. 1025563 awarded to James A. Russell and No. 1064757 awarded to Nicole L. Nelson. We thank Erin Heitzman, Alan Fridlund, Rachael Jack, Mary Kayyal, Joe Pochedley, Alyssa McCarthy, and Sherri Widen for comments on a draft of this article.