
Abstract
In the textile industry, labeling errors during the production process present significant challenges for both quality control and product traceability. This study proposes a real-time RFID-based production tracking and label quality control system to address these issues. In the developed system, RFID tags attached to products are read by embedded devices equipped with RFID readers integrated into the production lines. The captured product code data is transmitted to a local server via MQTT. The server verifies the tags by querying a central database and provides instant feedback to the corresponding device. The system runs entirely over a local network and does not require an external internet connection, ensuring uninterrupted functionality even in infrastructure-limited environments. This architecture enables all devices on the production line to communicate synchronously with the server, maintaining system-wide consistency and integrity. In this way, the use of a single tag per product is ensured, and faulty tags are filtered out. Furthermore, the system evaluates tag readability to detect quality issues such as stitching errors, physical deformation and alerts the operator through feedback. As a result, defective products are identified and removed before production is completed, helping to reduce time loss, and improve overall production reliability.
Keywords
Introduction
Accurate and uninterrupted tracking of products at every stage of textile manufacturing, along with the early detection of defective or incomplete items and effective inventory management, has become one of the most critical requirements in today’s industrial landscape. Manual methods for recording and tracking material flow are prone to errors and delays, often resulting in inventory discrepancies and inconsistencies in material localization (Su, 2024). In this context, Radio Frequency Identification (RFID) technology has emerged as a key component of automation and digital transformation. RFID enables products to be uniquely identified, their movements along the production line to be monitored in real time, and quality control processes to be automated (Scholz & Valilai, 2025).
Compared to barcode-based systems, RFID offers several advantages, including reduced reliance on human intervention, the ability to read without line-of-sight, and simultaneous scanning of multiple tags (Ngai et al., 2008). According to Nayak et al. (2015), RFID eliminates the limitations of manual systems by enabling integrated data flow throughout production and distribution networks. Popescu and Neacşu (2024) emphasize that RFID has become a core enabler of digitalization in the textile sector, offering product-level visibility. This enhanced visibility not only improves inventory accuracy but also enhances demand forecasting and customer satisfaction (Denuwara et al., 2019). Furthermore, RFID systems contribute to operational traceability and serve as valuable inputs for decision support mechanisms (Ruile & Wunderlin, 2011).
End-to-end traceability within the supply chain is particularly critical for product recalls and quality analysis processes (Wamba & Chatfield, 2009). Given the accelerated production cycles, high-volume orders, and increasingly diversified product ranges, RFID-based systems enhance inventory accuracy and improve supply chain operations by automatically updating stock levels (Singh, Vinoth, Singh, & Singh, 2024). One of the key advantages of RFID in multi-stage production lines is its ability to enable “real-time production management,” which facilitates the rapid identification of error sources (Liu et al., 2015). Testing RFID tags throughout the production process not only improves production quality but also enhances the accuracy of shipment planning (Arkan & Landeghem, 2013). Zhou (2009), demonstrated that RFID systems contribute to inventory management, production control, and recovery processes in the textile domain. Similarly, Nayak et al. (2015) noted that RFID systems improve not only stock management but also enable demand-driven manufacturing and the personalization of customer experiences.
Despite the increasing adoption of RFID technology in the textile industry in recent years, sewable tags used during production still carry the risk of performance degradation due to stitching defects, physical deformations, or improper placement (Percy, Kanthamani, Roomi, & Sabapathy, 2025). Such issues can lead to data loss and traceability problems during shipping and logistics operations. Dai and Tseng (2012) highlight that information distortion within multi-layered supply chains can result in significant costs, and that RFID offers an effective solution to mitigate this degradation.
Accordingly, real-time testing of RFID tags during production and the automated control of tag quality are of great importance in meeting the industry’s operational needs. In this study, devices with embedded RFID readers integrated into the textile production lines are used to read passive UHF (Ultra-High Frequency) RFID tags, verify their suitability for each product, and detect quality issues at an early stage. The system transmits the captured EPC (Electronic Product Code) data to a local server using the lightweight, low-latency MQTT (Message Queuing Telemetry Transport) protocol, where each tag is verified for accuracy and checked for prior usage. The results are instantly relayed back to the devices on the production line, thereby preventing errors such as repeated readings of the same tag. Furthermore, thanks to the communication protocol, multiple devices can operate in synchronization, and since the system functions on a local network, it operates securely and uninterruptedly without requiring an internet connection. This architecture ensures both quality assurance and data-driven production tracking, guaranteeing that only properly labeled products are approved for shipment.
While the existing literature on RFID applications in the textile industry predominantly focuses on inventory management, production control, and supply chain visibility, this study accepts these foundational benefits but introduces significant innovation in two primary domains.
First, unlike many conventional systems, the proposed architecture is not dependent on an external internet connection; it is engineered to operate entirely on a local network. This feature provides a critical advantage for ensuring uninterrupted and reliable operation within factory environments that may have infrastructure limitations.
Second, and more significantly, this system transcends mere product tracking by incorporating a multi-layered tag quality control mechanism that individually validates items at the production line stage. This mechanism integrates EPC format validation, tag uniqueness verification, and a quality audit based on signal quality and scanning accuracy to detect physical defects, such as stitching errors. This integrated approach aims to contribute to the supply chain by preventing improperly labeled products from entering shipment, thereby offering a more robust solution to the industry’s operational needs.
Methodology and Implementation
The system consists of IoT devices equipped with RFID readers and antennas, positioned on workstations along textile production lines; garments equipped with or stitched with passive UHF RFID tags; and centralized local server infrastructure. Each device reads the RFID tag attached to the product and transmits the obtained product codes to a Raspberry Pi–based local server via the MQTT protocol. Through the deployment of these devices at different stages of the production line, tag verification is automatically conducted by the system throughout the process. A Mosquitto MQTT broker configured on the local server receives data from all devices, while an SQLite-based database stores this data along with the EPC, timestamp, and device identity. The incoming data routed through the broker is processed by a local data handling algorithm, which analyzes the information to detect conditions such as duplicate tag usage and sends instant warning messages to the relevant devices when necessary.
The developed system is supported by a user-friendly interface designed for ease of use by production line operators. The devices are capable of operating in fully offline scenarios, with all data communication occurring within the local network. As a result, the system functions reliably even in factory environments without internet access. Moreover, the architecture is designed to be scalable, enabling simultaneous integration across multiple production lines.
Utilized Electronic Components
The developed real-time production tracking system incorporates various electronic components selected to fulfill functions such as data acquisition, communication, processor control, user interface, and centralized data processing. During the hardware selection process, key criteria such as system reliability, communication speed, ease of physical integration, and low-power consumption were considered.
RFID Reader
The RFID reader module used in the system is the Zebra RE40 (Figure 1). This integrated RFID reader is designed to read passive UHF RFID tags and supports both EPC Class 1 Gen2v2 and ISO/IEC 18000-6C protocols. It operates in the 865–868 MHz frequency range and offers a configurable output power from −10 dBm to +27 dBm. This feature enables dynamic adjustment of the reading range based on the system’s requirements. The module provides a receiver sensitivity of −78 dBm, allowing it to detect even low-power reflected signals. Zebra RE40 RFID Reader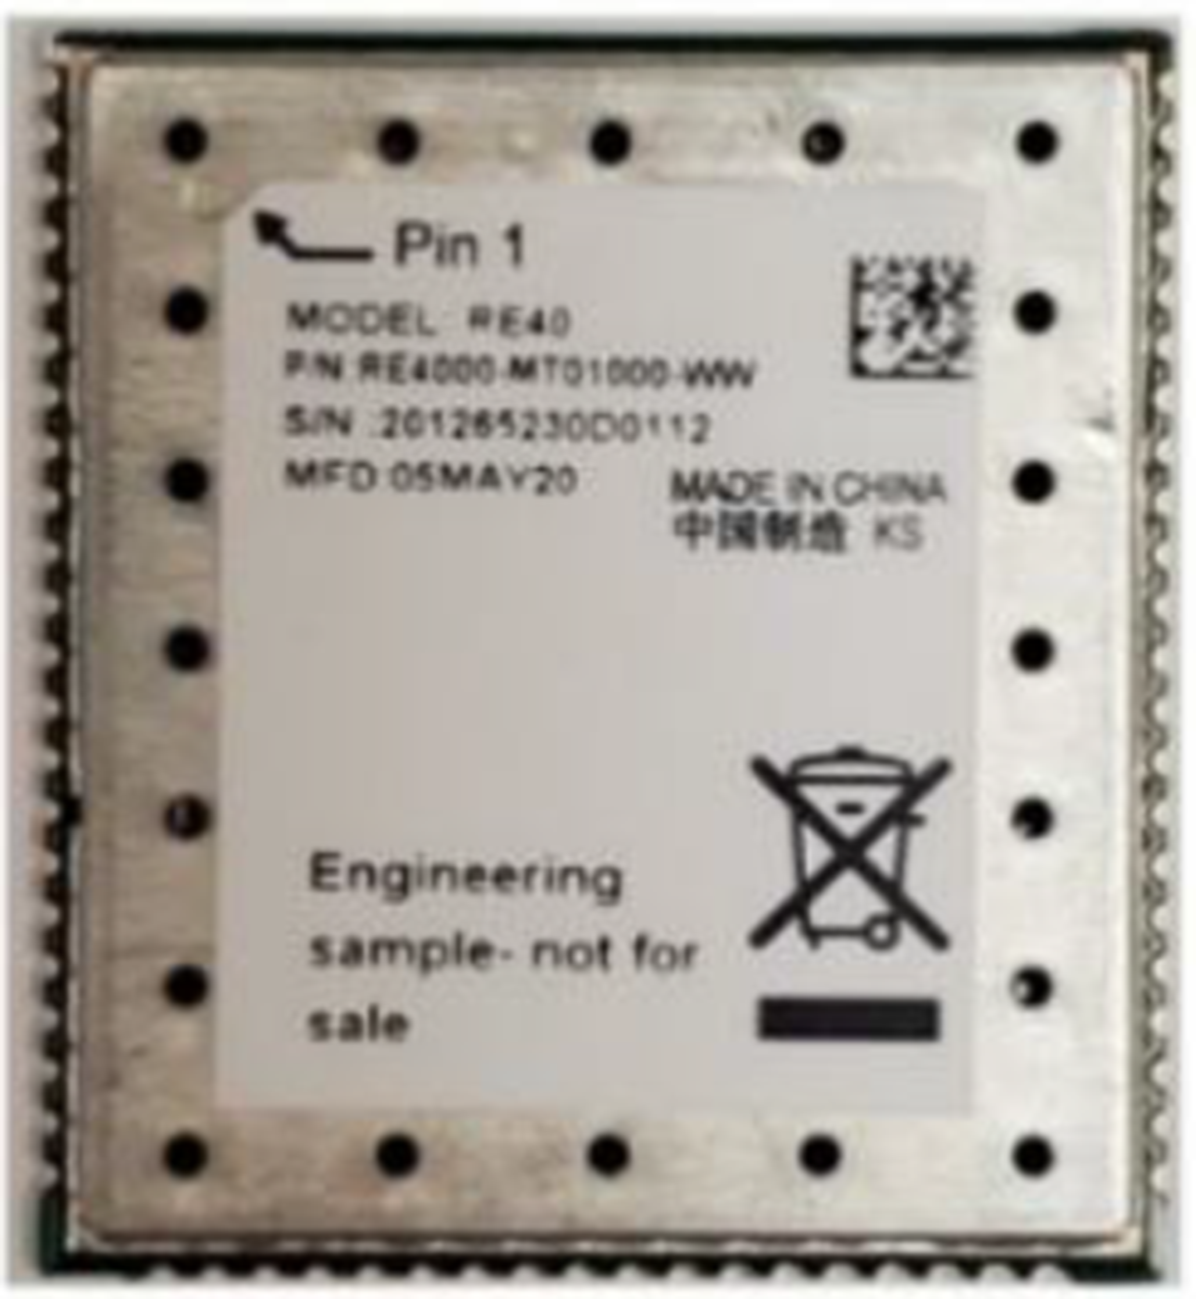
RFID Antenna
In this study, the electromagnetic performance of a circularly polarized UHF antenna, integrated into the RFID reader system, was analyzed through simulations conducted within a metallic enclosure. The antenna is intended for reliable and accurate tag reading at a maximum distance of 20 cm. The simulation results are interpreted in detail in Figure 2. The highest gain was observed near the z-axis, with a calculated co-polar gain of 2.462 dBi, which indicates a sufficient level of directional radiation performance for desktop applications. In addition, the total efficiency was found to be −2.283 dBi (59.2%), and the radiation efficiency was −1.971 dBi (63.6%). Despite potential losses due to the metal enclosure, the antenna can radiate adequate energy. The radiation pattern exhibits a dominant main lobe, while the suppressed back lobes align well with the directional reading requirements of desktop implementations. 3D Simulation of the Antenna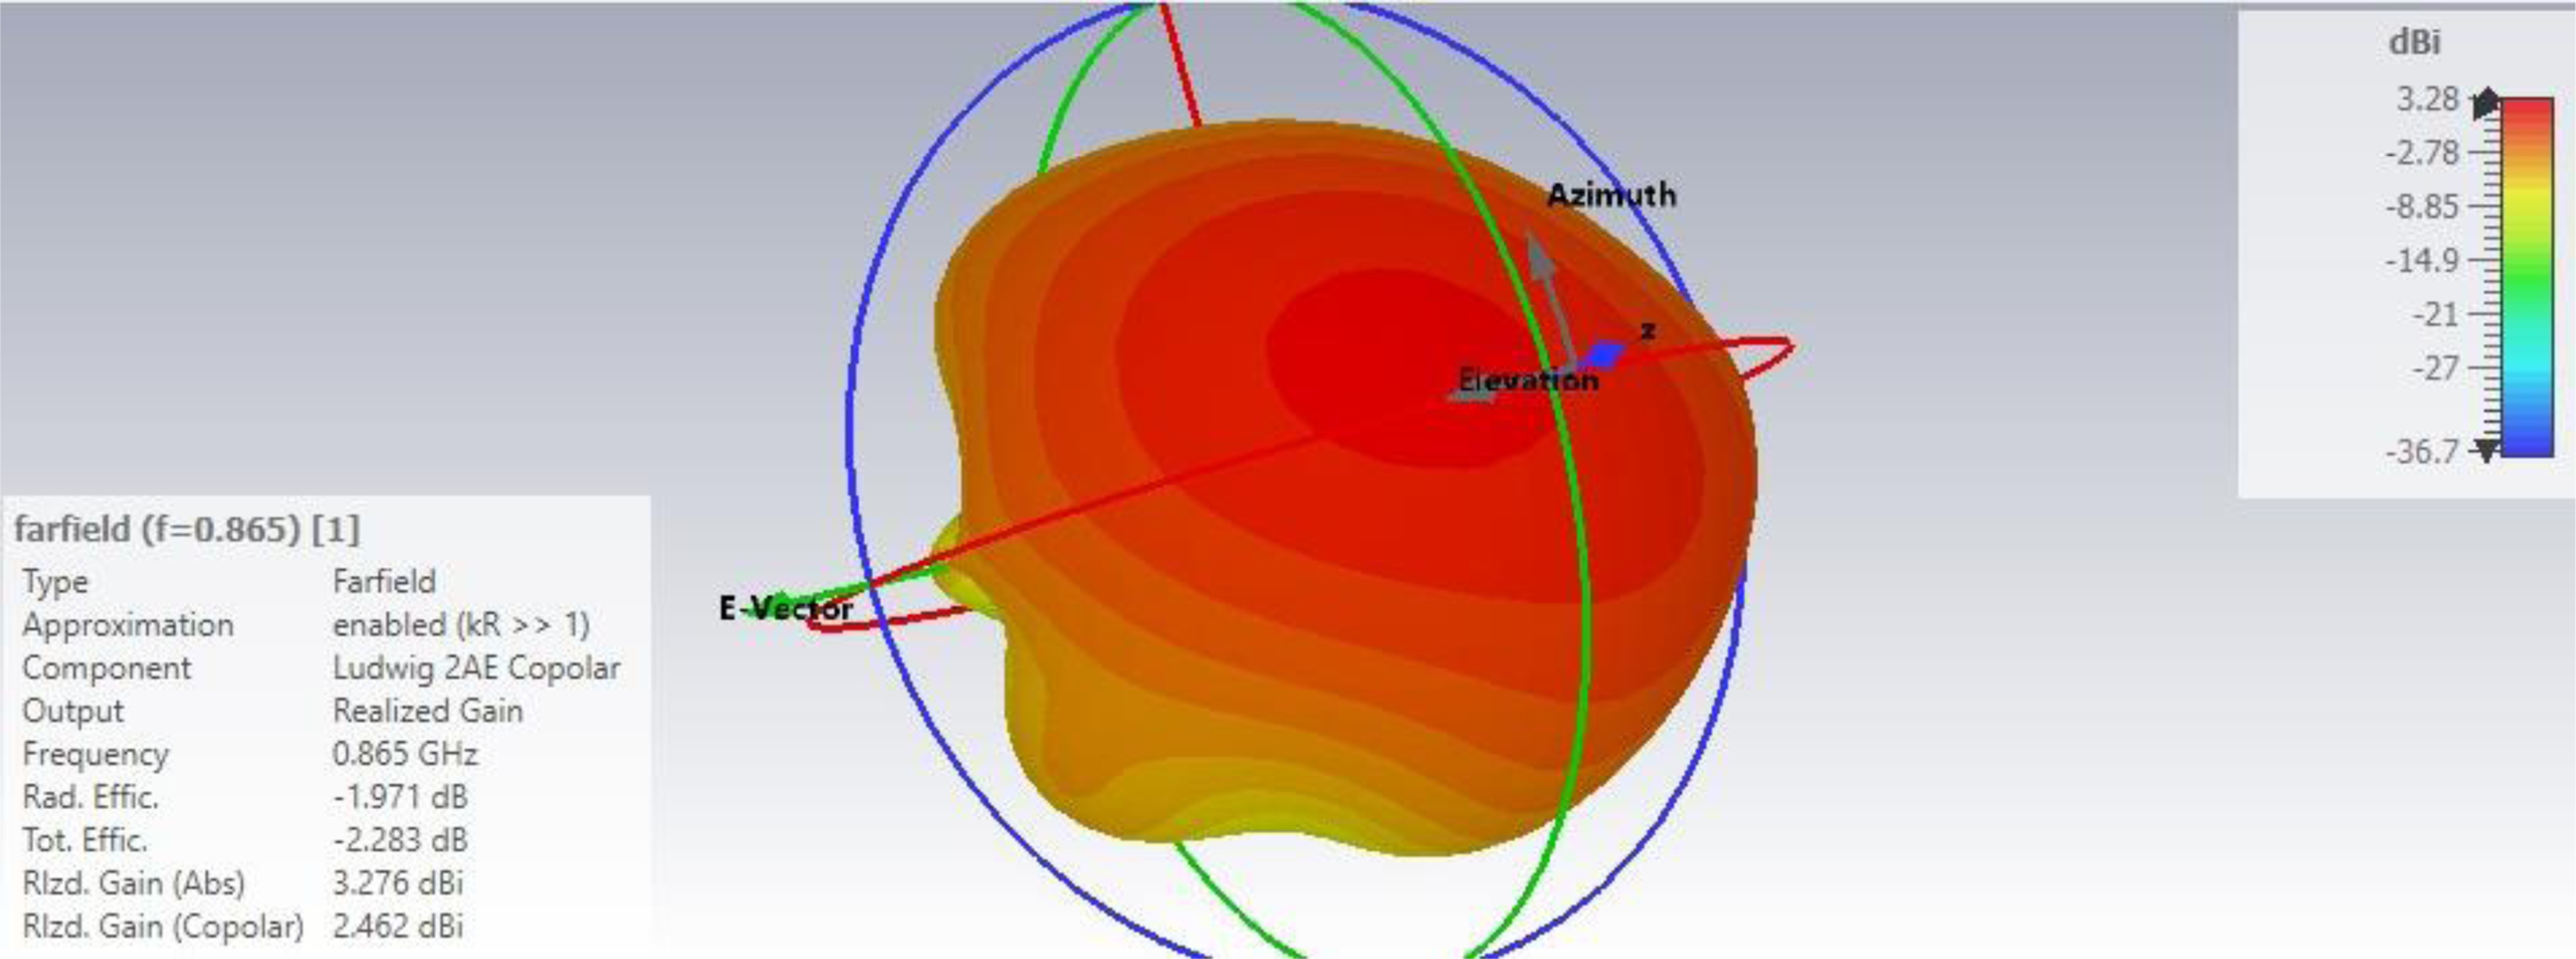
Other Electronic Components
As the control unit of the developed system, the ESP32-WROOM-32UE module, manufactured by Espressif Systems, was selected. For centralized data processing, concurrency management, and logging operations, Raspberry Pi 4 Model B was employed as the main server unit. This unit is responsible not only for collecting and processing data received from the edge devices but also for maintaining the integrity of the production tracking process by handling database storage and broadcasting feedback messages. Network communication within the system is managed via the WIZnet WIZ5500 chip, which interfaces with the ESP32 microcontroller over the SPI bus. This chip features a hardware-based TCP/IP stack, significantly offloading communication tasks from the application layer. It is used for transmitting data to the central server via the MQTT protocol and ensures stable and low-latency Ethernet communication. To enable user interaction and provide real-time visual feedback on system status, an SPI-based touchscreen TFT display was integrated into the device. Additionally, visual status indicators were included on the desktop unit to visually communicate the operational state of the system to the user.
System Overview
This study is built upon a distributed architecture that enables each product to be tagged, verified, and transmitted in real time to a central server during the textile manufacturing process using RFID. The system consists of IoT devices equipped with RFID readers placed at critical points along the production line, an MQTT broker structure that manages communication between devices, and a central server where all data is processed. Each IoT device includes ESP32, RFID reader, antenna, a touchscreen display, LED and buzzer-based notification system, and Ethernet/Wi-Fi-based network connectivity. These devices are fixed at designated locations on the production floor and are responsible for reading the RFID-tagged garments as they pass by, processing the EPC data, and verifying its validity. Upon completion of the verification process, the device transmits the data to the central server over the local network via the MQTT protocol. The central server performs control operations and sends updated counter information back to the devices. In this way, each RFID-tagged product passing through the production process can be uniquely counted on its respective line, and error detection is enabled. This architecture not only balances the read load but also allows for statistical analysis at the production-line level. In factories with multiple production lines, one device can be deployed per line to enhance system performance and detection accuracy. The block diagram of the system is presented in Figure 3. Block Diagram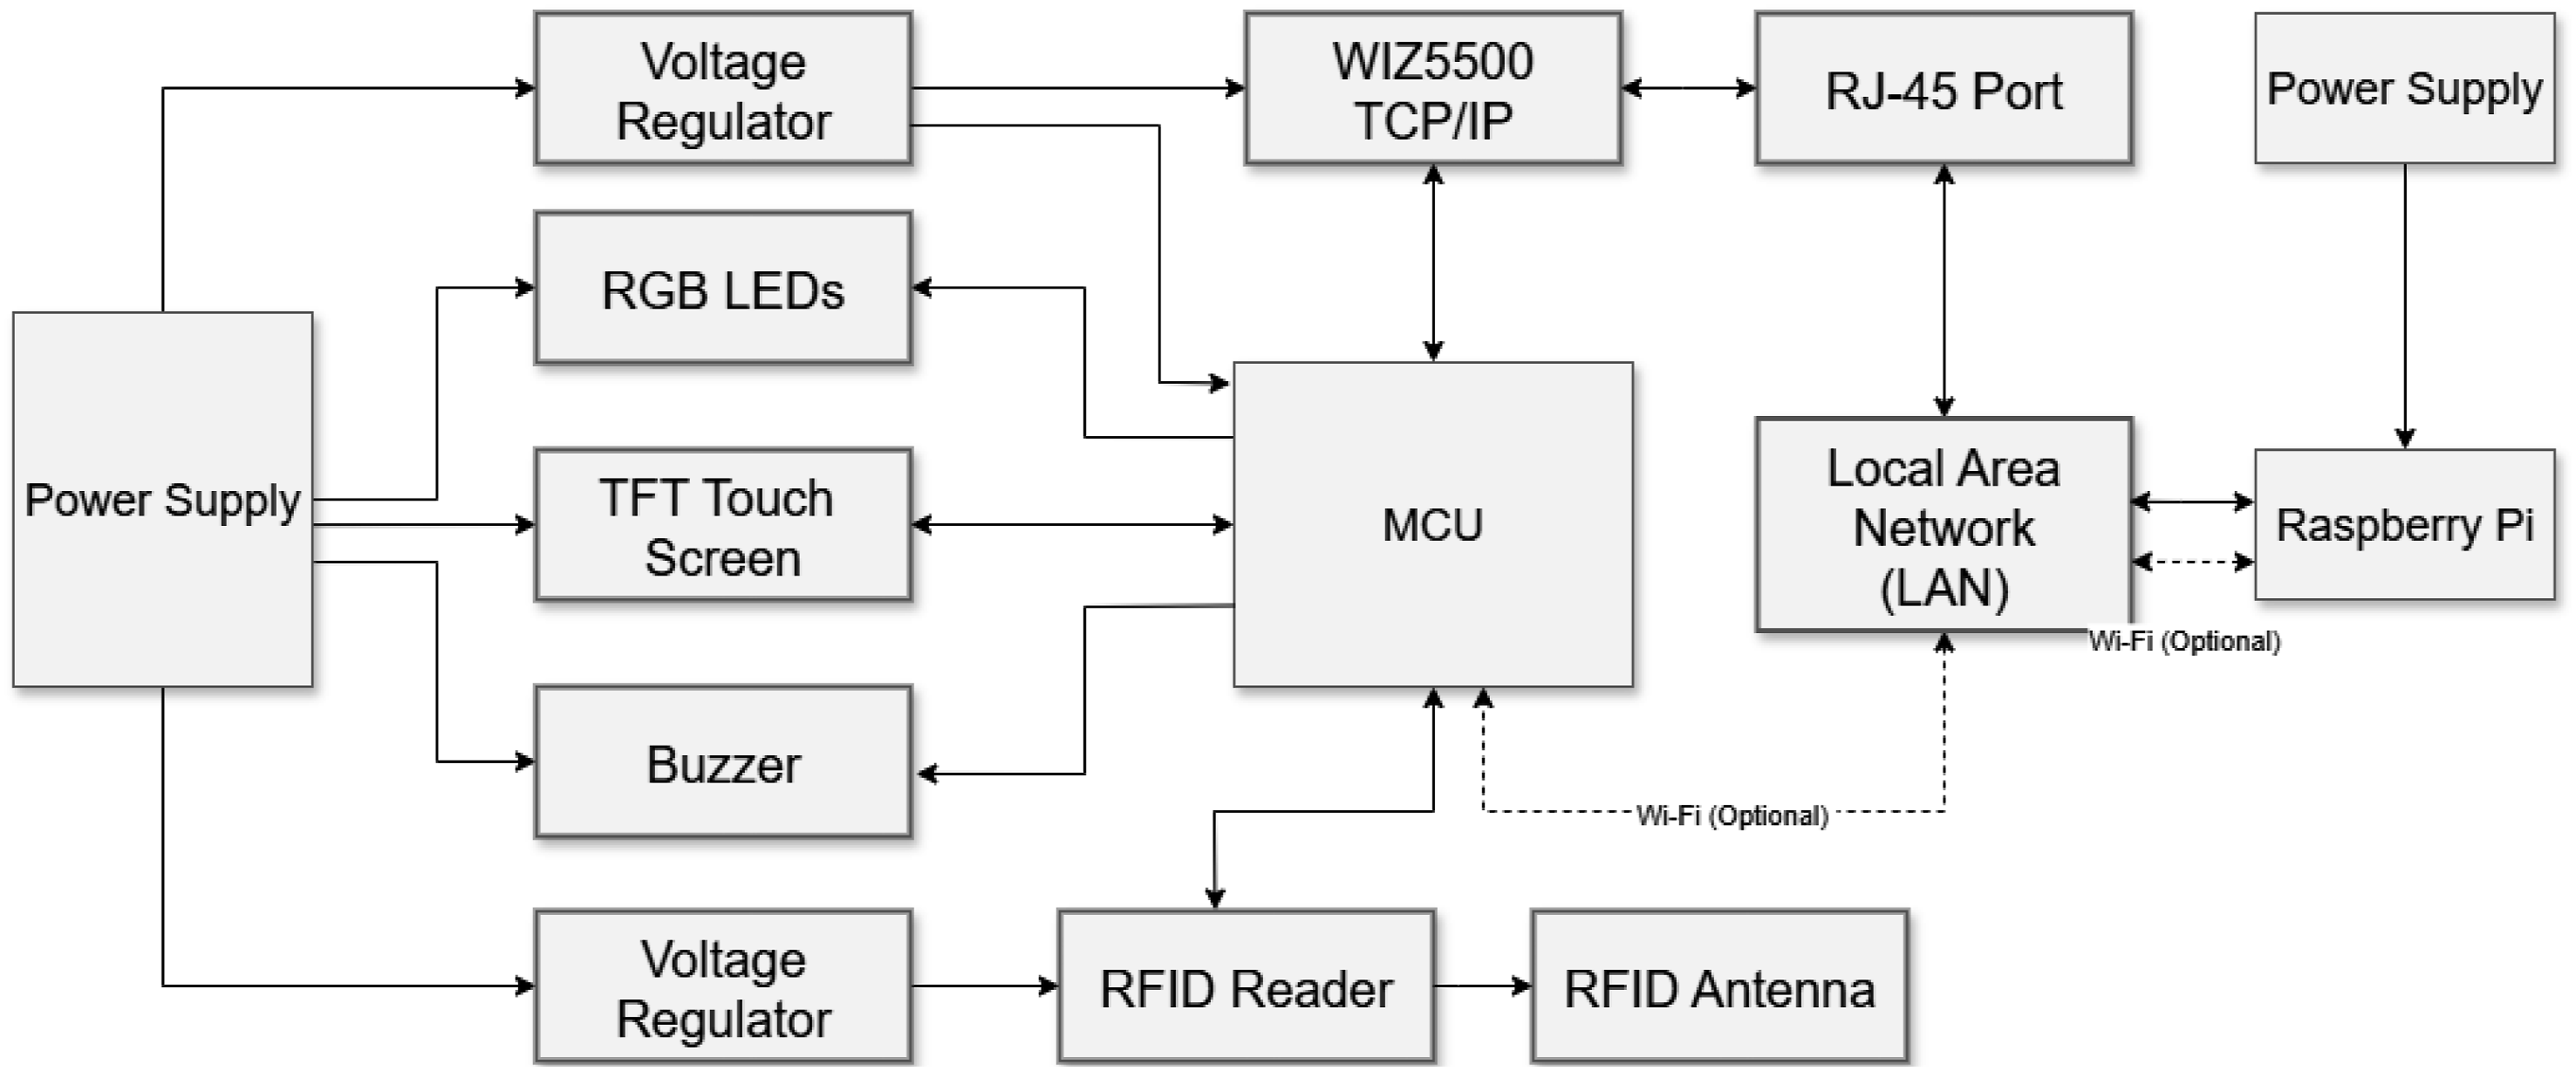
To visually illustrate the software workflow and decision-making mechanisms of the system, a general process flowchart is presented in Figure 4. This diagram sequentially and conditionally represents the steps of verification, validation, and data transmission that occur following the reading of an RFID tag. Error scenarios that provide visual feedback to the user have also been integrated into the flow. The process flowchart outlines the system’s end-to-end data validation, error handling, and user interaction loop, serving as the logical foundation of the software algorithms. Flowchart of the System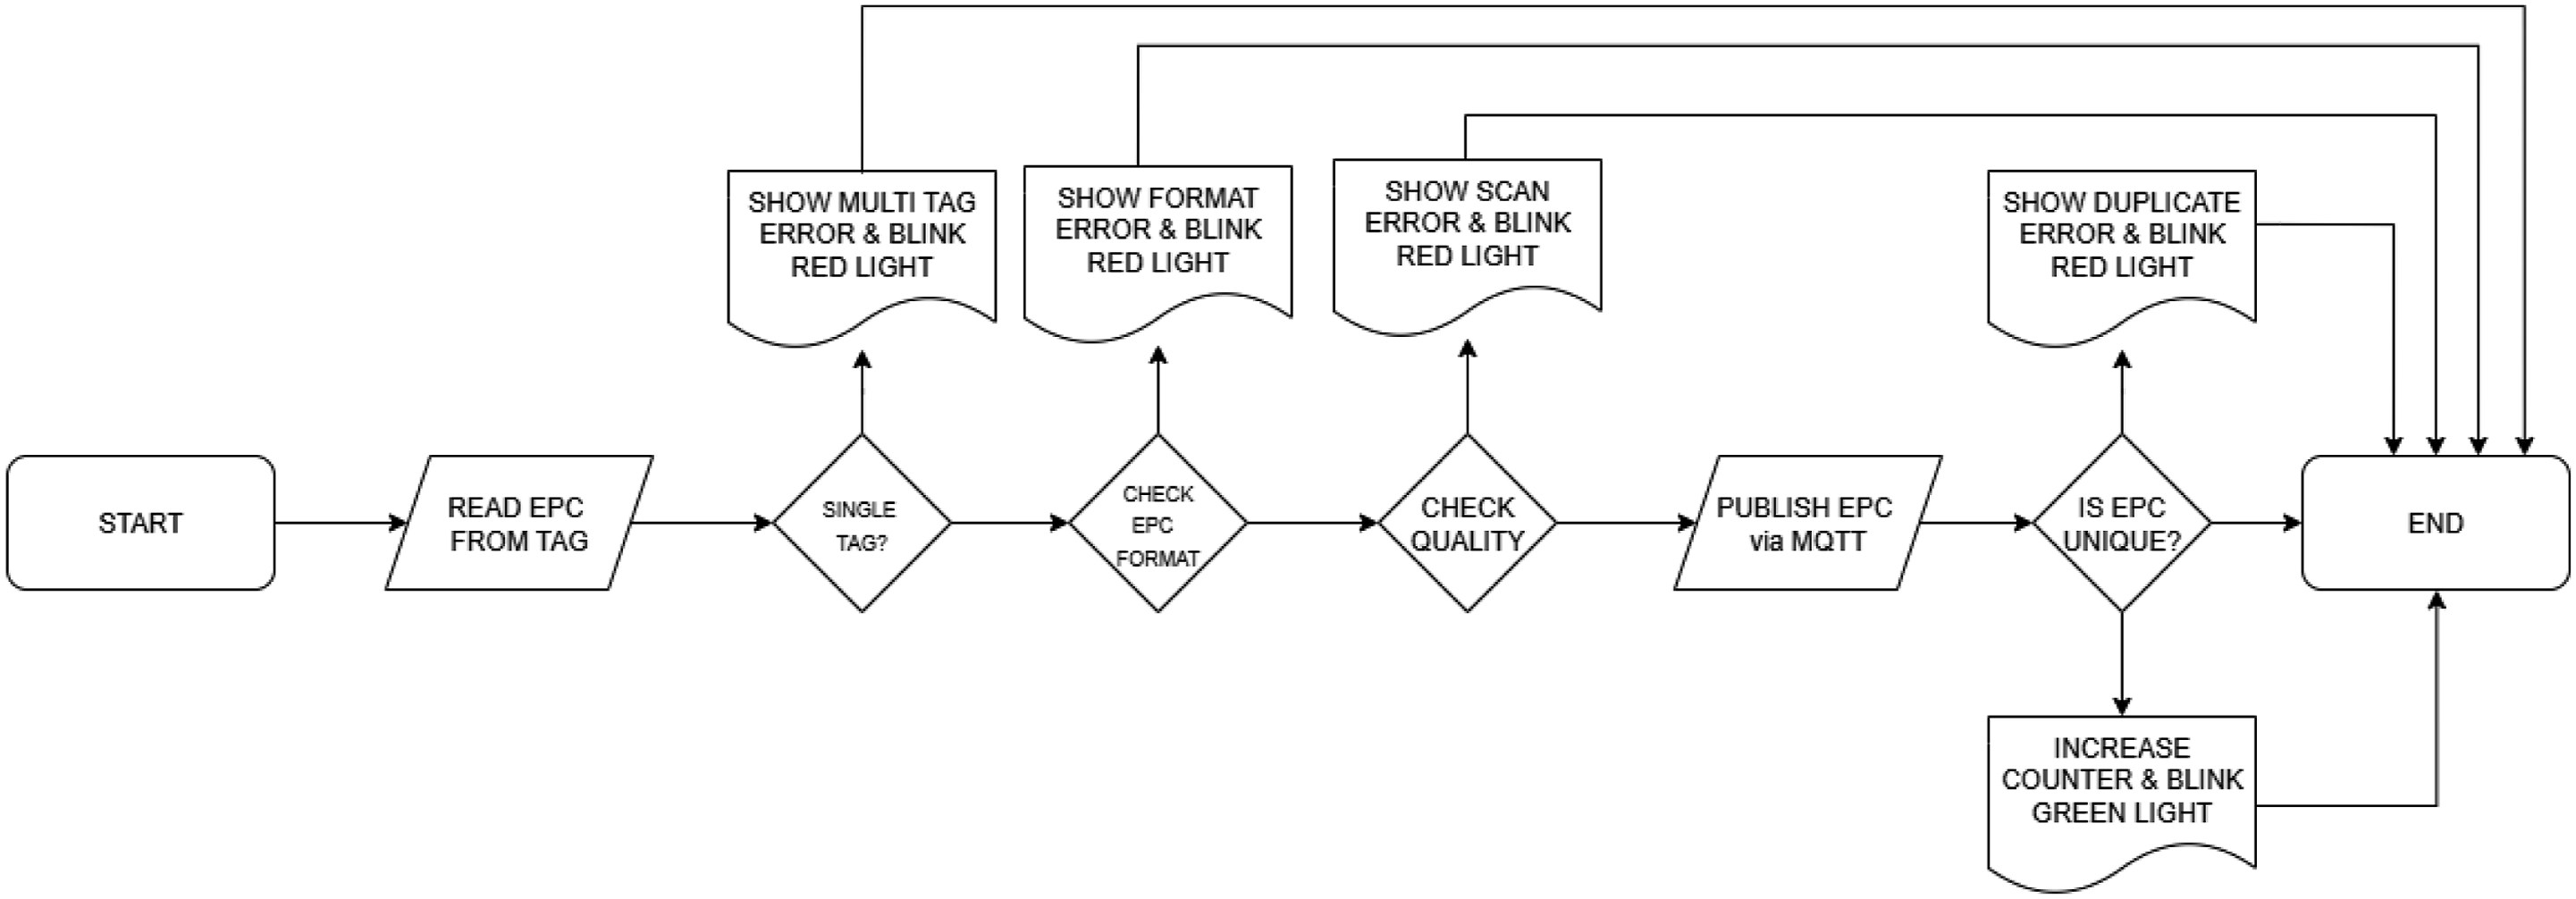
Software Architecture and Control Algorithms
This section presents the algorithmic structures of the embedded software components developed for the system. The firmware running on the microcontroller is designed with a modular architecture to perform key functions such as receiving RFID data, conducting format and quality validation, transmitting the data to the server, and providing user feedback. The system operates based on an event-driven control logic.
At the application level, the software models not only focus on the accurate acquisition and interpretation of EPC data but also incorporate decision-making mechanisms aimed at improving the reliability of the production process based on tag quality. Furthermore, data transmission via the MQTT protocol over the network plays a critical role in enabling device-to-device synchronization and centralized data management within the system.
Reading EPC Memory and Format Validation
The EPC memory bank of RFID-tagged products is read by the RFID reader. This product code simultaneously encodes both what the item is (e.g., product type or category) and which individual item it is (i.e., its unique serial number). The use of GS1 standards in RFID systems is particularly important for supply chain tracking, anti-counterfeiting, inventory control, and item-level identification (EPC Tag Data Standard, 2025). The SGTIN-96 (Serialized Global Trade Item Number) format, defined by GS1, is an EPC data structure that enables the globally unique identification of products. This structure provides a fixed-length 96-bit (12-byte) EPC format. Thanks to this standard, both large manufacturers and small businesses can uniquely identify their products within a unified system (Guideline SGTIN and RFID, 2018).
To ensure correct processing of the EPC, the structure must be parsed and validated against format-specific rules. In this study, the validation algorithm is configured to process tags that conform to the SGTIN-96 format. As a result of this validation, only standardized and structurally valid EPCs are accepted by the system, while improperly structured or non-conforming data is immediately rejected. This prevents the inclusion of incomplete, incorrect, or non-compliant tags in the production line.
This mechanism not only improves real-time reading accuracy but also mitigates operational risks such as traceability failures, inventory mismatches, or data inconsistencies during recall processes. By accepting only valid EPC data, the system enhances the reliability of RFID-based automation and ensures that accurate data is delivered to decision support mechanisms at every stage of production. This early-stage filtering approach reduces the error rate in the field and contributes to the establishment of a sustainable data structure throughout the product lifecycle.
Single Tag Verification
In RFID-based production systems, it is essential that each product is associated with only one RFID tag to ensure accurate inventory tracking. This requirement is particularly critical in the garment and textile industry, where item-level traceability and inventory accuracy are of great importance. In the developed system, a multi-tag verification algorithm is implemented to ensure that each RFID tag is unique.
This algorithm operates based on the number of EPCs detected by the RFID reader. During each reading cycle, the system counts how many tags are detected within a predefined time window (100 milliseconds). If exactly one EPC is detected within this window, the product is considered valid, and the process continues. If two or more EPCs are detected, the system flags it as a multi-tag error. In such cases, the device provides both visual and auditory warnings to the operator, and the data is discarded by the system.
This warning prompts the operator to physically inspect the product and remove any additional tags. Once the excess tags are removed, the scan is repeated, and the process is only completed successfully if a single EPC is detected. This control mechanism is directly integrated into the RFID reader hardware and embedded into the system’s decision logic, functioning in coordination with operator intervention. As a result, the system ensures that only correctly tagged products are admitted into the production process.
Tag Quality Control Algorithm
With the increasing adoption of RFID technology in the textile industry, sewable RFID tags have been introduced to enable item-level identification during the production process. These tags are typically integrated directly into garments using stitching methods (see Figure 5). However, stitching errors during the integration process can compromise the structural integrity of the tag and directly affect its functionality. Example of an RFID Tag Sewn Onto a Garment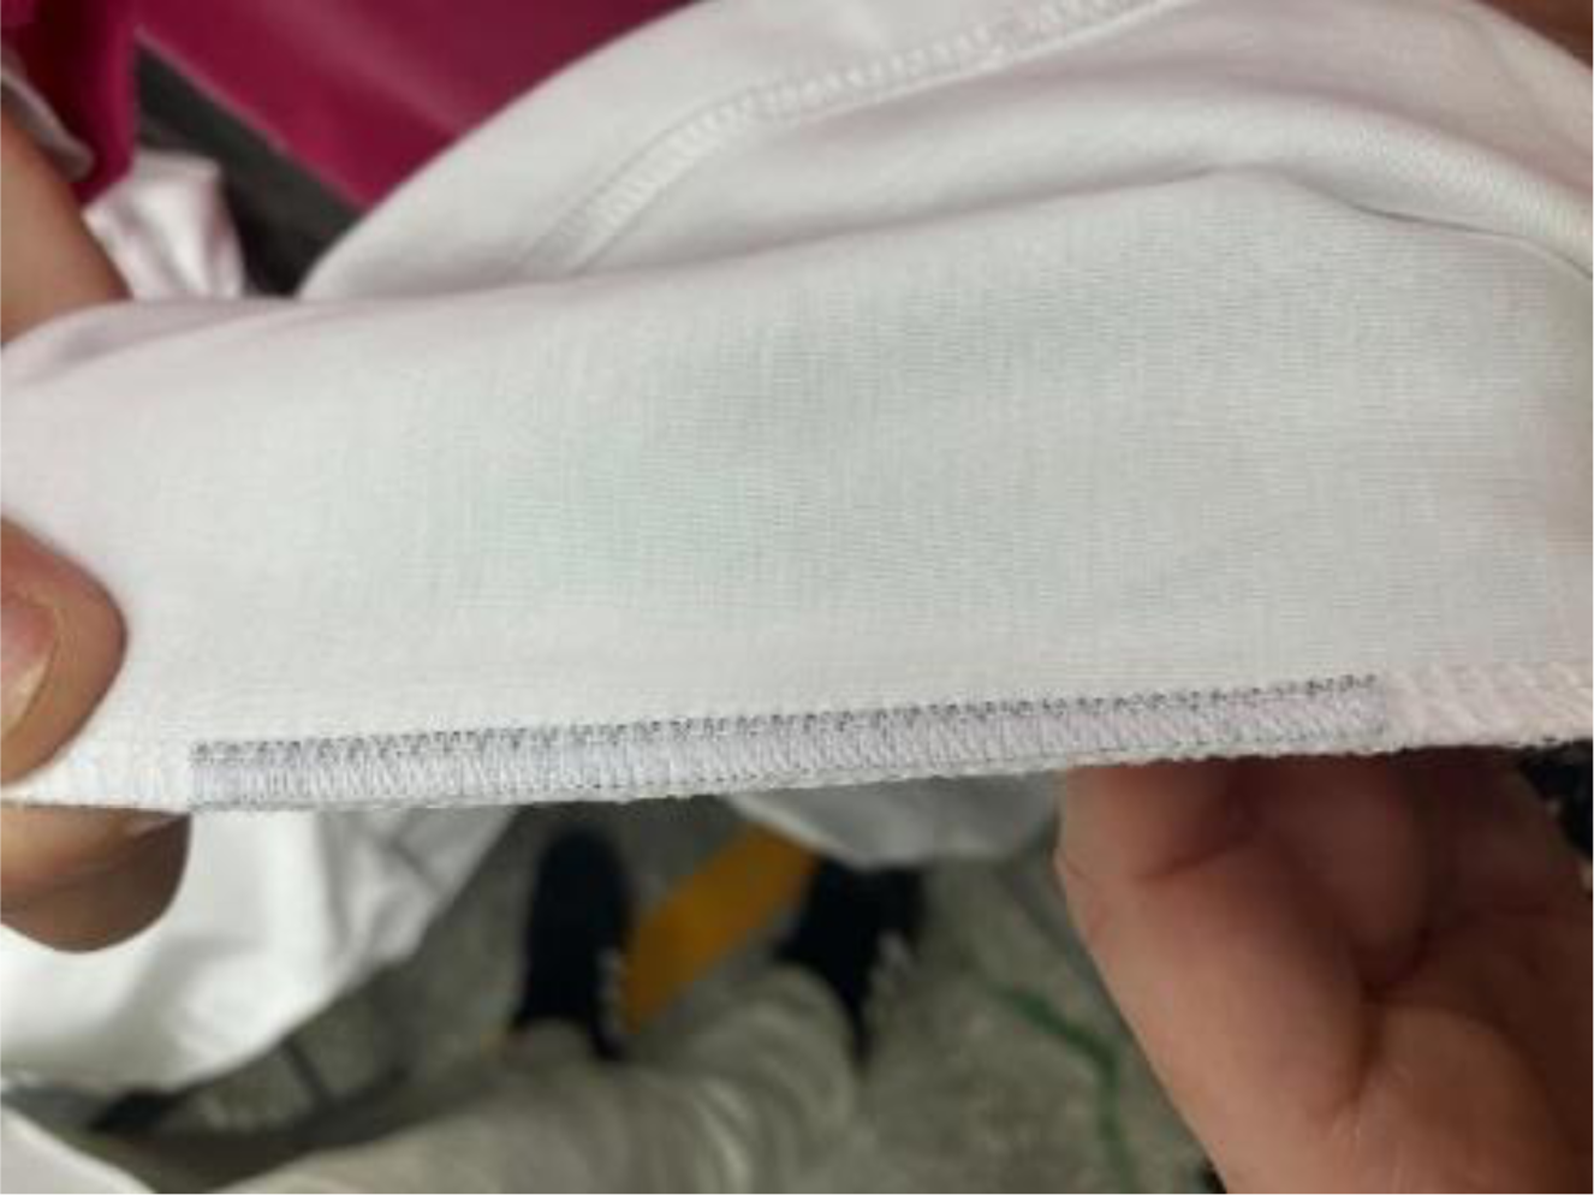
Physical issues such as chip damage, antenna breakage, misalignment, and antenna bending may disrupt data transmission, leading to complete or inconsistent reading failures. For example, excessive stitching tension or applying pressure on the tag may deform the conductive structure of the antenna or cause microcracks around the chip area, making the tag non-functional. Likewise, direct contact between the sewing needle and the chip area can puncture the chip, resulting in permanent damage. Additionally, folding, wrinkling, or breaking the tag during stitching can deform the antenna structure. Since antennas are designed based on specific physical geometry and impedance values, such deformations negatively affect energy transfer, causing a significant reduction in signal strength or complete failure in tag readability.
In this study, the effects of various stitching defects on RFID tag performance were comparatively analyzed using the Voyantic Tagformance. The resulting graphs illustrate the frequency-power characteristics of sewable RFID tags and are based directly on measurement data obtained from the device.
The horizontal axis (X) of the graphs represents the frequency range used in RFID systems (800 MHz–1000 MHz). Within this range, operating band 865–868 MHz is visually highlighted with a gray band. The vertical axis (Y) shows the Power on Tag – Forward (dBm) value, which indicates the minimum power that must be received from the reader for the tag to be successfully activated. Therefore, the lower this value, the higher the sensitivity of the tag is. Each colored curve on the graphs represents an individual RFID tag of the same model and physical structure but sourced from different production batches or individual samples. This allows for the observation of performance distribution among similarly structured tags subjected to the same physical conditions, thereby enabling the identification of variations. The red curve, labeled as the “tag sensitivity mask,” serves as a reference indicating the system’s maximum acceptable read threshold. Tags performing above this curve are considered readable by the system, while those below are deemed unreadable.
The graphs presented below offer a comparative view of how the same model of sewable RFID tags perform under different stitching scenarios. The tags shown in Figure 6 are physically intact, fully functional samples taken directly from production without any mechanical deformation. Their curves demonstrate a low and stable power requirement between −15 dBm and −18 dBm within the 865–868 MHz range. These values fall within acceptable limits for industrial applications, ensuring system reliability. Frequency–Power Performance Curves of Intact Tag Samples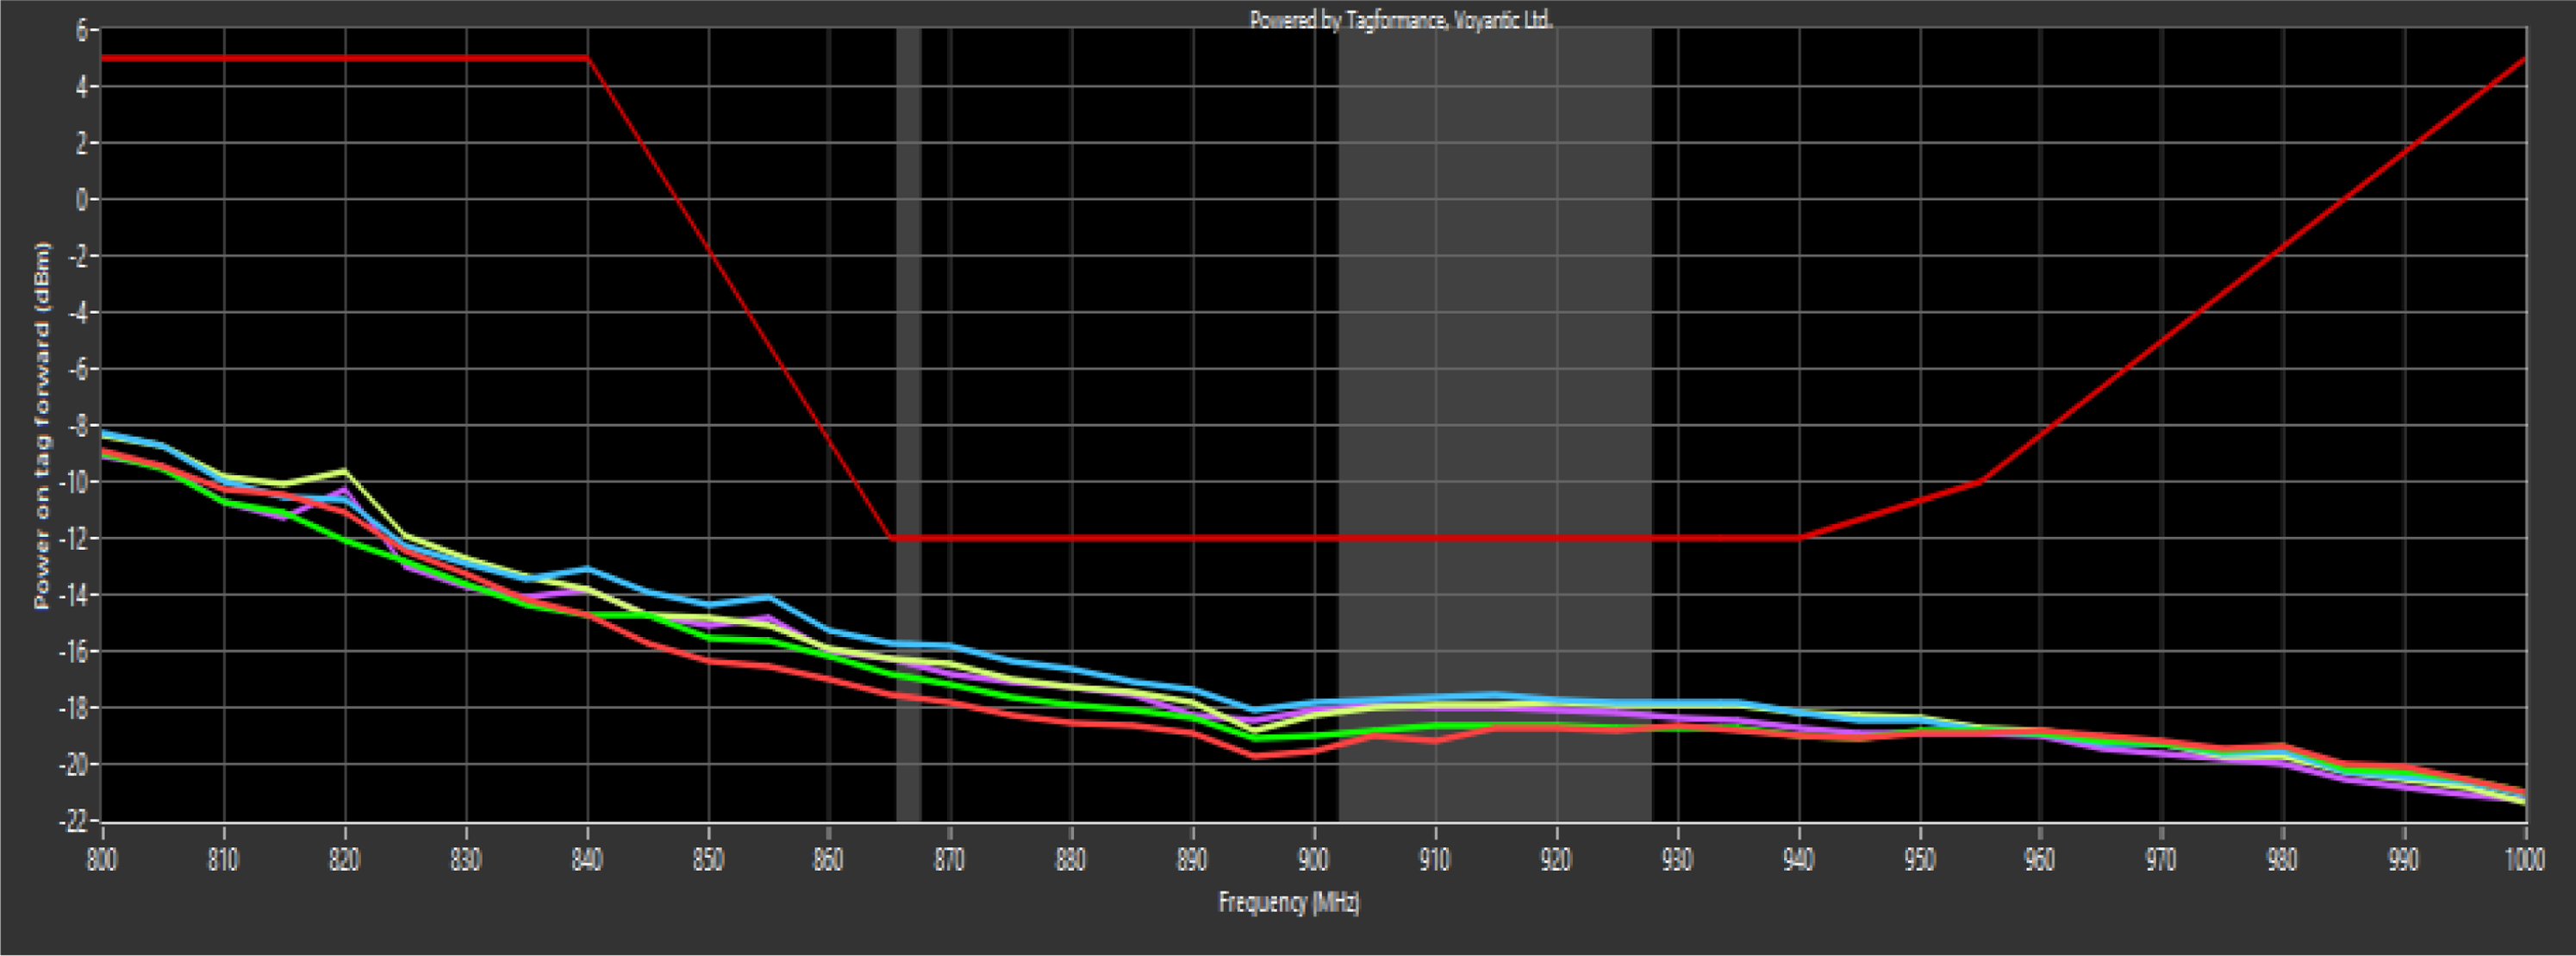
To further elaborate on the system’s detection sensitivity, tags with a moderate level of deformation were also analyzed, as presented in Figure 7. These tags exhibit an activation power requirement exceeding −12 dBm within the 865–868 MHz frequency band. This performance level is significantly poorer than that of the intact tags yet superior to that of the severely damaged tags. Frequency–Power Performance Curves of Moderately Deformed RFID Tags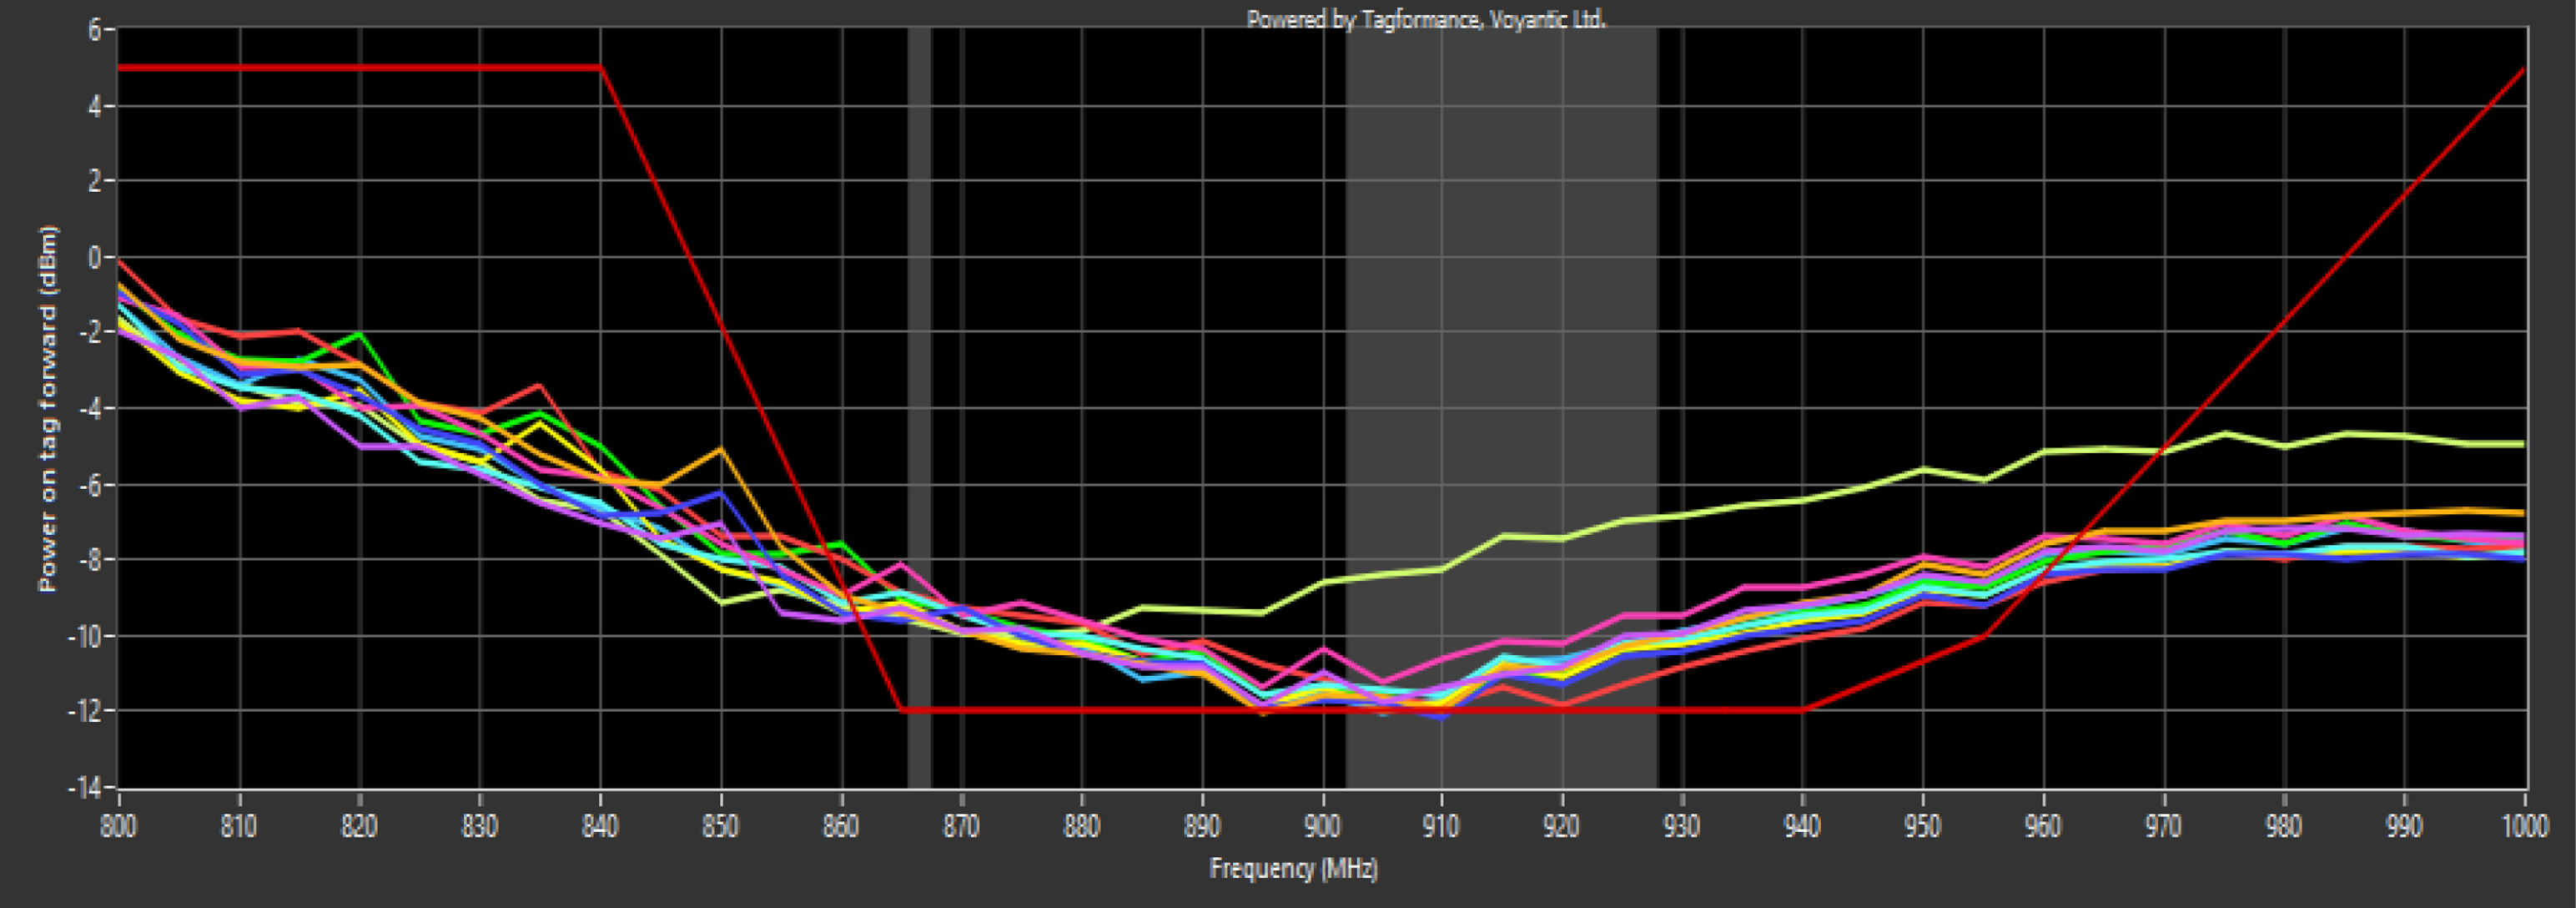
The critical finding is that the performance curves of these tags operate on the borderline of the −12 dBm masking threshold, particularly within the 902–928 MHz band. This indicates that the tag exhibits marginal performance, which translates to inconsistent operation in a practical setting. Such tags might be successfully read at one station opportunistically, only to fail at the next or with a minor change in orientation. This creates significant potential for severe traceability issues during the shipment and logistics phases.
Figure 8 includes measurements of RFID tags that have undergone severe physical deformations, particularly in the antenna region, such as cuts or folds. Within the same frequency band, most of these tags require a significantly higher activation power, around −5 dBm. Furthermore, the curves show noticeable fluctuations and instability, which represent a critical risk to overall system reliability. Frequency–Power Performance Curves of RFID Tags With Severe Antenna Deformation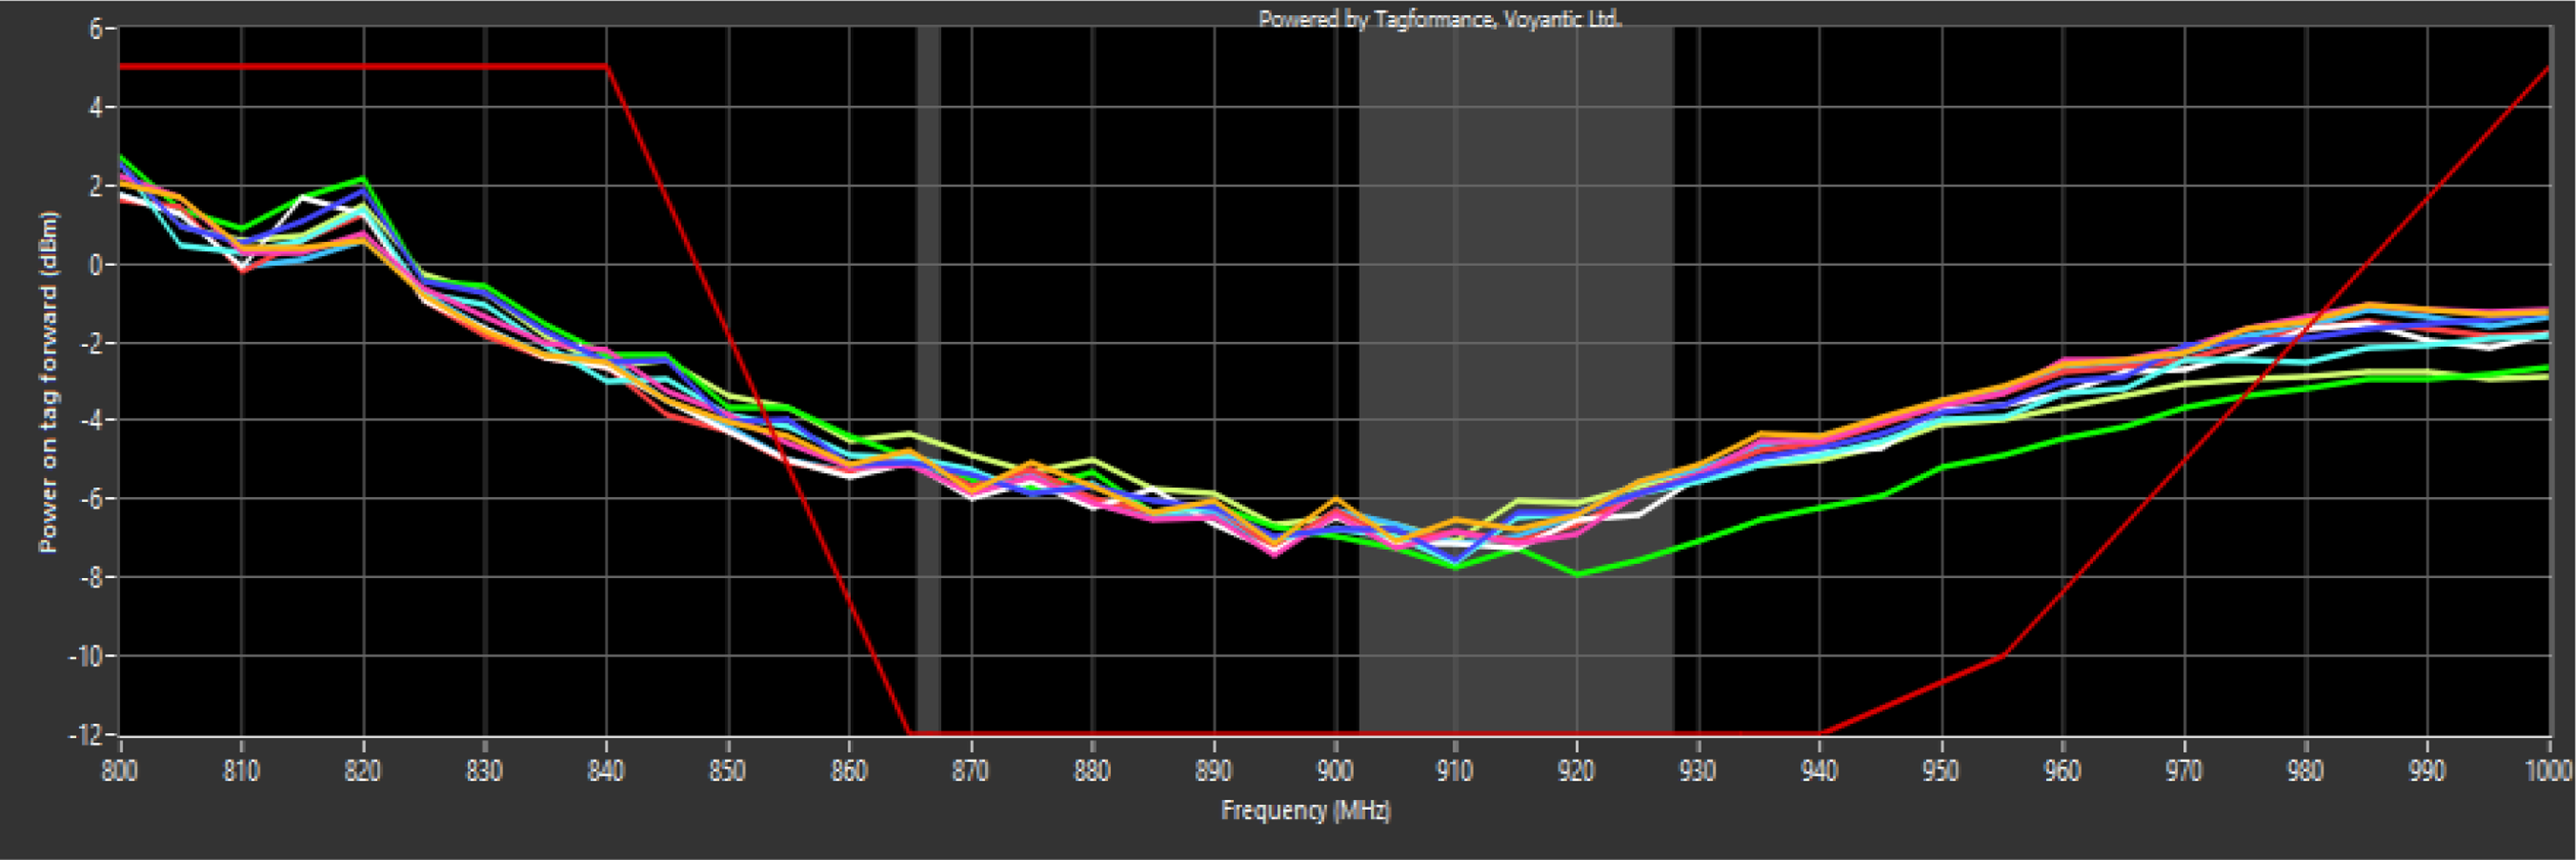
The comparative analysis of these three distinct groups of tag conditions: intact (Figure 6), partially degraded (Figure 7), and severely damaged (Figure 8), provides a comprehensive “white, gray, and black” validation model. This multi-level testing demonstrates that sufficient quantitative measurements have been established to validate the core principle of the quality control algorithm. Based on these measurement results, the signal strength transmitted by the tag during reading has been identified as a key parameter for detecting damaged or low-performance tags. Accordingly, the developed system implements a tag quality control algorithm based on RSSI and read consistency to detect such defects during the production process. This algorithm evaluates not only the physical presence of the tag but also its electronic functionality, allowing defective tags to be excluded from the system.
In this way, the system ensures that every RFID tag integrated into the production line is both physically intact and electronically functional, and fully compliant with relevant standards. As a result, potential traceability issues, customer complaints, and inventory errors that may arise in later stages of production or post-sale processes can be effectively prevented.
Server and Network-Based Communication
In the developed system, RFID data readings performed at the edge devices are not limited to local processing but are also managed through a centralized server structure. This structure enables the centralized evaluation, storage, and synchronized feedback distribution of data transmitted by production devices.
The central server is hosted on a Raspberry Pi and communicates with the edge devices using the MQTT protocol. Data is received via Python-based scripts, processed on an SQLite database, and the results are distributed across all devices. This setup is not merely a client-server model but also functions as a control layer that enables real-time synchronization between devices.
The system is designed to operate entirely within a local network, eliminating the need for an external internet connection an important advantage in production environments where timing and reliability are critical. Moreover, thanks to MQTT’s publish-subscribe architecture, all components of the system can respond simultaneously to data published by any device. For example, when a valid EPC is received from one device, it is stored in the database and simultaneously used to update the counters displayed on all other devices.
The following section provides a detailed explanation of the key components of this central application: the MQTT broker, the database infrastructure, the Python-based data processing script, and the synchronization mechanisms.
MQTT-Based Communication Structure
In the developed system, network-based communication between the devices and the central server is implemented using the MQTT. Within this structure, each device is configured as an MQTT client, while the central server, running on a Raspberry Pi, operates as the broker. On the server side, Mosquitto, a lightweight and open-source MQTT broker, is utilized.
MQTT Topic Structure
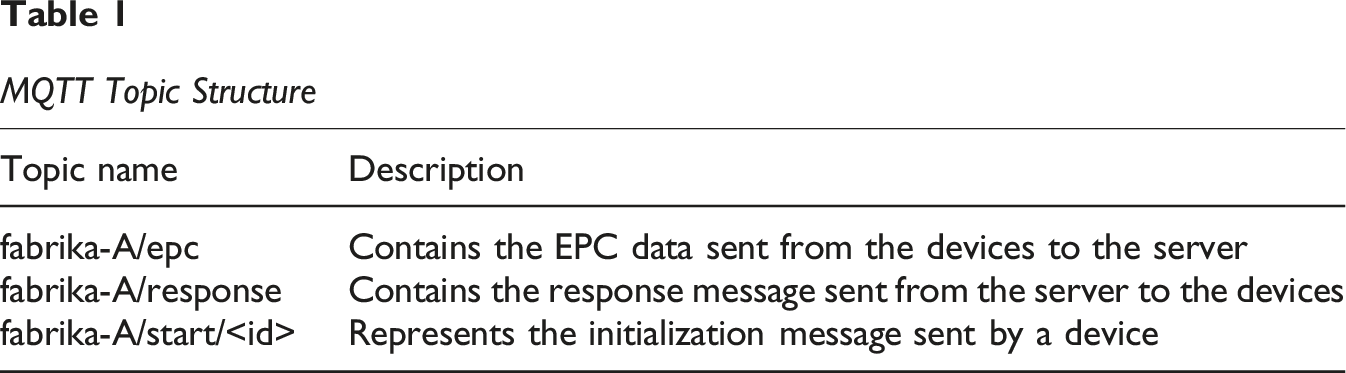
This publishing/subscribe structure enables access to time-based data regarding when and how many tags have been read by each device on the production lines, allowing production performance to be evaluated over time. Additionally, it ensures that the devices positioned along different production lines within the factory operate in a synchronized manner, with each device maintaining continuous communication with the central server.
When an error is detected during the tagging process, the server broadcasts a warning message via the response topic to all devices subscribed to it. Upon receiving this message, the relevant device provides visual and/or auditory feedback to the operator, prompting them to remove the faulty tag from the production line.
Database Capacity Analysis and Evaluation in Terms of Production Continuity
The Raspberry Pi is equipped with a 32 GB microSD card for storage and 8 GB of RAM. In the system, the SQLite database is physically stored on the SD card. As a result, all recorded tag data remains persistent even after the device is restarted. RAM is used only for temporary operations, such as executing queries or managing memory buffers, while permanent data storage is handled exclusively via the SD card. This configuration ensures both data security and continuity of production. Each individual tag record occupies approximately 75 bytes of storage space. After accounting for system files and logs, the usable capacity of the 32 GB SD card is approximately 25 GB. Based on this available space, the total storage capacity of the system can be calculated as follows:
Thus, the system is theoretically capable of storing approximately 357 million tag records. In practice, this number may be slightly lower due to overhead from the file system structure, database indexing, and other operational files. As a sample scenario, consider a facility with four production lines, where each line reads one RFID tag every 10 seconds on average. Assuming a daily operation time of 8 hours and a total of 312 working days per year, the annual total number of tag readings for such a facility can be calculated using equation (2).
Based on the calculation: • Annual total number of tag reads: 3,594,240 (Eq. (3)) • This corresponds to approximately 1.00% of the system’s total theoretical capacity (Eq. (4))


As demonstrated, the system is capable of continuously storing multiple years’ worth of production data with the current hardware configuration. This enables long-term operation in the field without requiring data deletion, backup, or manual intervention. Additionally, the indexing support provided by the SQLite structure helps maintain low query response times.
Experimental Results and System Evaluation
This study investigates whether passive UHF RFID tags affected by stitching errors, physical deformations, or manufacturing defects can be detected by the developed system. For this purpose, a test setup consisting of a 9 × 5 grid was mounted on top of the RFID reader device (see Figure 9). The test tags were read for approximately 1–2 seconds at each of the 45 positions, and the average RSSI (Received Signal Strength Indicator) value from the reader was recorded for each region as a basis for the measurements. Physical Layout of the RFID Test Setup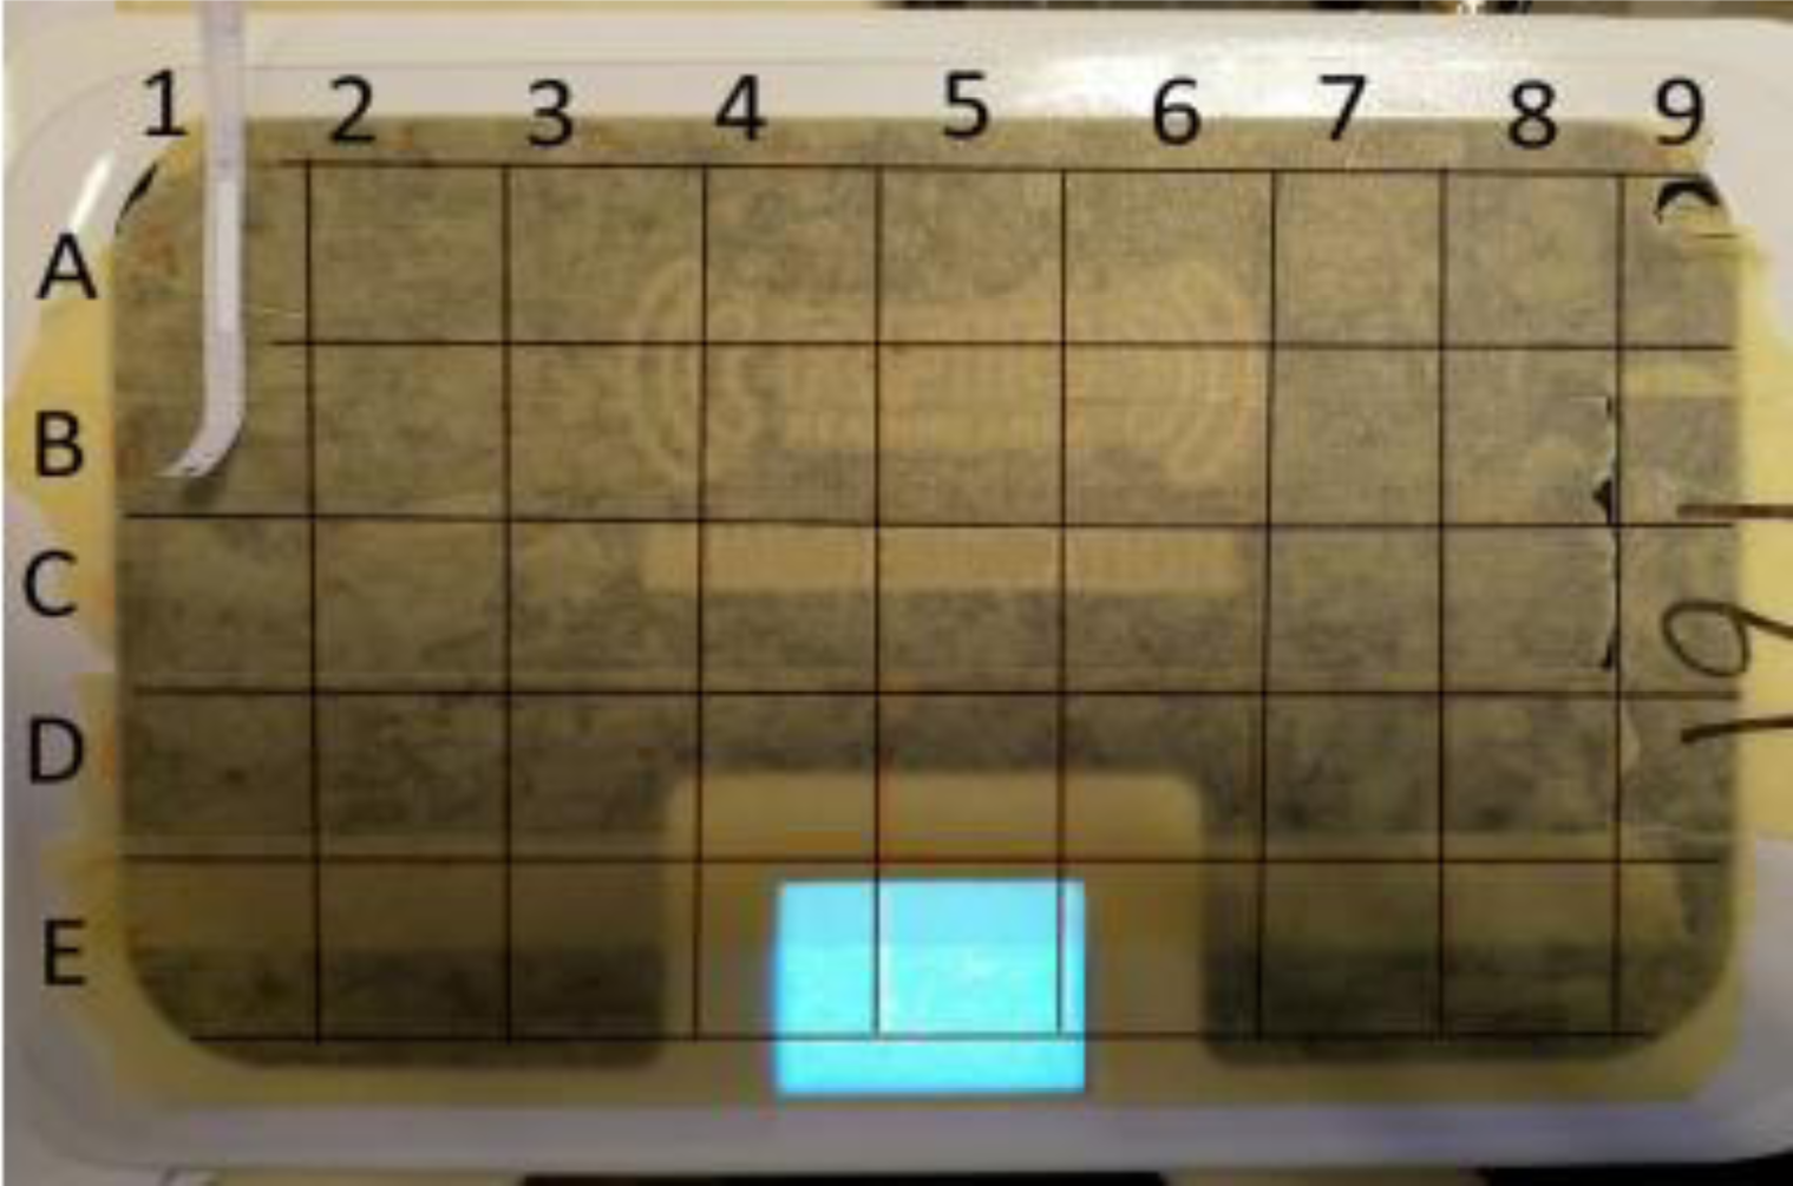
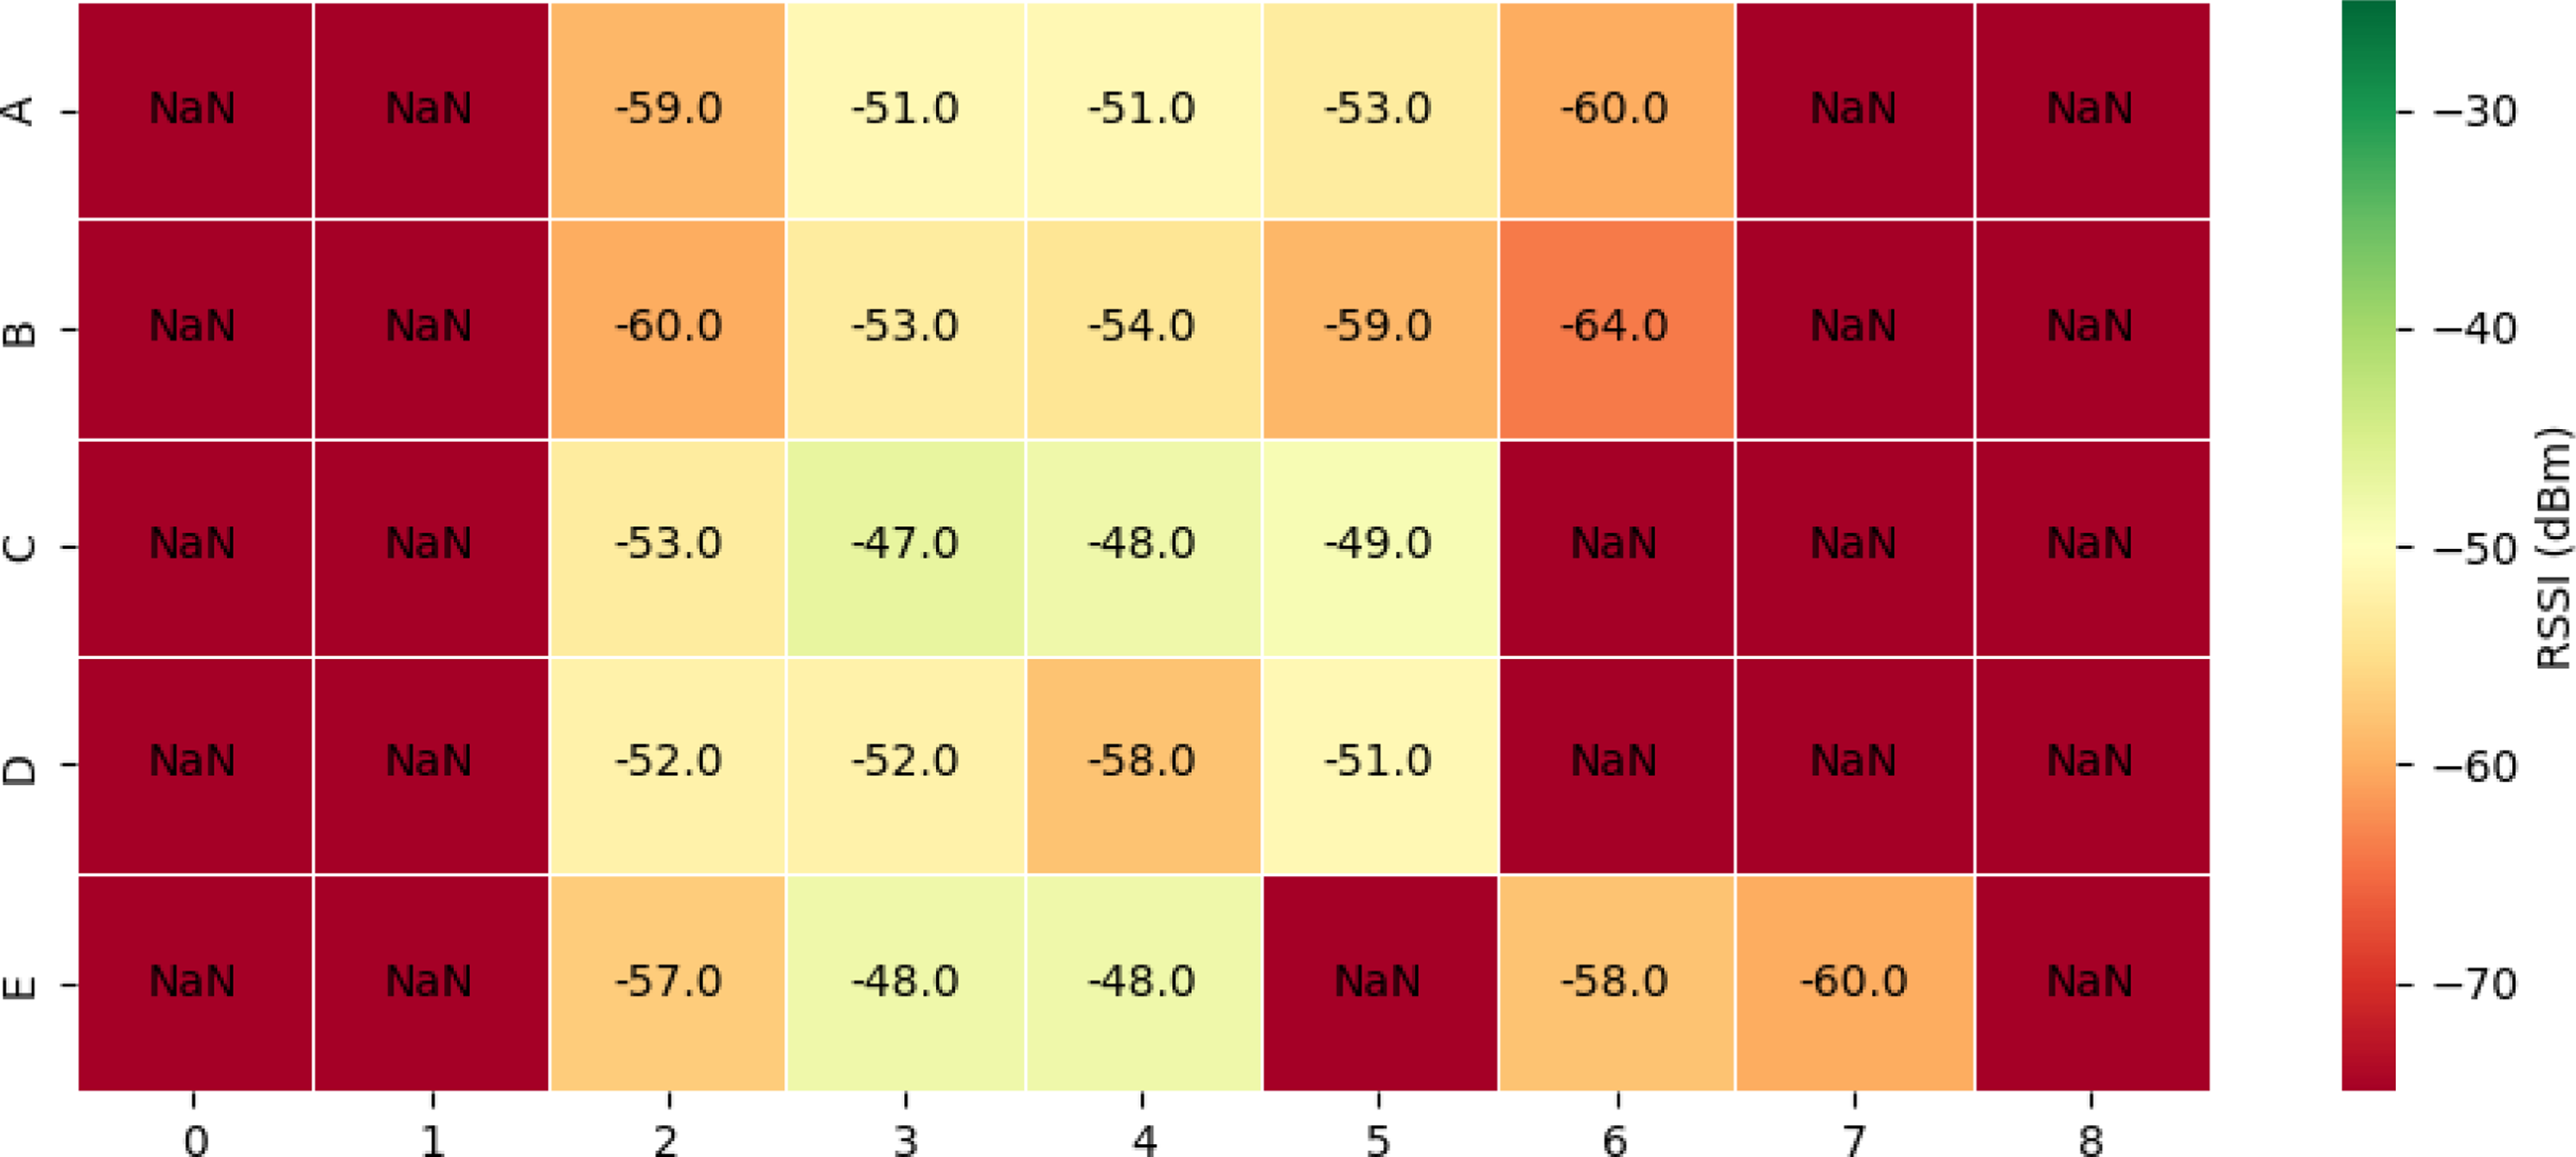
Based on the collected data, it was observed that the signal strength from intact tags was strongly received by the system, whereas tags with stitching errors or physical damage exhibited significantly weaker signal levels. As illustrated in the corresponding heatmaps, regions containing the intact tag, especially near the center of the device, produced higher RSSI values, ranging between −22 dBm and −30 dBm (see Figure 10). In contrast, for the damaged tag, no readings were obtained from the corners (recorded as NaN), and the central regions showed notably lower RSSI values in the range of −47 dBm to −50 dBm (Figure 11). These results demonstrate that the developed system can deliver reliable and repeatable outcomes for tag quality control. RSSI Heatmap of Intact Tags Read at Test Points RSSI Heatmap of Defective Tags Read at Test Points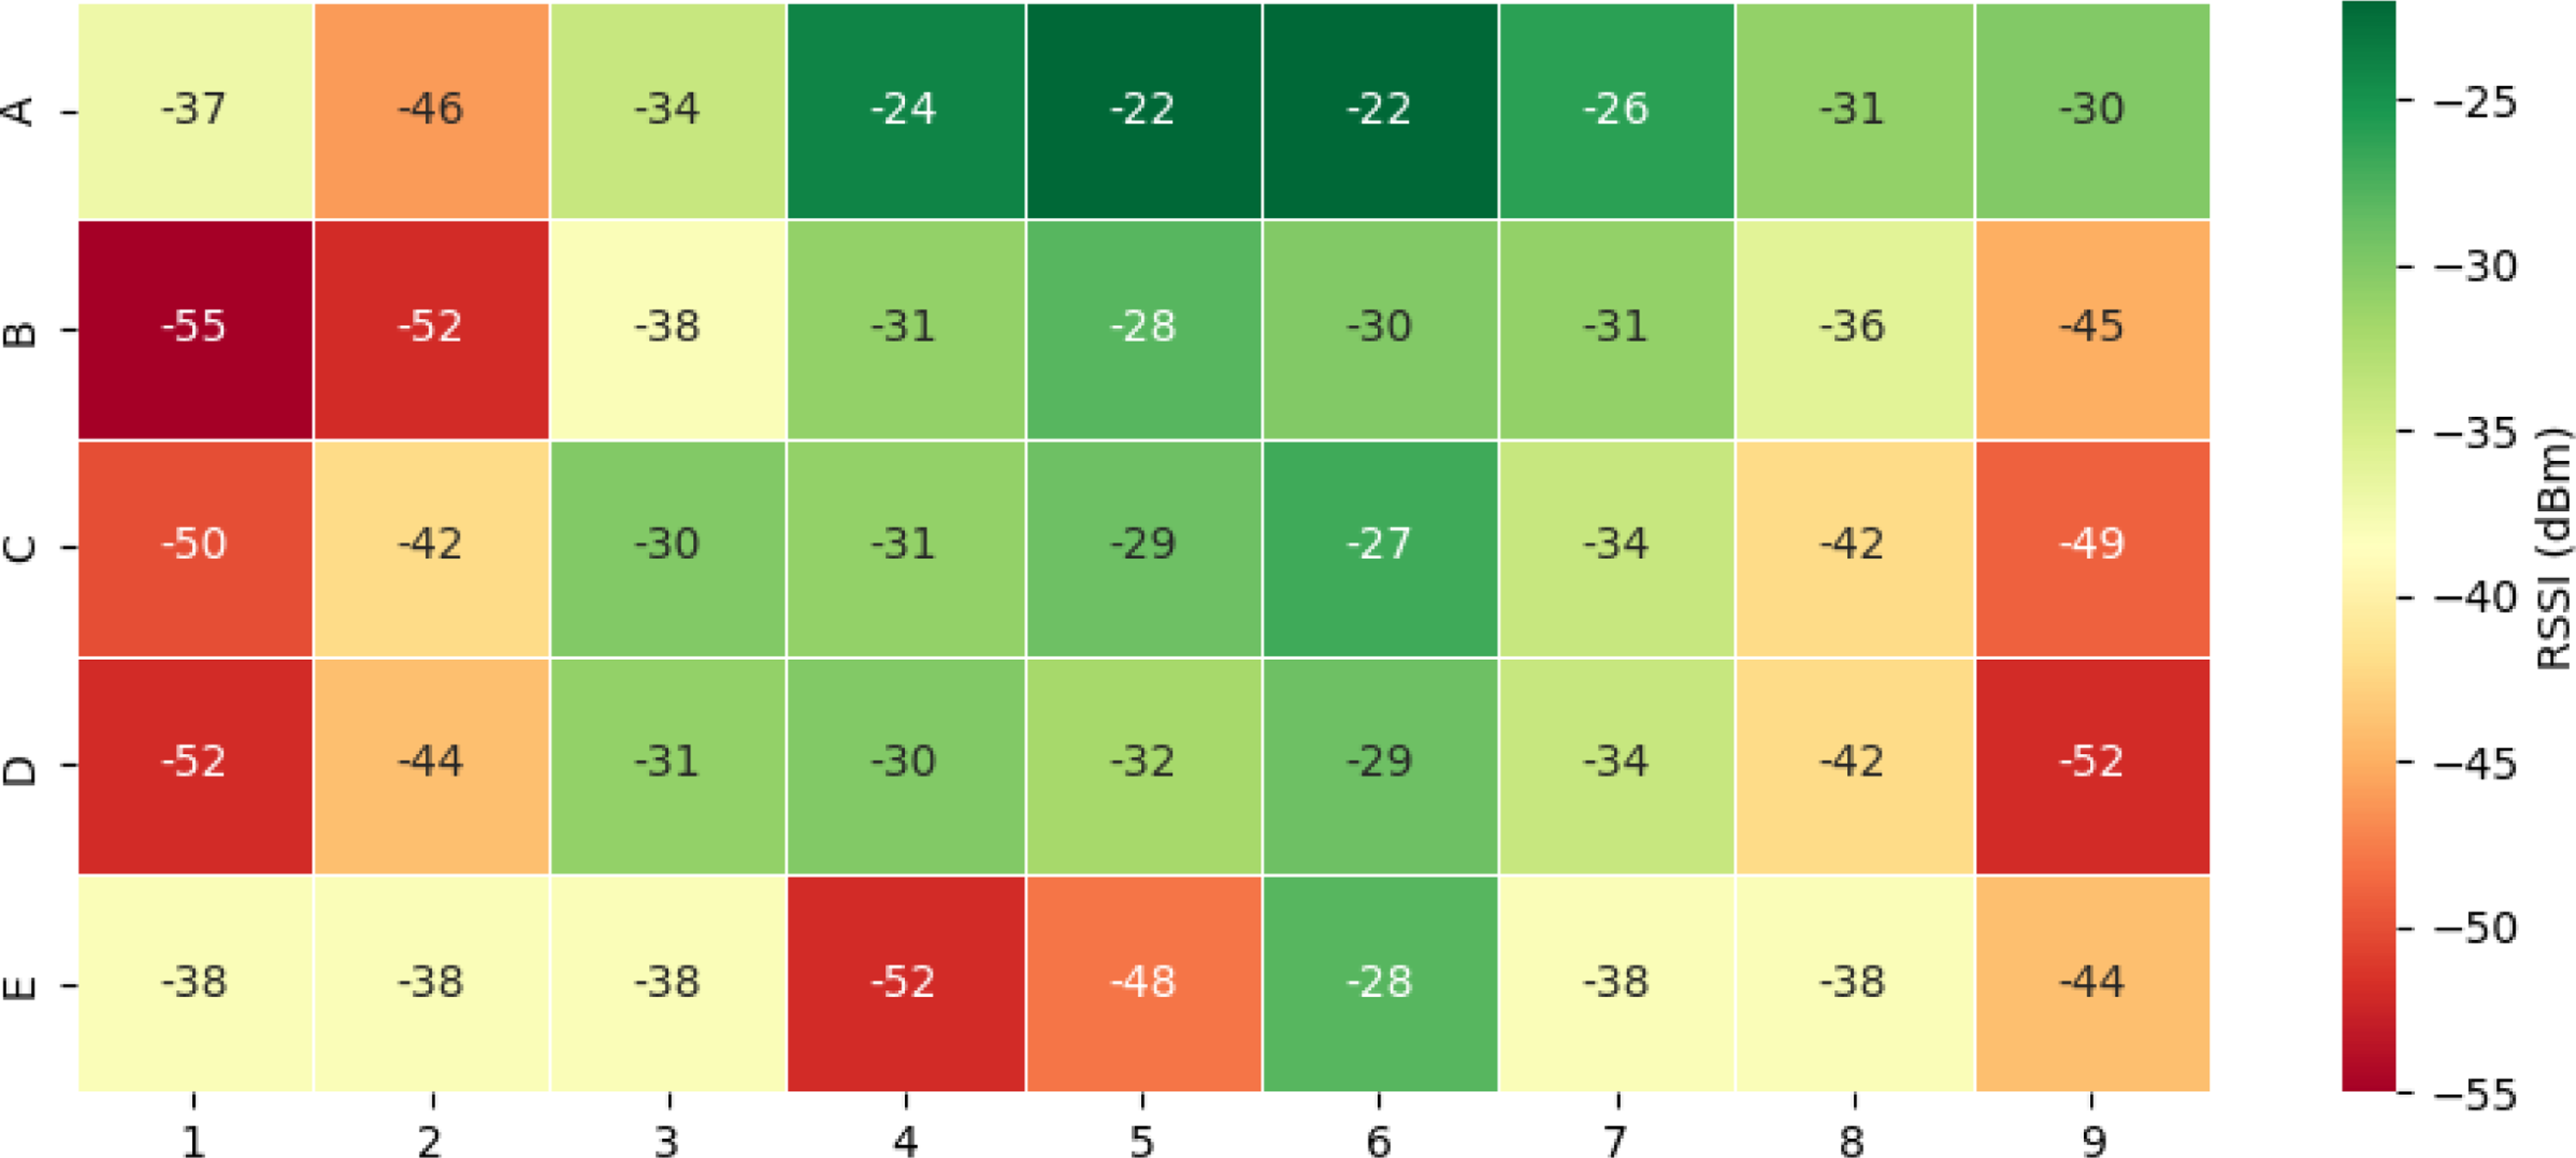
This observation demonstrates, in practice, the potential applicability of RSSI-based software filters for detecting defective or improperly stitched tags. However, when interpreting these test results, it is important to consider the system’s physical limitations and operator-induced variability. Due to the antenna being positioned at the center of the device, the electromagnetic field distribution tends to concentrate around the central regions, which naturally leads to lower RSSI values in the corner areas. Additionally, the way in which the operator presents the tag can significantly influence signal strength. Factors such as the angle of the tag relative to the antenna, its orientation, surface contact, or whether the tag is held too close or too far from the device can all contribute to signal attenuation. Such human-induced variations may result in low RSSI values even from intact tags, particularly in corner regions. Therefore, when interpreting RSSI data, not only the absolute values but also test conditions, antenna positioning, and operator behavior should be considered. If possible, a normalization and classification algorithm should be implemented on the software side to compensate for these variables and improve reliability.
Server Response Time Based on Database Size
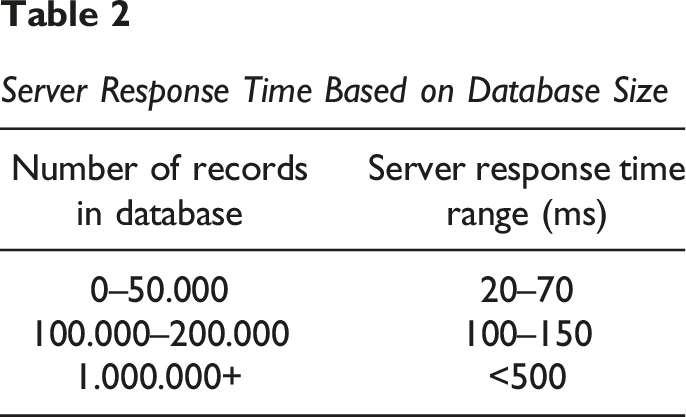
Overall, the MQTT-based architecture demonstrated significantly faster response times compared to traditional HTTP-based systems. This performance advantage is primarily attributed to the system operating over a local network and utilizing a low-latency messaging protocol. To maintain consistent performance, it is recommended that the database be periodically cleaned or archived. For example, backing up and removing records on a yearly basis or after each shipment cycle can help ensure that query execution times remain low.
These results quantitatively validate that the system possesses the real-time processing capability required for high-speed production lines, where multiple tags can be processed per second, by delivering response times of under 70 milliseconds even with data loads of up to 50,000 records, a capacity that comfortably accommodates the entire tag volume for a typical production-to-shipment cycle.
In addition to the controlled test setup, the effectiveness of the proposed RFID-based production tracking system in detecting faulty tags under real-world conditions was also evaluated. The tests were conducted in an active textile and garment manufacturing facility during ongoing production. Devices with RFID readers, each operating independently, were installed in three different zones within the factory (see Figure 12). Each device classified the tags read during production over a period of three consecutive days, and the data was transmitted in real time to the central MQTT server. RFID Reader Deployed in the Field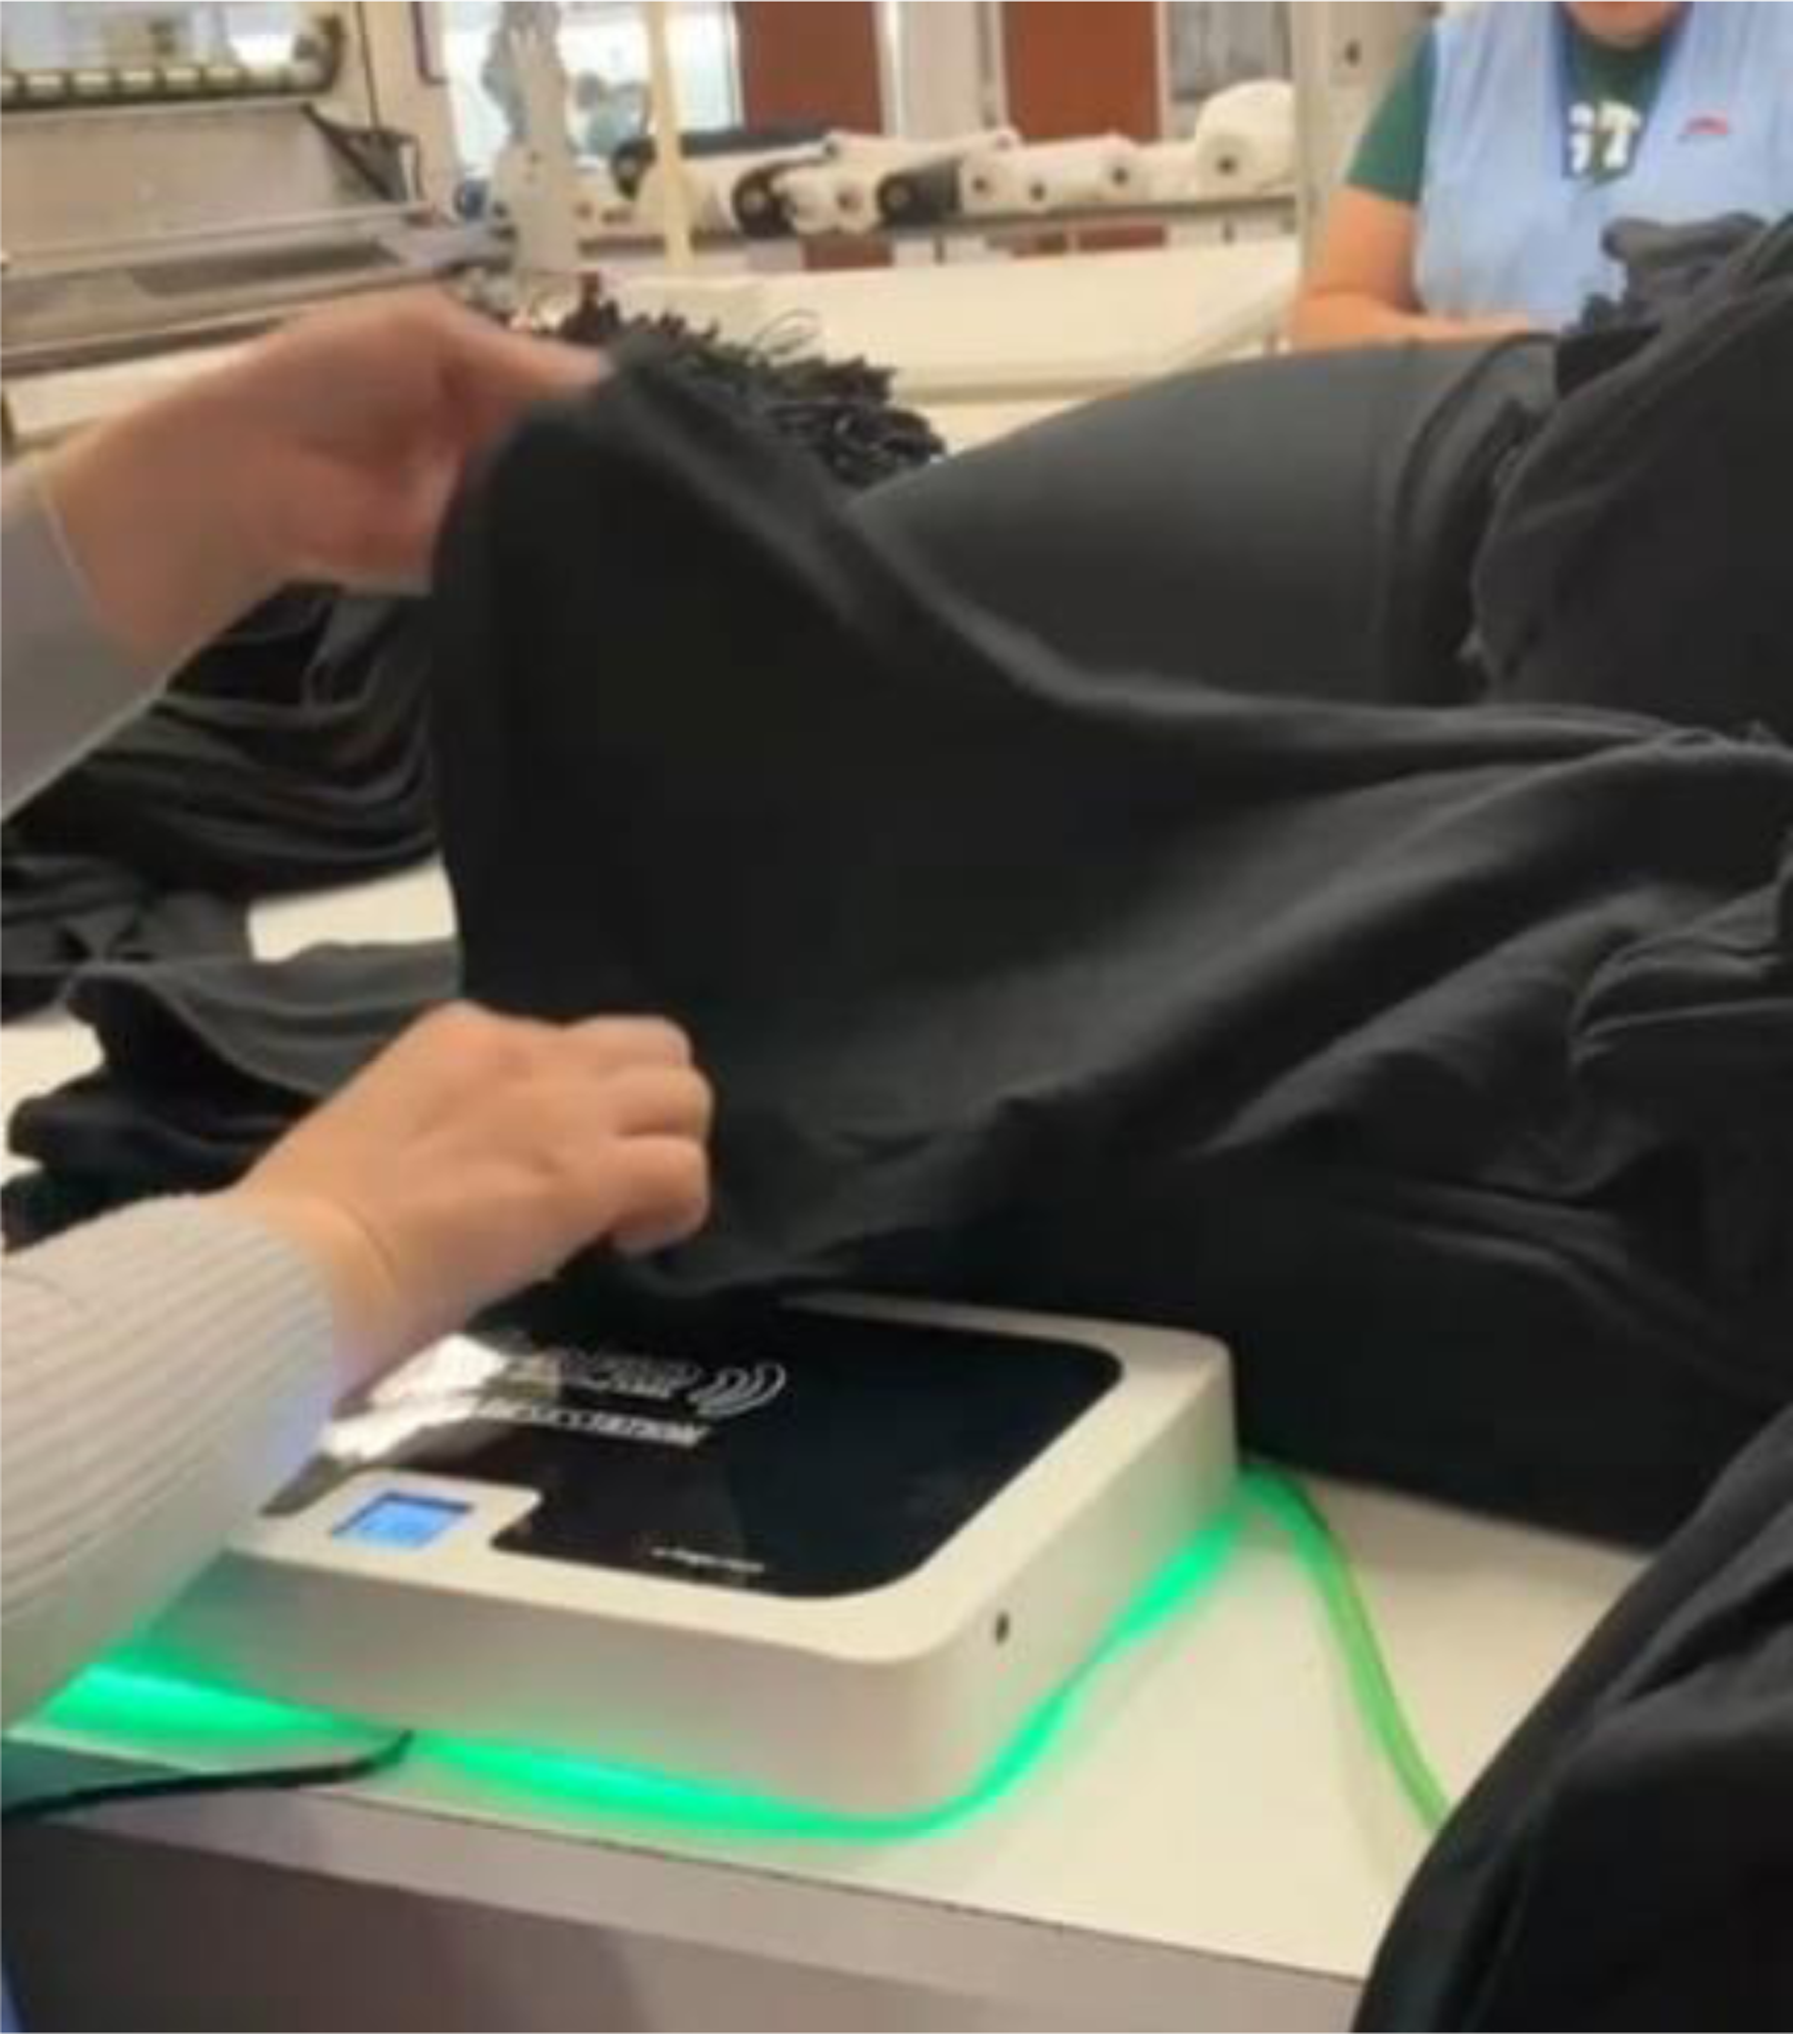
Tag Reading and Error Detection Results of Devices on Different Production Lines
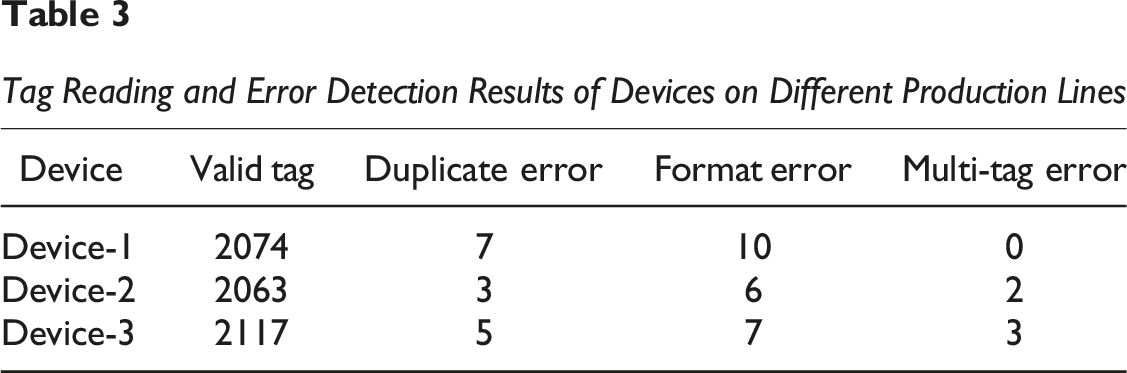
When evaluated on a per-product basis, the error rate in the factory’s 3-day production was calculated to be 0.68% (Eq (5)). While this margin of error appears quite low and acceptable at first glance, when assessed on a per-box basis, assuming 50 products per box, the probability of at least one defective item being present in a box is approximately 29% based on the compound probability method (Eq (6)). According to this data, around 3 out of every 10 shipped boxes are expected to contain a defective item.

Based on this, if labeling errors go undetected, the inclusion of defective products in shipment boxes becomes inevitable. This leads either to discrepancies in inventory records or the need to reopen and manually inspect boxes before customer dispatch. In both cases, the supply chain suffers from significant errors and time losses, increased labor costs, and delays in product shipments to retail stores.
The conducted test is crucial in demonstrating the system’s ability to detect such errors in real time and alert the operator accordingly. As a result, defective tags are identified during the production stage, and faulty products are removed from the system before they reach the shipment phase. This prevents inventory errors caused by labeling issues, ensures accurate product-tag matching, and ultimately enhances overall production reliability.
Results and Discussion
With the implementation of the developed system, significant outcomes are expected at both the micro scale (production line and device level) and the macro scale (corporate processes and sectoral impacts). These outcomes can be evaluated under three main categories: technical performance, operational efficiency, and contribution to sectoral sustainability.
Technical Performance and Traceability Efficiency
The developed system enables real-time tracking of RFID-tagged products throughout the production process, allowing immediate detection of labeling errors. Field tests have demonstrated the system’s high accuracy in identifying faulty tags, significantly reducing the occurrence of duplicate tag usage, and successfully detecting multi-tagged products before shipment. Moreover, all scanned tags during the shipment process are recorded in a locally hosted database, making the data readily accessible across the system. This architecture eliminates potential delays caused by network issues or remote server connections.
Each product passes through multiple control points along the production line, where the presence, uniqueness, and readability of its tag are automatically verified. This approach not only reduces the need for post-production quality checks but also provides highly accurate data for retrospective audits and inspections.
Operational Contributions and Efficiency Improvements
Traditionally, tag verification processes carried out manually are prone to human error and time loss, which reduces operational efficiency. In this study, the quality control process has been automated, minimizing the margin of error caused by human factors. When the system detects duplicate, excessive, or unreadable tags, it provides a visual warning on the screen, prompting the operator to replace the tag or, if necessary, re-encode it using auxiliary devices.
Thanks to its local network-based architecture, the system operates seamlessly and at high speed without the need for an internet connection. Furthermore, by eliminating time-consuming tasks such as visual inspection and manual data entry, a noticeable improvement in staff productivity on the production line has been achieved.
Industry-Level Impact and Corporate Benefits
Labeling issues in the production and shipment stages of the textile industry often led to customer dissatisfaction, logistical delays, and increased operational costs. The system developed in this study provides substantial benefits to the industry from multiple perspectives. Primarily, by detecting and eliminating defective products before shipment, it reduces the corporate error rate, thereby minimizing product returns and mitigating the risk of negative brand perception.
The critical importance of the multi-layered quality control mechanism developed in this study is thus underscored. Allowing such defective tags, whether due to format errors, duplication, or physical damage, to pass production poses a serious risk of traceability problems not only during the shipment and logistics phases but also at the retail level. This leads to critical issues in RFID-based inventory management (product finding), point-of-sale (POS) checkout machines, and the functionality of anti-theft systems.
The system architecture presented in this study has been proven to be scalable for long-term industrial operations, with the capacity to manage millions of records as detailed in the database analysis in Section 2.4.2. However, the system’s practical effectiveness in the field also depends on practical considerations, such as the sensitivity of RSSI-based quality control to operator-induced variability, as discussed in the experimental results in Section 3. This sensitivity is inherent in RSSI-based quality control methods and highlights the importance of standardized procedures and operator awareness during the system’s field integration.
Footnotes
Acknowledgments
The authors would like to thank Takipsan RFID for their physical contributions to this project, including the provision of hardware and infrastructure support.
Funding
The authors received no financial support for the research, authorship, and/or publication of this article.
Declaration of Conflicting Interests
The authors declared no potential conflicts of interest with respect to the research, authorship, and/or publication of this article.