
Abstract
Over the past years, airport regulation has been generating a lot of interest in Europe, and despite the passing of Airport Charges Directive in 2009, there is ongoing debate on the need for introducing tighter airport regulations. The aim of the paper is twofold. First, acknowledging that regulation is usually applied in markets where competition is weak or absent, we evaluate the ex-ante need for price regulation in the air transport industry. By focusing on the Italian airport industry, our analysis provides evidence of a high level of competitive pressure faced by airports (both inside and outside the industry), suggesting that tighter price regulation may not be the optimal solution. Second, assuming that stricter regulation of the airport industry is necessary, we empirically investigate the applicability of yardstick regulation to the Italian airport system, outlining critical challenges and issues that may arise when applying benchmarking techniques in setting the optimum level of efficiency at regulated airports. According to current literature, applicability of empirical benchmarking techniques requires some basic research requirements to be met, such as high-quality data, a homogeneous production function, and a sufficient number of comparable observations. We find that both heterogeneity and the relatively small number of comparable airports, along with the complexity of gathering proper data, may compromise the applicability of a regulation scheme based on yardstick principles at the national level.
Introduction
Over the past decades, regulation of airport industry has become a priority area of governance, close monitoring, and tighter regulation in Europe. In 2009, the EU Council and European Parliament adopted the Airport Charges Directive (ACD), seeking to establish a common framework for setting airport charges in a more transparent manner, in order to ensure implementation of principles such as cost-related charges (i.e., airlines only pay for the facilities they use), transparency, and non-discrimination between airport users.
Despite the approval of ACD, the debate on the need for tighter airport regulation is still ongoing and the issue thus remains unresolved. In particular, there are two main issues regarding this debate. First is the assessment of the need for regulation of airport industry per se. The second is the identification of a regulation scheme that can stimulate both allocative and productive efficiency.
Because of larger investments and cost structure peculiarities (e.g., lumpy investment and high sunk costs), airports, together with other network industries such as energy, water, and telecommunications, have been traditionally considered as textbook examples of natural monopoly (Baumol, 1977). Consequently, regulation is acknowledged to be necessary to limit airports’ market power and protect consumers from excessive prices (Marques & Brochado, 2008).
Regulators have addressed the need for regulation using different regulatory approaches, from cost-based regulation (e.g., rate of return) to price-cap regulation (e.g., RIP-X). Nowadays, yardstick regulation, also called regulatory benchmarking, is attracting growing interest from national regulatory authorities. In a market scenario where competition is either weak or absent (e.g., natural monopoly conditions), this regulatory approach promises to provide the best incentives for allocative and productive efficiency by artificially introducing an indirect competition among companies. The study on the possibility of applying yardstick regulation at airports poses two main questions: Does the airport sector require a yardstick regulatory approach, and, more generally, is price regulation necessary at all for the airport industry? Are the competitive forces at play, usually stimulating firms’ efficiency, not sufficient? Even if we assume there is a need for price regulation, is it possible to apply yardstick regulation to airport industry? Are the basic assumptions fulfilled? Do we have a sufficient number of firms with comparable sizes of revenue and scale of operations to guarantee the accuracy of results?
To answer these two questions, we first analyze the ex-ante need for price regulation in the airport industry by mapping out the different forms of competition that characterize the airport industry and quantifying them in the Italian context. Second, with a view that price regulation in the airport industry is necessary, we empirically investigate the practical applicability of yardstick regulation to the Italian airport system. We carry out on an in-depth, systematic exploration of contingent factors and heterogeneity to verify whether the basic assumptions of yardstick approach are met, such as sufficient number of observations and a homogeneous production function across items.
Going further, the paper is structured as follows: Section 2 discusses in some depth whether the airport industry is indeed an example of natural monopoly and hence needs regulatory intervention, by mapping out the different competitive pressures that airports are subjected to, and by evaluating the intensity of single competitive forces’ influence over Italian airports. Section 3 provides a short theoretical description of the yardstick regulation and its main limitations pointed out in literature. Then, considering the price regulation as necessary, we analyze in Section 4 the various industry-specific sources of heterogeneity that could undermine the applicability of yardstick regulation in the Italian airport system. Finally, Section 5 provides concluding remarks about our work, outlining avenues that scholars could explore in future research.
Competition in the airport industry
Regulation policies are usually applied in contexts where competition is either weak or absent (e.g., natural monopoly conditions) to correct market inefficiencies by artificially stimulating firms’ allocative and productive efficiency. However, regulatory intervention results in a second-best solution in a scenario where the “natural” presence of competition between firms already exists.
Because of the similarity of its characteristics with other network industries such as energy, water, and telecommunications, airport industry has traditionally been considered a textbook example of natural monopoly (Baumol, 1977). Accordingly, price regulation is acknowledged to be necessary to limit the airport’s market power and promote an efficient market outcome.
However, application of rigid price control mechanisms (for instance, regulation policies) in an environment that is to some degree characterized by competition could become actually counterproductive and discourage competition instead of incentivizing it (Littlechild, 2018).
Despite the natural monopoly of airport business, various competitive forces may act at different levels with different intensities between airports (OXERA, 2017; Thelle & la Cour Sonne, 2018). Competitive forces are at play not only between airports situated in closer proximity to each other (namely local competition) but also between airports situated far away from one another, leading to international competition (e.g., competition between hubs and competition for air cargo traffic). Different airports, even if located in the same region/nation, might face different competitive factors, which affect them unevenly and in varying degrees of intensity.
Thus, in this section, we evaluate the degree of existing competition among airports by proposing a classification of the main dimensions of airport transport business based on which airports compete, with the aim of assessing the need for the effective application of regulatory policies in the airport industry.
Overall, competition in airport transport business has been divided into the following categories: (i) competition for departing passengers, (ii) competition for airline services, (iii) competition for connecting traffic, (iv) competition for cargo traffic, and (v) intermodal competition.
Figure 1 classifies the different forms of competition based on the type of competitors and geographical scale of competition.

Classifies the different forms of competition based on the type of competitors and geographical scale of competition.
In the subsections that follow, we briefly discuss each of the identified forms of competition separately, assessing particularly their intensity in the Italian airport industry. We focus on a total of 33 airports (Figure 2). Almost half of these (about 40%) are located in Northern Italy, with the rest distributed between the Islands (24%), Central Italy (18%), and Southern Italy (18%).
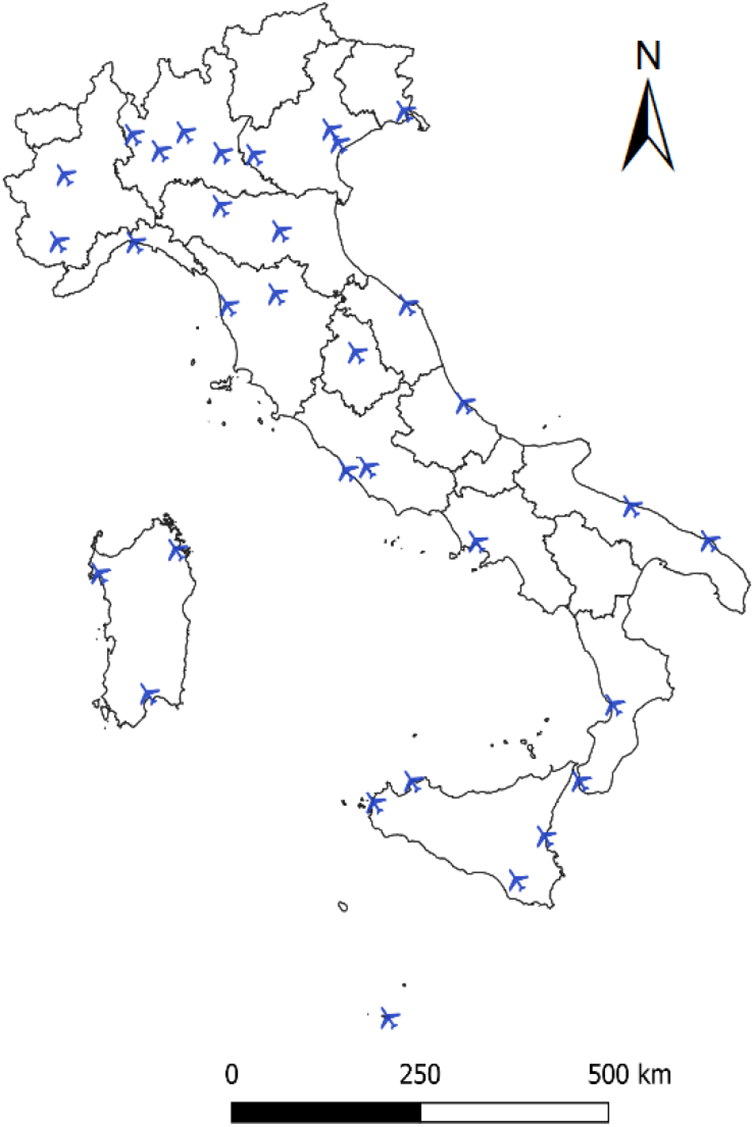
Italian airports considered. Source: Author’s own elaboration on assaeroporti data.
The statistical data presented in the next paragraphs were retrieved from Assaeroporti 1 and OAG. 2 Where not explicitly indicated, statistics refer to data collected specifically for the year 2017.
Competition for departing passengers
The first dimension analyzed is the competition for departing passengers. This type of competition takes place between airports whose catchment areas partially overlap; therefore, there is competition for attracting passengers. The more the “local” airports are considered substitutes, the fiercer the competition. Accordingly, the proxies used for evaluating the intensity of competition under this category focus on measuring the degree of substitutability between nearby airports. Some of the performance measurement criteria used in this area include the following: distance between airports, difference in estimated passenger costs (and time) to reach each airport, degree of overlap between catchment areas, and overlap in terms of destinations offered by airlines at each airport.
For the Italian airport system, we first consider all airports with a traffic of more than 200,000 passengers per year, which is large enough for such airports to be considered as significant competitors. Excluding airports under the same ownership, on average 18% of the population in an airport catchment area has at least one alternative airport that they can reach within an hour’s travel by car (Table 1). The Milan-Bergamo (BGY), Brescia (VBS), and Milan-Linate (LIN) airports register the greatest values in terms of overlapped catchment area (considering the 1-hour distance) with other relevant airports, respectively at 92%, 82%, and 80% (see Table 1 for more info).
Competition for departing passengers: Italian airports’ contended catchment areas and overlap in terms of destinations offered. Source: Author’s own elaboration on OAG and Google Maps data.
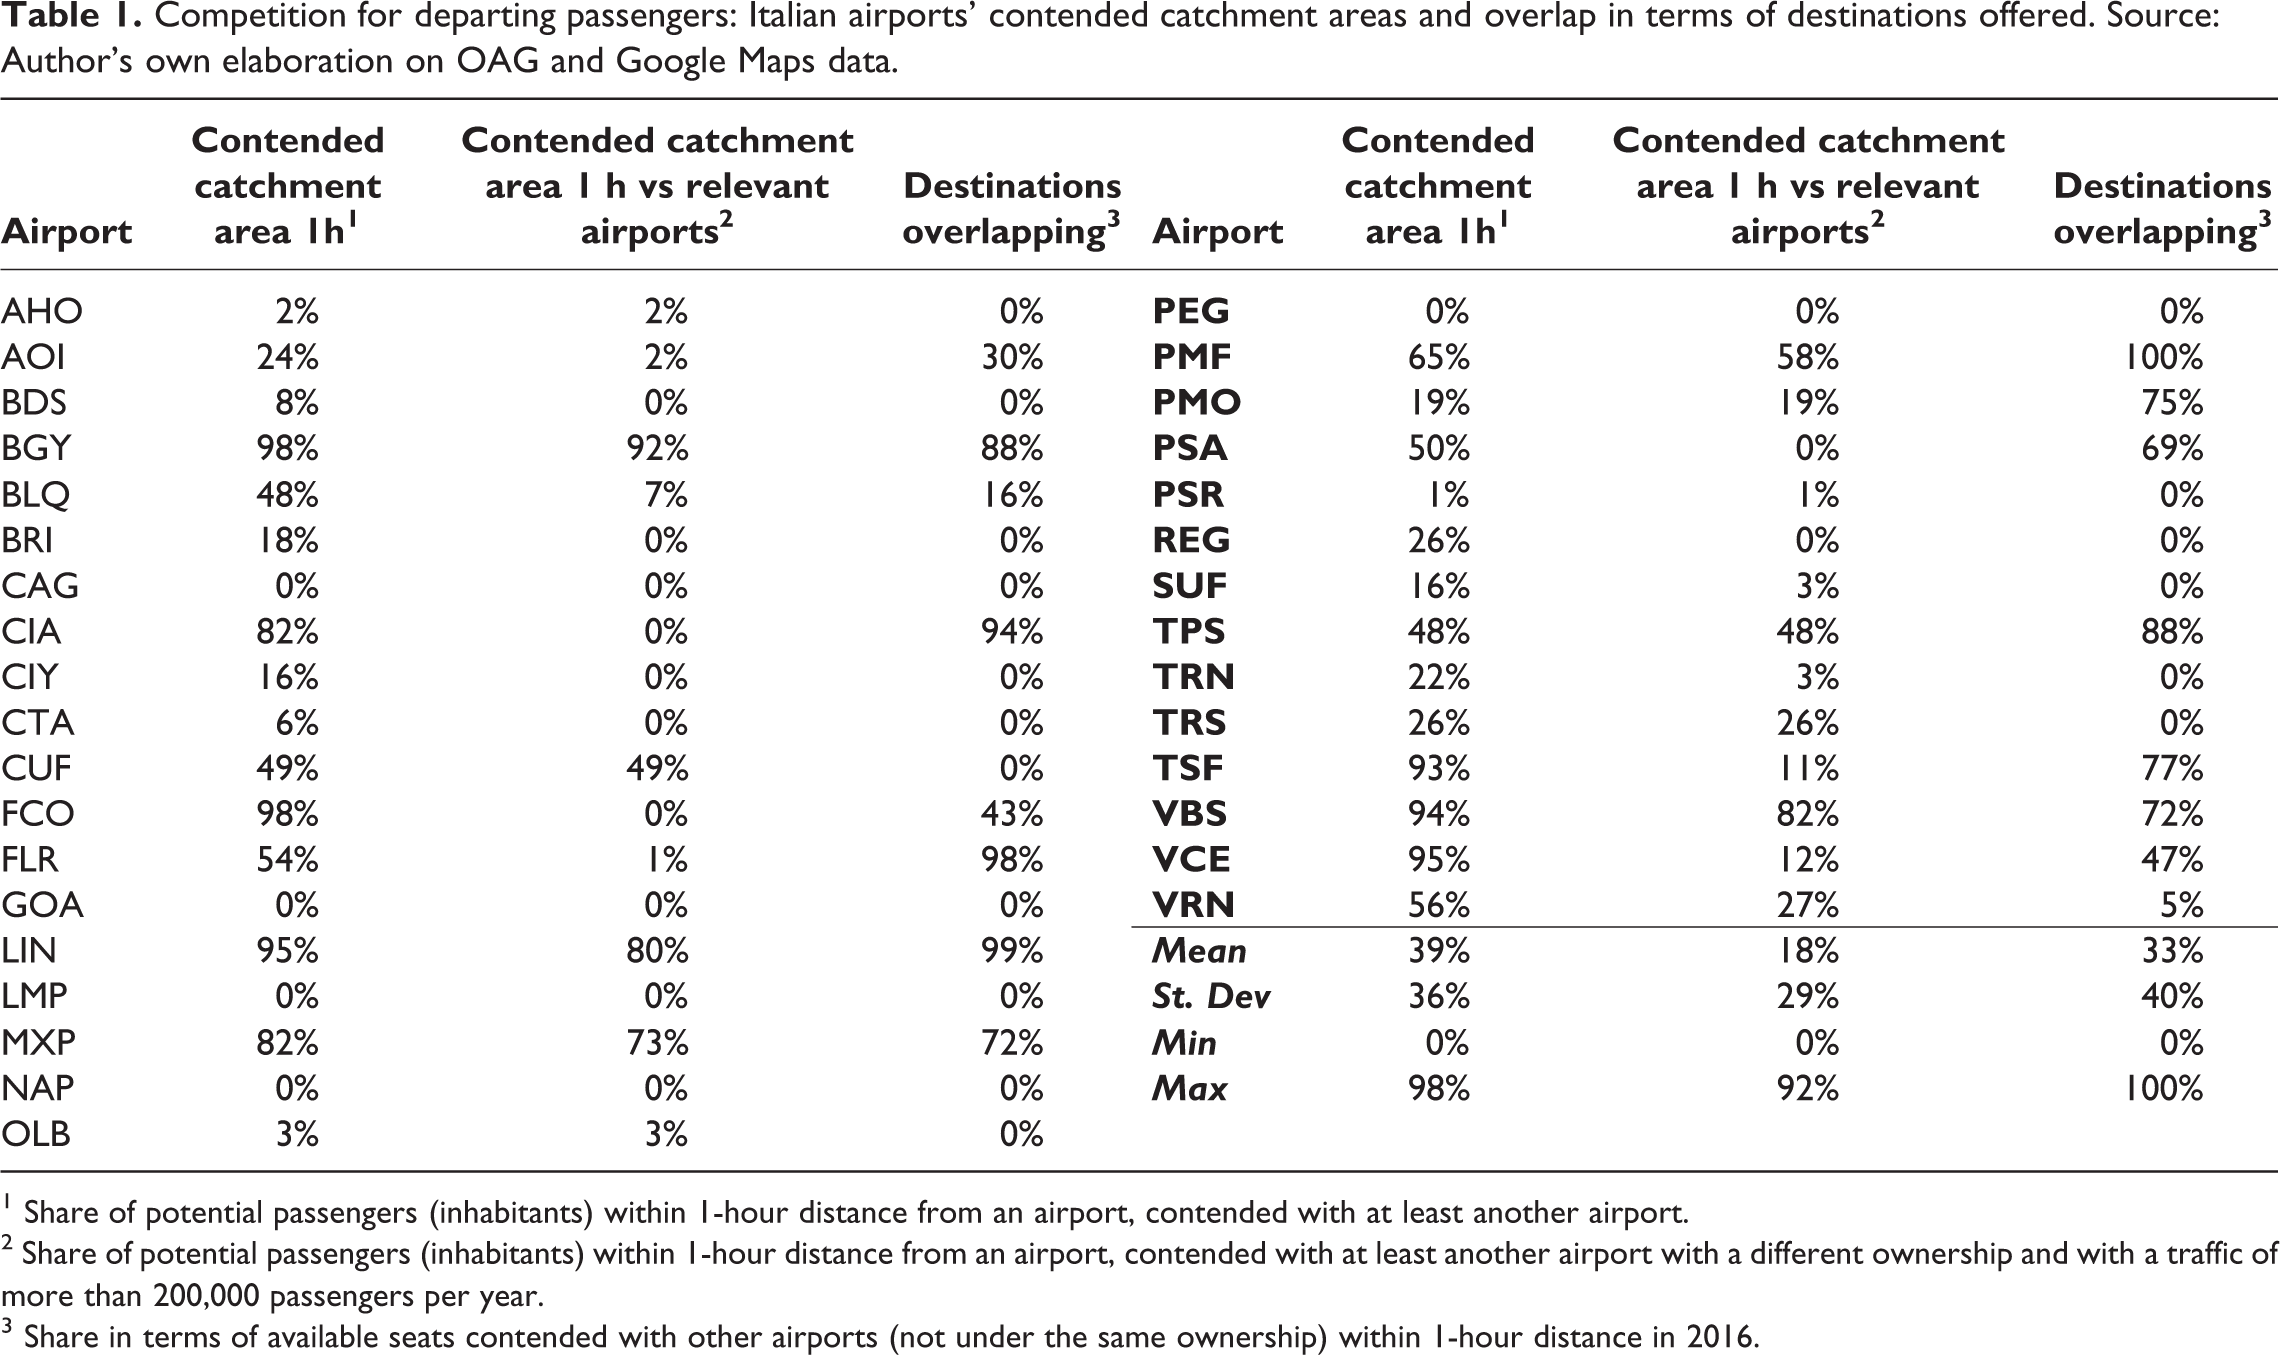
1 Share of potential passengers (inhabitants) within 1-hour distance from an airport, contended with at least another airport.
2 Share of potential passengers (inhabitants) within 1-hour distance from an airport, contended with at least another airport with a different ownership and with a traffic of more than 200,000 passengers per year.
3 Share in terms of available seats contended with other airports (not under the same ownership) within 1-hour distance in 2016.
When considering also the airports under the same ownership and with less than 200,000 passengers per year, the share of people able to reach an alternative airport within 1-hour is equal to zero only in 4 out of 33 cases (Cagliari—CAG, Genoa—GOA, Lampedusa—LMP, Naples—NAP, and Perugia—PEG).
Figure 3 represents the level of catchment areas’ overlapping related to airports serving the city of Milan—Bergamo (BGY), Linate (LIN), and Malpensa (MXP). Considering the overlap between nearby airports (within 1-hour distance) in terms of offered destinations, Italian airports with the highest percentage of overlapping include PMF (100%), LIN (93%), BGY (88%), and TPS (88%). By contrast, there is no overlap in supply (i.e., offered destinations) for 17 out of 33 Italian airports.
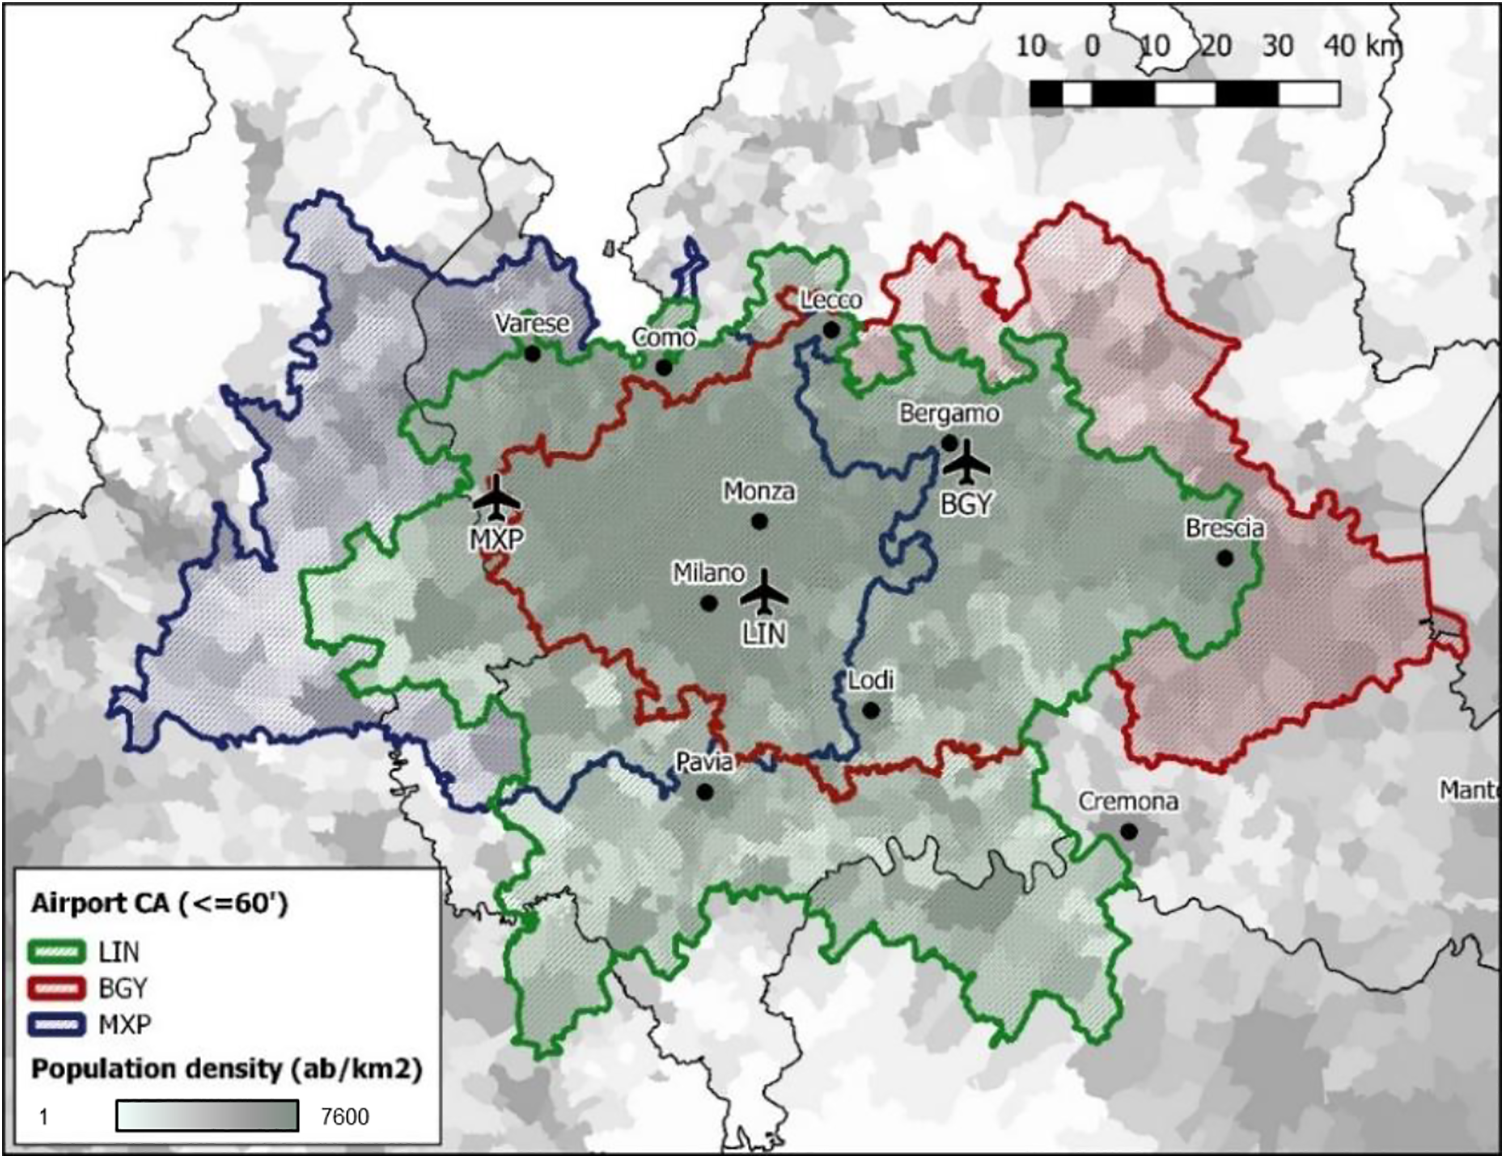
Overlap between catchment areas of the three airports serving the city of Milan. Source: Author’s own elaboration on Google Maps data.
On average, Italian airports register 18% of overlapping catchment area with relevant airports and 33% in terms of offered destinations (for airports located within an hour’s drive by car), respectively (Table 1). Those data depict a strong competitive scenario in which airports fight with each other to attract departing passengers.
Competition for airline services
Airports’ attractiveness does not depend only upon the airport itself (e.g., its location). Rather, it is also heavily influenced by airlines operating at the airport. Service frequency, reachable destinations, and services provided, as well as the characteristics of the specific airlines (e.g., low-cost carriers vs. full-service carriers), all greatly influence the degree of attractiveness of an airport. This may lead airport managers to compete with one another to attract airlines. Accordingly, the intensity of competition for airline services between airports is measured with the market share of the first carrier, role of airport in carrier’s network, breakdown between point-to-point and network carriers, instability of routes, low-cost carriers (LCCs) base abandonment 3 likelihood, and diverting demand/footloose passengers. 4 Table 2 presents details on some of these measures computed for Italian airports.
Competition for airline services: breakdown between point-to-point and network carriers, market share of the first carrier, and role of airport in first carrier’s network. Source: Author’s own elaboration on OAG and Assaeroporti data.
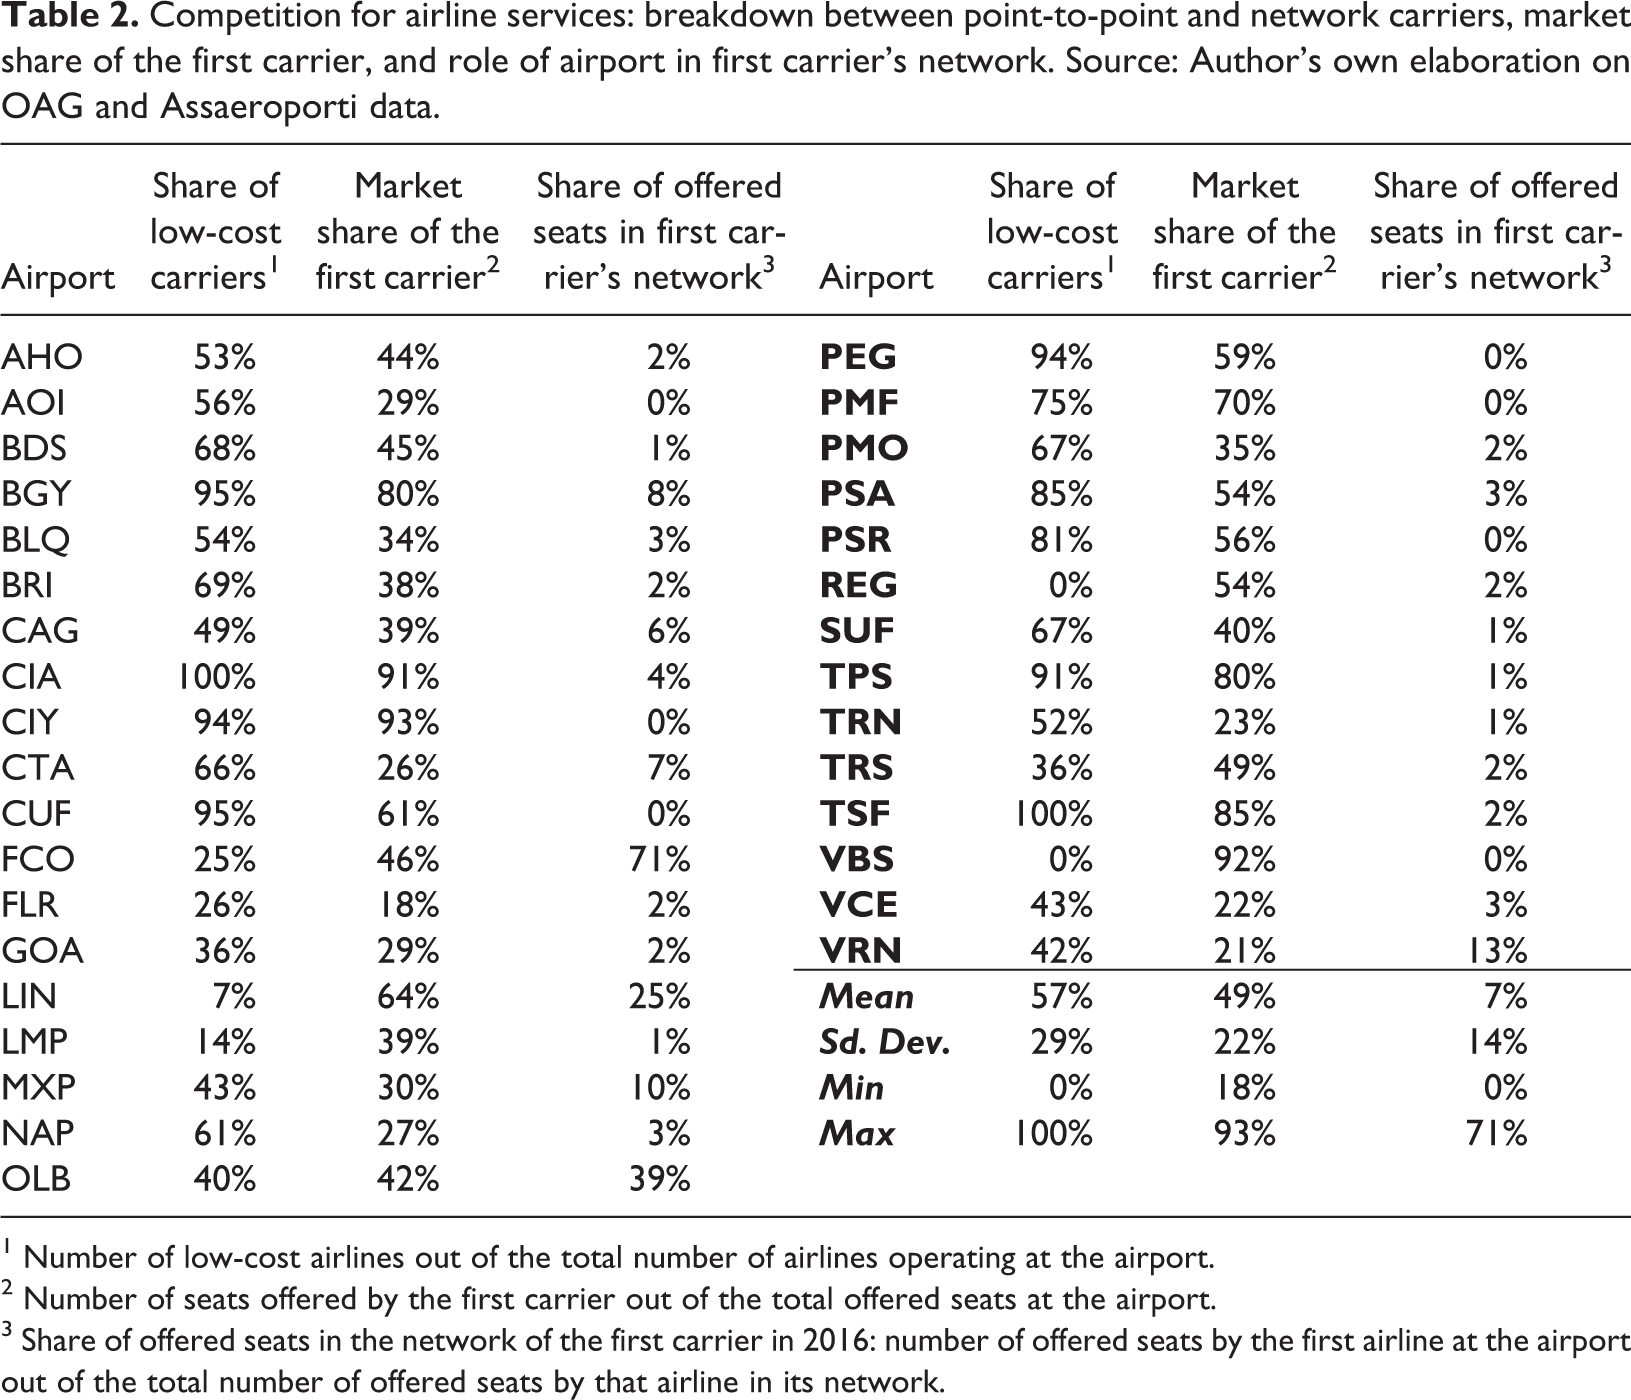
1 Number of low-cost airlines out of the total number of airlines operating at the airport.
2 Number of seats offered by the first carrier out of the total offered seats at the airport.
3 Share of offered seats in the network of the first carrier in 2016: number of offered seats by the first airline at the airport out of the total number of offered seats by that airline in its network.
Analyzing the Italian context, we found that, in 2017, 25 different airlines operated in each airport on average, of which 57% were low-cost carriers (Table 2). The market share of the first carrier, in terms of offered seats, is on average equal to 49%. The minimum first-carrier market share (18%) is ascribed to Florence airport (FLR) where 22 airlines operate. Furthermore, no airport presents a situation of monopsony (only one airline covers all the routes offered). The share of seats offered by the first airline at an airport, compared to the total amount offered by the company in its network, quantifies the relative importance of the airport for airlines. In Italy, this measure is on average equal to 7%. The Rome-Fiumicino airport (FCO) covers 71% of the offered seats in Alitalia’s network, registering the highest value among Italian airports (Table 2).
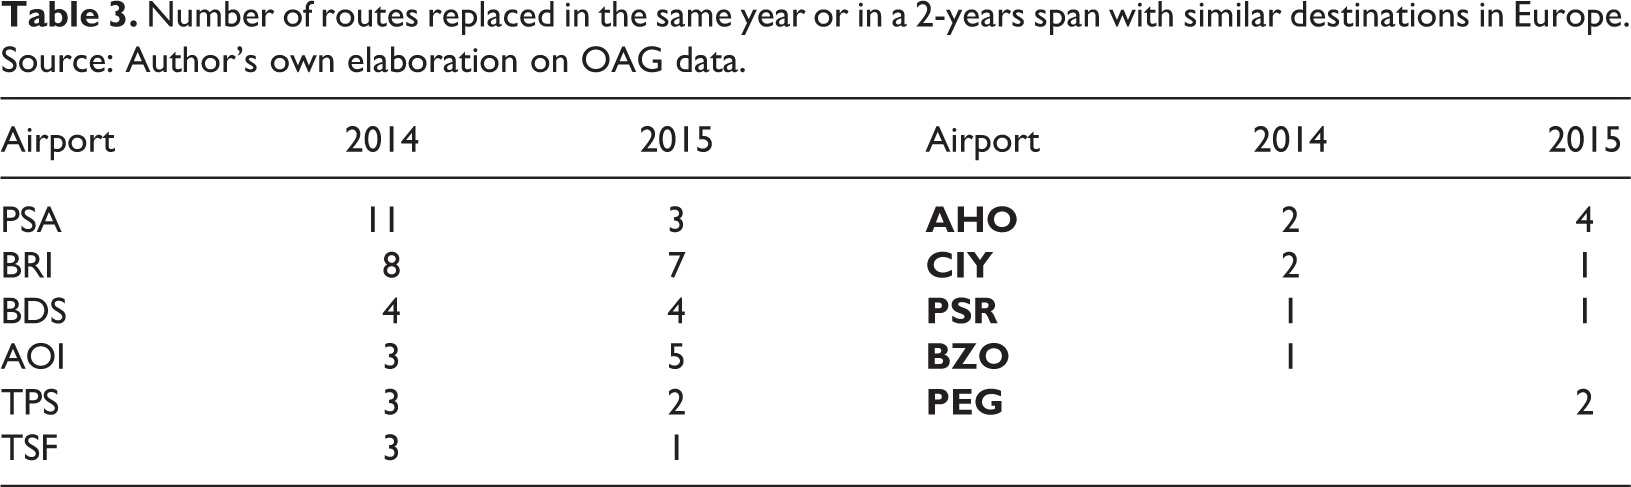
Besides, some Italian airports, including Pisa (PSA), Bari (BRI), Brindisi (BDS), Ancona (AOI), Trapani (TPS), Treviso (TSF), and Alghero (AHO), because of their marked tourist vocation, are subject to diverging demand from airlines; this is because airlines tend to make variations in the pool of popular leisure destinations by choosing similar leisure markets. Table 3 reports the number of routes replaced for the most significant cases (in a time span of 2 years) with similar destinations in Europe in 2014 and 2015.
Number of routes replaced in the same year or in a 2-years span with similar destinations in Europe. Source: Author’s own elaboration on OAG data.
In addition, the major Italian airports present a high instability of routes; for instance, at Rome-Fiumicino airport (FCO) 19% of seats offered in 2011 was to destinations not operated in 2016. A summary of the measures of instability in the routes serviced by Italian airports is provided in Appendix (Table A1).
Finally, both Italian and other European airports face the risk of base abandonment. As reported by Malighetti et al. (2016), in 15 years, 177 airports in Europe have witnessed a drop in the seat capacity of at least 20% by LCCs. Moreover, in almost 12% of these cases, LCCs completely left the airport.
Overall, these data exhibit a high overlap in terms of destinations and services offered, highlighting how Italian airports are forced to a relevant competition for airline services.
Competition for connecting traffic
Another form of competition among airports, especially involving large airports at the international level, is for connecting traffic. It is a form of competition in which hubs compete to attract in-transit passengers. In the past years, competition for connecting traffic became stronger given the growing role of major hubs located in the Middle East and Turkey. Consequently, the largest Italian airports, as well as European ones, are increasingly facing fierce competition in attracting in-transit passengers. This indeed allows airports to take advantages in terms of economies of scale and to recover the huge investments they have made to offer an adequate interline service.
Several Italian airports present a high degree of overlap between possible destinations reachable via FCO (the main Italian airport with hub characteristics) and reachable via international hubs. This has led FCO to face fierce competition in attracting in-transit passengers. Table 4 presents the number of destinations from Italian airports that can be reached via FCO compared with the total number of destinations that can be reached with a one-stop flight via a different European or Middle East hub. For instance, in regard to as much as 69% of the total destinations reachable from AOI by means of a one-stop flight, passengers can choose to stop over at FCO or at another European or Middle East hub.
Number of destinations from Italian airports that can be reached via FCO compared with the total number of destinations that can be reached with a one-stop flight via a different European or Middle East hub. Source: Author’s own elaboration on OAG data.
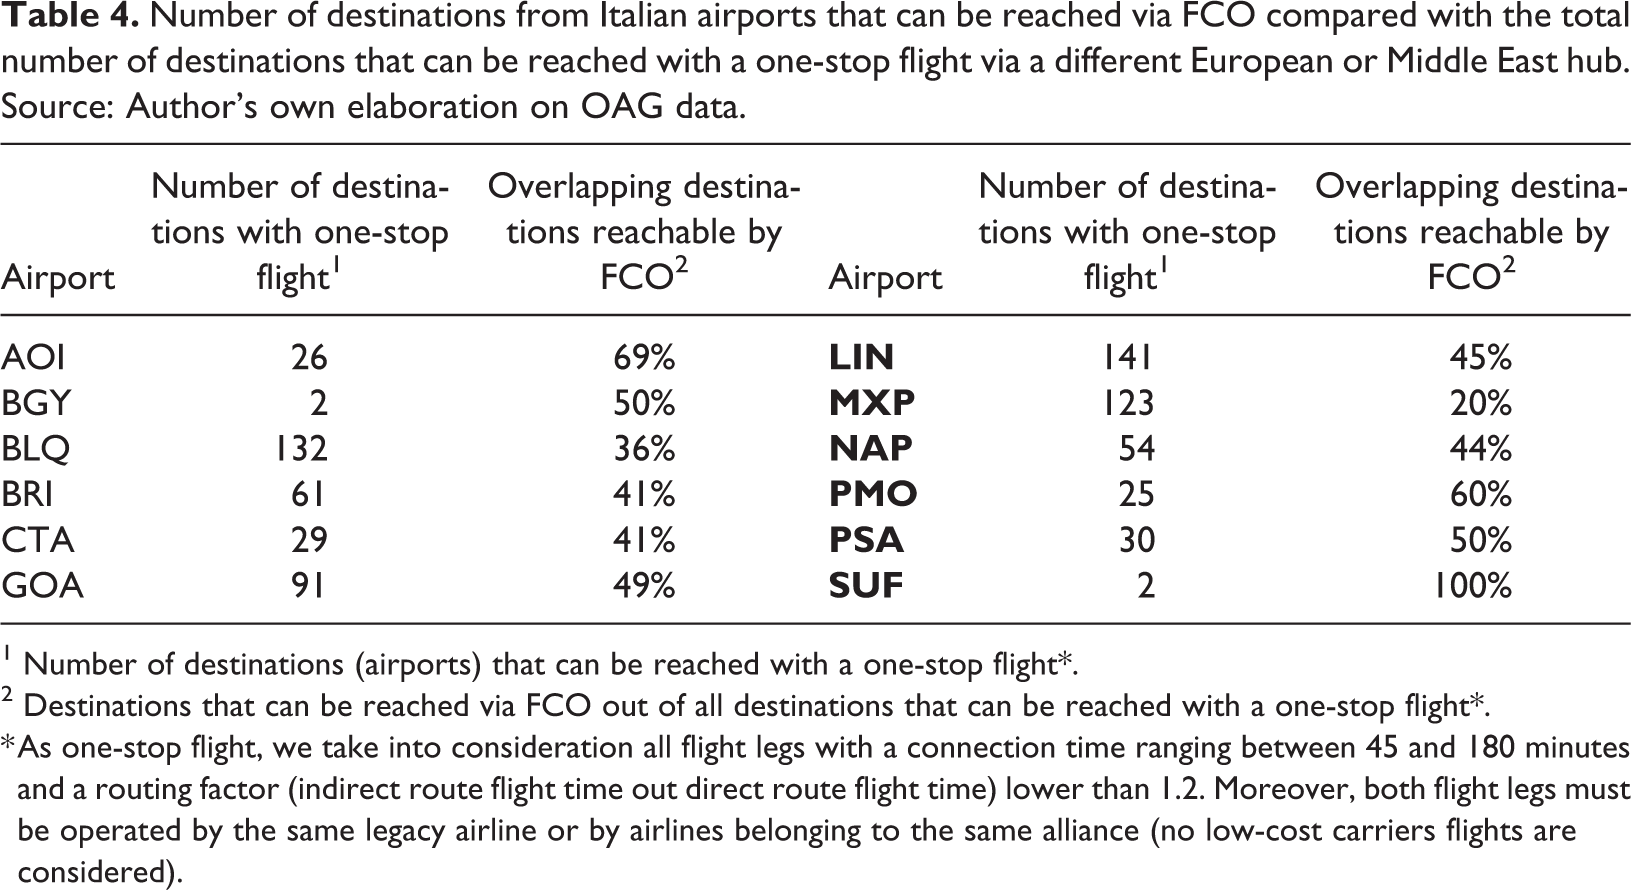
1 Number of destinations (airports) that can be reached with a one-stop flight*.
2 Destinations that can be reached via FCO out of all destinations that can be reached with a one-stop flight*.
* As one-stop flight, we take into consideration all flight legs with a connection time ranging between 45 and 180 minutes and a routing factor (indirect route flight time out direct route flight time) lower than 1.2. Moreover, both flight legs must be operated by the same legacy airline or by airlines belonging to the same alliance (no low-cost carriers flights are considered).
Intermodal competition
In addition to facing competition in air transport, Italian airports face competition from other industries. Specifically, the expansion of the high-speed rail (HSR) network in the past years has changed the airports’ competitive framework. Indeed, HSR services are considered as a substitute to air transport for many domestic and medium-haul flight connections. In Italy, air routes increasingly overlap with substitute high-speed rail routes, thus increasing the pressure of competition.
Italian HSR network operates mainly along two routes: from Milan to Naples, and from Turin to Venice. Both routes belong to the Trans-European Transport Network (TEN-T) 5 : the former to the Scandinavian-Mediterranean corridor and the latter to the Mediterranean corridor. Furthermore, the route from Milan to Naples has been in operation since 2010, whereas the route from Turin to Venice is operating only partially (currently only the routes from Milan to Brescia and Padua to Venice are served).
The introduction of HSR services from Milan to Rome/Naples caused a permanent and not-yet-stabilized reduction of air capacity on these routes. For instance, flight capacity on the Milan–Rome route dropped by 64% between 2008 and 2016. In this context, it can be stated that several Italian airports are nowadays facing growing competition from high-speed rail services.
An effective proxy for this type of competition is the distance between each airport and the nearest railway station served by HSR. In our analysis, we consider as HSR stations those served by “FrecciaRossa,” a HSR service operated by Trenitalia 6 whose travel speed exceeds 250 km/h. Currently, there are 17 railways stations in Italy that meet these criteria (Figure 4).
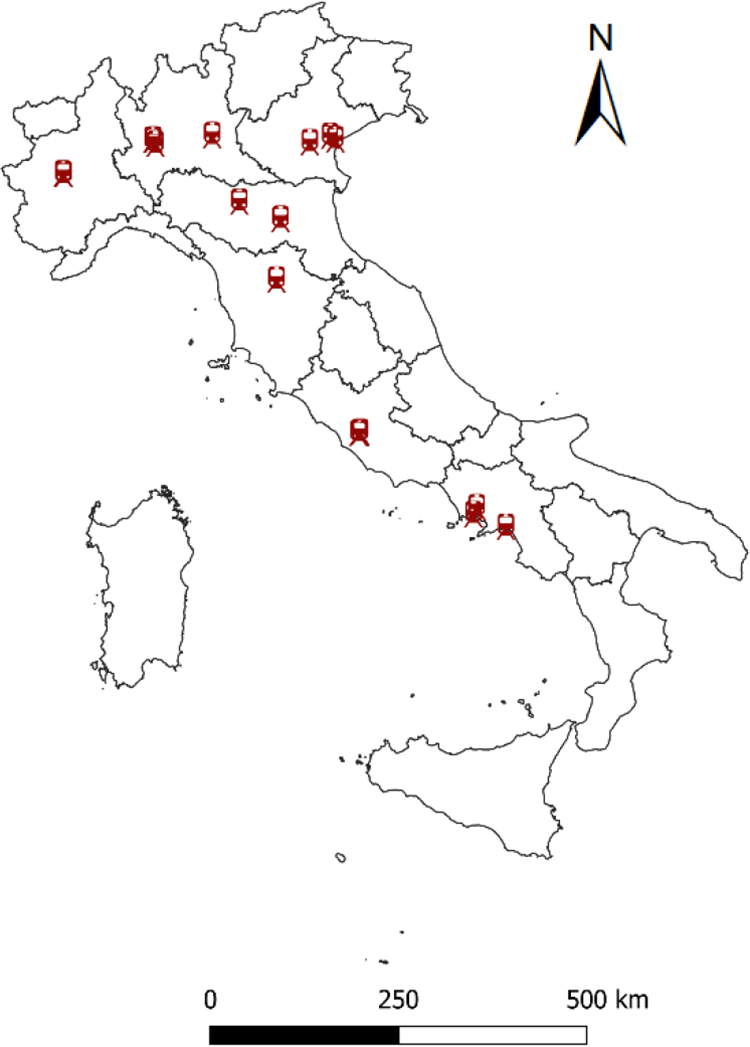
Italian railway stations served by HSR services. Source:Author’s own elaboration of data gathered from Trenitalia.
The average distance from an Italian airport to the nearest HSR station is 83 km (Table 5). The shortest distances are recorded for NAP, LIN, BLQ (Bologna), and FLR. All these airports are located within a radius of 5 km from the nearest HSR station. In contrast, the longest distances are those recorded for airports located in the Islands (Sicily and Sardinia), which are not served by the HSR network.
Distance between Italian airports and the nearest high-speed railway station. Source: Author’s own elaboration on Trenitalia data.

* Measures of airports located in the Islands (Sicily and Sardinia) are excluded.
Competition for cargo traffic
Cargo traffic constitutes another type of competition. Airports compete for cargo traffic both at the domestic level (cargo gateway—competition between airports serving the same manufacturing hinterland) and on a macro-scale (cargo hub—large-scale competition with major airports in the same geographical area).
The Italian air freight transport scenario is highly polarized. The top six airports in terms of freight traffic in 2017 accounted for more than 90% of total air cargo traffic. 7 On the contrary, 4 out of 33 airports that we studied did not record freight traffic during 2017. One way to evaluate the level of competition between airports for cargo traffic is to hypothesize that competitive pressure mainly comes from similar-sized airports in terms of freight traffic volumes. In this case, to help with the analysis, airports can be divided into three main groups (see Figure 5): airports with high freight traffic (above 30,000 tons per year), medium freight traffic (between 5,000 and 30,000 tons per year), and low freight traffic (below 5,000 tons per year).
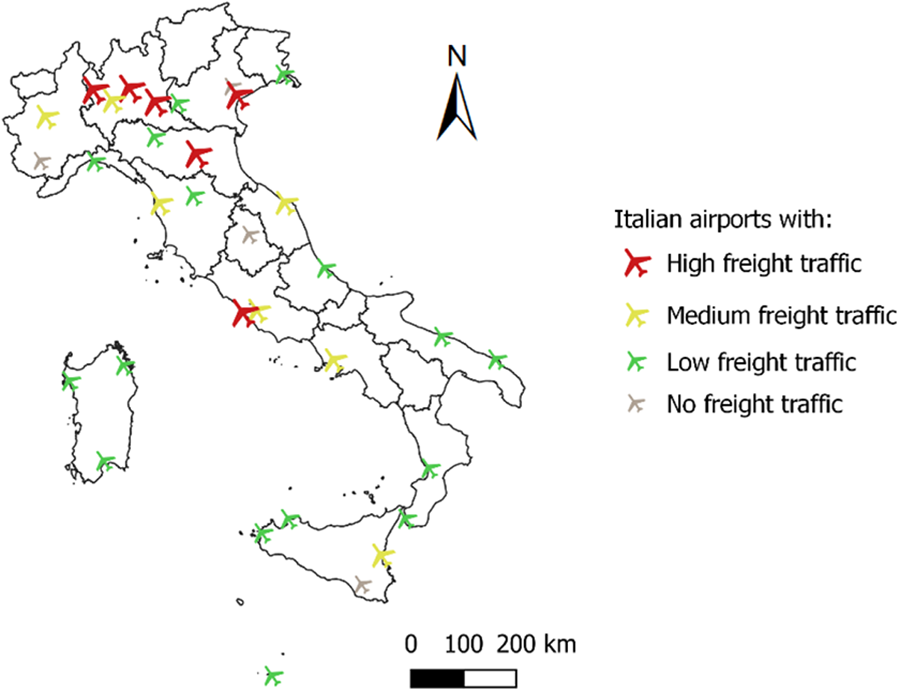
Italian airports divided by freight traffic in 2017. Source: Author’s own elaboration on Assaeroporti data.
For each airport, we use the following as proxies of competitive pressure: the minimum distance to the closest airport in the same group, the average distance to airports in the same group, and the traffic-weighted average distance of each airport to all the other airports belonging to the same group. The weighted average distance of airport
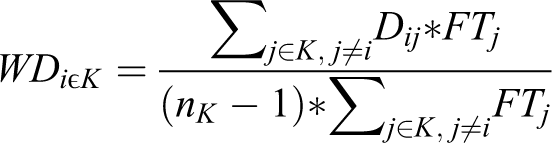
where
Minimum distance, average distance, and traffic-weighted average distance of the Italian airports considered. Source: Author’s own elaboration on Assaeroporti data.

1 Minimum distance (in km) between the considered airport and another airport in the same group.
2 Average distance (in km) between the considered airport and all the other airports in the same group.
3 Traffic-weighted average distance of each airport to all the other airports belonging to the same group.
Despite the high concentration of offers at the national level, in the case of most Italian airports, we can see clearly that a significant amount of competition exists in attracting cargo traffic services. In different cases, airports with similar traffic volumes cover the same manufacturing area. For instance, in the cluster of airports with high freight traffic, BGY, LIN, and VBS face high competition since they cover the same manufacturing hinterland (i.e., Lombardy). On the contrary, FCO is not subject to this type of competition, as it is the only airport in this category that serves Central Italy.
Moreover, the advent of the truck–flight phenomenon at the European level allowing to easily serve the Italian market through alternative European hubs makes the competition for cargo traffic fiercer, thus confirming the supranational nature of the competition for air freight.
Preliminary conclusion on the need of price regulation
Although single airports frequently face only some of the competitive dimensions and with different intensities, overall the Italian airport industry reflects a high level of competition both internally and with alternative means of transport (e.g., providers of HSR services). Hence, the data presented in Table 7 suggest that the vast majority of all Italian airports face at least one of the competitive dimensions discussed previously. Accordingly, the effects of competition prevailing in the airport industry, both in Italy (as empirically described) and the rest of the Europe (as previously outlined by OXERA, 2017; Thelle & la Cour Sonne, 2018) are wide and articulated on several levels.
Summary of the competitive levels for Italian airports. Source: Author’s own elaboration on OAG, assaeroporti, google maps and trenitalia data.
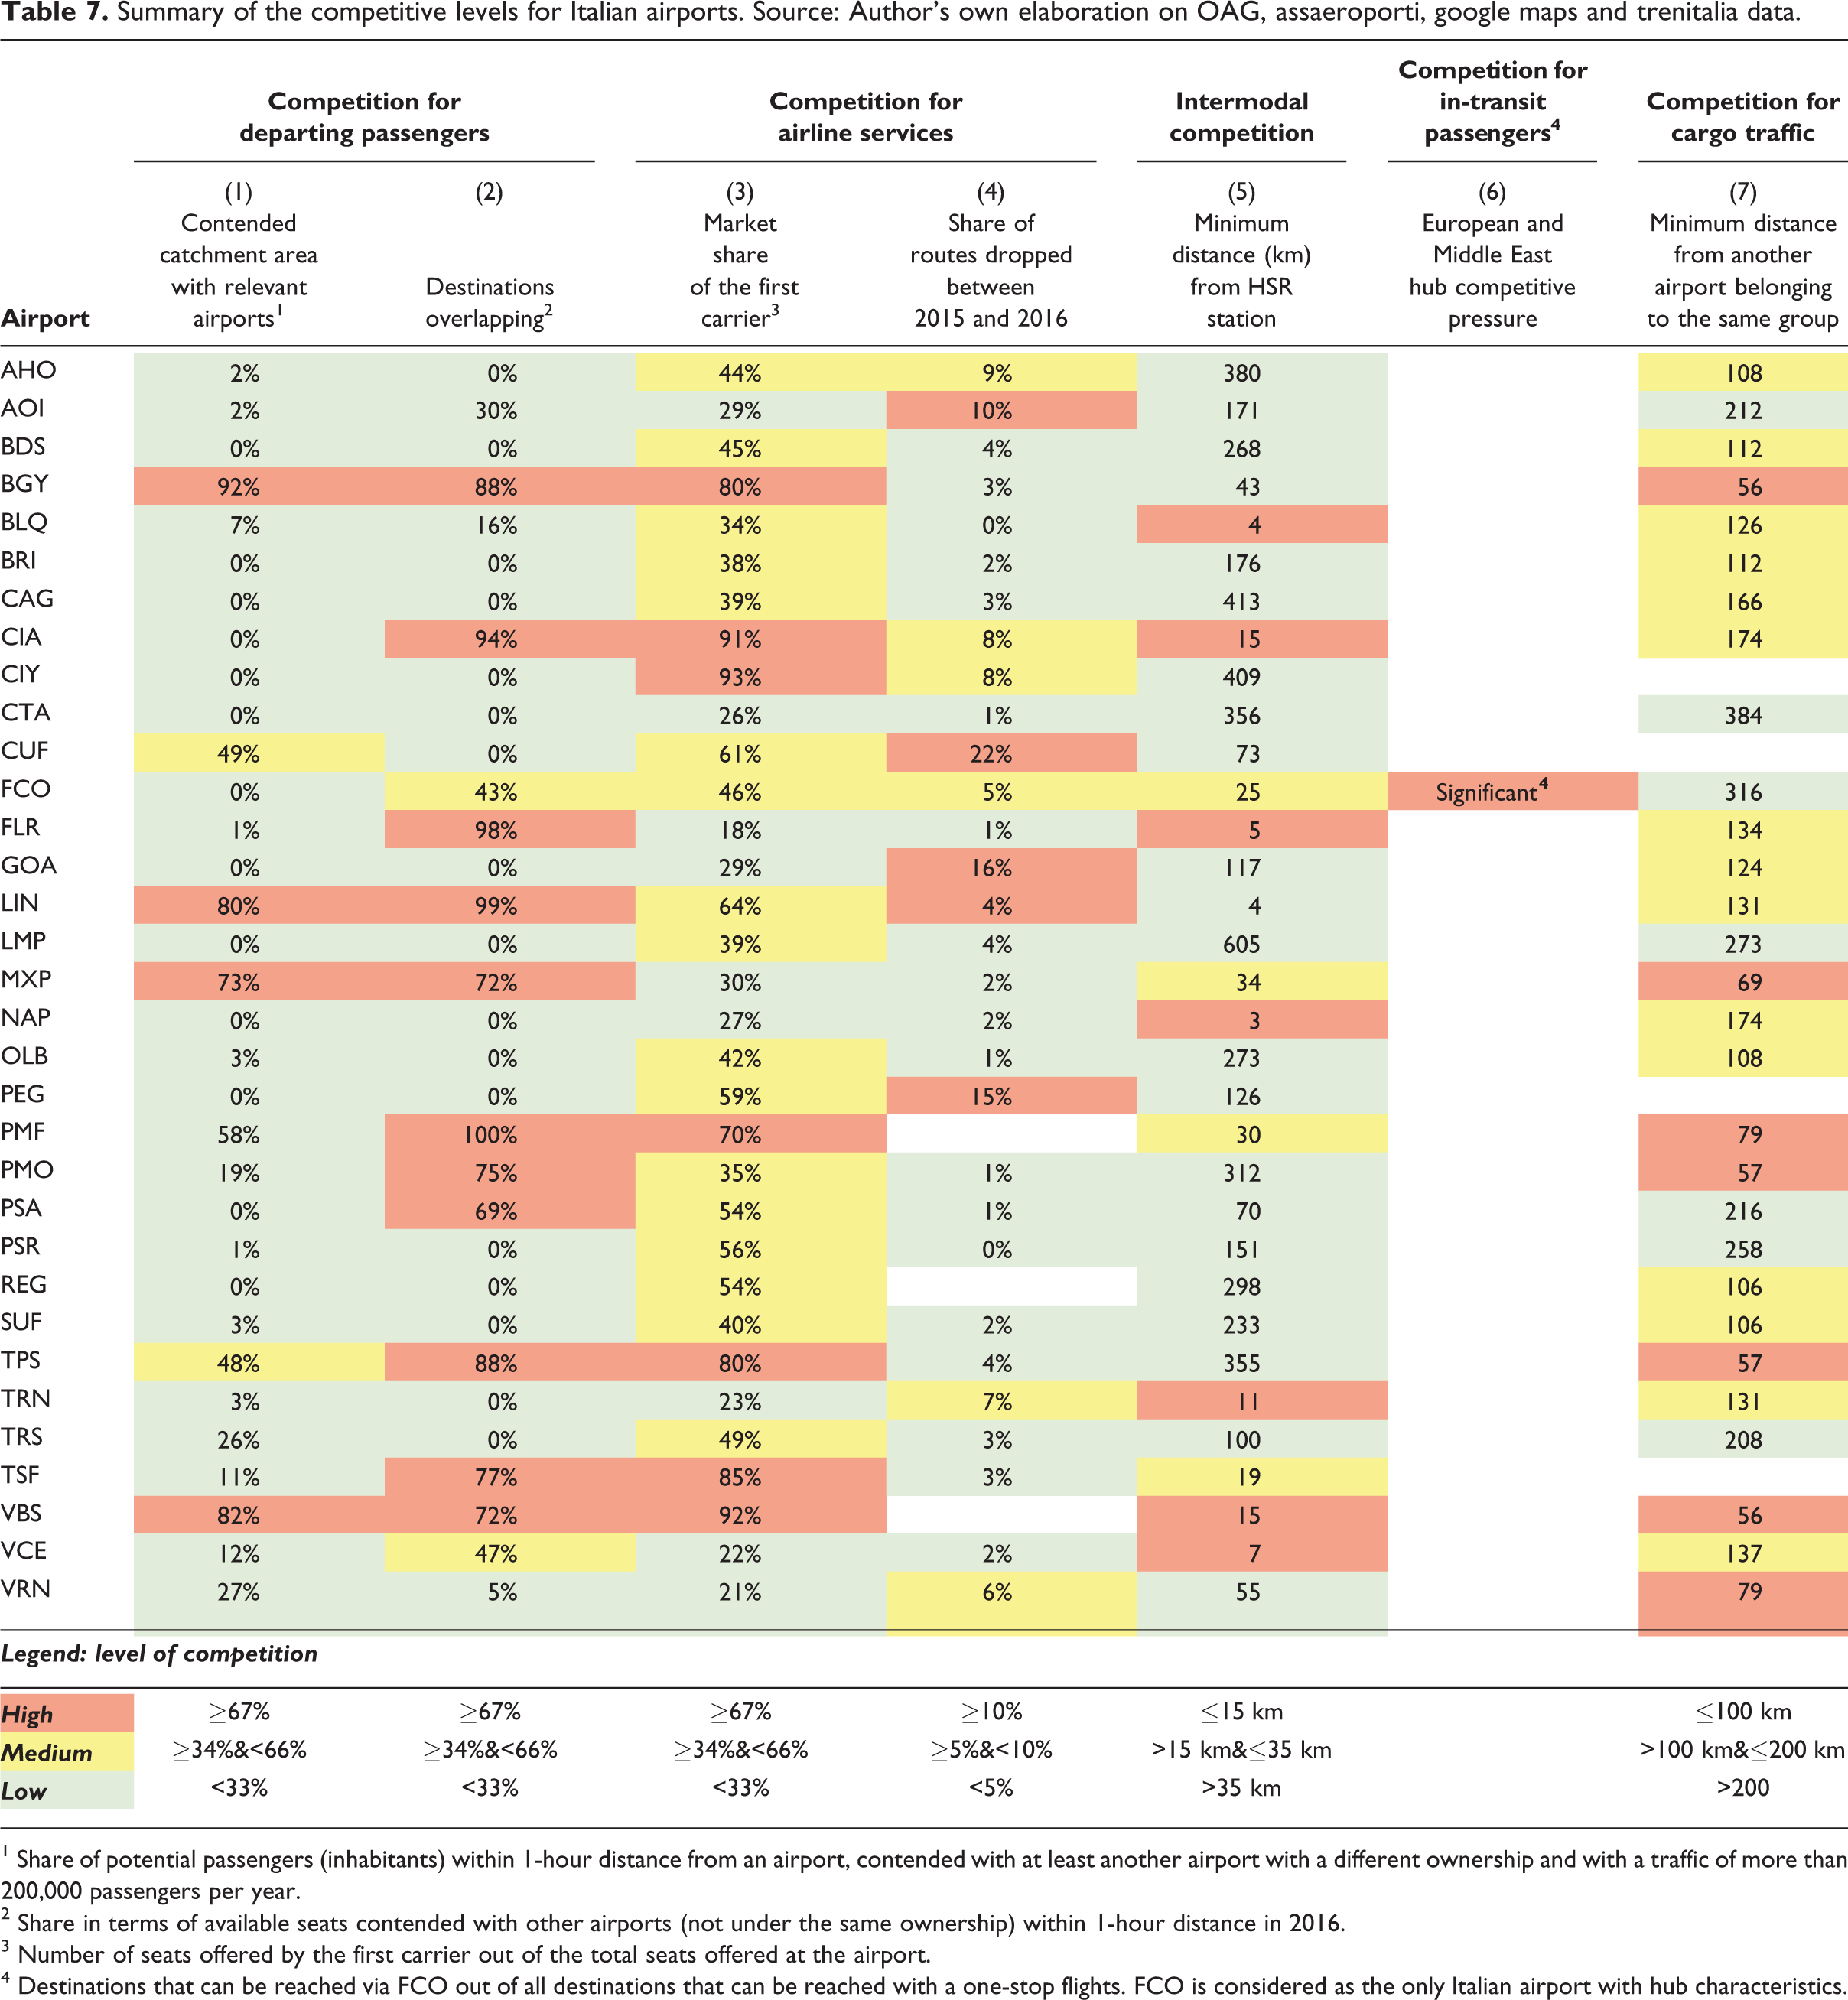
1 Share of potential passengers (inhabitants) within 1-hour distance from an airport, contended with at least another airport with a different ownership and with a traffic of more than 200,000 passengers per year.
2 Share in terms of available seats contended with other airports (not under the same ownership) within 1-hour distance in 2016.
3 Number of seats offered by the first carrier out of the total seats offered at the airport.
4 Destinations that can be reached via FCO out of all destinations that can be reached with a one-stop flights. FCO is considered as the only Italian airport with hub characteristics.
In such an environment that is to some degree, characterized by competition, Littlechild (2018) argues that the application of rigid price-control mechanisms (for instance, regulation policies) could discourage competition rather than incentivize it. The author reports as an appropriate example the Civil Aviation Act’s (2012) requiring the UK airport regulator (i.e., CAA) to justify its three-pronged policy, according to which the regulator should demonstrate that (i) the airport holds market power, (ii) the Antitrust authority is not sufficient to limit this power, and (iii) the benefits of regulation outweigh the adverse effects.
To summarize, inappropriate application of price regulation policies in a context where multiple forms of competition prevail might lead to counterproductive effects, particularly a further decrease in competition (Littlechild, 2018). Hence, with respect to the application of rigid price control mechanisms and especially the application of yardstick regulation to the airport industry, regulators should avoid blanket application of general price control mechanisms at all of the airports, without taking into account their effective level of market power. Rather, regulators should carefully identify specific submarkets or agents where competition is low and require customized and suitable regulatory actions.
Yardstick regulation and its application
Yardstick competition, first theorized by Shleifer (1985), is a form of incentive regulation aimed at improving both agents’ allocative and productive efficiency in contexts where competition is either weak or absent (e.g., natural monopoly conditions) by artificially introducing a form of indirect competition between companies. In the case of perfect competition, competitive pressure ensures the achievement of maximum efficiency and collective welfare, where regulatory intervention is not needed. However, in the case of natural monopoly, the necessity of regulation arises to guarantee the achievement of adequate levels of efficiency. In such conditions, a regulator does not usually possess accurate information about single-firm cost-efficiency. Yardstick regulation copes with this deficit relying on data on similar firms to build a sort of cost function, to regulate prices for each agent. In this way, comparison becomes essential to bridge the information gap between the regulated firms and the regulator. Under the yardstick regulation scheme, “the rewards of a given firm depend on its standing vis-à-vis a shadow firm, constructed from suitably averaging the choices of other firms in the group. Each firm is thus forced to compete with its shadow firm” (Shleifer, 1985).
However, to adequately ensure correct application of yardstick regulation and the related validity of its implementation, some basic requirements have to be satisfied (CPB, 2000):
– The implementation of yardstick competition requires market failure. Indeed, yardstick regulation should be adopted only in cases where other forms of competition to promote cost-efficiency are not feasible.
– As yardstick regulation policy is based on firms’ relative efficiency, the industry needs to be composed of a large number of agents and its characteristics reflecting homogeneity.
– The presence of superior private information by agents, meaning that, as commonly happens in market failures, the agents know how to improve efficiency and have the wherewithal to do so in terms of effort and technology.
– Agents must provide specific and verifiable information about demand, profits, and costs to the regulator to help him develop robust control and regulatory measures.
Another possible issue arising from the yardstick approach, as already highlighted by Shleifer (1985), is the risk of collusion and opportunistic behaviors that agents may engage in while working with the regulators.
Yardstick application
Over time, yardstick competition as a form of incentive regulation has been applied in different industries across the world, particularly to network entities, which by nature act as local monopoly. Some examples of such network entities include primarily water, telecommunication, electricity, railway, bus service, highways, and airport industries. Among all such entities, it is the energy sector that is most affected by yardstick regulation.
Table 8. presents a summary of the main studies or regulatory documents about the application of benchmarking competition in network industries around the world.
Summary of the main studies and regulatory documents about yardstick competition applications. Source: Author’s own elaboration.
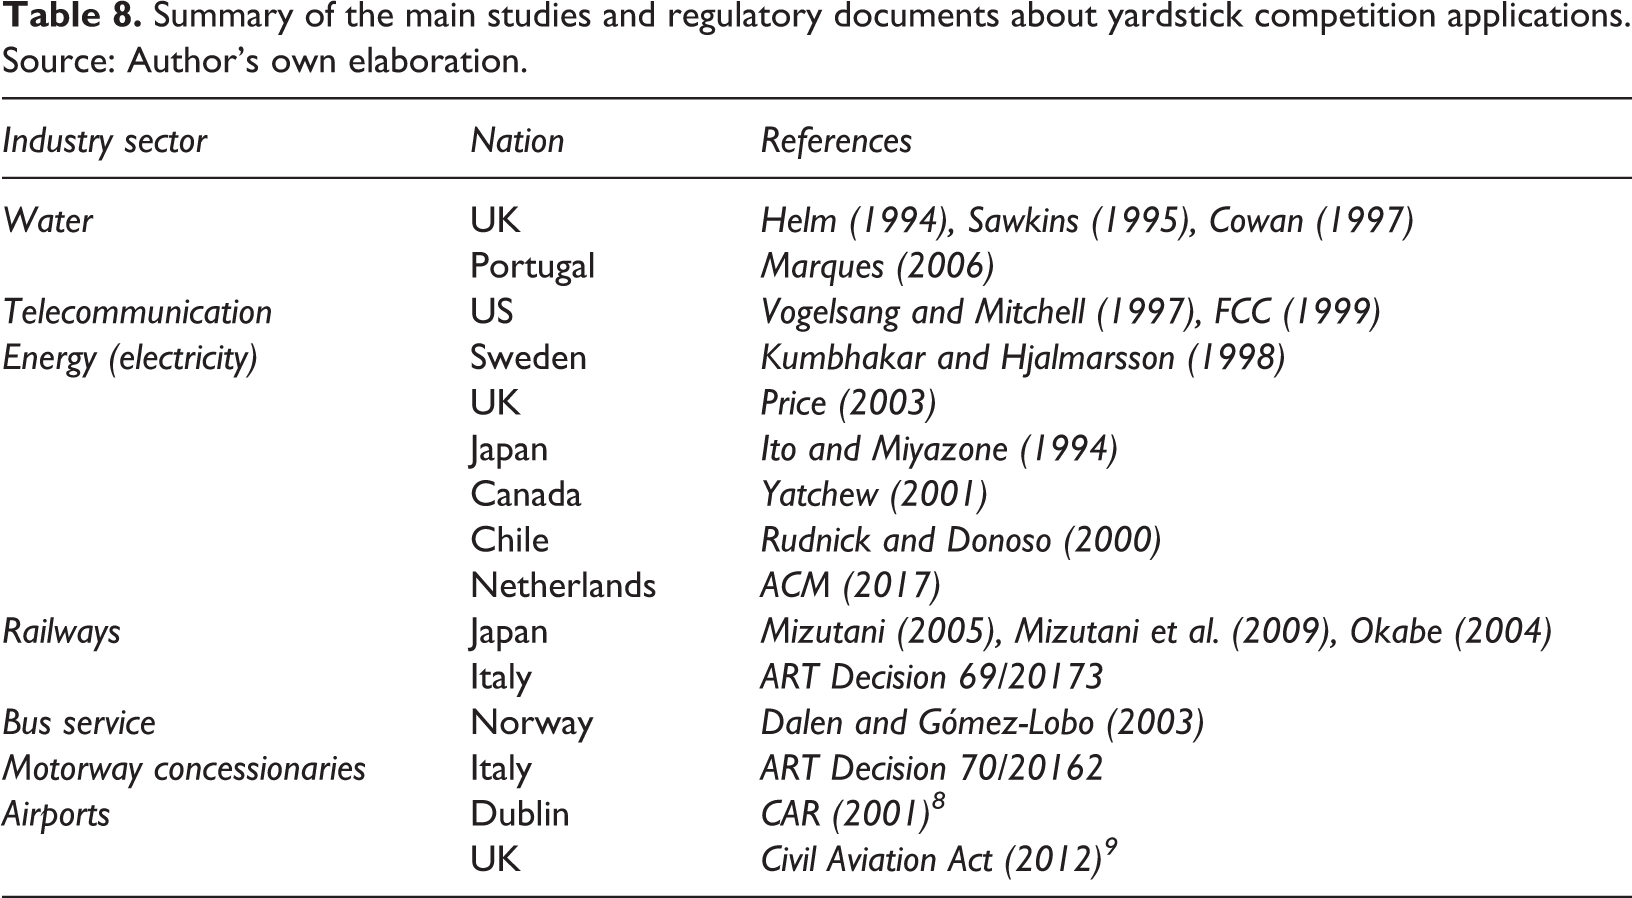
Recently, the Italian Transportation Regulatory Authority (ART) introduced a benchmark approach to identify an appropriate mechanism to improve the cost-efficiency of operations in motorway concessionaires and the regional railway services industry. The first application (Decision 70/2016 10 ) aimed at determining the optimal dimension (i.e., the level that guarantees an adequate level of economies of scale while sustaining an appropriate level of regulation of the industry) for Italian motorway concessionaries by applying different methodologies (stochastic frontier and regression analyses) and considering different types of cost functions (Cobb-Douglas and Translog). The analysis considered the data pertaining to 20 motorway concessionaries for the period 2005 to 2013. The application in the regional railway services industry (Decision 69/2017 11 ) adopted a benchmarking approach to identify the efficiency level of 23 local rail transport operators for the period 2012 to 2016.
In the past years, European regulatory authorities have focused their attention on the airport industry, while also considering the introduction of yardstick regulation. Up to now, application of yardstick regulation in the airport industry has been limited and given rise to controversial results. Some of these marginal applications took place in Ireland in 2001 (by CAR—Commission on Aviation Regulation) and in the UK in 2000 (by CAA—Civil Aviation Authority). In both cases, results were not robust enough to adequately assess airport efficiency and to provide unbiased evidence for regulators.
Yardstick application limits in literature
According to current literature, yardstick regulation applicability requires some criteria to be met, such as high-quality data, homogeneous production functions across items, and sufficient number of observations in the sample analyzed. The verification of these basic criteria plays a fundamental role in ensuring appropriate assessment of companies’ efficiencies and therefore unbiased evidence for the regulator.
The homogeneity between regulated firms probably represents the greatest criteria necessary for the application of yardstick regulation. In fact, as stated by Sobel (1999), yardstick approach outputs could provide distorted results in the absence of homogeneity among the firms compared. Although this prerequisite could be relaxed in the case of limited heterogeneity (e.g., accounting for it by using regression models on estimated costs), high-level heterogeneity can impede yardstick applicability greatly in some industries.
In line with the growing debate on whether benchmarking approaches would give the best incentives for allocative and productive efficiency, Reinhold et al. (2010) analyze the limits of the application of yardstick competition techniques in the airport industry. On one hand, airports share some characteristics (e.g., high sunk costs and sub-additive cost functions) with other industries like energy, water, and telecommunications, where yardstick regulation is normally applied. On the other hand, airport industry comprises different forms of heterogeneity, which might distort or further complicate the application of yardstick competition. Furthermore, Reinhold et al. (2010) classify the different types of heterogeneity based on external factors (exogenous and endogenous) and internal or managerial factors.
Exogenous heterogeneities are described as all of the environment features of the location where the airport operates, which in turn affect airport costs for reasons beyond the control of the company. Some relevant examples are the contextual aspects related to the aeronautical technical configuration that affect an airport’s expansion capacity, the limits on the number of movements that can be made, the greater/lower taxiing times, and the weather effects (e.g., speed and variability of winds). Other exogenous elements affecting airports’ performance are land-side accessibility, political context of regulatory actions, ownership structure, and presence of multi-airport systems. Airport traffic variability (both daily and seasonal) is another partially exogenous variable that has an impact on airport efficiency (Curi et al., 2011; Malighetti et al., 2007).
Endogenous factors are those related to the regulatory system that to which the airport operator is subject. In particular, Reinhold et al. (2010) highlight how regulatory regimes differ widely among countries. Indeed, even considering only the European context, regulations vary from single till and dual till to rate of return and price-cap regulations. According to them, such differences substantially affect the incentives and performance of the airport operator scoring other points of heterogeneity. Furthermore, they are of the view that all the business choices made by the airport operator, such as make or buy decisions and orientation to commercial activity, constitute a further element of heterogeneity (internal or managerial heterogeneity). Another scholar, Littlechild (2018) points out that the presence of companies demonstrating different make or buy choices as well as the presence of lumpy investments introduce an element of risk into benchmarking regulations.
Apart from the heterogeneity issue, according Reinhold et al. (2010), there are also limitations that arise applying yardstick approach to airport industry because of multiple outputs of airport activity. Indeed, airport activity produces different types of outputs, such as departing, arrival, and in-transit passengers, and freight traffic. These outputs require different production processes (i.e., different types and uses of resources) and cannot be adequately represented in a single “compounded” output, such as traffic units, to set an efficiency score. The presence of different types of outputs, with different production functions and varying unitary costs, makes comparison difficult. Even considering airports as single-output firms, as far as it concerns aviation activities, the presence of non-aviation activities should also be considered an output, such as management of parking lots and commercial activities carried out in passenger terminal.
In addition, the quality of airports’ performance does not depend only on airports’ efficiency but also on the choices of airlines that operate from that airport. In fact, even airlines with average aircraft size and load factors can influence the number of flight movements and the number of passengers carried and in turn influence the overall efficiency of the airport. However, correct application of yardstick regulation requires such output measures that provide a clear distinction between the efficiency of the airport and the efficiency of the air carriers.
Overall, all these problems and limitations discussed in the literature from a theoretical point of view can explain why the application of yardstick regulation is limited in the airport industry compared to other network industries, such as energy, water, and telecommunications. However, till date, no empirical study on yardstick applicability in the airport industry has been carried out. In the next section, we empirically test yardstick regulation applicability to the Italian airport system by focusing on one of the major limits of the yardstick approach outlined in literature, namely, heterogeneity among regulated firms.
Yardstick applicability in the Italian airport system
According to the literature, correct application of yardstick regulation requires effective comparability of agents as well as presence of a larger sample. In this regard, we analyze in this section the Italian airport system by evaluating airports’ degree of comparability with reference to four characterizing factors—namely, size, competition, offer, and growth—that significantly affect the firms’ production function and whose homogeneity consequently becomes essential to guaranteeing the accuracy of benchmarking results. For each of these features, we identify some representative variables briefly summarized in the following. Where not explicitly indicated, all the statistics proposed refer to year 2017.
The variables representing the macro category, size, are airport traffic variables, 12 such as number of yearly movements, passengers, and cargo tons, area occupied by each airport, 13 and average aircraft size departing from the airport. Table 9 presents descriptive statistics for size-related measures.
Descriptive statistics for size-related measures. Source: Author’s own elaboration on OAG, Assaeroporti and CORINE Land Cover data.
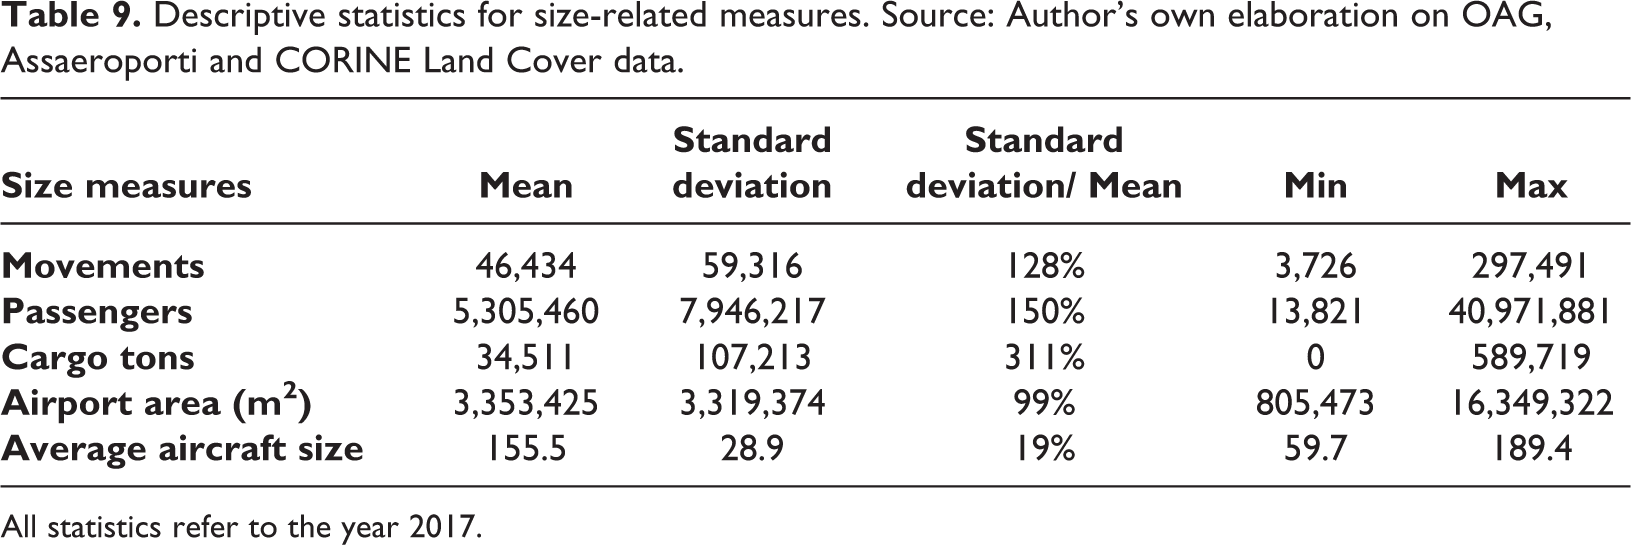
All statistics refer to the year 2017.
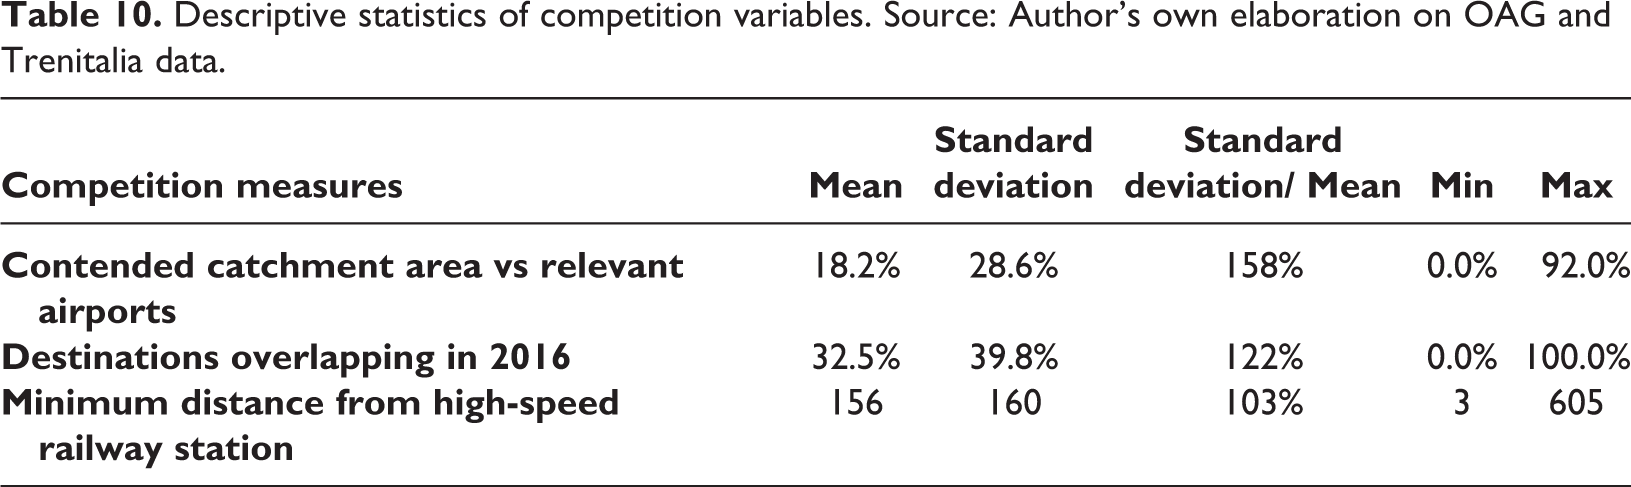
For competition measures, we use some of the statistics proposed in the previous sections in relation to competition for departing passengers and the intermodal competition. In particular, variables such as overlap of catchment areas with other relevant airports, 14 overlap of reached destinations, 15 and the distance to the nearest railway station served by HSR service are considered for analysis in this case. 16 Table 10 presents descriptive statistics on competition measures.
Descriptive statistics of competition variables. Source: Author’s own elaboration on OAG and Trenitalia data.
From the offer point of view, we consider variables such as the number and type of airlines operating at each airport and characteristics of the offered flights, such as seasonality or internationality. The variables considered for the macro category, offer, are listed in Table 11. The variables in this case include the portion of low-cost airlines, number of carriers operating at each airport, market share of the first operating carrier (in terms of offered seats), the Herfindahl–Hirschman Index 17 (HHI) calculated for operating airlines, and share of domestic, intra-European, and non-European offers. In addition, we include a measure that considers the number of offered seats by the first carrier at the airport compared to the airline’s offered seats in the whole network (share of offered seats in first carrier’s network in 2016). Ultimately, we construct a seasonality measure calculated as the ratio between the maximum monthly passenger volume recorded in 2017 and the monthly average for the same year.
Descriptive statistics of offer variables. Source: Author’s own elaboration of OAG data.
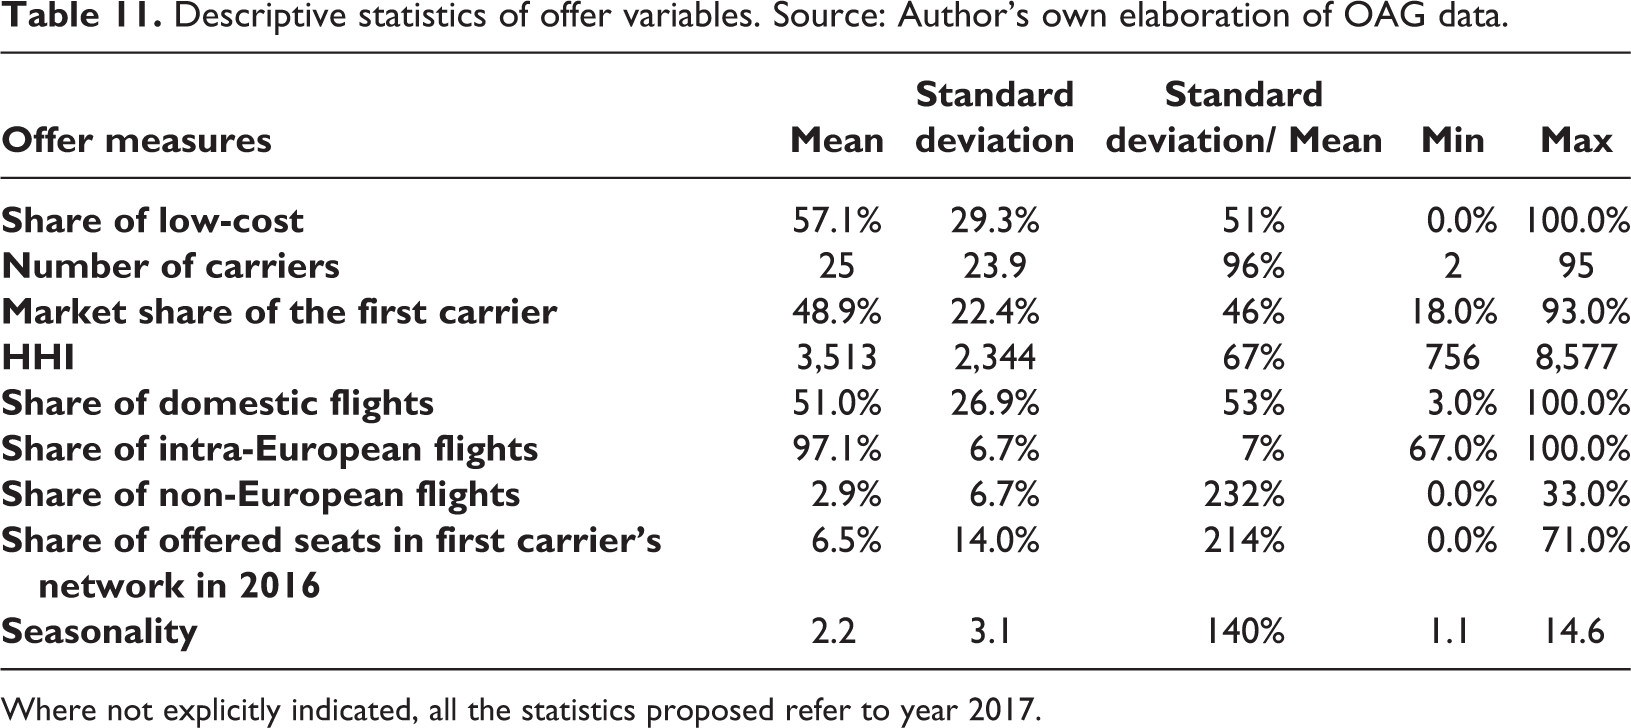
Where not explicitly indicated, all the statistics proposed refer to year 2017.
Finally, as regards the macro category, growth, we consider variations in traffic in terms of movements, passengers, and cargo tons in 2017 compared to the previous year, as provided by the Assaeroporti annual report. 18 Table 12 provides an overview of these measures.
Descriptive statistics of growth variables. Source: Author’s own elaboration on OAG and Assaeroporti data.
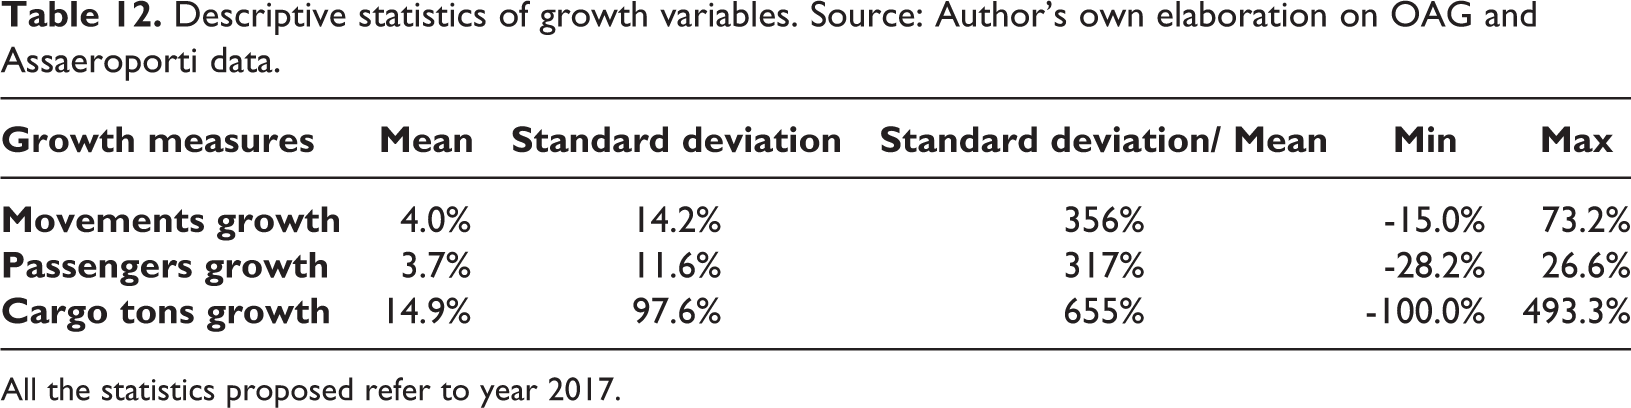
All the statistics proposed refer to year 2017.
From the analysis of the minimum and maximum values of the proposed statistics, as well as considering the ratio between the standard deviation and the mean value, we find that Italian airports represent a highly heterogeneous sample. This result is corroborated by the implementation of a multivariate analysis based on the joint use of a principal component analysis 19 (PCA) and k-means 20 clustering algorithm, allowing us to systematically evaluate the level of heterogeneity among airports. Indeed, these instruments outline the possible presence of recurring patterns with reference to the characterizing factors described previously—size, competition, offer, and growth.
The PCA allows to reduce a large number of variables into a smaller number of highly representative latent variables (reduction feature). In our case, starting from all the measures characterizing Italian airports (20 variables described earlier), the PCA identifies six principal components explaining 80.6% of the variance among the initial variables. 21 Table 13 presents the variance explained, and, therefore, the explanatory power of PCA in relation to number of components identified.
Variance explained in relation to the number of components identified. Source: Author’s own elaboration.
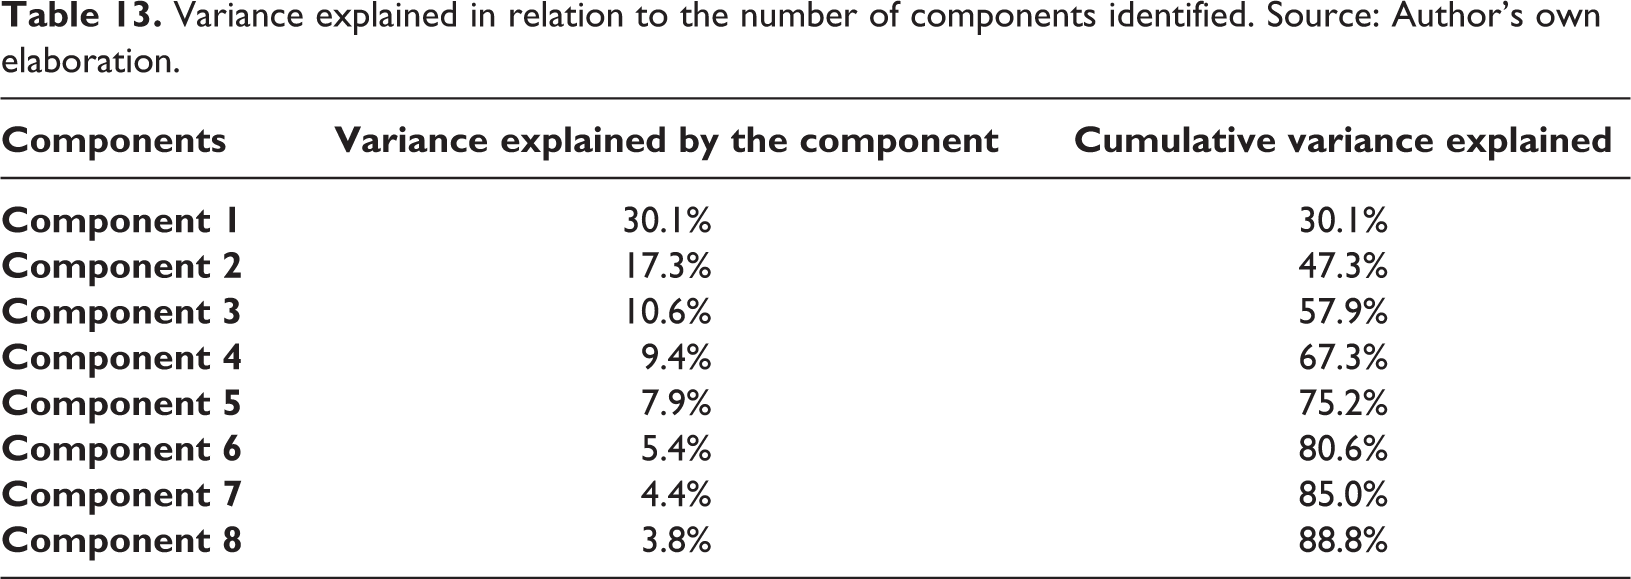
Figure 6 illustrates the scree plot of eigenvalues after PCA.
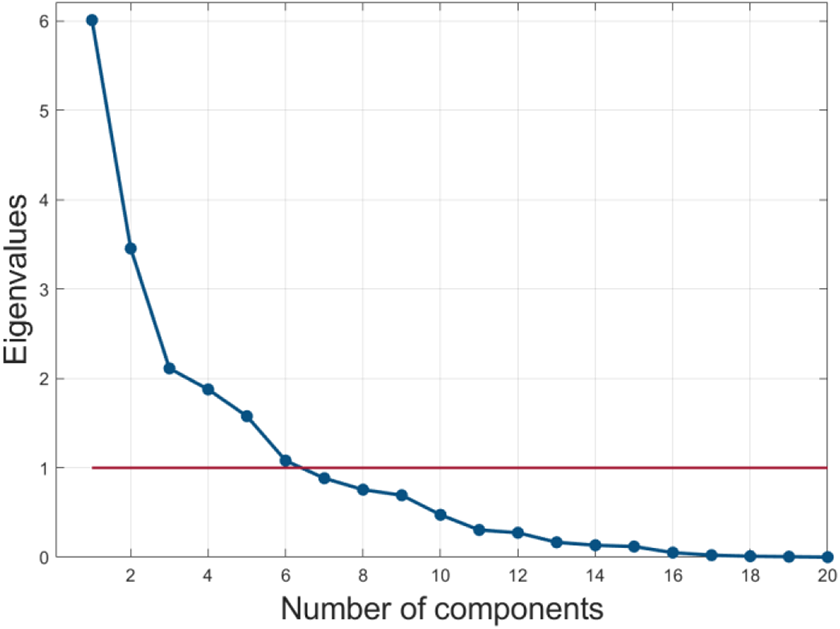
Scree plot of eigenvalues after PCA. Source: Author’s own elaboration.
The identification of principal components is a useful input for systematic analysis carried out through a k-means clustering algorithm to measure the level of heterogeneity among airports. In particular, we aim to evaluate the possibility of identifying groups of airports with homogeneous, and therefore effectively comparable, characteristics.
The k-means algorithm is a partitioning clustering algorithm that allows to divide a set of objects into k groups according to similarities of their attributes. In our case, the attributes correspond to the six principal components previously identified by PCA. Once the number of clusters (k) has been fixed, the k-means algorithm proceeds to iteratively identify the centroids and allocates each element in only one cluster based on that element’s similarities with other elements belonging to the same cluster. The algorithm stops when the objective function is optimized, that is, when the total intra-cluster variance is minimized.
Ideally, we would like to partition the sample population of Italian airports in a way that units belonging to the same group are similar to one another. Therefore, units belonging to different groups are considered dissimilar. Consequently, a measure of the effectiveness of a clustering scheme is given by the share of inter-cluster variance compared to the intra-cluster variance. With the increase in inter-cluster variance and the decrease in intra-cluster variance, the quality of clustering improves. This is because the variability among elements is explained more by the existence of independent groups than by the presence of strong differences and inequalities inside them. In general, the presence of a small number of clusters can generate sufficiently small values of intra-cluster variance, which denotes the possibility of partitioning the population into subgroups of homogeneous and mutually exhaustive elements. On the contrary, the need to resort to a large number of clusters stresses the heterogeneity of the elements belonging to the sample and could even make the obtained clusters insignificant, although formally disjointed, and thus not useful for practical purposes.
When there is no fixed number of clusters, a priori, several k-means solutions with different numbers of groups k are computed and compared. To identify the optimal number of clusters, it is possible to use a scree plot and search for an “elbow” in the curve generated from the within sum of squares (WSS) or its logarithm form for all cluster solutions. 22
Figure 7 illustrates how the level of representativeness of clustering (applied to the six principal components previously identified) varies with the number of clusters considered. In detail, Figure 7(b) shows that a significant level of accuracy is obtained only when a high number of clusters (k) are considered. In order to reach the 80% variance level, it is necessary to define 10 groups, reducing consequently the number of observations within each subsample below the number necessary for any type of econometric analysis.
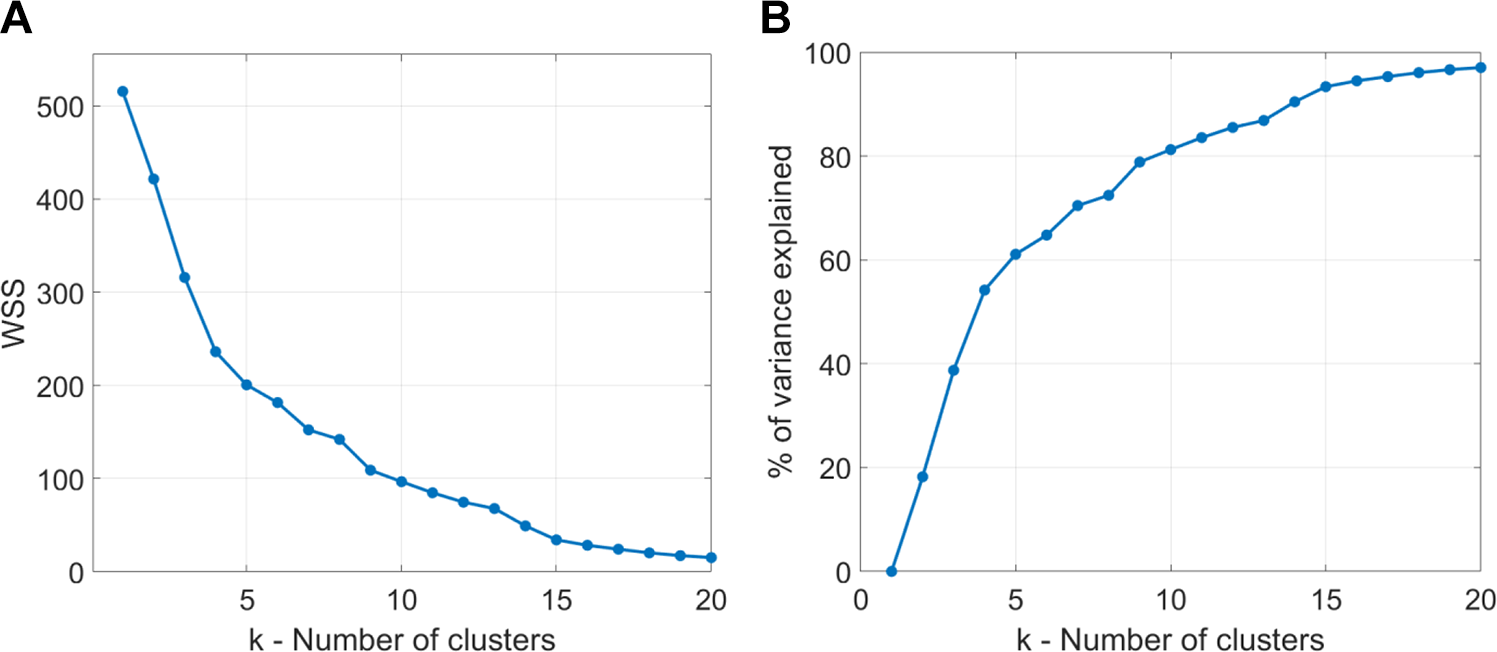
K-means algorithm results as the number of clusters considered varies. Source: Author’s own elaboration.
However, these conclusions do not consider a commonly recognized limitation of k-means clustering algorithm, that is, the results’ dependence on the initial conditions (Pena et al., 1999). Hence, depending on the initialization, different items (airports) may be divided into different subgroups or, in some cases, the “elbow” may not be visible. Accordingly, the best way to evaluate k-means solution is to repeat the clustering algorithm several times with different starting points and then compare the different solutions. Figure 8 shows the k-means algorithm outcomes with five different starting points. Results do not significantly change: in order to obtain an explained variance of 80%, the identification of 10 clusters is required in 4 out of 5 cases. Moreover, in no case the “elbow” is visible.
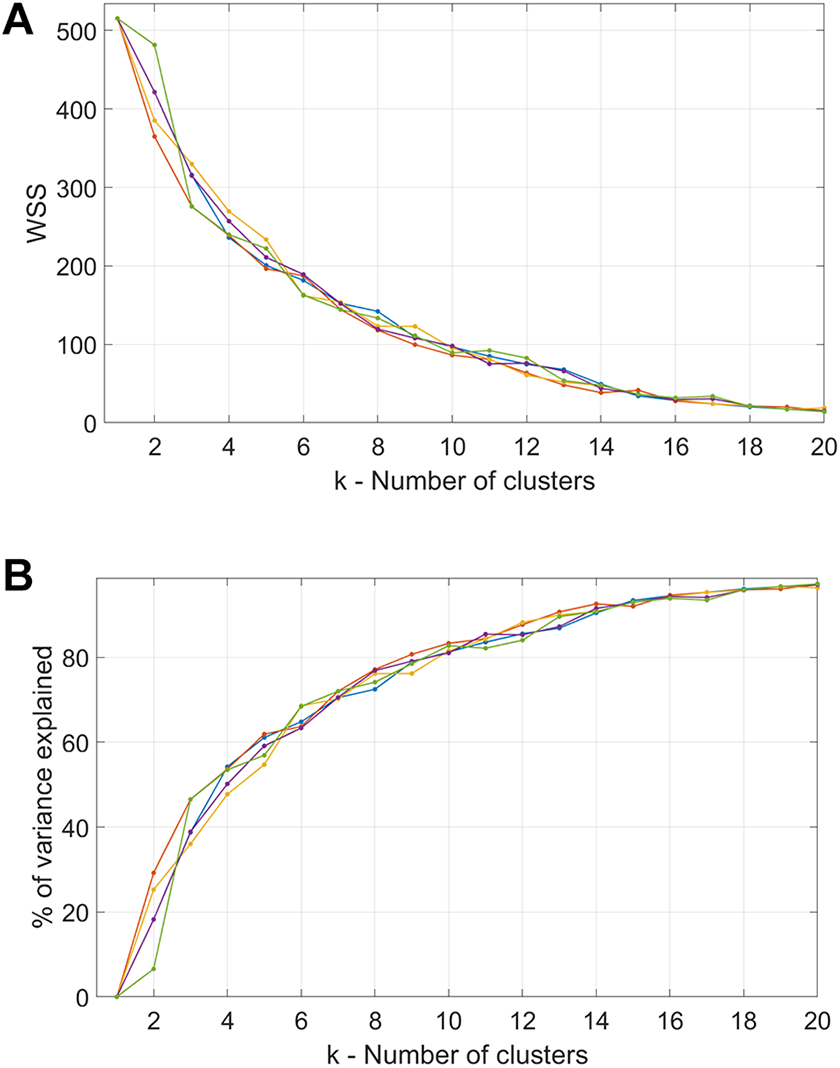
K-means algorithm outcomes with five different starting points. Source: Author’s own elaboration.
Analyzing the results of the k-means algorithm with k equal to 10 (number of clusters that guarantees an explained variance of 80%), it is possible to observe how six clusters are composed of a single airport (Table 14). Consequently, application of benchmarking techniques for these airports is practically not possible.
Clusters generated by the application of k-means algorithm (number of clusters equal to 10). Source: Author’s own elaboration.
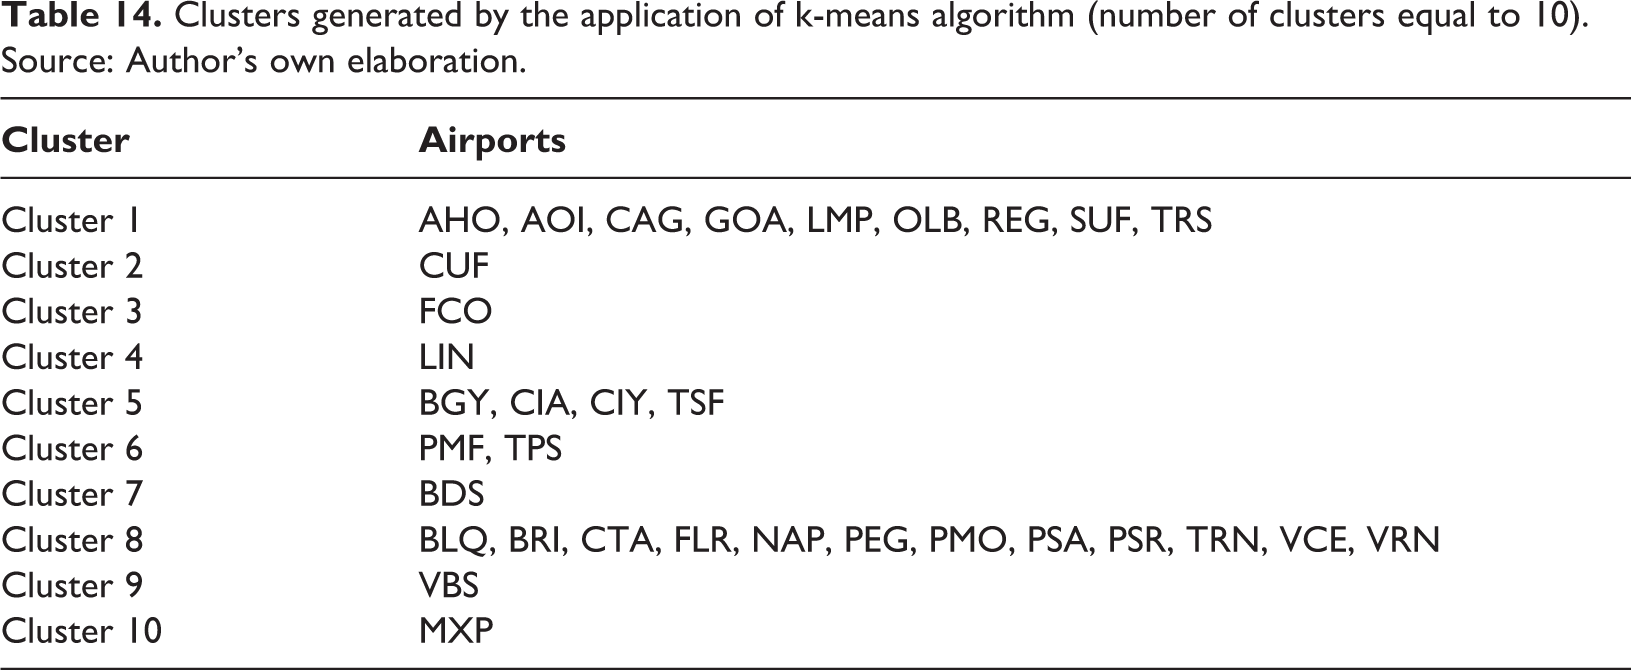
Two further clusters comprise multiple airports, with the number of airports ranging between two and four. In these cases, application of benchmarking techniques turns out to be incompatible with the limited number of agents in each cluster, which heavily compromises the statistical significance of the models.
Finally, the two clusters with the largest number of airports are cluster 1 and cluster 8. Globally, these clusters represent only 44% of passengers and 15% of freight traffic in Italy in 2017. Even in this case, the limited number of airports in each cluster complicates any analytical approach for the implementation of yardstick regulation (e.g., Stochastic Frontier Analysis implementation—SFA). Furthermore, it is possible to identify, even within these two clusters, further forms of heterogeneity. As discussed previously, these additional forms of heterogeneity are probably attributable to variables not taken into account in our analysis (e.g., variables related to non-aviation activities as well as to the degree of outsourcing of handling activities) and may compromise the applicability of a regulation based on yardstick competition.
The findings from our analyses show the presence of a strong heterogeneity within Italian airports with respect to multiple structural and contextual factors. This, combined with the limited number of agents in each cluster, complicates the application of benchmarking models as well as the extrapolation of appropriate efficiency factors at the national level.
Given the inapplicability of yardstick regulation at the national level (Italy), one alternative would be to consider airports both in Italy and in the rest of the Europe as comparable. However, as stated previously, lack of information as well as differences in regulatory regimes across European member-states impede the analysis from acquiring adequate robustness and comparability of results and, consequently, impose a strong limit on the expansion of the reference sample.
In conclusion, we outline that both the demonstrated heterogeneity and the small sample sizes of homogeneous clusters, along with the difficulties related to international comparison, compromise the use of yardstick competition to evaluate airports’ efficiency at the national level.
Conclusion
The results of our study are twofold. First, in line with the growing debate on the need to introduce tighter regulation for airports at a European level, we empirically evaluate the ex-ante need for price regulation in the Italian airport industry. For this purpose, we identify whether the multiple forms of competition in this industry could render the application of rigid price regulation fruitless or even counterproductive. Focusing on the different forms of competition faced by airports, we point out how most of Italian airports exhibit high levels of competitive pressure both from other airports and from alternative transport means (e.g., HSR services). The price regulation in this context (i.e., presence of competition), as expounded in literature (Littlechild, 2018), might lead to counterproductive effects, such as a further decrease in competition. Therefore, regulators should avoid the application of yardstick competition to all airports indistinctly, disregarding their effective level of market power. Instead, regulators should identify specific submarkets or agents where low competition prevails and requires appropriate regulatory actions.
Second, even assuming price regulation for the airport industry is necessary, we empirically test yardstick regulation applicability to the Italian airport system. In detail, we focus on yardstick competition assumptions previously highlighted in literature, such as the effective comparability of the agents (i.e., agents homogeneity) and the presence of sufficient number of agents. In this regard, we evaluate airports’ degree of comparability with reference to four characterizing factors: size, competition, offer, and growth. For each of these features, by analyzing some representative variables we observe that Italian airports represent a highly heterogeneous sample. This result is corroborated by the findings from a multivariate analysis based on the joint use of principal component analysis (PCA) and k-means clustering algorithm, allowing us to systematically evaluate the level of heterogeneity among airports. We find that both the demonstrated heterogeneity and the resulting small sizes of homogeneous clusters, along with the difficulties related to international comparison due to different regulatory regimes, compromise the application of yardstick regulation to evaluate the efficiency of Italian airports.
Overall, a tighter regulation on the Italian airport industry, at least when applied to all airports indistinctly, seems unnecessary because of the prevalence of different and multilevel competition between airports at the national level. In addition, the possible application of yardstick competition results is undermined by heterogeneity, the relatively small number of comparable airports, as well by the challenges in gathering adequate and accurate data.
Finally, some limitations of our paper need to be pointed out. First, as regards the empirical study of the yardstick regulation applicability in the Italian airport industry, some dimensions that could affect airports’ competitive structure (such as variables related to non-aviation activities) were not considered in our analysis. Future researches could introduce these variables to explain in more detail the internal variability of the clusters. Second, even though the Italian airport system is a representative case study, as it is the fourth largest market in Europe for passengers and third in terms of passenger growth in 2018 (ICCSAI, 2019), it would yield interesting results if future research efforts include other European or extra-European countries in their samples in order to increase the robustness of findings.
Footnotes
Declaration of Conflicting Interests
The author(s) declared no potential conflicts of interest with respect to the research, authorship, and/or publication of this article.
Funding
The author(s) received no financial support for the research, authorship, and/or publication of this article.
Notes
Appendix
Measures of routes instability for Italian airports. Source: Author’s own elaboration of OAG data.

|
|
|
|
|
|
|---|---|---|---|---|
| AHO | 29% | 9% | 52% | 25% |
| AOI | 41% | 10% | 71% | 31% |
| BDS | 24% | 4% | 47% | 29% |
| BGY | 15% | 3% | 41% | 23% |
| BLQ | 5% | 0% | 52% | 29% |
| BRI | 13% | 2% | 62% | 33% |
| CAG | 15% | 3% | 45% | 35% |
| CIA | 35% | 8% | 47% | 43% |
| CIY | 11% | 8% | n.a. | n.a. |
| CTA | 10% | 1% | 66% | 52% |
| CUF | 50% | 22% | 81% | 57% |
| FCO | 19% | 5% | 44% | 19% |
| FLR | 11% | 1% | 63% | 44% |
| GOA | 17% | 16% | 68% | 41% |
| LIN | 20% | 4% | 33% | 15% |
| LMP | 7% | 4% | 67% | 82% |
| MXP | 14% | 2% | 54% | 32% |
| NAP | 15% | 2% | 48% | 30% |
| OLB | 13% | 1% | 42% | 18% |
| PEG | 33% | 15% | 40% | 27% |
| PMF | n.a. | n.a. | 63% | 58% |
| PMO | 19% | 1% | 68% | 48% |
| PSA | 6% | 1% | 36% | 19% |
| PSR | 8% | 0% | 59% | 21% |
| REG | n.a. | n.a. | n.a. | n.a. |
| SUF | 24% | 2% | 62% | 22% |
| TPS | 14% | 4% | 52% | 33% |
| TRN | 25% | 7% | 64% | 36% |
| TRS | 18% | 3% | 61% | 17% |
| TSF | 10% | 3% | 49% | 34% |
| VBS | n.a. | n.a. | n.a. | n.a. |
| VCE | 14% | 2% | 62% | 35% |
| VRN | 11% | 6% | 64% | 54% |
n.a.: not available