



Abstract
In this study, we describe the results of a questionnaire distributed among European airports in the autumn of 2019. The questionnaire was designed to elicit airports’ views on the practicalities of competition between airports. We received 49 responses from airports in 24 countries; the respondents represent airports of different sizes. The survey results evidence behaviours consistent with significant competition between airports. Airports are taking active steps through their resourcing and staffing, incentives and marketing to attract airline services, and clearly see themselves taking the initiative in doing so. No airport, no matter how large, appears to be able to escape competition. The main policy message of our study, consistent with other recent reviews of airport competition, is that European regulators should re-evaluate their approach to the economic regulation of airports, especially as far as regional airports are concerned.
Introduction
The issues of competition between airports and airport market power are gaining attention in the policy-making circles as governments around the world are rethinking their approach to economic regulation of infrastructure industries, including airports. From the point of view of Economics, airports should be subject to economic regulation of their aeronautical activities (potentially employing incentive regulation mechanisms) only when they are found to possess market power, and there is also clear evidence that this market power is being abused (or sufficient reason to believe that the airport will take advantage of its market position).
Previous studies of airport competition have considered data on passenger flows, airline entry/exits, etc. and inferred from those the competitive pressures on airports. There has also been evidence from individual airports. What has not been done so far is to look systematically at how airports perceive the pressures on them and how they are behaving as a result.
In this study, we evaluate evidence from airports’ responses to a questionnaire on the issue of airport competition and behaviours in route development. In addition to asking the airports directly to assess whether they are in competition with each other, we collect information that allows us to indirectly evaluate whether airports are actively developing their networks and taking steps to attract and retain airlines’ services. We distributed the questionnaire (see Appendix for specific questions included in it) through ACI-Europe in the Autumn of 2019. Over the 2-month period when the questionnaire was open, we received 49 responses from airports of various sizes, located in 24 different countries. Note that some responses were submitted on behalf of multiple airports, as discussed in the relevant section of this paper.
The survey results seem to be pointing to significant competition between airports. Airports are taking active steps to attract airline services, and none of the respondents noted that the initiative for new services comes predominantly from the airlines. While airlines do approach airports, an airport that is not proactive in attracting airlines should not expect to be growing as successfully as ones that are, other things equal. We also see some evidence pointing to the expected relationship between airport size and the extent of airport competition; large hub airports appear not to be as proactive as the smaller ones. Our survey does not technically allow us to evaluate the extent of market power that larger airports might possess. We however note that no airport, no matter how large, appears to be able to escape competition.
Our survey results also indicate that the majority of responses have come from the airports that are subject to economic regulation of their aeronautical charges. One quarter of respondents noted they are operating in a rigid regulatory environment, with only one in seven suggesting they are unencumbered by the regulators. The remaining respondents (over 60 percent of the total) are able to offer incentives to the airlines, despite being subject to economic regulation. This fact, coupled with the existence of airport competition, and also in light of the conclusions of the 2012 Copenhagen Economics and the 2017 Oxera reports, suggests that the European regulators should re-evaluate their approach to the economic regulation of airports.
The rest of the paper is organized as follows. The next section describes the current policy approach to the issue of airport market power, and reviews some relevant academic and policy literature on the topic. This is followed by a brief discussion of the questionnaire we distributed among the airports. Section 4 is the core of this paper – it gives a detailed description and discussion of the survey results. Section 5 concludes. The questionnaire itself is in the Appendix.
Airport market power and competition
Policy approach
The issue of market power of airports is relatively new to both academic literature and applied policy. Evaluating the extent and intensity of competition normally falls within the purview of competition or antitrust policy. The relevant authorities act as ‘general purpose’ regulators, covering markets for various goods and services (from ferrous alloys to supermarkets to airlines, just to name a few). In their work, the authorities apply general principles for evaluating market structure and anticompetitive conduct. This includes using conventional market concentration metrics such as 4-firm concentration ratio 1 or the Herfindahl-Hirschman Index (HHI) 2 ; and evaluating anti-competitive practices using generally defined methodology applied to specific markets. The competition policy authorities have the power to block proposed mergers (or impose remedies as conditions for approving the mergers), and are in charge of preventing and stopping anti-competitive conduct.
The general perception of the airport market power issue among both policymakers and the industry is rather dichotomous: an airport is either perceived to be a monopolist, or a conclusion is made that there is competition among the airports. Such issues as measuring the concentration of airport markets, evaluating intensity of competition between the airports and potential anti-competitive conduct of airports have been given limited consideration in either academic or policy research. Generally speaking, the issue of airport competition has not been clearly placed by the regulators within the standard structure-conduct-performance framework. In this study, we also will not go beyond acknowledging this fact.
Competition policy authorities have, however, intervened in airport markets on some occasions. Most notably, the UK Competition Commission in 2009 concluded that the BAA 3 had to divest itself of one of the London area airports (Heathrow or Gatwick), as well as of either Edinburgh or Glasgow airports. This recommendation followed the conclusion that BAA possessed market power in London area and Scottish airport markets. Mergers and acquisitions involving airport management companies (such as TAV Airports acquiring 49 percent ownership of Antalya airport in 2018) are subject to general oversight by the national or regional competition authorities.
The concept of airport market power is not being applied consistently in policymaking around the world. To begin with, no consensus on the market definition exists. Airports are multi-product companies, perhaps to a larger extent than we find in other infrastructure industries. Also, there are considerable idiosyncrasies with respect to the importance of different services for different airports. This means in particular that both sources of market power and the market power assessment exercises will necessarily be case specific to a certain extent.
Few countries have conducted airport market power assessments. The UK Civil Aviation Authority implements market power assessments regularly. As a result of those exercises over the last decade or so, the regulator has removed Manchester and London Stansted airports from the list of airports subject to price regulation. Currently, only London Heathrow and London Gatwick out of about a dozen UK airports with passenger throughput over five million passengers per year 4 face economic regulation of their aeronautical charges, and the system at Gatwick has become more light-handed than previously (and than that applying at Heathrow). An assessment of market power of Irish airports, conducted in 2015 5 , determined that Dublin airport has significant market power, while Shannon and Cork were subject to effective competition. An assessment of market power of Amsterdam Schiphol airport, conducted a decade ago, suggested the airport has market power on all the markets identified in the study (unlike, for instance, UK market power assessments, the Schiphol market power study made a distinction between origin-and-destination and transfer passenger markets). Most recently, an Australian Productivity Commission report indicated that Australia’s monitored airports do possess market power 6 ; however, the Commission concluded that they do not abuse it and that the existing light-handed monitoring regime should, with a few adjustments, continue.
The most comprehensive recent assessments of the issue of airport market power can be found in the 2012 report by Copenhagen Economics 7 , and the 2017 report by the consulting company Oxera 8 . These reports analyze the issue in the European context (while also accounting for the competition from hub airports outside Europe). The former report concluded that recent developments in the European airline industry had intensified competition between airports. The Copenhagen Economics report further suggested that regulators should consider direct economic regulation of airport aeronautical charges only where such action is absolutely necessary to limit the airport’s market power. Note that absence of direct airport economic regulation does not mean the airports are allowed to act as they see fit – it simply means that rather than being subject to sectoral economic regulation the airports will be under the purview of general competition policy rules 9 .
The 2017 Oxera report acknowledges that airports now compete with each other in three main ways. First, there is competition on a pan-European scale, as a result of the growth of point to point airlines which have greater freedom as to where to locate their services; this applies to the retention of existing services as well as new services. The report points to considerable route churn in Europe as evidence of such competition, and notes that large airports have become less immune to it. Second, airports compete for connecting passengers, and this competition also takes place between airports outside Europe as well as within it. The report points to increasing competition from the Middle Eastern and Turkish airports in this dimension. Third, airports compete for passengers in their local area.
On the other hand, Wiltshire (2018) suggests that passengers’ preference to travel from their local airports, coupled with the airlines’ switching costs, will imply that secondary airports will not be able to provide effective competition to primary gateways in the metropolitan areas. This conclusion mirrors both the findings of the Schiphol market power assessment for the origin-and-destination traffic; and is also reflected in the fact that the UK CAA has retained economic regulation of Heathrow and Gatwick despite the presence of four 10 other airports in the metropolitan area providing commercial passenger services. More importantly, we can clearly see the presence of opposing views on the issue of airport market power.
Academic Studies
Theoretical treatment of airport competition issue is complicated by the fact that, while it is natural to model airports as profit-maximizing entities in Economics modeling exercises, the reality is oftentimes different. Airports have been set up meet a plethora of social, administrative, political, and military objectives, and not just the profit motive. Yet, in the available theoretical work touching on airport competition, the airports are modeled as profit-maximizing firms. The most notable studies in this area include Pels et al. (2000), Yan and Winston (2014), and Pilar Socorro et al. (2018). In all the models, the competing airports are assumed to have overlapping catchment areas. Our work here – as well as the policy research referenced in the previous sub-section – demonstrate that overlapping catchment areas may not be a sufficient condition for airport competition, as some remotely located airports may be competing with each other.
Academic studies giving a general overview of the issues of airport competition and market power include Starkie (2002), Polk and Bilotkach (2013), Thelle and la Cour Sonne (2018). Case studies on airport competition have been offered by Lian and Rønnevik (2011), Pels et al. (2003, 2010), Forsyth et al. (2016), Starkie (2004), Bilotkach and Polk (2013), among others. There are also two (rather thin at this point) strands of academic literature related to the effects of airport competition. The first examines its effects on airport operations and efficiency. Tapiador et al. (2008) and Adler and Liebert (2014) concluded that airport competition increases airport efficiency, using mostly European data. On the other hand, Heymann and Karollus (2015) and Ülkü (2014) reach the opposite conclusion, suggesting that several airports with overlapping catchment areas will lead to inefficiently small traffic levels at each of them, and higher average costs.
The second strand of literature examines the relationship between the airport competition and airport aeronautical charges. Bel and Fageda (2010) find that presence of other airports in the vicinity decreases aeronautical charges. Bilotkach et al. (2012), however, find no statistically significant relationship between the two variables. More recently, Bottasso et al. (2017) found a link between airport competition and aeronautical charges (more competition in terms of overlapping catchment areas leading to lower charges) in the UK setting.
This study seeks to add to this body of work by effectively looking at competition as matter of dynamic rivalry between airports and so examining whether the behaviour of airports is consistent with a general finding of competitive pressures, or otherwise, and how this might differ between different types and sizes of airport. In this sense it is examining the practical impact of competitive pressures on airports.
The questionnaire
To achieve an understanding of airports’ views on the practicalities of competition between the airports we devised a short questionnaire, which was distributed through ACI Europe to the member airports in mid-October of 2019. The respondents were given a link to the survey on SurveyMonkey® platform. The link remained active until early December 2019; the potential respondents received several reminders to complete the questionnaire. Participation in the survey was completely voluntary – no incentives were offered for participation, while choosing not to participate did not yield any negative consequences. The participants were further assured (see Question 1 of the survey in the Appendix) that no individual answers would be published, and that the list of airports that chose to complete the questionnaire would not be made public. These points should be kept in mind by the reader. While the authors would welcome further inquiries on the questionnaire, please note that we will be unable to disclose individual airports’ answers in our responses.
The questionnaire is presented in its entirety in the Appendix. One can see that the questionnaire includes questions of different types: from Yes/No to multiple choice to free response questions. Some questions are of mixed nature: for instance, questions 15, 18, and 19 are multiple choice questions, with one of the options allowing the respondent to list a choice that is not otherwise included. The questions were presented to the respondents in the same order as they appear in the Appendix. No questions were made mandatory – i.e. a respondent could choose not to answer any of the questions, and submit their response leaving any of the questions blank. A respondent could also return to any of the questions at any time and amend their answers before submitting their response. That is, even though the questions were presented in a certain order one at a time, respondents could choose to answer them in any order they wished.
The questions included into the survey were meant to cover two key issues. First, we wanted to inquire about the issue of resources allocated by airports to network development. Questions two through 12 are dedicated to this. The second key issue is the relationships between the airports and the airlines, including such points as the incentives offered by the airports; the factors that attract the airlines to the airport (and why the airlines leave when/if they do); and the differences between low-cost and network airlines from the point of view of airports.
To encourage participation, we designed the questionnaire to take a reasonably short amount of time for the respondents to complete, without distracting them from their day jobs. Since the respondents were not required to fill out the questionnaires, we relied on their free will to do so. SurveyMonkey allows us to see how much time passed between the respondent opening the questionnaire and when the answers were submitted. In fact, the median time spent on the questionnaire among the submitted responses was under 12 minutes, with the minimum being under 3 minutes and the third quartile at 17 minutes. Several respondents that submitted their questionnaires hours after opening it (which does not, of course, mean they have spent hours filling out the questionnaire) moved average time spent with the survey to nearly 30 minutes, with the maximum recorded time from opening of the survey to submission at over 8 hours.
Results and analysis
The first valid survey response was submitted on October 23, 2019. We kept the survey open until December 7, 2019. The last response was received on December 5. Overall, we received 50 responses; with six of those representing more than one airport (four responses were submitted on behalf of two airports, and two responses came from multiple airports). Several respondents left the answer to the first question (airport name) blank; however, we were able to use the IP address recorded by SurveyMonkey to retrieve the airport identity for the purposes of analyzing the size category to which it belonged. Four airports submitted two sets of responses each: in one case, the first response was clearly incomplete (we received a fully completed questionnaire from that airport several days later), so we decided not to use it in our analysis. In other cases, we have retained all the answers to the free response questions and used the first set of responses received for the other questions. Thus, we are using 49 responses overall; however, for analysis of the non-free-response questions, 46 completed questionnaires have been used.
We received responses from a diverse set of airports. We received responses from airports in 24 different European countries. Most responses came from the European Union and the UK airports 11 ; however, four questionnaires from outside the EU/UK were received. The survey responses came from some of the largest airports in Europe, as well as from some smaller ones. We have decided, for the purposes of this analysis, to differentiate between hub airports and non-hub ‘regional’ gateways. Among the respondents, we have 15 airports which serve as a hub operator for a network airline. Note that some network airlines (most notably, Lufthansa Group, IAG, and Air France – KLM) operate multi-hub networks. Within the hub airports, we will also make a distinction between ‘Large Hubs’ and ‘Smaller Hubs’, the former being hub airports within the top-10 in Europe by passenger traffic, according to the 2019 data. The remaining responses came from the airports that we have generally classified as ‘regional’. These are the airports that do not handle much (if any) transfer traffic. Some of these regional airports can be found in Europe’s top-50 lists by passenger volume; however, most of them are indeed smaller gateways.
The main reason for differentiating between the hub and non-hub airports was to account for the possibility of countervailing power of the airlines operating the hubs (Polk & Bilotkach, 2013). We could of course suggest that low-cost carriers could similarly have countervailing power over the smaller regional airports. However, we only have received three responses from such airports. It could be suggested that the small number of such small gateways dominated by a single low-cost carrier represents a case of selection bias. At the same time, the substantial number of larger hub airports that responded to our questionnaire suggests that if our data are biased, the bias is if anything towards concluding that there is less competition between the airports where it is present rather than towards stating that there is competition when there is none.
We will next report the question-by-question survey results, with some supporting analysis. General conclusions will be provided in the next section of the paper.
Does your airport devote resources to route development?
All respondents gave an affirmative answer to this question.
If your airport devotes resources to route development, they include:
Marketing support (i.e., assistance short of actual financial help or incentives) only Financial incentives only Both
About 8 out of 10 respondents indicated that they use both marketing support and financial incentives. Among the few remaining respondents, the number of airports that use only marketing support is the same as the number of airports using only financial incentives.
Comparing the route development budget now to 5 and 10 years ago
There is a clear pattern here: airports have reported devoting more funds to route development than either 5 or 10 years ago. More specifically, 38 out of 46 respondents have reported a significant or small increase in route development budgets as compared to 5 years ago; the corresponding number of respondents for the comparison with the budget 10 years ago is 36. Interestingly, hub airports are less likely to report increased route development budgets as opposed to the ‘regional’ gateways. As we can see from Table 1 below, one third of hub airports have reported decreased route development budgets; whereas majority of regional airports have indicated that their route development budgets have gone up.
Route development budget dynamics by airport type.

Note: numbers in the table correspond to the number of respondents choosing the relevant option.
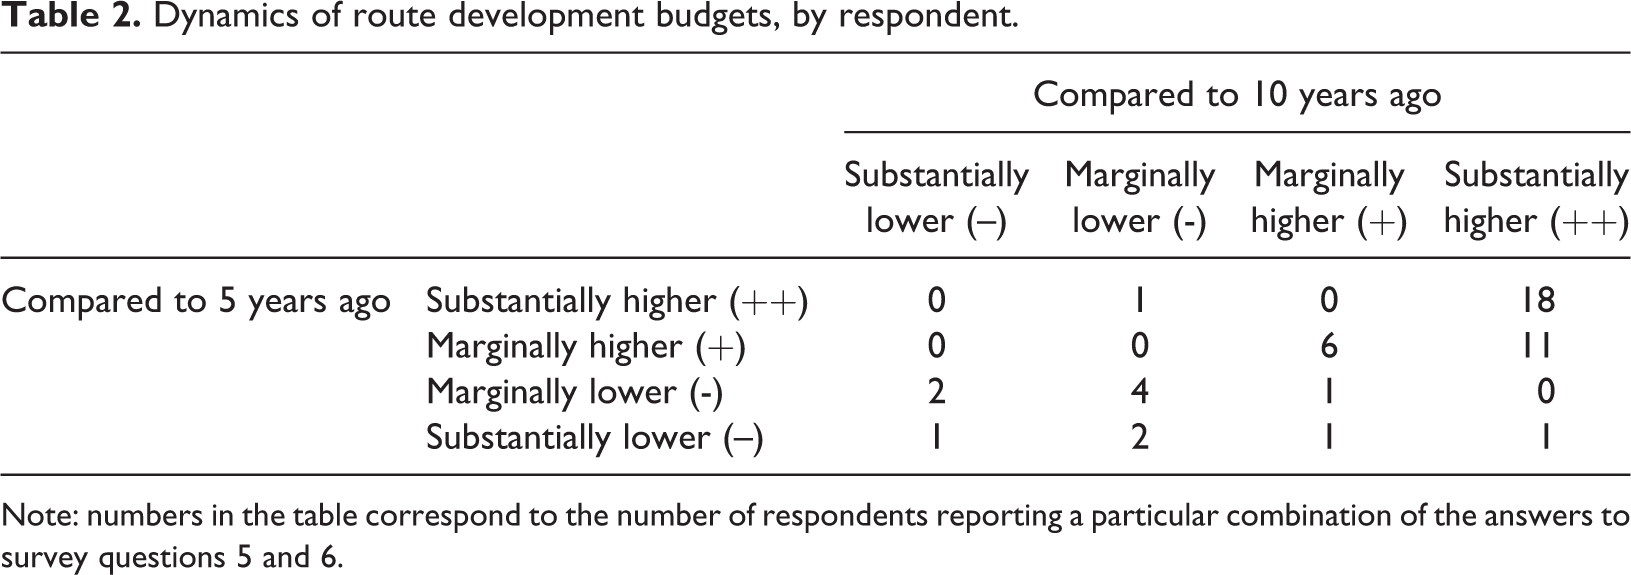
To shed further light on the dynamics of route development budgets among the respondents, Table 2 summarizes the information on the airports’ responses to questions 5 and 6. Basically, the upper right quadrant of Table 2 corresponds to the cases where an airport reports higher budgets now than both 5 and 10 years ago. On the other hand, in the lower left quadrant we have the cases of airports reporting current budgets being lower than both 5 and 10 years ago. The airports reporting higher budgets than 5 years ago but lower than 10 years ago are in the upper left quadrant. Finally, the lower right quadrant is where we find respondents which report higher budgets now than 10 years ago, but lower than 5 years ago.
Dynamics of route development budgets, by respondent.
Note: numbers in the table correspond to the number of respondents reporting a particular combination of the answers to survey questions 5 and 6.
We can see that 35 out of 46 respondents report higher route development budgets now than both 5 and 10 years ago. There are, however, nine respondents which report that their route development budgets are lower now than they were either 5 or 10 years ago. For three respondents, their route development budgets are higher now than 10 years ago, but lower than they were 5 years ago. Finally, there is one respondent which reported a higher budget now than 5 years ago; but 10 years ago its budget was even higher than it is now.
It will be interesting to see later on how the current COVID-19 pandemic affects the resources airports devote to route development. However, this is obviously a question to be addressed in future studies.
Manpower devoted to route development
Question 7 of the survey asks the respondents about the number of full-time equivalent (FTE) employees working on route development. One respondent omitted this question (indicating that the route development was done at the airport system level); several gave partial answers (indicating the number for the current time period, but not for the past). There were also some cases where the answers were given as a (narrow) range rather than a precise number. In those cases, we have used the midpoint of the reported range when calculating the averages reported below.
All respondents reported non-zero FTE numbers for the present time. The minimum reported number was 0.5, with 12 being the highest FTE number reported. Overall, as compared to 10 years ago, an average respondent employs one additional worker in the route development function: the number of FTEs working on route development has increased from the average of 3.7 ten years ago to 4.7 at the time the survey was conducted. Just as with the budgets, we see a greater emphasis on route development among the smaller regional airports than across the hubs. In fact, an average large hub airport employs as many people in its route development now as it did 10 years ago. At the same time, an average regional airport (of those reporting the numbers at each time period) increased the number of workers in this function by over 50 percent, from 2.7 ten years ago to more than 4 now. The difference in the number of route development workers between the hub and non-hub airports has also shrunk over time. Ten years ago, for each worker in the route development function employed by a regional airport, a hub airport employed two. Now, the corresponding ratio is around 1.5. Table 3 reports the numbers presented in this paragraph. Growing capacity constraints at larger airports might be one factor behind this convergence of route development resourcing, in our opinion. Such airports may not have needed to expand their resources, though will still need to devote resources to optimizing route structures and competing for high value services.
Average FTE in route development.

Note: averages are only reported across the respondents that answered all parts of the corresponding question
Another interesting fact is that the number of airports reporting higher headcount in the route development function currently than 5 years ago (22) is close to the number of airports reporting substantial increase in the route development budget over the same time period (19). At the same time, there is relatively little correlation between the two: a substantially higher development budget goes hand in hand with higher route development headcount only in one case out of four.
Employing outside consultants
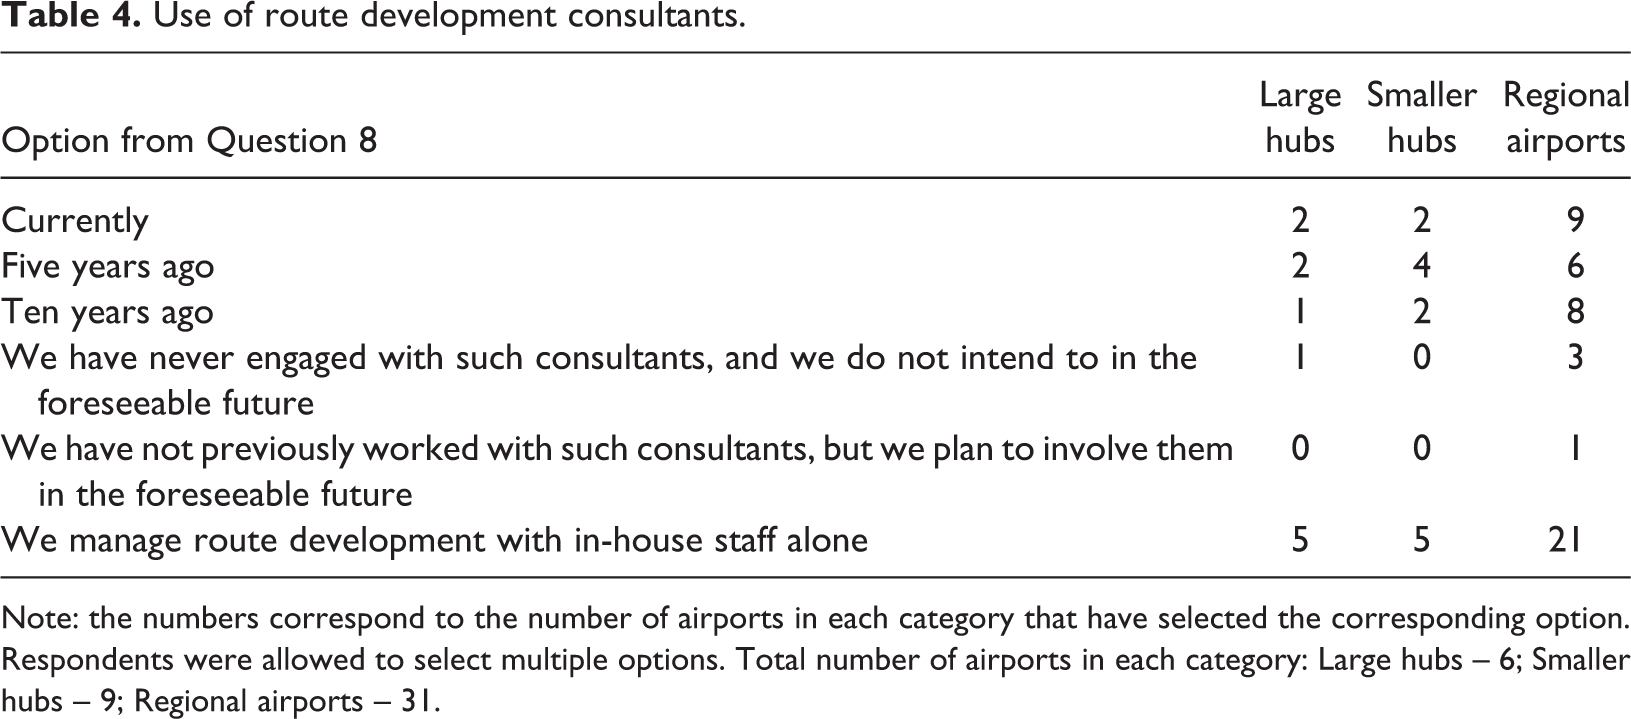
In response to this question, 13 respondents noted they were currently using external route development consultants; 12 have used them within the last 5 years; and 11 have employed them within the last 10 years. Four respondents ticked all three options indicating they have been consistently using external route development consultants. Thirty-one respondents indicated they perform route development in-house. Of those, 21 performed all route development in-house recently, reporting that they have not used external consultants either at present or within the last 5 years.
The number of respondents indicating they had not used external consultants at any time within the last 10-year period was also 21. Two of those respondents indicated that they do not do in-house route development; one of them plans to employ external route development consultants in the near future, while the other one does not have such plans. We also did not find any correlation between the number of employees in the route development function and the respondents employing outside consultants.
We can only conjecture about airports’ motivation for employing or not employing external route development consultants. It is also not very clear how the fact that a number of respondents did not answer that they perform route development in-house corresponds to the fact that each airport has someone on their staff working in route development function. Our survey was not designed to address these considerations directly. We can however see how the answers to this question differed across the three airport types we have identified here. This information is reported in Table 4.
Use of route development consultants.
Note: the numbers correspond to the number of airports in each category that have selected the corresponding option. Respondents were allowed to select multiple options. Total number of airports in each category: Large hubs – 6; Smaller hubs – 9; Regional airports – 31.
We can see from Table 4 that, in relative terms, hub airports are more likely to be employing outside consultants as opposed to the non-hub airports. Two thirds of respondents representing hub airports indicated they either are working with outside route development consultants now, or did so within the last 5 years.
Participation in routes conferences
Routes conferences are events where airlines and airports meet to discuss potential new non-stop services. They are essentially matching events, which happen throughout the world several times a year. All respondents appear to be active participants in those gatherings: all but one respondent indicated their airport (or a group of airports) participated in those events this year, with a majority of respondents attending the World Routes Conference which took place in Adelaide, Australia, only a month before the survey was distributed. The one respondent that did not attend any routes conferences in 2019 did so in 2018.
Among 40 respondents that answered the question on the number of airlines they usually meet at routes conferences, the average was 27.7 with the standard deviation of 14.5. Note that several respondents gave a range rather than a specific number in response to this question. In that case, we used the mid-point of that range in calculation of the above-reported average and standard deviation. Not surprisingly, hub airports tend to meet with more airlines as compared to non-hub regional airports (38 versus 23).
Other route development activities
Question 13 of the survey asked respondents to comment on other route development activities they might be undertaking. The respondents could choose either or both of the two pre-set options (visits to airline headquarters, and co-operation with local government, tourist authorities, chambers of commerce). In addition, the respondents could volunteer other route development activities they might organize/participate in.
Each respondent indicated they visit airline headquarters, and 9 out of 10 also co-operate with local government, tourist authorities and chambers of commerce as part of their route development activities. Among other options noted by the respondents were IATA slot conferences; trade shows and exhibitions; co-operation with major corporate offices in the local area; and joint marketing activities with airlines. Several respondents also mentioned reduced charges to new airlines or tailored services. This issue is however covered further in the questionnaire, and will be discussed in more detail later on.
Regulatory environment
Question 14 asked about the economic regulation the airport is facing. The majority of respondents (6 out of 10) chose the option ‘We are subject to price regulation, but are still able to provide targeted incentives to airlines’. One out of four (10 respondents) suggested they are subject to rigid economic regulation, without the ability to offer incentives to airlines. The remaining six respondents told us they are not subject to any formal price regulation.
Not surprisingly, the majority of the airports that are not subject to formal regulation (five out of six) are classified as non-hub airports. Only one airport that we classified as a smaller hub indicated it is free to set its aeronautical charges. Of the 10 airports that told us they are subject to rigid price regulation, five are hubs (three are classified as major hubs and two as smaller hubs).
We need to note two things regarding these results. First, there is a possibility that airports not subject to formal regulation are under-represented in our sample. For instance, only a handful or regional UK airports responded to the questionnaire 12 . However, this potential sample selection is more likely to bias our conclusions towards concluding there is less competition between the airports when more competition is present rather than to suggest that there is competition when it is absent. The second observation, which we will elaborate upon later, is that different airports (or at least people charged with filling out our questionnaire) may not assess their regulatory environments consistently. For instance, two of the respondents which indicated that they are subject to rigid regulation also indicated in their answer to question 15 that they negotiate new route incentives with individual users.
Incentives
Questions 15–17 inquire about the incentives offered by the airports to the airlines. The incentives take the form of reduced charges for new services, and/or volume discounts. In response to question 15, 7 out of 10 respondents noted that they offer standard incentives for new services. It is our understanding that these incentives take the form of reduced charges for a limited time after the new service is introduced – we have not however inquired about the detail of these incentives. About 15 percent of respondents indicated they do not offer incentives for new services, with the remaining 15 percent noting that they negotiate such incentive packages with individual carriers (as opposed to offering standard packages, which is the most common option).
The purpose of question 16 was to inquire of the airports, which of the common incentive options (discounts for new airlines, new services, volume discounts based on the passenger volume or the number of movements) are available to their customers. The respondents also had an opportunity to comment on any other incentives they might offer, which do not fall under any of the four common categories.
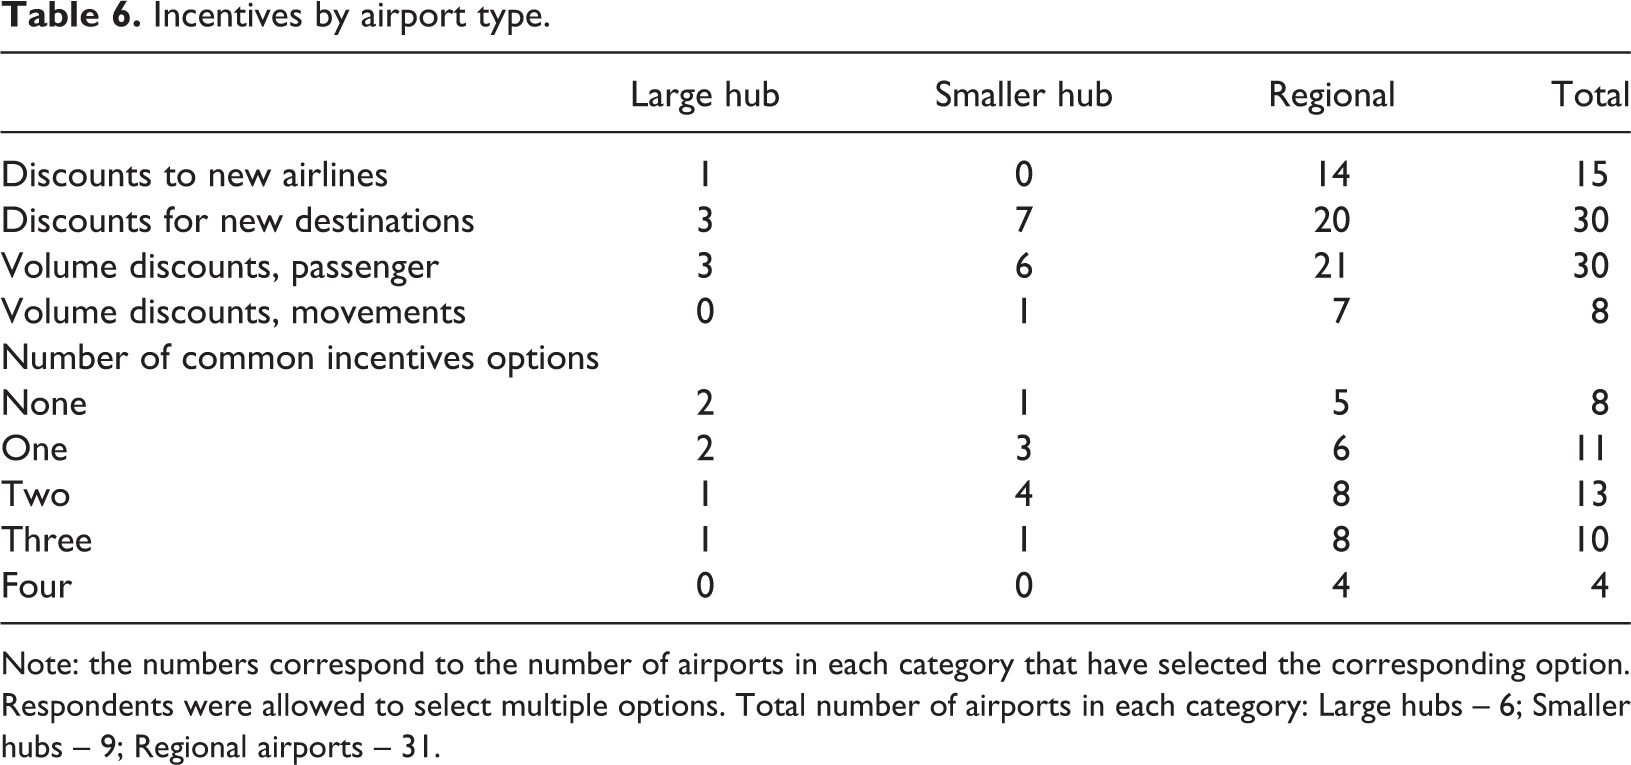
The takeaway message from the analysis of responses to this question is that non-hub regional airports tend to offer more varied incentive packages to the airlines as compared to hub airports. Discounted charges for new routes, as well as passenger-based volume discounts are the two most popular incentive options offered: these options were chosen by 30 out of 46 respondents. Fifteen respondents (a bit under one third) offer incentives to new airlines: notably, only one of the 15 hub airports that responded to our survey noted they were offering this incentive – the remaining 14 ticks came from regional non-hub airports. Volume discounts based on the number of aircraft movements is the least popular incentive option, offered by only eight respondents (seven of which are non-hub airports). Other types of incentive that appear reasonably popular among the respondents included incentives for growth (10 respondents indicated they were employing such incentives in one or the other form); rebates for off-peak flights (three respondents); and discounts for transfer passengers (two respondents). Some respondents also were using some targeted incentives, such as rebates for long-haul services or thinner routes.
Table 5 reports on the variety of incentives reported by the respondents, while Table 6 gives the breakdown of responses by the three airport types we have identified. From Table 5 we can see that eight respondents reported not offering any of the four most common types of incentives (yet six of them reported offering some incentives based on growth or other factors). On the other end of the spectrum, four airports reported using all four common incentive options. Where an airport offers one or two incentives, these are equally likely to come in the form of either discounts for new routes or passenger-based volume discounts. From Table 6 we can see that regional non-hub airports are more likely to be offering more common incentive options. We also observe that discounts for new airlines and volume discounts based on the number of aircraft movements are almost exclusively offered by the non-hub airports.
Number and types of common incentives options.
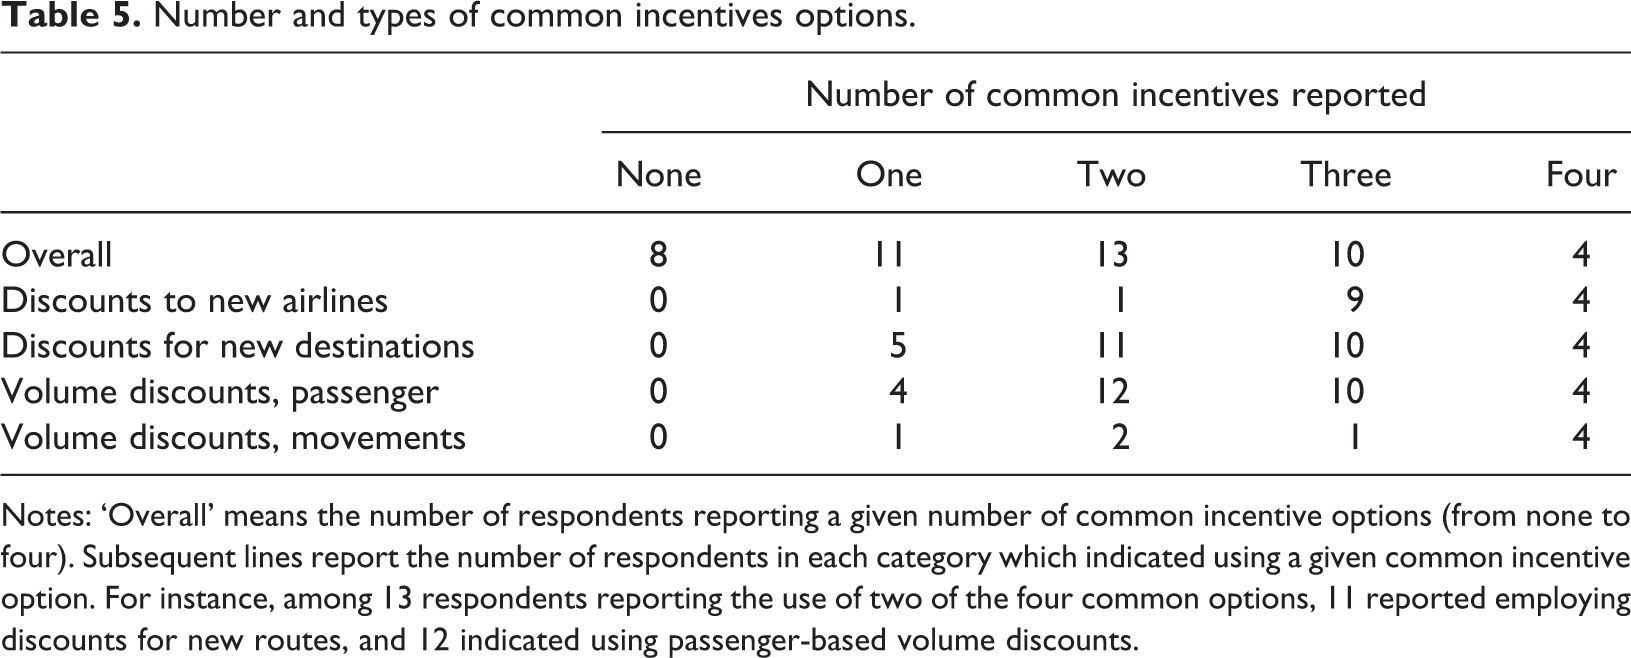
Notes: ‘Overall’ means the number of respondents reporting a given number of common incentive options (from none to four). Subsequent lines report the number of respondents in each category which indicated using a given common incentive option. For instance, among 13 respondents reporting the use of two of the four common options, 11 reported employing discounts for new routes, and 12 indicated using passenger-based volume discounts.
Incentives by airport type.
Note: the numbers correspond to the number of airports in each category that have selected the corresponding option. Respondents were allowed to select multiple options. Total number of airports in each category: Large hubs – 6; Smaller hubs – 9; Regional airports – 31.
Airline entry and exit
The key takeaway messages from questions 18–20 are the following. First, an airport cannot afford to be complacent and wait for the airlines to show up: a pro-active approach is required to attract new airline services. Second, airports appear to have more confidence in their ability to attract airlines through lower charges and incentives than in retaining services on routes that are not profitable for airlines by offering lower charges or better airport services. Level of passenger demand appears, understandably, to be a key factor behind airlines’ decisions to enter and exit markets, the implication being that incentives and assistance from the airport can encourage an airline to exploit a market opportunity but cannot of themselves create that opportunity
Question 18 inquires about the process of attracting new airlines. The respondents were asked to indicate whether the initiative in this process comes from the airport or the airlines. None of the respondents told us that the initiative in most cases comes from the airlines. Instead, 7 respondents out of 10 indicated that they (the airport) are the first to approach the airlines; with 3 out of 10 airports noting that there was no clear pattern in the process. Interestingly (but not unexpectedly), non-hub airports were a bit more likely to indicate that the airports tend to take the initiative when trying to attract the new airlines. Specifically, 60 percent of hub airports noted they take the initiative in the process, as opposed to nearly 80 percent of non-hub gateways.
Questions 19 and 20 were designed to obtain respondents’ opinions on the key factors behind airlines’ decision to enter and exit routes, with specific emphasis on whether airport charges and incentives played a role in airlines’ decision-making. In addition to the four options (the respondents were not limited to selecting one choice), respondents could name any other factors they considered relevant to airlines’ decisions to enter or leave routes.
All four factors we included in question 19 as potential contributors to airline entry decisions have been noted as important by a considerable number of respondents. Three-quarters of respondents indicated that incentives are an important factor in attracting new services from airlines. The next most frequently selected option was the level of charges – this option was selected by 7 out of 10 respondents. Slot availability was indicated as a factor in attracting new services by 57 percent of respondents, noting that a challenge for even fully unconstrained airports may be the slot at the destination airport if the proposed route is to a congested airport, while 47 percent of the respondents noted that quality of airport operations/services is an important attractor for the airlines. Note that five respondents did not choose any of the four options we have pre-set for this question; however, each of them has written in additional factor(s) in the ‘Other’ field.
Not unexpectedly, a significant number of respondents noted in the questionnaire that passenger demand is an important driver of airlines’ decisions to launch new routes. Twenty-one respondents wrote this into the ‘Other’ field in question 19 (using different formulations). Several respondents explicitly noted that market demand is the single most important factor in airlines’ decisions to start new services. Other factors written in were marketing support (noted by three respondents), potential for access to connecting flights, and stakeholder engagement.
All but one respondent named commercial viability of the route as a factor in airlines’ decisions to curtail or discontinue services. Less than one in three indicated that the level of airport charges (implying, obviously, that this level is high) could drive the airlines to reduce or even discontinue their presence at an airport. The other two options (slot availability and airport operations/services) were not chosen frequently (by 6 and 2 percent of the respondents, respectively).
‘Other’ options written in by the respondents as factors behind airlines’ exit decisions include the following. Seven respondents noted that airlines have left routes due to bankruptcy, other financial problems, or strategy changes. Two respondents cited ‘competitive pressures’, without clearly specifying whether those were related to the airlines or airports. Two responses specifically noted that airlines had left due to better offers received from competing airports. Codesharing was also noted once as a reason for an airline departure – potentially implying that an airline had surrendered its feeder route, and now relied on a partner carrier to bring traffic to its hub airport.
Consistently with what we did when describing responses to other questions, Table 7 gives the breakdown of responses to questions 19 and 20 by the three airport types we have identified. Unlike what we observed with the other issues covered up to now, there is little difference between hub and non-hub airports in terms of the factors related to airline entry and exit. One exception is the issue of slots – predictably, this issue is relatively more important to hub than non-hub airports. Slot availability was noted as a factor facilitating airline entry by 80 percent of hub airports (12 out of 15); whereas only half of non-hub airports pointed to this factor when asked about airline route entry factors.
Airline entry and exit factors.

Note: the numbers correspond to the number of airports in each category that have selected the corresponding option. Respondents were allowed to select multiple options. Total number of airports in each category: Large hubs – 6; Smaller hubs – 9; Regional airports – 31.
Perception of competition between the airports
Questions 21 and 22 ask for respondents’ perception of competition between the airports. Question 21 asks whether airlines directly advise the airports that they are in competition with alternative gateways for the airlines’ services; while question 22 asks for airports’ perception on the airport competition issue. While the answers here are inevitably subjective and cannot alone establish the existence of competition, they are nevertheless consistent with the findings of the Copenhagen Economics and Oxera reports on the extent of competitive pressures to which airports are subject. While such pressures appear to exist at all airports that does not necessarily imply absence of market power in all cases. Competition can co-exist with market power. As with any other market, we can and should talk about market power as a matter of degree rather than as a dichotomous notion.
Respondents have overwhelmingly reported that they are both advised by airlines that they are in competition with other airports; and they perceive that airport competition exists. Only two respondents noted that airlines do not advise them that they are in competition with other airports. Also, two respondents indicated that they do not believe they are in competition. The former two airports are different from the latter two; and they are all classified as non-hub regional airports. In each of those cases, there are indeed no alternative gateways within the respective airports’ catchment areas.
Network versus point-to-point carriers
The last two substantive questions of the survey inquired about the airports’ view of the differences between the ‘traditional’ network carriers and the so-called ‘low-cost’ airlines. One way in which LCCs in Europe differ in their business models is the almost exclusive reliance on point-to-point traffic. This was reflected in the wording of questions 23 and 24. The majority of respondents indicated that there are clear differences between the behaviour of network and point-to-point carriers. Only six respondents noted that they do not believe such differences exist. When asked to elaborate on the differences in interactions with point-to-point versus network airlines (open-ended question 24), the points in the paragraphs below were noted. We should note that 31 respondents out of 46 gave substantive responses to this question, indicating the importance of this issue to European airports.
In general, the planning horizon of the point-to-point low cost airlines tends to be short-term (note that unlike in other parts of the world, the low-cost airlines in Europe tend to operate point-to-point services, with limited if any cooperative arrangements with other carriers). Network carriers, on the other hand, tend to develop long-term relationships with the airport. Several respondents indicated that the point-to-point low cost carriers tend to select among several destinations. Network carriers, considering their networks, evaluate an airport’s attractiveness based on the potential for beyond-the-hub traffic that can be generated by a service from a given airport. One respondent noted that the network airlines have different infrastructure requirements from those of the point-to-point carriers; without specifying further details. This observation is echoed by other respondents, who noted that network carriers focus on full passenger experience at an airport; while point-to-point airlines are more interested in lower charges.
Overall findings from the airports’ responses
Based on the analysis of the airports’ responses, the following findings stand out. First, the majority of airports have reported increasing route development budgets over the last 10 years. At the same time, half of the airports that can be classified as major hubs are reporting decreases in such budgets over the last 5 years. Second, while only some airports have reported decreases in the number of employees involved in route development over the last 5 years, larger airports were more likely to report such declines though that has to be seen in the context of their use of external consultants. Third, 45 percent of respondents noted that they have over the last 5 years performed route development work in-house, without involving outside consultants. Larger airports are somewhat more likely to hire outside route development consultants, possibly reflecting greater availability of resources to do so. Fourth, the most popular incentives offered by the airports responding to the survey are lower charges for new destinations and quantity discounts based on passenger volume. Smaller airports are more likely to offer a variety of incentives to airlines, as compared to larger airports (some of which might be constrained by economic regulation in terms of what they can offer). Nearly half of the respondents indicated that they offer incentives tailored to attract particular airline(s). Fifth, incentives, level of charges, and the general level of passenger demand have been indicated as the key factors that attract the airlines to a specific airport. While availability of slots and quality of airport services were also important, fewer respondents chose these as ‘key’ factors. Sixth, all but one respondent noted that the key factor in airlines’ decisions to reduce services at an airport or exit it altogether is the level of passenger demand. At the same time, about one third of respondents named the level of airport charges as a factor that can sway an airline to leave or reduce its presence at an airport. Seventh, about half of the respondents indicated that airlines specifically advise them that they are in competition with other airports for the airline’s services. Eight out of 10 respondents feel that their airport(s) compete with others for airlines.
Conclusions
Studies so far of airport competition have focused on assessing the competitive pressures on airports and on the trends in these. In particular, there has been a focus on the development of low-cost point-to-point airline models and the resulting (relative to hub-focused network models) potential for airlines to switch between airports. There has also been a focus on hub-on-hub competition, hub by-pass and the competition for passengers where catchment areas overlap. The increasing consensus, elaborated in two recent reports, and reflected now in the policy statements of the EU, has been that there has been an increase in airport competition in Europe. The implications for airport regulation remains an area of contention.
There has so far been less focus on how far, and in what way, the forces making for increased airport competition have been reflected in the behaviours of airport management. This study, based on a questionnaire sent to airports, helps to fill that gap. It finds that the presumptions about airport competition are borne out at the individual airport level. Of particular note are the widespread use of incentives, including those tailored to particular airlines, and the proactive approach that airports take to attracting airlines; they do not simply wait for approaches. While this is most true of regional airports and smaller hubs, even larger hubs appear to be seeking out airline customers. Even where there may be market power, it looks to be diluted by some degree of competitive pressure. Across the sector overall, the responses seem to point to increased competition over time. Among the largest hubs there has been a marginal reduction in resources devoted to attracting airlines. That would not be surprising given the growing scarcity of capacity in that segment of the market. However, it is notable that all the responding airports, whatever their size, attended routes conferences, held meetings with potential airline customers and continued proactively to seek new customers.
At the same time, many airports that responded to our study indicated that they are subject to (sometimes restrictive) economic regulation of their aeronautical charges. This is true for airports across the spectrum – both larger hub and smaller regional airports have indicated in their responses that they are subject to regulation. The regulatory environment airports find themselves in might prevent them from using all the possible tools to compete effectively for airlines. The key policy implication of our work is therefore that the regulators should re-evaluate their approach to economic regulation to determine whether it is needed and, where it is, to ensure that there is sufficient flexibility in the regulatory architecture to enable airports to respond to competitive pressures. This is especially true for regional airports; however, our results indicate that some hub airports might be facing strict economic regulation despite being subject to significant competition.
Our study is of course subject to the conventional limitations of survey work, most importantly the potential for the bias due to sample selection. Larger airports are clearly better represented among the respondents than smaller ones. It also appears that a number of smaller airports that we know are not subject to economic regulation of their aeronautical charges have decided not to take part. At the same time, the substantial number of hub airports that responded to our questionnaire suggests that if our data are biased that bias would be towards concluding that there is less competition between the airports where it is present rather than towards stating that there is competition when there is none.
Footnotes
Acknowledgements
We thank ACI Europe, and in particular Michael Stanton-Geddes, for their assistance in distributing the questionnaire to the airports. Michael’s excellent and insightful comments on previous drafts of the paper are also acknowledged. Two anonymous referees have provided insightful comments, which were instrumental in improving this manuscript.
Declaration of Conflicting Interests
The author(s) declared no potential conflicts of interest with respect to the research, authorship, and/or publication of this article.
Disclaimer
Any statements and opinions in this paper represent the view of the authors, and should not be construed as reflecting official positions of any of the organizations the authors are or have been affiliated with. While ACI Europe assisted us in distributing the questionnaire to the airports, we have not received any funding for this study from ACI Europe or any other organization. No statements or opinions in this paper may be construed as representing an official position of ACI Europe.
Funding
The author(s) received no financial support for the research, authorship, and/or publication of this article.

Notes
Appendix – Questionnaire sent to the airports
The purpose of this questionnaire is to collect the information on the actions airports undertake to attract and retain airline customers, and to gain an understanding of the dynamics of airport-airline relationships. Your participation is greatly appreciated. Information provided will be treated in confidence. No information relating to individual airports will be published. Results of the survey will be aggregated on the basis of the passenger number bands used by ACI Europe. Please state your airport name and IATA code. Note that only aggregate information stemming from this survey will be published. In any publications or presentations that will result from this survey, the name of your airport will not be associated with individual answers to any of the survey questions. The list of airports completing the survey will not be made public. Does your airport devote resources to route development? (Yes/No) If your airport devotes resources to route development, they include: Marketing support (i.e., assistance short of actual financial help or incentives) only Financial incentives only Both Comparing your airport’s budget for route development in all forms in the current year to five years ago, is it: Substantially greater now than five years ago Marginally greater now than five years ago Substantially lower now than five years ago Marginally lower now than five years ago Comparing your airport’s budget for route development in all forms in the current year to ten years ago, is it: Substantially greater now than ten years ago Marginally greater now than ten years ago Substantially lower now than ten years ago Marginally lower now than ten years ago How many staff (FTE) work on route development? Currently Five years ago Ten years ago Do you currently work or have you previously worked with external consultants on route development? [TICK ALL OPTIONS THAT APPLY] Currently Five years ago Ten years ago We have never engaged with such consultants, and we do not intend to in the foreseeable future We have not previously worked with such consultants, but we plan to involve them in the foreseeable future We manage route development with in-house staff alone How many routes development conferences has your airport attended over the last five years? If your airport has not attended any routes development conferences, does it plan to attend them in the next two years? (Yes/No) If your airport has attended routes development conferences, when was the last time it did? If your airport has attended routes development conferences, how many airlines would it typically meet at such an event (please give your best estimate if you do not have exact records)? What other route development activities does your airport engage in [TICK as appropriate] Visits to airline headquarters Co-operation with local government, tourist authorities, chambers of commerce Other [SPECIFY] How much freedom does your airport have in setting its aeronautical charges? We are not subject to price regulation, and we have full freedom to set charges We are subject to price regulation, but are still able to provide targeted incentives to airlines We are subject to price regulation, and we do not have freedom in setting aeronautical charges Does your airport offer incentives to the airlines (in the form of lower aeronautical charges) for new services? No Yes, our airport offers a standard scheme available to any airline that meets the specified criteria Yes, our airport negotiates incentives with individual users If you offer incentives to the airlines, what kind of discounts does your published scheme offer (please tick all that apply)? Discounted charges for new airlines Discounted charges for new destinations Quantity discounts based on passenger volume Quantity discounts based on the number of movements Other (please specify) Do you offer services at the airport that are tailored to the requirements of particular airlines? Thinking about attracting new airlines, which of the following statements best describes your airport? In most cases, we actively seek to attract new airlines In most cases, airlines approach us first There is no clear pattern – sometimes the airport initiates the negotiation, sometimes the airline is the first to act Which of the below factors are key to attracting new airlines, in your opinion (please tick all that apply)? Level of charges Availability and specifics of the incentive packages Availability of slots at the airline’s preferred time Quality of airport operations/services Other (please specify) Thinking about cases of airlines threatening to leave or leaving your airport, or terminating a route, what are the key reasons (please tick all that apply)? Commercial viability of route served by the airline Level of airport charges Issues with slot availability Issues with airport operations/services Other (please specify) Do the airlines explicitly advise you that your airport is competing for their services with other airports? Yes, most of the time Yes, sometimes No If an airline does not explicitly tell you that you are in competition with other airport(s), do you nevertheless feel that such competition may exist? Yes, most of the time Yes, sometimes No Do network airlines behave differently from point-to-point low-cost carriers? Definitely yes Generally yes Generally no Definitely no We will appreciate your comments on the differences in your interaction with network and point-to-point carriers: Do you have any comments on any other issues related to this questionnaire?