



Abstract
Trading in and out of publicly listed company shares on the stock market helps one to create financial gains. Since it shows both business circumstances and the general status of the economy, the stock market is an important gauge of the financial situation of a country. Although stock market investments have great long-term potential, they are also intrinsically dangerous depending on several elements including political events, economic situation, and market attitude. Forecasting methods raise the possibility of prediction mistakes and frequently bring more computing complexity even if they enhance accuracy. This paper suggests a new hybrid model combining Forensic-Based Investigation Optimization (FBIO) with variational mode decomposition (VMD) and Long short-term memory (LSTM) networks in view of these difficulties. Reflecting larger market anticipations obtained from daily trading data price, the VMD-FBIO-LSTM model is meant to capture the basic patterns in stock price volatility. Incorporating market patterns, daily opening and closing prices, and trading volumes, this paper made use of an eight-year Google stock dataset. While FBIO maximizes the model parameters to improve adaptation to dynamic market circumstances, the VMD approach finds latent patterns within the data that match important market indicators. The model's performance was evaluated using data from Google's stock between January 2, 2015, and June 29, 2023. Compared to the previous models, the VMD-FBIO-LSTM model is more efficient and has better-predicting accuracy and lower error rates. Given that the suggested methodology is always well-suited to handling complex time-series data in the stock market, these findings provide investors and financial experts with new, crucial information.
Keywords
Introduction
Stock market participants need to comprehend its patterns. Employes in the financial industry are required to be knowledgeable about stock markets. It is necessary for investors to accurately forecast stock prices to optimize their profits and minimize losses. Capital transfers, stock options, macroeconomic policies of well-known corporations, and ownership changes are some of the key factors that could impact stock prices. Because price movements are inherently erratic, this can be extremely difficult to forecast the price of stock. The variations of stock exhibit non-stationary, non-linear patterns and are susceptible to fluctuating and random noise. 1 High noise and non-linear trends in time series data generally limit the use of statistical and econometric methods in stock market prediction. In general, artificial intelligence models are favored over conventional techniques for learning intricate and non-linear relationships. Using quantitative analysis techniques has become more popular in the financial industry, primarily because it makes it possible to draw important conclusions from input data. They're designed to identify patterns in historical data and forecast them in the future.2,3 Complex architectures have long been developed by deep learning and successfully employed to solve a wide range of problems connected to various datasets. Due to its ability to handle data in a unidirectional manner, the feedforward neural network is one of the most well-known models in this field. However, managing sequential data, where previous actions significantly impact future results, presents certain difficulties because it requires a whole new strategy. As such, the models are unable to accurately forecast the results. Long short-term memory (LSTM) and recurrent neural networks (RNN) are two examples of advanced neural network models that have been specifically designed to handle sequential input efficiently. RNNs’ loop-based design aids in sending data through subsequent stages, maintaining crucial information over time. 4 An RNN can be trained by using a training dataset with labels to determine the error or cost arising from the difference between the predicted and real prices. To reduce the error to a minimum, the network's weights and biases are now modified iteratively. The gradient is used to determine the contribution of each parameter to cost minimization during training. 5 Acting between the input and output layers, the method shows error propagation. The primary problem with this method is the need to determine the gradient, which requires the computation of partial derivatives for every parameter and calls for the development of Commonly seen during the training of neural networks, the phenomena of disappearing gradients is the reduction in gradient magnitude as they travel backward throughout the network.6,7 With the development of RNN, including the LSTM model, the vanishing gradient problem was essentially solved. LSTM is mostly beneficial because it preserves long-term memory, this indicates that it is rather appropriate for professions requiring the retention of knowledge over lengthy times. 8 Conventional RNN have great difficulty sustaining long-term dependencies in the vanishing gradient issue. Still, the LSTM architecture is designed especially to break free from these constraints.
In machine learning, decomposition is a fundamental idea that enables the efficient handling of complex problems, hence promoting scalability, interpretability, and performance. By breaking down difficult problems into smaller, more controllable parts, machine learning techniques may improve their knowledge, generalizing capacity, and problem-solving power.One often used recursive and adaptive approach is variational mode decomposition (VMD). 9 The method requires two user parameters: the amount of decompositions k and the quadratic penalty factor α and operates iteratively. VMD then looks for the ideal answer in line with the model.
Unlike past methods, the process of optimization has seen notable developments recently that have increased efficiency in handling constraints linked to restricted, rigid, or uncertain search domains. Originating as a collection of optimization methods to address the limitations associated with mathematical computation, convergence issues, and the necessity of making educated guesses, meta-heuristic algorithms were developed. 10 These techniques show better performance than deterministic algorithms in avoiding local optima, even if each iteration produces a different result. Examples of such methods are Forensic-Based Investigation Optimization (FBIO), 11 Particle Swarm Optimization (PSO), 12 Gray Wolf Optimization (GWO), 13 and Aquila optimization (AO). 14
The present study presents the VMD-FBIO-LSTM hybrid model, which has demonstrated high stock price predicting accuracy. This approach successfully identifies underlying trends in stock price swings that mirror more general market expectations like OHLCV values. Specifically, this research gathered and examined eight years of Google's stock data including daily trading volumes, opening and closing prices, and market movements. Defined as the complex patterns resulting from stock prices, investor mood, and economic projections, the VMD approach finds hidden trends matching with market expectations. FBIO also actively adapts to market situations by optimizing the model parameters, therefore reflecting important market indicators. The article introduces the VMD-FBIO-LSTM hybrid model, which has been shown to exhibit high accuracy when forecasting stock values. The correctness of the evaluation was assessed by considering results obtained from multiple models, namely LSTM, VMD-LSTM, VMD-PSO-LSTM, VMD-GWO-LSTM, and VMD-AO-LSTM.
The research utilized a robust technique comprising multiple analytical phases. The second part of the paper provides related works. The method and materials such as the FBIO optimizer, and LSTM model are decpited in section 3. Section 4 presents the data description and data preparation. The study findings and results are covered in section 5. The last portion contains a conclusion of study.
Related works
In their study, Rezaei et al. 15 proposed the utilization of two hybrid algorithms, namely CEEMD-CNN-LSTM and EMD-CNN-LSTM, regarding the forecasting of commodity prices. Qiu et al. 16 created an LSTM-based model with historical data from the Dow Jones Industrial Average, S&P 500, and Hang Seng Index datasets. Using stock trading data from the S&P 500, Lanbouri et al. 17 applied the LSTM model to predict stock prices for the next 1, 5, and 10 min. Lu et al. 18 employed the convolutional neural network (CNN) and LSTM techniques to predict the Shanghai Index's closing price for the subsequent day. Finding and extracting the most notable attributes from the dataset was CNN's main goal. To anticipate the closing stock price, the LSTM method was employed. CNN's failure to successfully extract the most notable feature from the provided input data was the root of the issue.
Yadav et al. 19 utilized a deep learning strategy based on LSTM to forecast the closing price of the NSE NIFTY50 index. Based on the results, it was determined that the LSTM model exhibits a higher level of desirability owing to its enhanced stability when used to time series forecasting challenges. B Panwar et al. predicted stock prices using SVM and Linear Regression, that Linear Regression for stock market analysis is better than the SVM for the same. 20 EH Houssein et al. utilized a composite approach that combines an equilibrium optimizer (EO) with support vector regression (SVR) to forecast the final pricing of the Egyptian Exchange (EGX). 21 LSTM with CatBoost was used by Mousavi et al. 22 to forecast the Tehran stock market. R Xu et al. incorporated trend categories obtained by aggregating price series across multiple time scales in conjunction with the day-of-the-week effect in order to generate a distinct feature combination. 23 J Zhang et al.proposed a CNN-BiLSTM-Attention-based model to enhance the accuracy of stock price prediction, acknowledging the challenges posed by high-frequency, nonlinear, and long-memory characteristics of stock price data. 24 To derive time-related characteristics from data sets, the model integrated CNN and bidirectional long short-term memory (BiLSTM) networks. G Bathla et al. investigated the effectiveness of deep learning, particularly LSTM, in predicting stock price movements during the highly volatile year of 2020. 25 They highlighted the complexity and non-linearity of stock market movements, which traditional approaches struggle to analyze effectively. MJ Bazrkar and S Hosseini introduced a machine learning approach called Support Vector Machine (SVM) for stock market forecasting, aiming to reduce investment risk and increase profitability by minimizing forecast errors. 26 They highlighted the dynamic and complex nature of stock price forecasting, which depends on various factors such as economic conditions, emotions, and inflation. A Kurani et al. explored the significance of technology in finance, particularly in financial risk management and stock prediction. 27 They highlighted two significant algorithms for stock forecasting: Artificial Neural Networks (ANN) and Support Vector Machines (SVM). ANN can effectively handle missing data points, while SVM's simple decision boundaries help avoid overfitting.
Methods and materials
Hybrid VMD-FBIO-LSTM model
A structured and innovative framework for predicting stock market price is depicted in Figure 1. This model is proposed to improve predictive accuracy by combining advanced data analysis techniques, optimization algorithms, and machine learning models in a cohesive process.

General stages of the proposed model construction.
The conceptual framework for a stock market prediction algorithm is illustrated in Figure 2, which delineates the sequence of operations and its primary components. The process commences with “VMD Decomposition,” in which Variational Mode Decomision helps to break down stock market data into more fundamental elements Following this, using an optimization method the “FBIO Optimization” block refines the model parameters. After this, the “LSTM Model Prediction” phase uses a LSTM network based on the analytical data and optimal parameters to estimate future stock price variations. Finally, the “Main algorithm execution” block integrates all previous steps, managing the data flow and processing to produce the final stock market predictions. This structured visualization demonstrates the algorithm's workflow, which encompasses data handling and predictive decision-making.

The proposed framework's overall algorithm.
The LSTM is a well-known deep-learning method that has seen considerable success. The aforementioned instrument exhibits effectiveness in a variety of applications. Due to its inherent ability to efficiently manage and examine enormous amounts of data.
8
Figure 3 indicates that the LSTM model handles incoming input using three gating units and a memory unit. Collectively, these elements govern the movement of data, removing any unnecessary information, and generating output that is concise and relevant. The function of the forgetting gate is to eliminate any possibly extraneous information that may be present, whereas the input gate is in charge of managing the processing of incoming information. The end result gate's main goals are to control processed data transfer and provide an output that is both relevant and exact. Whereas the memory unit is in charge of keeping pertinent data that will be accessible at a later date, gate formulae are used to classify, alter, and retain data. The LSTM model eliminate unnecessary information by using certain algorithms, guaranteeing that only pertinent data is retained. This approach appears to be rather successful in managing enormous volumes of data without causing more misunderstandings. Due to its durability and dependability when handling complicated data sets, the LSTM method is well known as a great advantage in the area of deep learning.
28
The use of the following equations helps to show how the LSTM model operates. Determining whether to keep or discard the date falls to Forgotten Gate. Processing both the current input and the prior secret state falls to the sigmoid layer. This layer produces output limited inside the 0 to 1 interval. Keep the data if the resulting value shows a greater degree of connection with 1. One may also ignore the material.


The structure of LSTM.
The function of sigmoid is denoted as σ, where
The cell state is then updated by applying the input gate. First, a hyperbolic tangent (tanh) layer with one sigmoid layer processes the incoming input and the previous secret state. A data value is mapped to a numeric value that is bounded between 0 and 1 using the sigmoid layer. An output value that lies between −1 and 1 is obtained by transforming a given data value using the tanh layer. The outputs of the sigmoid and tanh layers are calculated and multiplied point-wise. The program then determines the cell state's new value.

The following equation is used to calculate the tanh layer's output:




Such a part provides a concise overview of the entire FBIO system. The frequency and significance of forensic investigations are unparalleled in law enforcement.
29
The five components of a standard forensic investigation are as follows:
The commencement of the inquiry: An inquiry commences when the initial responding officer discovers pertinent information at the location of the crime; this information establishes the primary trajectory of the investigation for the remaining members of the team. Analysis and interpretation of the results: The investigative team disseminates information and interprets previously gathered survey results. Concurrently, team members will endeavor to associate the newly acquired details with their preexisting perceptions of the case. Insights into research directions: In briefings and ideation sessions, team members attempt to reach a consensus on multiple lines of inquiry (scenarios, criminal motives, and lines of inquiry) that were formulated in response to the interpretation of survey results. Subsequent Determinations: Following the establishment of the criminal investigation's survey trajectory and priorities, the entire team convenes to deliberate on subsequent courses of action. The group evaluates the financial implications and anticipated revenue of a survey direction before executing a viable strategy. The prosecution maintains that the case is nearly resolved until a crucial suspect is identified.
Based on the conduct of the police, the FBI divided the entire population into ainvestigation team and a pursuit team in order to reflect the distinct survey orientations of team members. The investigation team endeavors to assess the potential whereabouts of the primary suspect (the global optimal) throughout the entirety of the search space, which are referred to as “suspected locations."the illustration of FBIO is mentioned un Figure 4.

The illustartion of FBIO.
Following identifying high-probability suspect locations, the pursuit team complies with directives from headquarters and gradually approaches the current suspect areas. The magnitude of these two teams is Investigation team Pursuit team
The majority of the operations of steps (2) and (3) are carried out by the members of the investigation team
Based on information gathered by the investigation and population teams, the pursuit team determines promising positions and proceeds directly to the speculative location. Not the same as the investigation team will enhance each facet of the individual in the pursuit team through the utilization of distinct information derived from the current optimal individual






The framework of FBIO.
PSO is a technique that imitates the social conduct of a swarm of birds or fish to produce the best results. Even though the swarm doesn't know exactly where the food supply is, it follows certain rules to find it by taking the best route. By using a cooperative search approach, the swarm eventually finds the location where food may be gathered. After some time, the fish or bird swarms will have all coordinated their movements to the almost ideal outcome. Three fundamental principles—alignment, harmony, and division —these factors determine the progression of an avian colony; use the search area to find the solution.
30
During separation, particles separate from one another to stay away from congestion. During alignment, the particles move in the direction of their neighbors, and the cohesion displays an update on the location given to the neighbors. Kennedy and Eberhart created the PSO approach, which is motivated by the collective actions of a group of particles
31
to efficiently address numerous optimization problems. The PSO algorithm decreases calculation time because it often converges very rapidly and only needs a minimal number of parameters. Because so many particles are looking for a solution, there is also less chance of becoming caught in an optimum local solution. The method is derivative-free and includes a powerful global search engine. Every particle in the swarm looks for the nearly perfect solution in the PSO's multidimensional search space. Random particles or candidate solutions appear in the search space to start the search process. The velocity and fitness values for each particle are frequently calculated using the number of features in the feature subset and the weighted mean of the classification accuracy. This computation assists in updating their courses’ speed and direction after the initial iteration, and the process is repeated up until the halting condition is satisfied. The following equation describes how the PSO algorithm's particles adjust their speed:


The gray wolf optimizer is a novel optimization technique, a meta-heuristic approach. The approach started as presented by Mirjalili et al.
32
and models gray wolf social structure and hunting techniques. One may use the equation below to model the possible movement of gray wolves in a natural hunt:






The year 2021 saw the introduction of AO, a revolutionary algorithm. 33 The foraging strategies employed by the raptor Aquila served as the model for this algorithm's four distinct categories. The first category involves taking to the skies to increase the search area and go after flying prey. The second type entails gliding through the silhouette to swiftly strike prey at low levels near the ground. The third type uses low-altitude flying and a leisurely drop to attack prey piecemeal. Capturing grounded prey through dives is the fourth category. The robust optimization capacities of the AO algorithm enable swift integration, increased stability, and increased acceleration. 33 It is also incredibly constant and reliable.
When an eagle detects possible prey, it will do the first kind of vertical dive. and quickly determines the best place to hunt on Earth by soaring to great heights and locating the search area where the best strategy is calculated using the equation that follows:


As soon as the Aquila is ready to descend and initiate combat, it meticulously defines the area of the prey prior to employing the low-altitude, gradual descent attack mode at the designated target location. This is the third category of low-altitude flight. By implementing this tactic, the avian creature could potentially observe the response of its quarry and proceed cautiously towards its intended target. as the formula below indicates:

To rapidly close while impacting an opponent from a distance in the third style of strolling capture, the eagle employs the subsequent formula:

VMD, being an adaptable signal decomposition algorithm, effectively decomposes nonlinear signals. 34 The procedures involved are
Step 1: The constraint condition for decomposing the signal into IMFs is the minimal sum of signal bandwidth. Variational formula for conditional constraints:
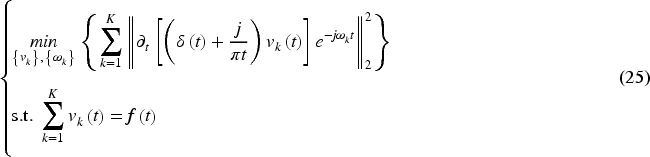
Step 2: Apply the second penalty factor





The procedure of features decomposition by VMD.
To compare the predicting accuracy of many time series models and determine which model has better forecasts, the Diebold Mariano test is a frequently used technique.35,36


Dataset collection
Present investigation, Google stock data was collected beginning on January 2, 2015, to June 29, 2023. This comprises daily data on the open, high, low, and close prices as well as trade volume (OHLC) for the designated time frame. The price Google's stock starts trading for the day is known as the Open Price. It provides a window into the state of market opinion at the start of the trading day. The highest price Google's stock is traded at throughout the day is known as the “high price.” The best performance and volatility of the stock throughout the trading session depend on this statistic. Google's lowest pricing at which its stock is traded throughout the day is known as the Low Price. Evaluation of the lowest point of mood and demand in the market depends on this figure. The last price Google's stock was exchanged at the end of the trading day is known as the Close Price. Often used in a range of financial studies and investing techniques, this is a vital reference point for assessing daily performance of the company. Volume is the aggregate number of shares that are transacted on a given day. The total sample size is 2137, the sample size for the train is 1710, and for the test, it is 427.
Figure 7 illustrates histograms for various financial metrics that are linked to Google's stock trading data, including OHLCV. The opening price histogram exhibits a distribution with multiple peaks, indicating that the opening prices often cluster around a few specific values. A multimodal distribution is also evident in the histogram for the high prices of the stock during the trading period. The implication is that, despite the potential for volatility, the stock consistently reaches a common upper limit that it rarely exceeds. In a manner similar to the High Price histogram, the Low Price histogram exhibits a skewed distribution with a peak in the 40–60 range. This implies that the stock price generally does not fall below a common lower boundary. The trading volume histogram distinguishes itself from the price histograms by exhibiting a long tail that extends toward higher volumes and a very sharp peak that is in close proximity to zero. The closing price histogram is similar to those of the open, high, and low prices, but it undergoes a more gradual decline after the peak, indicating that the closing price has a broader range of common values. Comparing the opening price to the closing price, the distribution is less sharply peaked.

Distribution of the collected features.
After data collection, thanks to a multi-step approach, the integrity of the dataset was protected, and possible issues caused by inaccurate or missing data were averted. The data landscape had to be carefully examined in the first step to look for any anomalies, outliers, or contradictions that would compromise the accuracy of the findings. Following this study, the dataset was cleaned and ready using many approaches, including scaling and normalizing, to guarantee accuracy in training outcomes and reduce mistakes. The aim of a methodical approach was to improve the general accuracy of the used data for the predictions of the model. Two distinct subsets of preprocessed data were created in order to improve the models: Figure 8 shows the training and test divisions of the dataset.This section's goal was to preserve a varied and unverified collection for thorough validation and testing without still compromising the great volume of data needed for model training.

Diving the data set to train and test.
Furthermore, as shown in Figure 9, a 5-fold cross-valuation method was used to improve the dependability and robustness of the model. Under this approach, the training data was split into five equal sections and the model was repeatedly trained in four sections under validation on the remaining portion. Repeating this procedure five times, each time with a different validation subset guarantees that the model's performance is constant and not dependent on any one data partition. This method let one evaluate the generalizability and correctness of the model more completely.

5-Fold cross-validation.
Assessment metrics
The accuracy of the future projections was assessed using many metrics for effectiveness. Great attention was paid in developing these criteria to provide a complete evaluation of the accuracy and reliability of the projections. Employed in this study are the evaluation measures coefficient of determination (




Finding and evaluating the most effective hybrid strategy for stock price prediction is the main objective of this work. Analyzed and forecasted systems were developed to meet the complex factors influencing changes in the stock market. One objective was to help analysts and investors make well-informed financial judgments by providing them with sophisticated information. Each model's performance is thoroughly assessed, and its efficacy is systematically determined, in Figures 10 and 11.

Values used in each model's evaluation during training.

Values used in each model's evaluation during testing.
Four commonly utilized metrics were used to do a thorough evaluation of the data analysis: RMSE, MAE, MSE, and
Assessment results regarding the statistical predictions generated by the six benchmarking algorithms.

A thorough examination of the test and training sets showed that the
Table 2 illustrates substantial disparities in computation times by comparing the time efficiency of several stock market forecasting models. The most time-efficient LSTM model is the basic model, with an execution time of 41.82 s, as a result of its straightforward architecture that does not include any additional preprocessing or optimization steps. Conversely, the VMD-LSTM model, which integrates VMD, necessitates 129.36 s as a result of the supplementary complexity associated with decomposing the data into multiple modes prior to processing. The VMD-PSO-LSTM model, which integrates VMD and PSO, further increases the computational load by extending the execution time to 580.39 s as a consequence of the iterative optimization process. Due to the use of optimization GWO, execution time increased (623.47 s), and the VMD-GWO-LSTM model, which uses GWO. At 509.88 s, the execution time value of the VMD-AO-LSTM model, on the other hand, dramatically increases. However, it is still more effective than the PSO and GWO methods. Despite having the longest execution time (520.79 s), the VMD-FBIO-LSTM model is the top model with the best FBIO performance. This highlights a balance between computational time and predictive accuracy. Consequently, the VMD-FBIO-LSTM provides the most effective balance between predictive effectiveness and time efficiency, despite the fact that the basic LSTM model is optimal for rapid computation.
The analysis of time efficiency in predictive models.

As illustrated in Table 1 VMD-AO-LSTM had better results by decreasing the RMSE score to 1.48 for the testing phase than VMD-AO-LSTM. Regression research indicates that the VMD-FBIO-LSTM model is a very reliable and exact tool. The model for the testing dataset has respective

Prediction curve for the VMD-FBIO-LSTM training set.

Prediction curve for the VMD-FBIO-LSTM testing set.
Several forecasting models are used to anticipate stock movements across three well-known indexes Google, NASDAQ, and Dow Jones in Tables 3–5 below. Each model's performance and, consequently, reliability are taken into consideration using
Performance of the studied models in forecasting Google financial market during both training and testing phases.

Performance of the studied models in forecasting Google financial market during both training and testing phases.
The models’ performance in predicting the Nasdaq financial market during the training and testing.

The models’ performance in predicting the Dow Jones financial market during the training and testing.

The Hybrid VMD-FBIO-LSTM performs effectively on the NASDAQ stock index, with an
VMD-FBIO-LSTM continues to predict the Dow Jones index with remarkable efficiency; in training, it has an
The result of the tables presents the efficaciousness in stock movement forecasting by the hybrid VMD-FBIO-LSTM model for major indexes like Dow Jones, Google, and Nasdaq. Compared with other models, the current one, with high values of
The Diebold-Mariano statistical test for different models has been used in stock market forecasting, and these results are displayed in Figure 14. When compared to other comparator models, this chart shows that the VMD-FBIO-LSTM model has the best forecasting accuracy. Out of all the models given, the VMD-FBIO-LSTM model demonstrated the highest performance results. For instance, when the forecast quality of VMD-FBIO-LSTM is compared to that of VMD-AO-LSTM, the test statistic's negative value, −1.1391, indicates that the forecast precision increases dramatically. VMD-FBIO-LSTM's superior predictive ability is further demonstrated by the figure, which also shows negative values when compared to other models like VMD-LSTM (−1.6712), VMD-GWO-LSTM (−1.1552), and VMD-PSO-LSTM (−1.6441). These assessments and the resulting outcomes demonstrate how well the proposed model performs during the forecasting process. In contrast, other models, such as VMD-PSO-LSTM, demonstrate some advantages over various configurations; however, they do not consistently demonstrate the same level of performance as VMD-FBIO-LSTM. For instance, the VMD-PSO-LSTM model's comparison with VMD-LSTM yields a positive test statistic of 0.4821.

Predictive model statistical analysis.
Predicting stock prices is a complex task with many moving parts. The equities market is a dynamic and always changing system affected by politics, the state of the economy, and society. To accurately predict future stock values, one must take into account a wealth of financial information, earnings reports, market patterns, and other important factors. Stock market price variations are significantly influenced by several factors, including interest rates, price hikes, and worldwide market circumstances. The development of precise models for projection presents a difficult task because of the intricacy and multiplicity of factors involved. Thankfully, the VMD-FBIO-LSTM model provides a practical solution to these issues; it has proven to be accurate and dependable. Stock price prediction models such as LSTM, VMD-LSTM, VMD-PSO-LSTM, VMD-GWO-LSTM, and VMD-AO-LSTM were examined in the paper. The OHLC pricing and the volume of Google shares data were gathered from January 2, 2015, to June 29, 2023. The analysis shows that the VMD-FBIO-LSTM model is quite accurate and reliable at predicting stock values.
Evaluations based on comparing the performance of model VMD-FBIO-LSTM with other models were done. It was clear from the outcome that the VMD-FBIO-LSTM consistently performed better than the other models. When
In general, the VMD-FBIO-LSTM model showed better accuracy and effectiveness compared with other models examined. It takes a rather holistic set of variables into consideration, such as historical price movement, market volatility, and financial information of companies, to give insightful analysis for investors. By analyzing this data, the model helps investors minimize risks and choose wisely among investments. The following section contains the study's limitations and recommendations for future works:
The VMD-FBIO-LSTM model has many limitations even though it would be an efficient predictor of stock prices. Because stocks perform differently in different economic environments, these constraints restrict the model's applicability to other stocks or market situations. The input data for each model must be comprehensive. A model's performance and forecasting will deteriorate with the number of errors and anomalies in this data collection. Furthermore, the stock markets are naturally noisy, and merely adhering to the previous trend might not produce accurate results, particularly during periods of extreme volatility or even abrupt market movements. Predicting share prices is a difficult undertaking that is impacted by a wide range of external factors, such as interest rates, macroeconomic changes, and societal trends. Despite its complexity, the VMD-FBIO-LSTM model does not properly account for the variables that represent the external factors that are incorporated. Because it captures some of the unforeseen market moves in the event of more dramatic events like economic crises, regulatory changes, or significant shifts in investor conditions, such a model will always have forecast errors.
To increase the accuracy of multi-structural models and improve the generalization of future studies, the researchers could use a set of data for future work. To make the model sufficiently sensitive to shifts in market dynamics, additional components were incorporated, including macroeconomic indicators, investor sentiment data, and basic financial measurements. These elements then provide context for the model, which improves its capacity to produce accurate forecasts, particularly in volatile markets. In summary, it accomplishes this by combining several models to make predictions; further study into ensemble modeling techniques improves overall accuracy and lowers the risk of overfitting. Therefore, when VMD-FBIO-LSTM is combined with other machine-learning or statistical models for stock price forecasting, the results of further research that combines the advantages of many approaches will be even more reliable. Providing additional insight into the model's practical application, actual testing in real-world market scenarios allows parameters to be adjusted to be more responsive to changes in market conditions.
Footnotes
Funding
The author received no financial support for the research, authorship, and/or publication of this article.
Declaration of conflicting interests
The author declared no potential conflicts of interest with respect to the research, authorship, and/or publication of this article.