
Abstract
Identifying associations among diseases is essential for advancing our understanding of disease mechanisms, enhancing diagnostics, facilitating drug repurposing, and guiding new therapeutic development. Despite substantial progress in decoding disease biology, the molecular underpinnings, therapeutic targets, and phenotypic traits of many diseases remain poorly understood. Previous studies have typically relied on either single similarity metrics or weighted combinations of multiple metrics, often lacking objectivity and standardization. In this work, we systematically evaluate and compare state-of-the-art similarity metrics across three distinct categories—semantic, functional, and network-based—to identify the most effective representative from each. Our analysis reveals SemSim as the optimal semantic metric, FunSim for functional similarity, and NetSim for network similarity. Leveraging these findings, we propose DiGeS-FN (Disease-Gene associations using Semantic, Functional, and Network metrics), an integrated framework for comprehensive disease similarity assessment. Experimental results demonstrate that DiGeS-FN achieves an AUC of 0.81, with a high true positive rate and a low false positive rate. The framework effectively recovers well-established disease associations, including atherosclerosis–myocardial infarction, asthma–bronchitis, and asthma–chronic obstructive airway disease, thereby validating its reliability. Notably, it also uncovers a novel association between polycystic ovary syndrome and endometriosis, supported by shared gene ontologies and pathways. These findings demonstrate the dual potential of DiGeS-FN to both validate known disease relationships and uncover novel genetically associated disease pairs.
Keywords
Introduction
Identifying associations among various diseases is an evolving field of study in contemporary biological and medical science. Understanding relationships among disease pairs can deepen our knowledge of molecular mechanisms underlying human diseases and can improve how diseases are classified. The quantitative evaluation of disease similarity, which depends on the qualitative associations1–5 is gaining more interest because of its significant role in identifying genes responsible for causing diseases,6,7 discovering novel drug indications, 8 identifying microRNA functional associations. 9 Associations between diseases primarily manifest in various dimensions, like clinically, they exhibit remarkably similar phenotypical characteristics such as symptoms and indications, whereas in genetics, a single gene can lead to diverse mutations. Disease can also be characterized using varied biomedical data. In biomedical studies, the relationships between diseases are primarily determined using three types of metrics: semantic, functional, and network. These similarity metrics provide unique approaches for determining disease similarity.
The semantic similarity metrics compare disease depending on the terminology and descriptions utilized to define them. Semantic similarity metrics often use Disease Ontology (DO) for computing disease similarity, relying on shared attributes and hierarchical associations. DO provides a standardized vocabulary for disease classification and a structured understanding of diseases depending upon symptoms. Although bio-ontology terms can effectively define concepts underlying diseases and their semantic relationships, their universal applicability is limited because not all diseases adhere to ontological structure. That's the reason we need to consider additional metrics to compute disease associations. Another important metric is functional, which assess disease similarity based on biological functions, such as shared genetic pathways, molecular mechanisms, or protein interactions, which reveal common underlying biological processes, providing insights into disease mechanisms. Diseases are contrasted in this context depending on similar metabolic pathways or common gene expression profiles. Network-based disease connections are analyzed utilizing the interactions between genes, proteins, and other biological entities. Diseases are associated in networks depending on similar molecular interactions or co-occurrence among pathways. For instance, Protein-Protein Interaction (PPI) networks are utilized to identify diseases that are associated with shared interacting proteins. Each of the disease similarity metrics has its own significance. Semantic similarity metrics offer high-level, thorough comprehension of diseases; however, functional similarity metrics explore the biological mechanisms underlying the diseases, and network similarity metrics provide valuable perspectives into the intricate connections and dynamics at the system level.
Previous studies typically utilized a single measure of similarity, such as semantic, network, or functional scores, to quantify the similarity between diseases. Few other researchers employ weighting coefficients to integrate multiple metrics of varying natures. The researchers have used varied forms and combinations of semantic, functional, or network similarity computing metrics. Each of the categories of metrics is defined differently. This results in a lack of objectivity when predicting diseases that share similarities. To address this issue, our proposed approach aligns multiple disease metrics into a unified spatial dimension, utilizing multi-dimensional vectors to define every disease node. The objective of this paper is to systematically evaluate and compare leading approaches for measuring disease similarity across three categories: semantic, functional, and network-based metrics. We aim to identify the most effective metric within each category and then determine how these can be integrated to achieve a more comprehensive measure of disease similarity. Furthermore, we compare the integrated approach against existing state-of-the-art methods, identify potential genetically associated disease pairs, and investigate the key biological processes and pathways shared by these diseases.
The challenges encountered while conducting research in this direction are as follows:
Data Challenge: The benchmark datasets for identifying disease associations are unavailable; rather, they have been curated by referring to various data sources. Access to quality data is very limited, and available datasets are often large in size and high-dimensional.
Comprehensive and substantial metrics extraction: Researchers either worked on varied semantic, network, and functional metrics solely or have used these metrics in combination. The computation lacks objectivity. Along this line, we have analyzed and compared state-of-the-art metrics and utilized the best among them to determine the proposed integrated metric for computing disease similarity.
Different identifiers represent diseases across different databases, demonstrating diversity in disease identification. For example, in DO, there are DOIDs; in MeSH, diseases are represented by MeSH IDs; and in OMIM, there are OMIM IDs. This diversity of identifiers obstructed the process of integration, as mapping between these data sources is intricate and prone to errors.
The paper's primary contribution consists of the following key aspects: We referred to multiple data sources integrated them to extract meaningful relationships and information about disease associations. Conducted a comparative evaluation of different semantic metrics that are currently in use for determining semantic similarity in heterogeneous networks, where meta paths symbolized different semantic relationships among diseases. Conducted a comparative analysis of various existing network metrics for disease topological similarity calculation in the network, considering multiple hops to be the neighbors to identify the most effective topological similarity metric. Proposed the DiGeS-FN Integration method, which combines the most effective functional, semantic, and topological similarity metrics to identify the optimal disease similarity. Identified significant disease pairs and performed functional enrichment analysis.
The remaining paper is organized as follows: Section 2 presents the related literature; section 3 describes the proposed framework. Section 4 highlights the experimental details, Section 5 discusses the results, and finally the paper concludes with Section 6.
Related work
Numerous studies have been performed in the past that have identified disease associations using varied means and utilized them for different purposes. This section highlights studies that are closely related to our work. Approaches for computing similarity between diseases can be generally classified into semantic, network, and functional-based metrics.
Semantic similarity metrics are extensively employed to assess similarity among terms within the GO (Gene Ontology) and HPO (Human Phenotype Ontology) in the field of bioinformatics. Some of the metrics are utilized to assess similarity among diseases based on disease-related ontological terms.10–13 Resnik's method 14 outperforms union-intersection (UI), longest shared path (LP), JC, 15 and Lin's technique. 16 The Resnik evaluates similarity among diseases using DO terms,17,18 assessing similarity among diseases by utilizing the information content (IC) of MICA among pairs of diseases. The dominant ontology for computing similarity among diseases is DO, which defines disease relationships using the “IS_A” relationship format. 19 Furthermore, the Wang method 20 computes disease similarity using DO terms by taking into account multiple ancestors that are shared between them. The Wang method demonstrates excellent performance in computing semantic associations among GO terms and has been effectively employed to assess similarity among diseases across Medical Subject Headings (MeSH) terms. The author 21 measured disease semantic similarity using the metapath technique based on chemicals used to diagnose a pair of disease.
Network-based methods have also been used for assessing similarity among diseases. This metric computes the associations and interactions that take place among genes within biological networks. The author 22 proposed a network-centric approach that evaluates gene functional similarities using GO by analyzing the overall structure of the co-functional network and GO terms. The author 23 computes network similarity based on disease pathway using the dynamic time wrapping technique. To assess network similarity between diseases, the average topological properties for diseases are computed by the author. 13 As described, the studies have generally used three metrics to measure similarity among diseases: functional, network, and semantic. However, researchers tend to use these metrics based on convenience, and there is no established method to determine the most optimal functional, semantic, or network metric. So, there is an immediate need to determine the best available metric—functional, network, or semantic—for measuring disease similarity and to devise a method for integrating these three metrics effectively.
In recent times, there have been new function-based approaches developed for assessing disease similarity. Among these, the most commonly used computational techniques rely on the guilt-by-association hypothesis.24,25 The presumption is that diseases sharing similarities are likely to be linked with the same or similar genes. As a result, a critical aspect was to evaluate the proximity among candidate genes and known disease-associated genes. The similarity among diseases was converted into the similarity between their associated gene sets. The first approach to compute similarity among diseases utilizes the overlapping gene sets (BOG). 26 Compared to semantic similarity techniques, the BOG method offers a novel perspective on defining disease similarity. Hence, there is potential to uncover previously unidentified associations. 26 Nevertheless, it disregards the functional relationships between genes associated with diseases, which play a role in determining similarity among diseases. The researcher 27 introduced a technique known as process-similarity-based (PSB), which incorporates associations derived from GO terms. 10 PSB surpasses BOG in performance and demonstrates superior efficacy compared to Resnik, 14 Lin, 16 LC, 21 and JC 15 methods.
Proposed framework: DiGeS-FN (Disease Gene Semantic Functional & Network Association)
To examine the genetic resemblance among diseases, we employed the best three metrics—network, functional, and semantic similarity- obtained from comparative analysis and integrated them to achieve improved prediction accuracy. This integration leverages complementary strengths of the three measures, ensuring a more robust and reliable characterization of genetic resemblance among diseases. (Figure 1 depicts the proposed workflow of DiGeS-FN).
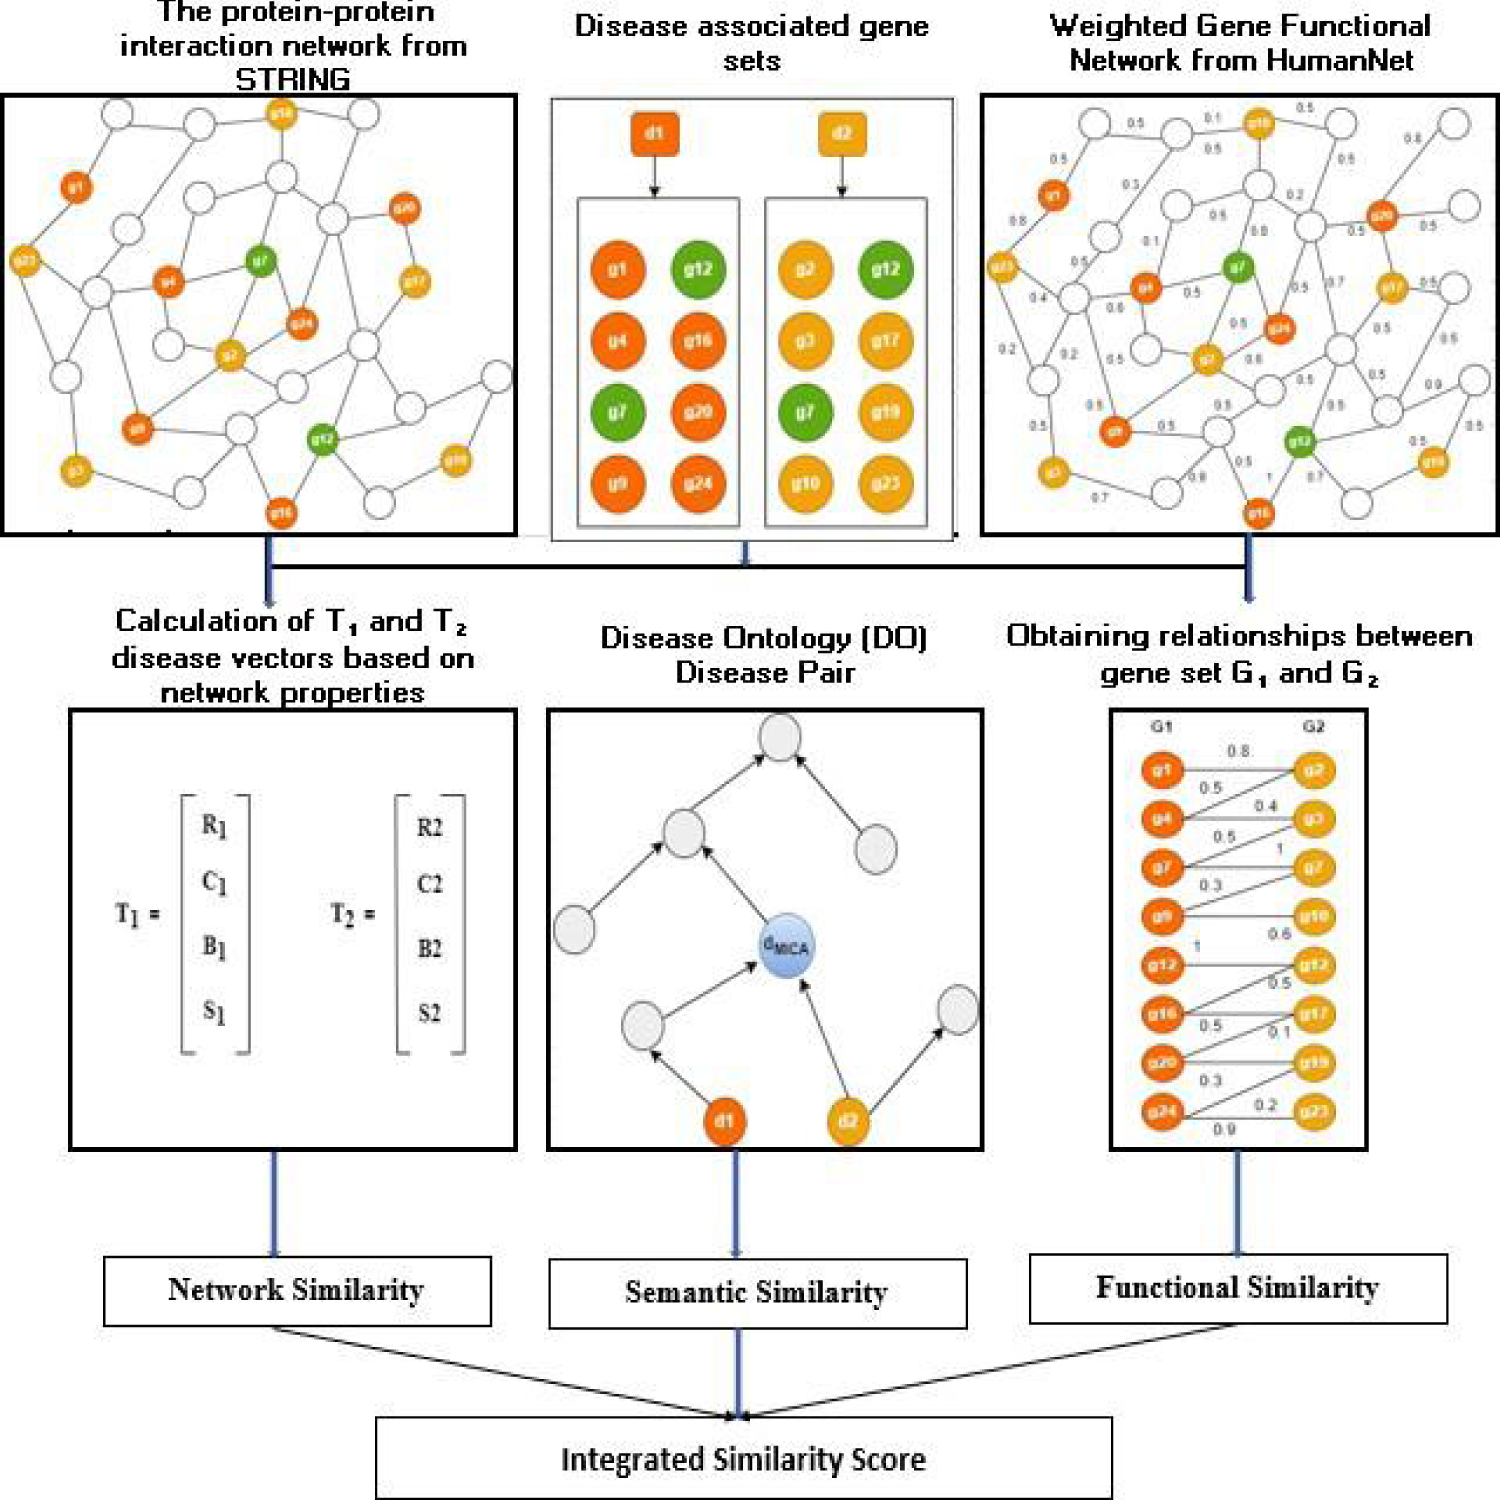
The diagram illustrating the proposed workflow of DiGeS-FN.
The STRING database
28
was utilized to gather data on interactions between human genes (PPI), and Cytoscape software (v3.8.2)
29
was utilized to build a network of human PPI. The network's topological properties concerning genes associated with diseases were calculated.30–34 The genes associated with disease d were delineated as G = {g1, g2, g3, …gk}. To evaluate topological similarity among diseases, the mean structural properties of each disease in the network were computed in the following manner:

Here, k denotes the count of genes in the set G where each gene gi is described by specific network metrics: degree centrality (ri), clustering coefficient (ci), betweenness centrality (bi) and average shortest path length (si). The average values of these measures across all genes in G yield the disease-level descriptors: degree centrality (R), reflecting the average number of direct connections per gene; clustering coefficient (C), indicating how interconnected a gene's neighbors are; betweenness centrality (B), measuring the extent to which a gene lies on the shortest paths between other genes and average shortest path length (S), capturing the mean distance from a gene to all others. Together, these parameters provide a comprehensive topological profile of each disease, enabling comparison and similarity evaluation among different disease terms.
As illustrated in Figure 1, G1 and G2 represent the set of genes linked to disease terms d1 and d2, respectively. T1 = {R1, C1, B1, S1} and T2 = {R2, C2, B2, S2} are the disease vectors for diseases d1 and d2 derived from their topological properties. Network similarity is determined among diseases using the cosine similarity applied to T1 and T2.

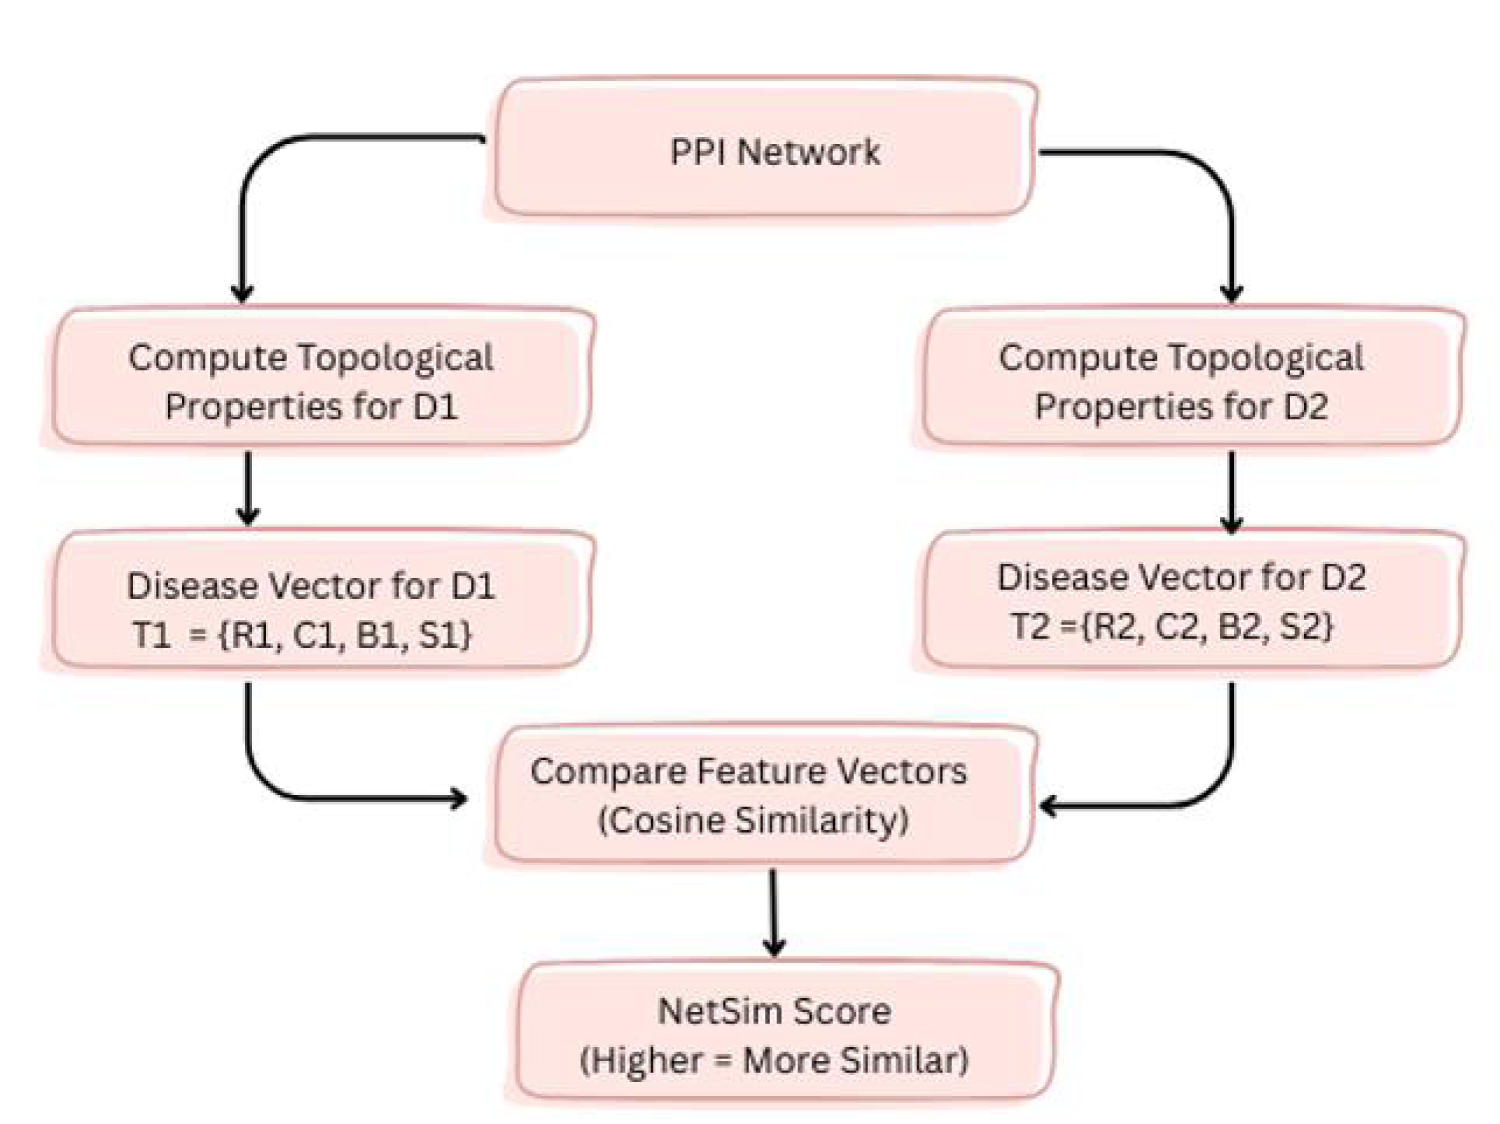
Schematic representation of network similarity computation among diseases.
To quantify proximity among disease terms based on a specific ontology,35–37 a semantic similarity metric is employed. The metric in Cheng et al. 12 was utilized to evaluate similarity among DO terms. Disease terms were fetched from DO. 38 The DO is structured as a DAG (directed acyclic graph) in which each vertex defines a disease term and each edge defines an “IS_A” relationship among the diseases. Figure 3 presents the subgraph of the Disease Ontology DAG representing the hierarchical relationship for the disease term Cutaneous lupus erythematosus (DOID:0050169).
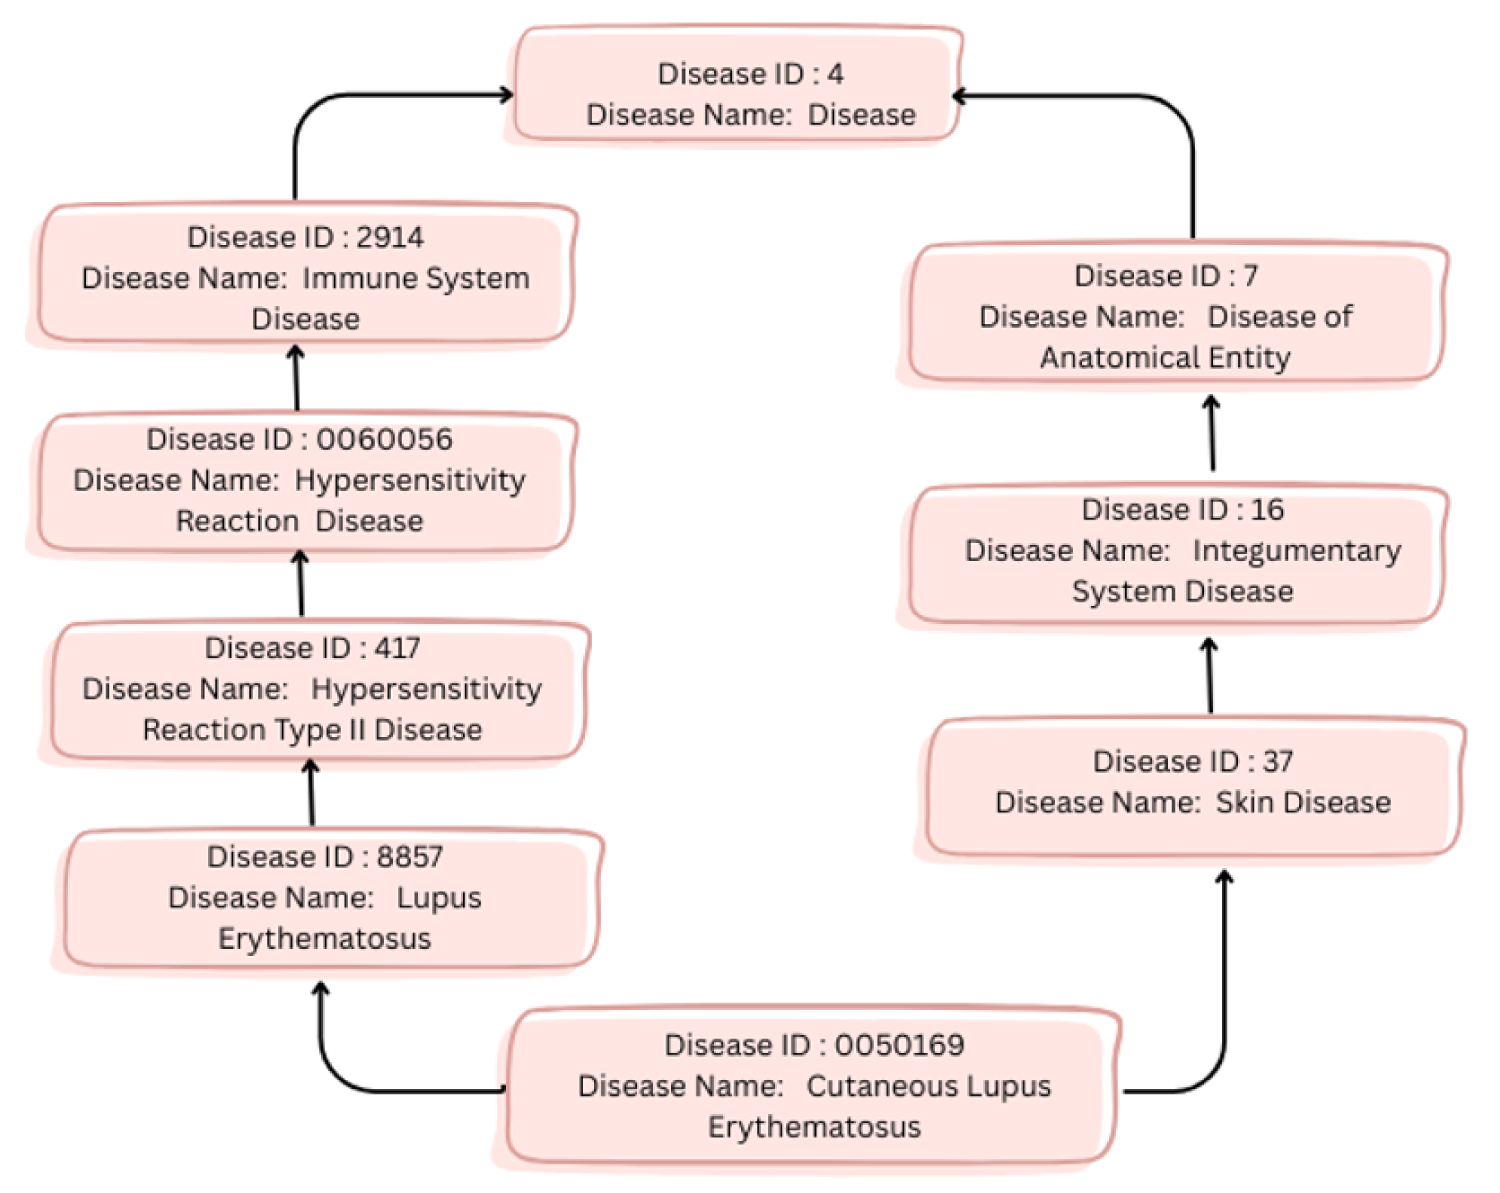
A DAG subgraph corresponding to the DO term “Cutaneous lupus erythematosus (DOID:0050169)”.
The IC for each DO term can be determined in the following manner:

Here, d represents the disease term within DO, and p(d) indicates the count of genes associated with d, divided by the total genes associated with disease ontology.


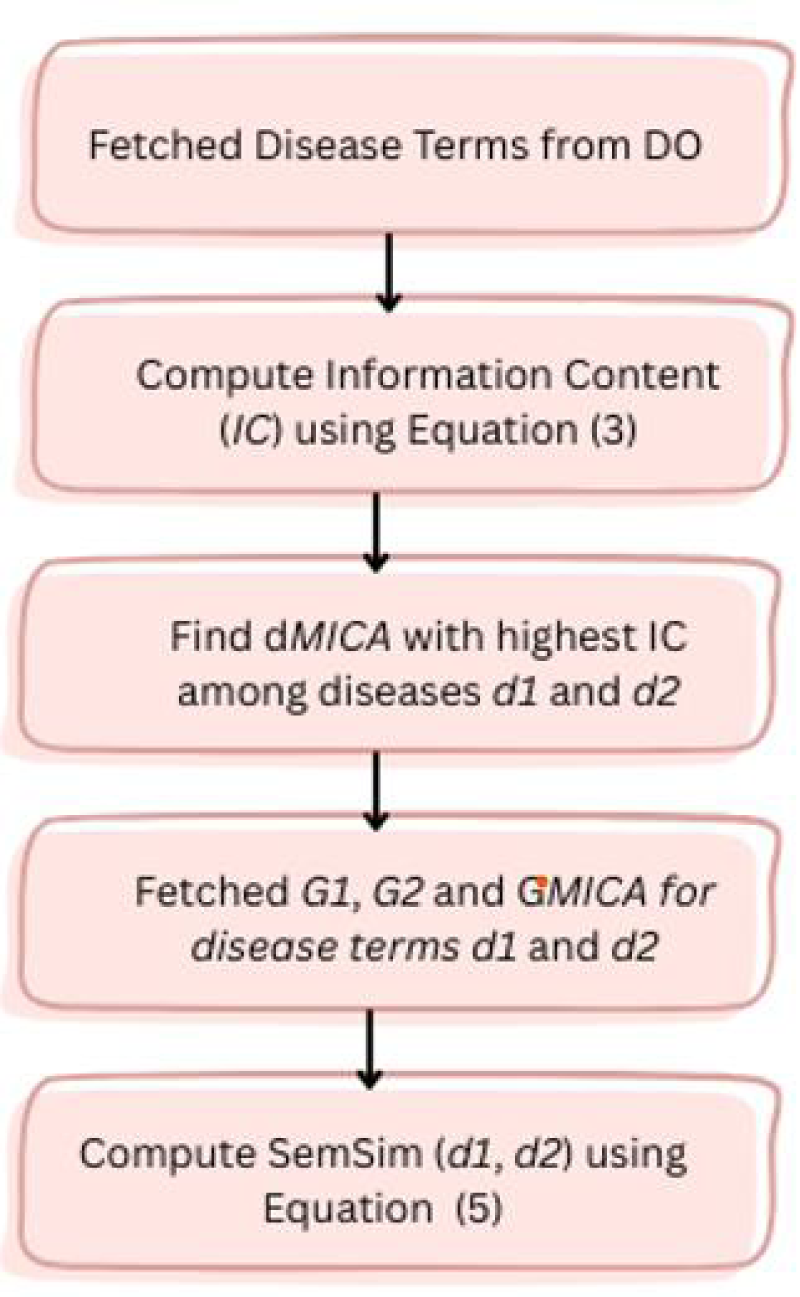
Workflow illustrating the computation of semantic similarity among diseases.
The functional associations among genes were extracted from HumanNet.
36
In HumanNet, each interaction is assigned an LLS (log likelihood score). LLS indicates the likelihood of functional association among the genes.
12
The LLSs among human genes were retrieved from the HumanNet database and standardized using the following equation
12
:

Here, gi and gj represent the ith and jth genes, respectively. LLSN (gi, gj) denotes the normalized LLS among gi and gj. LLS (gi, gj) denotes the original LLS among gi and gj. LLS min and LLS max indicate min and max LLS within HumanNet, respectively. The functional similarity score, referred to as FunSim, for a gene pair was established in the following manner:
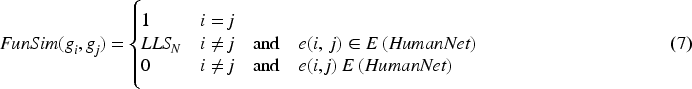


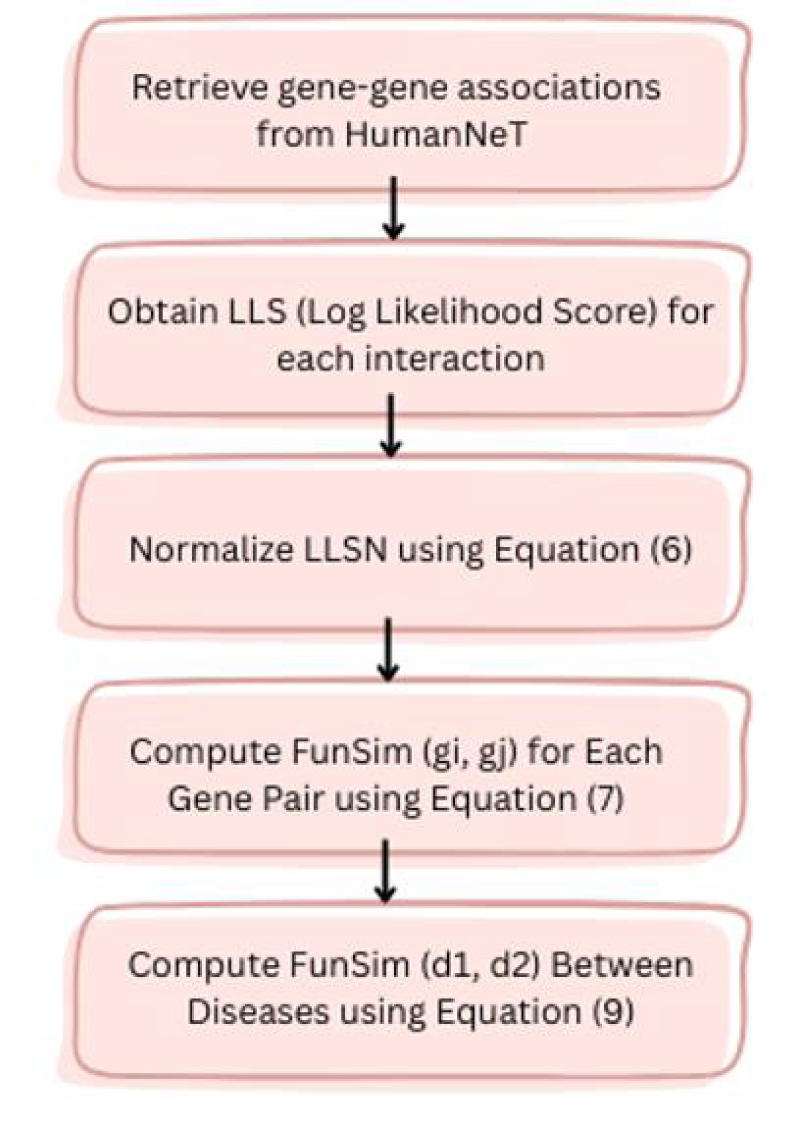
Workflow illustrating the computation of functional similarity among diseases.
To identify potential disease pairs, three types of similarity metrics were integrated together to comprehensively compute the similarity, which was established as follows:

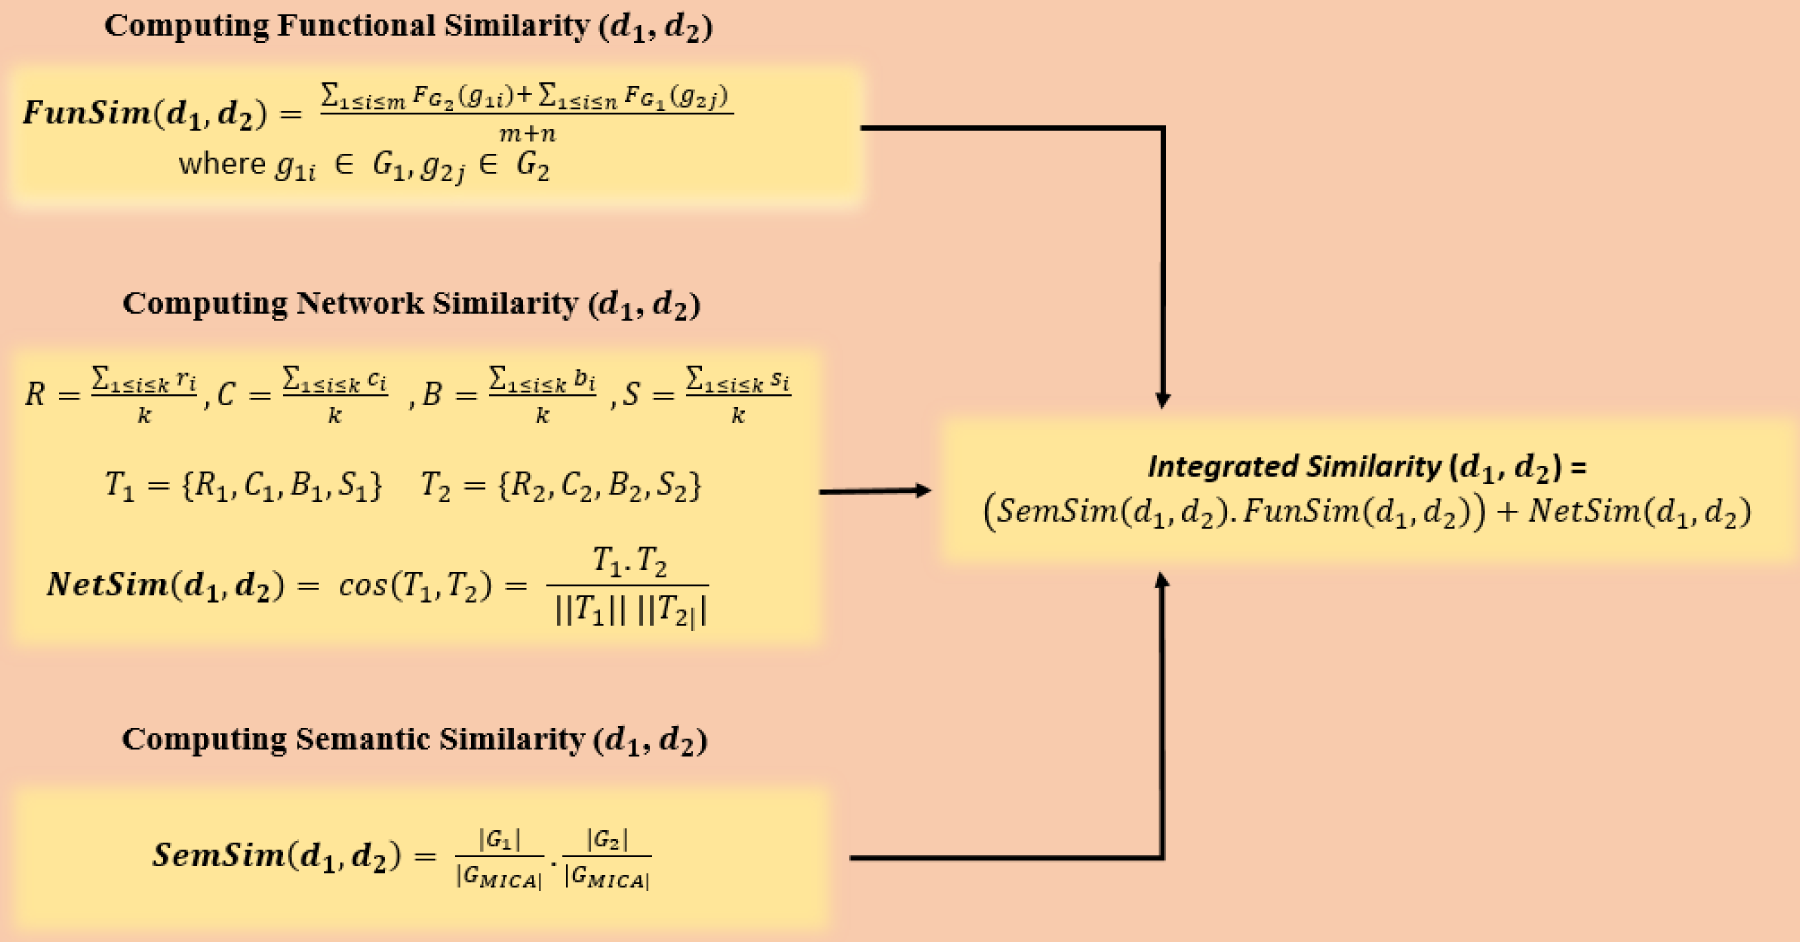
Schematic representation of DiGeS-FN for disease–disease similarity computation.
This section outlines the data sources employed and the experimental findings. The results are organized into four subsections: a comparison of state-of-the-art semantic similarity metrics for diseases, a comparison of network-based similarity metrics, a comparison of functional similarity metrics, and, finally, the identification of the optimal disease similarity through integrated metrics. Furthermore, we identified significant disease pairs and conducted functional enrichment analysis using GO terms and key pathways.
Data sources
To find the disease associations, the data has been collected from the different sources. Multiple sources are referred to and combined to reveal meaningful relationships. In this investigation, four public data sources are used, including DO, STRING, HumanNet, and SIDD.
Disease Ontology (DO)
The Disease Ontology (DO) 38 comprises 11,000 unique disease terms and 18,000 relationships denoted by “IS_A” between diseases. In the DAG of the DO, disease terms are connected by “IS_A” relationships, where each vertex denotes a DO term, and each association denotes an “IS_A” relationship among various diseases.
STRING
The STRING 39 database aims to consolidate both confirmed and predicted interactions among proteins, incorporating physical and functional interactions among the proteins. The protein–protein network includes 1895 proteins with 187874 associations.
HumanNet
We utilized HumanNet 40 to access functional interactions among genes, which serves as an expanded network of gene functional interactions specific to Homo sapiens. This functional network includes 977,495 interactions involving 18,459 genes (Table 1).
Sources of data utilized to evaluate similarity among diseases.
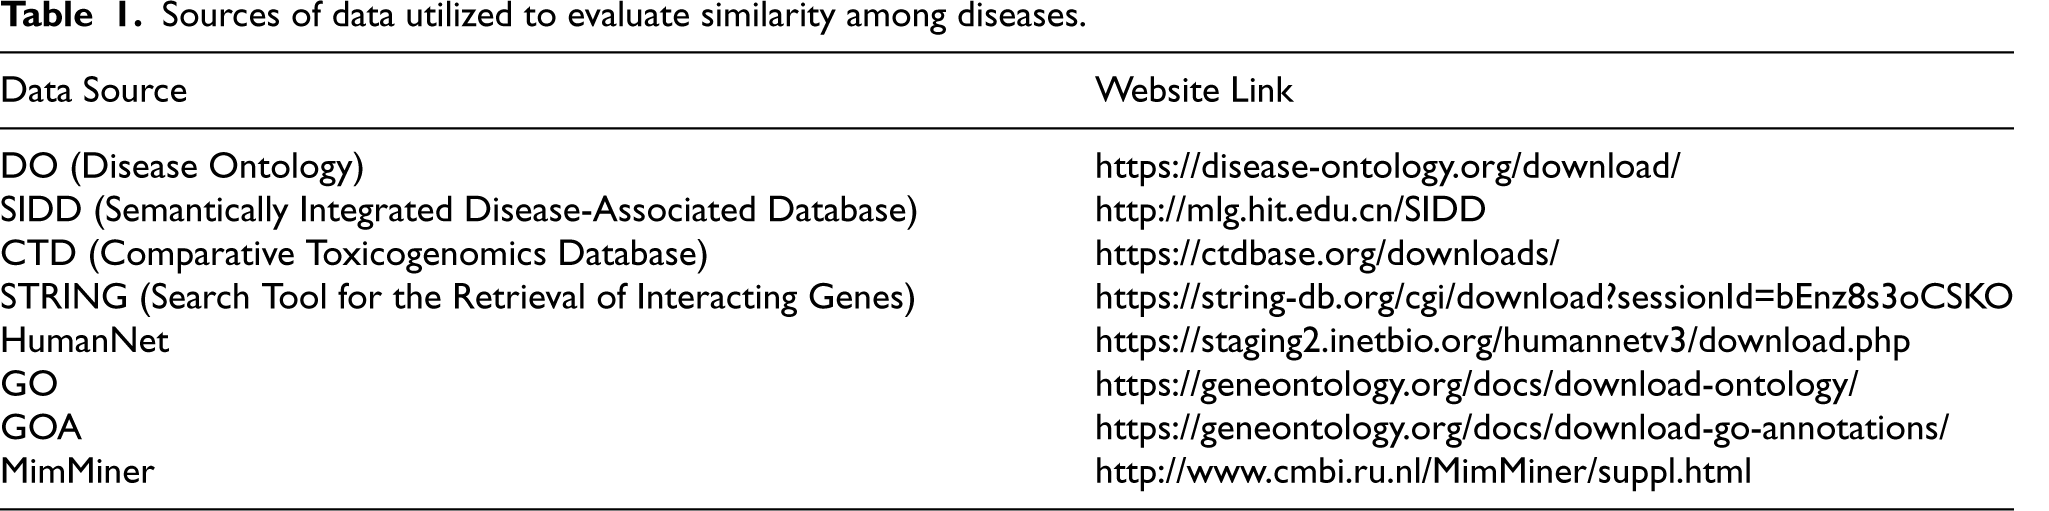
Sources of data utilized to evaluate similarity among diseases.
Disease-associated genes are sourced from SIDD, 41 which consolidates information from five databases of disease-associated genes: CTD (Comparative Toxicogenomic Database), 42 OMIM (Online Mendelian Inheritance in Man), 43 GAD (Genetic Association Database), 44 GeneRIF (Gene Reference into Function), 45 and SpliceDisease. 46 Overall, the disease-associated gene dataset encompasses 2814 diseases, 12,063 genes, and 117,190 interactions among them. Table 1 provides specific details about the data sources.
To validate the results, a benchmark dataset comprising 47 diseases with 70 associations among them was utilized from a previous study. 12 This benchmark dataset combines two manually curated datasets that include disease pairs with significant similarity.40,47,48 Initially, the dataset was introduced in Pakhomov et al. 47 Then, a literature review was conducted to identify highly similar disease pairs, as described in Mathur and Dinakarpandian. 27 The second dataset was provided in Suthram et al., 48 based on judgments given by medical residents. Table 2 gives an overview of statistics for all datasets utilized.
Statistics for all datasets utilized.
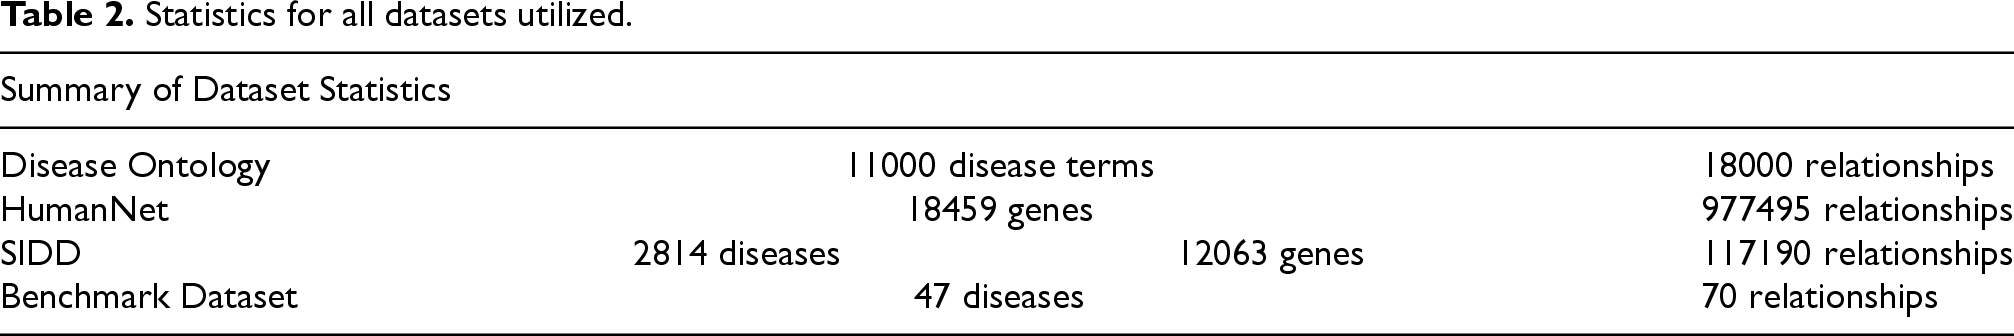
Statistics for all datasets utilized.
This section presents the varied research question given as follows: Q1: Which semantic method is the best for identifying disease associations? Q2: Which topological similarity metric is most effective for finding disease associations? Q3: What is the accuracy of the functional similarity method used for identifying disease associations? Q4: Which among the top metrics in each category obtained above is the best choice for identifying the disease association? Q5: Find the genetically associated potential disease pairs based on all three metrics. Q6: Which method outperforms when comparing and contrasting the state-of-the-art methods with the proposed metric utilized for identifying significant disease pairs? Q7: What are the GO terms and key pathways shared by significant disease pairs?

Here, |GO(d1) | and |GO(d2) | represent the count of GO terms related to diseases d1 and d2, respectively.
|GO(d1) ∩ GO(d2) | denotes common GO terms among diseases d1 and d2.


Suppose that D2 consists of d2 along with its ancestral terms. The similarity between diseases d1 and d2 according to Wang's method is expressed as follows:

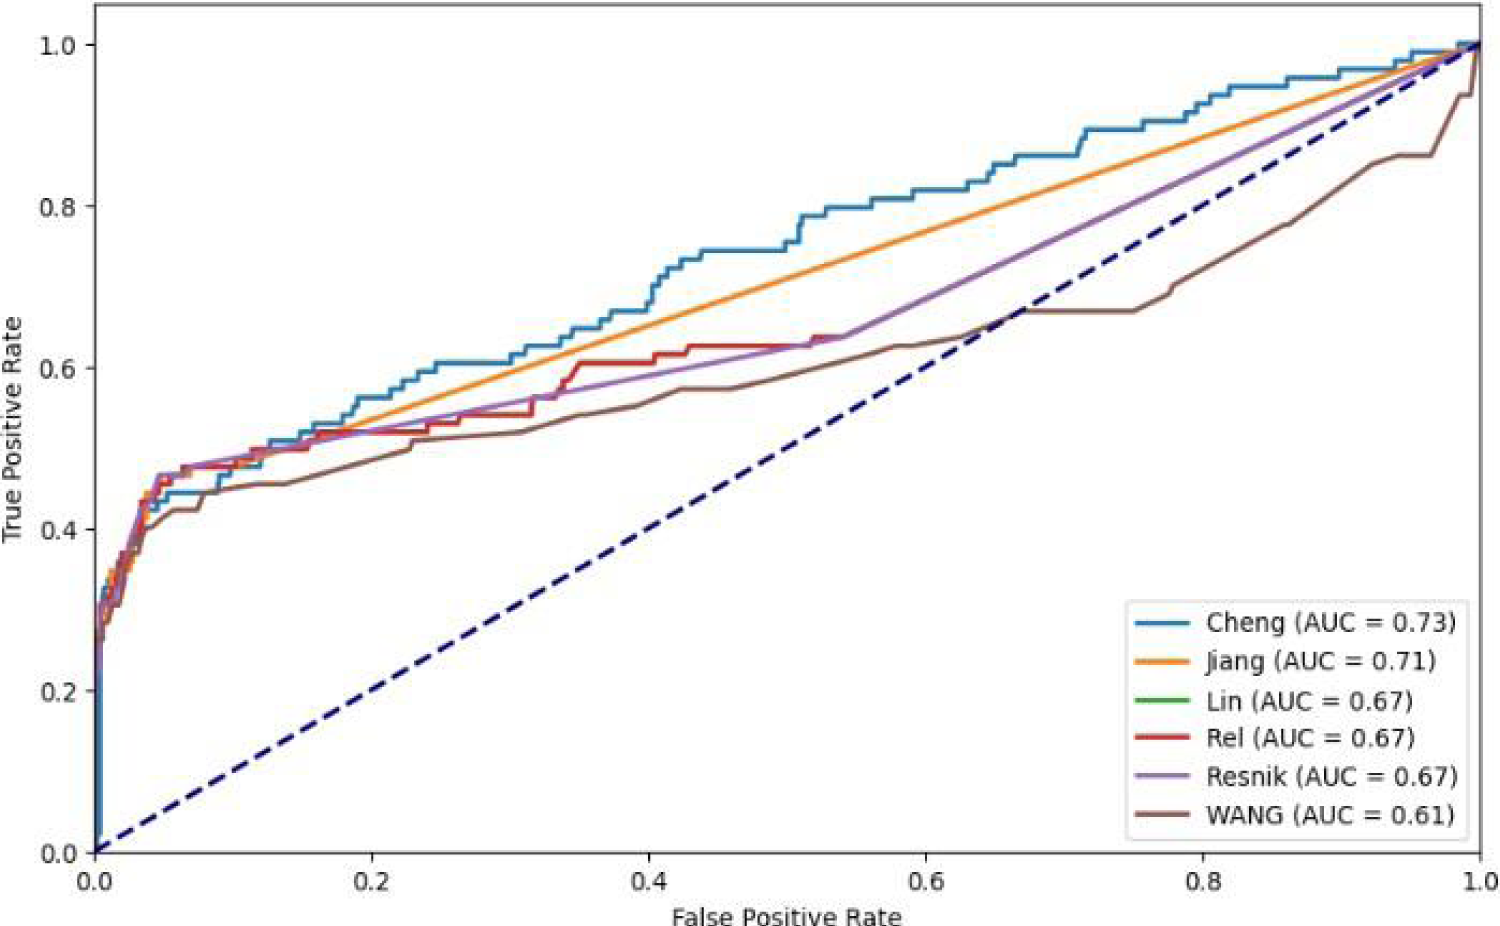
ROC curves illustrate the experimental results using various semantic similarity methods.
Table 3 displays the AUC achieved by various metrics for computing semantic similarity among diseases. From the table, it has been observed that Cheng's method demonstrates the highest performance among the five semantic-based metrics over Gene Ontology (GO). The findings indicate that for assessing semantic similarity among disease pairs, Cheng's method is the most effective, achieving the AUC value of 0.73.
Comparison of various semantic similarity metrics.


Here, R is the degree centrality represent average number of a gene's direct connections; C is clustering coefficient that shows how connected its neighbors are; B is betweenness centrality that measures how often it lies on shortest paths; S is average shortest path length that reflects its mean distance to all other genes; and H is neighborhood connectivity that signifies the average connectivity of its neighbors. Each disease is represented with five-dimensional feature vector (T) based on its topological properties, and finally network similarity is computed using the Pearson Correlation Coefficient (PCC) as shown in equation (17).


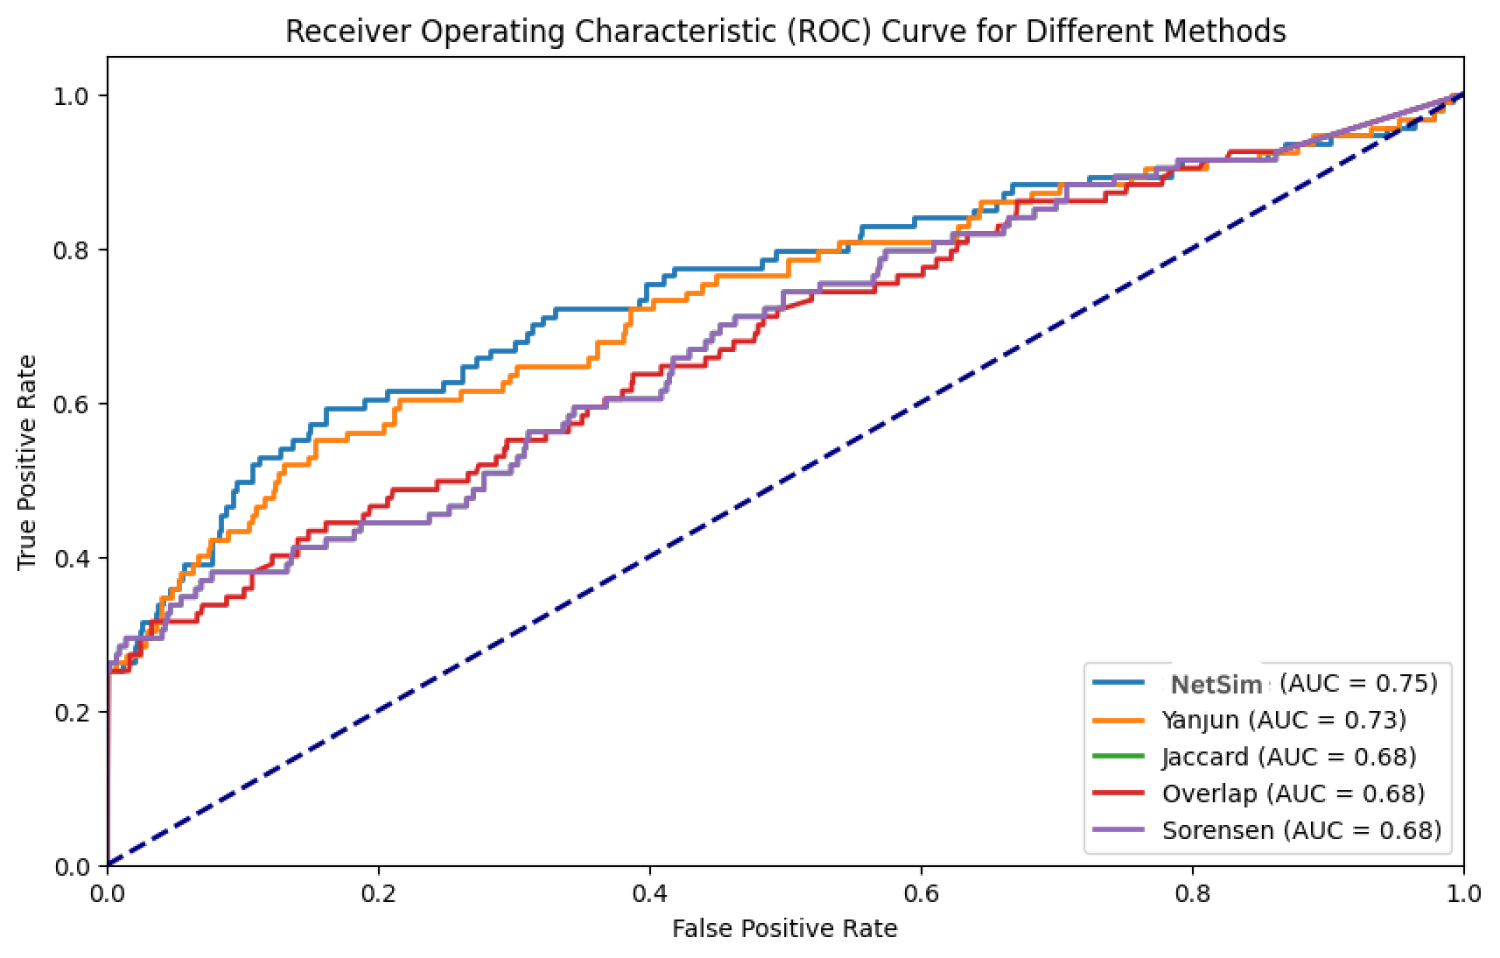
ROC curves illustrate the experimental results using various network similarity methods.
Comparison of various network similarity metrics.
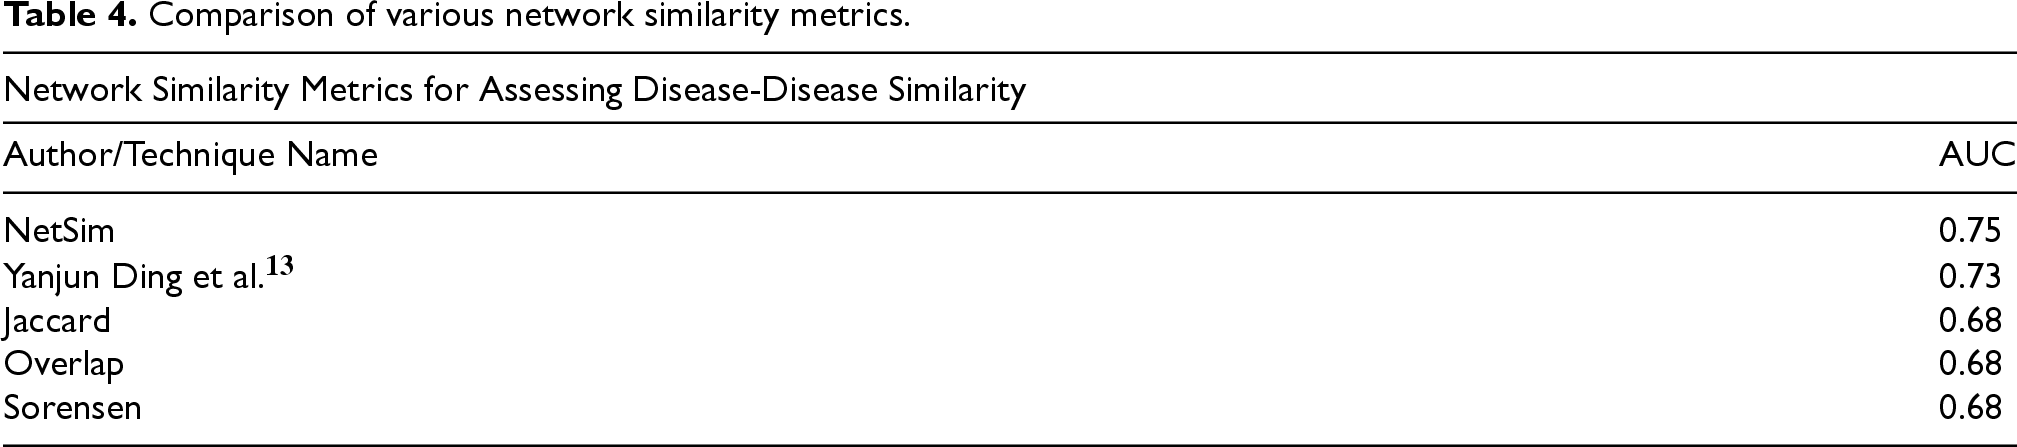
Table 4 displays the AUC achieved by various methods for calculating network similarity among diseases. From the table, it has been noted that the cosine method outperforms the Pearson correlation utilized in Ding et al. 13 when applied to disease vectors for measuring similarity among diseases. When employing the Cosine method on disease vectors, it attains an AUC score of 0.75 (increased by 0.2%) compared to using Pearson correlation to measure disease similarity.
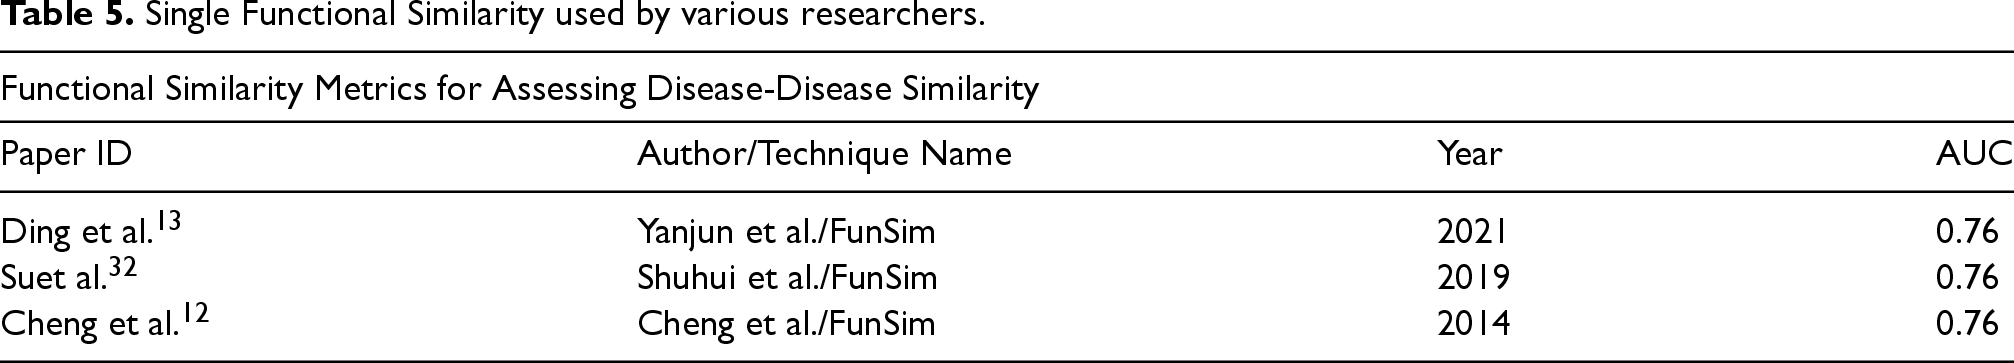
Single Functional Similarity used by various researchers.
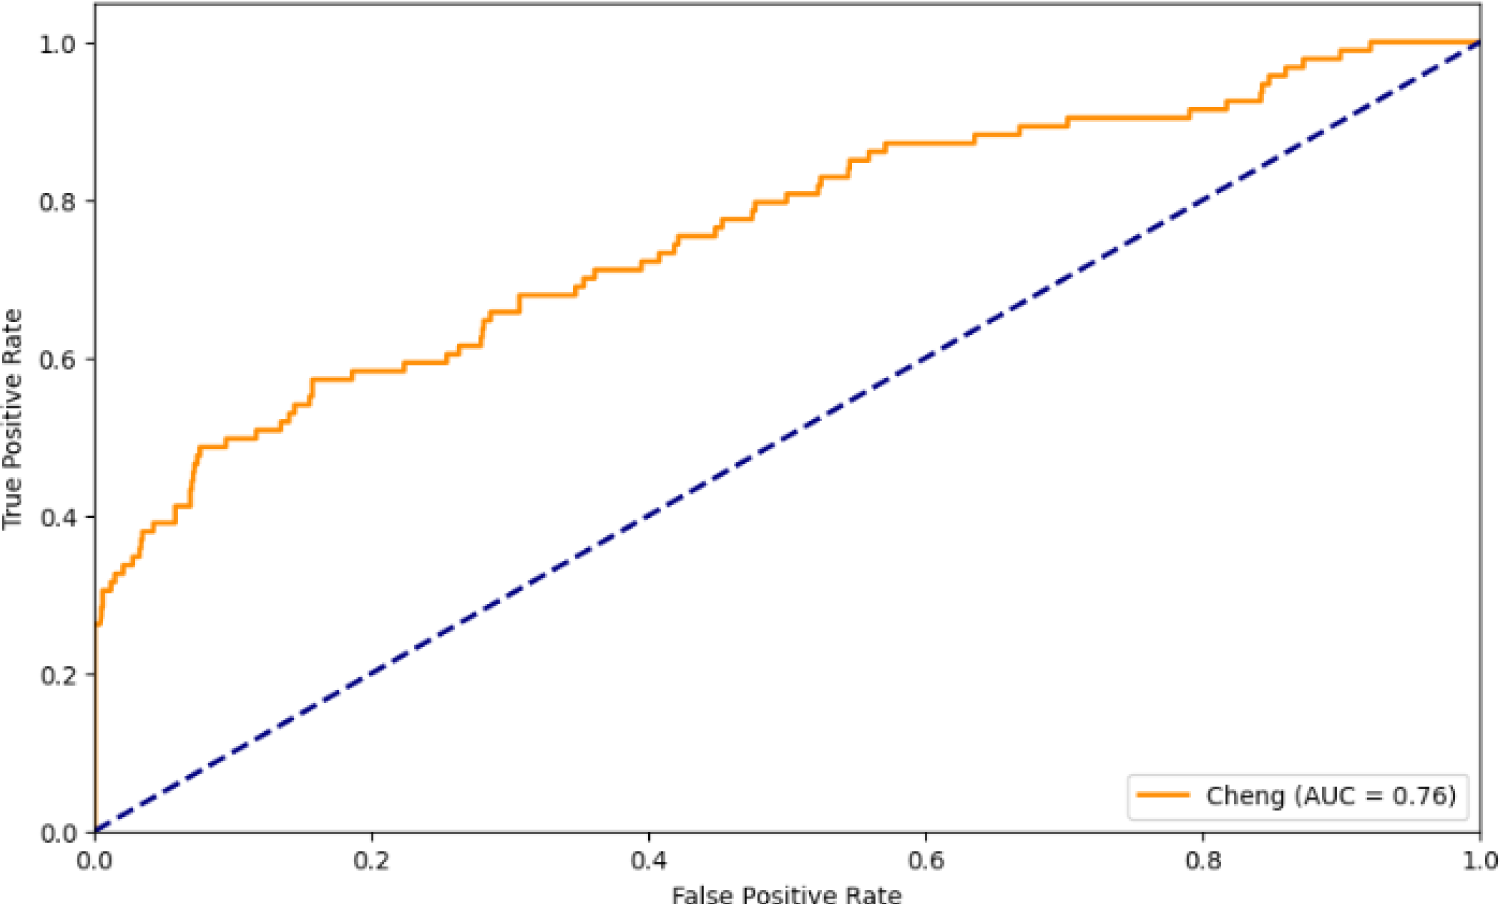
ROC curves illustrate the experimental result using functional similarity methods.
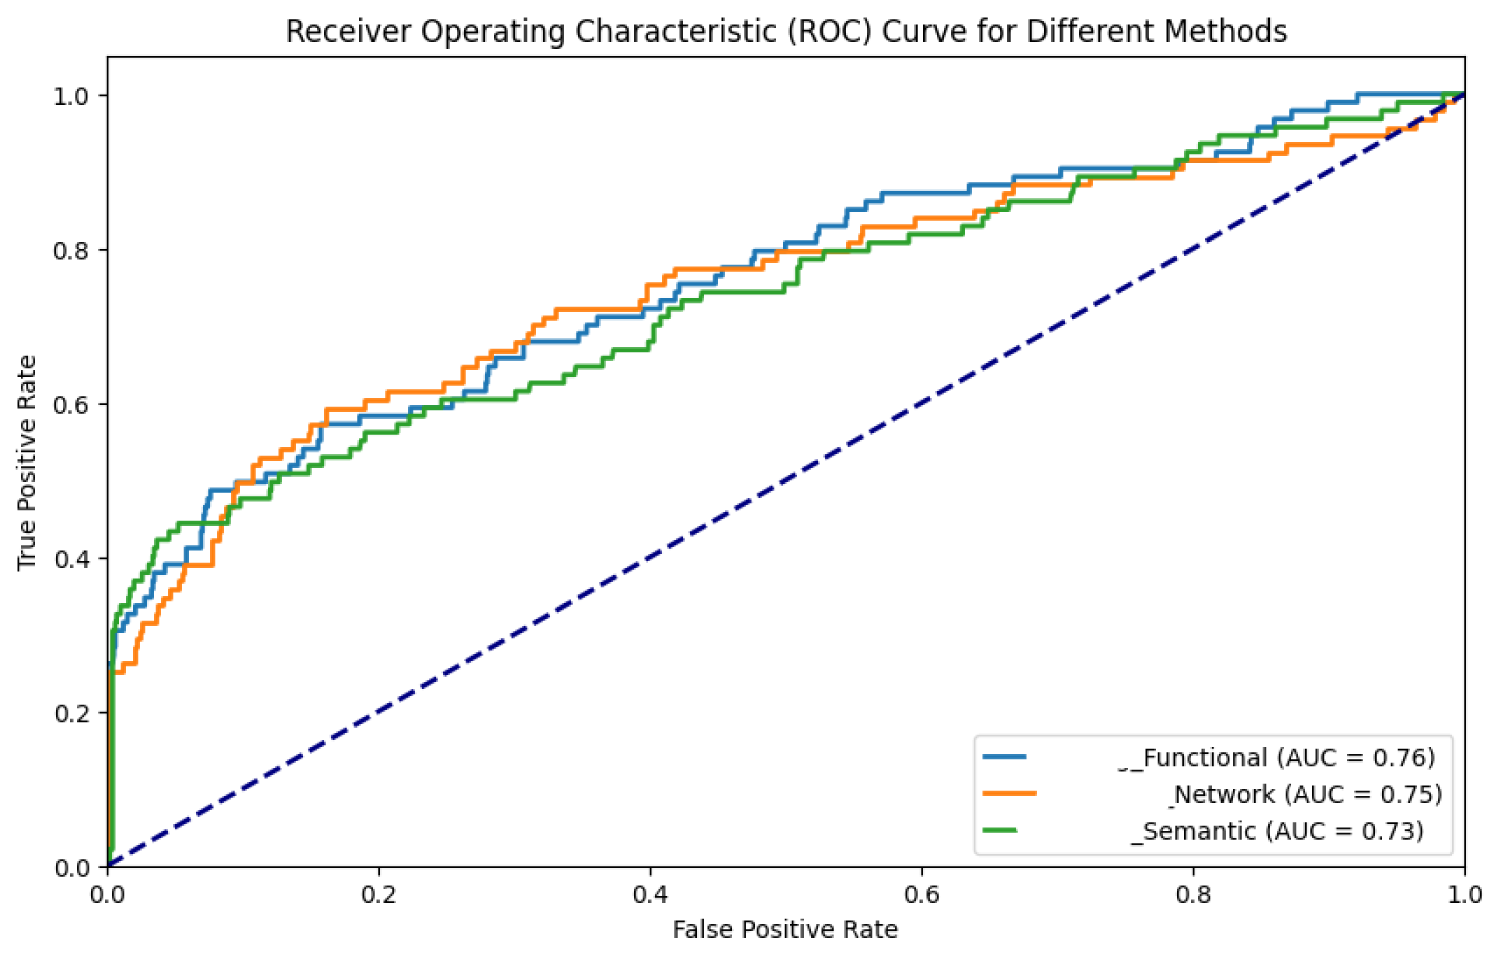
ROC curves illustrate the experimental results using Functional, Semantic and Network metrics.
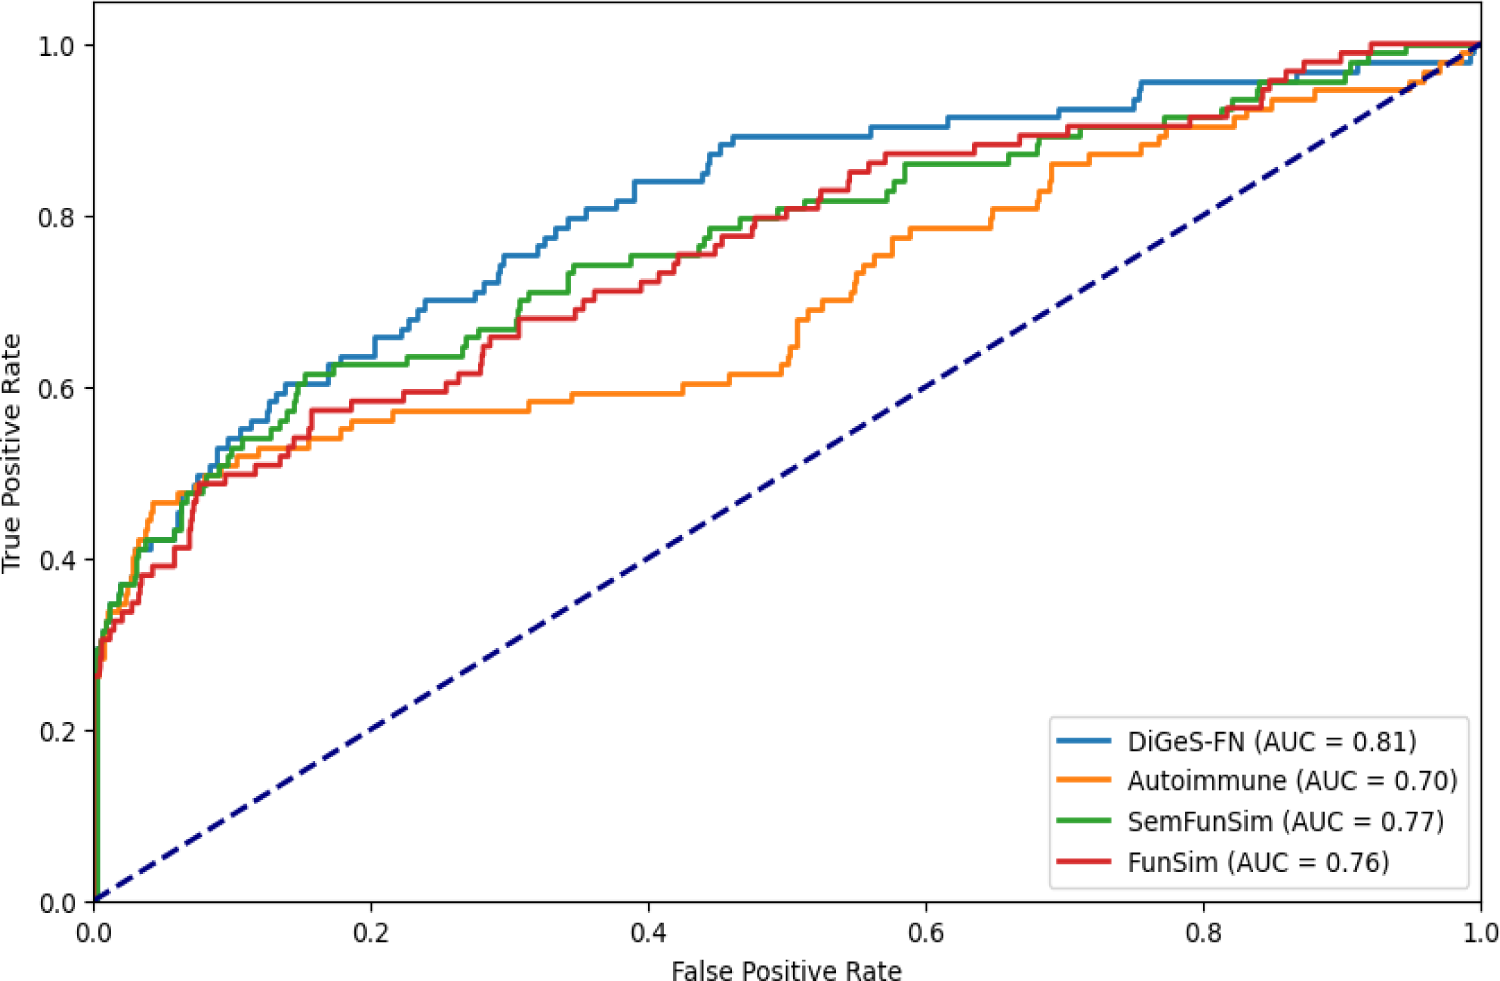
ROC curves illustrate the experimental results using combined similarity metric.
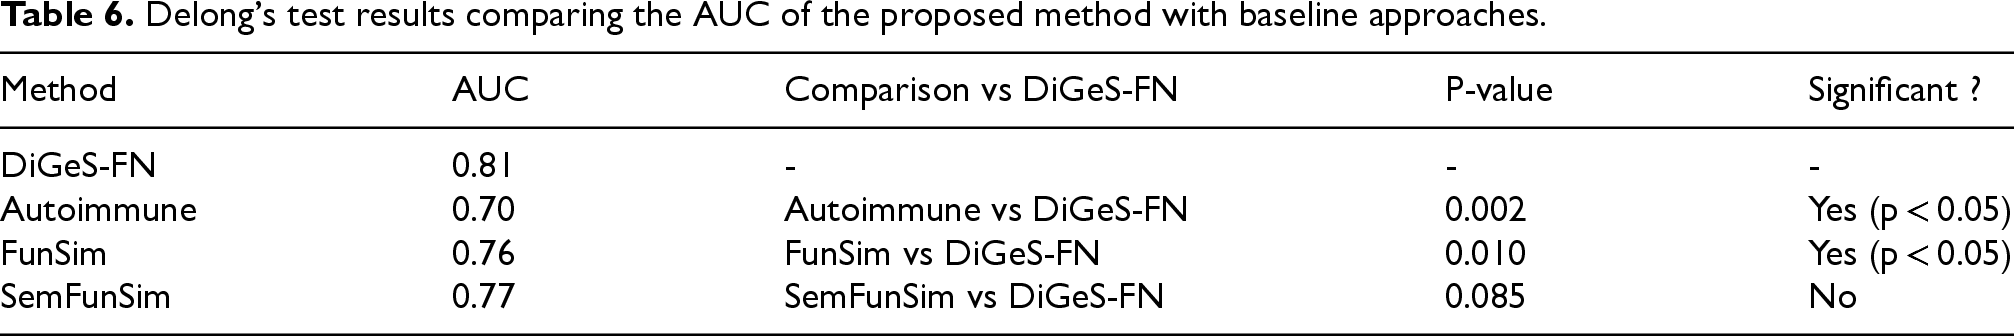
To evaluate the significance of the improvement achieved by the proposed method (DiGeS-FN), we conducted DeLong's test on the proposed method (DiGeS-FN) against Autoimmune, FunSim, and SemFunSim to statistically validate the differences in AUC values. The null hypothesis of DeLong's test assumes no substantial differences exist between the ROC AUC values of the compared methods. Table 6 presents the results. The proposed method achieved an AUC of 0.81, compared with 0.70 for Autoimmune, 0.76 for FunSim, and 0.77 for SemFunSim. The DeLong test confirmed that the improvements over Autoimmune (p = 0.002) and FunSim (p = 0.010) are statistically significant, demonstrating the robustness of the proposed framework. These results reinforce that DiGeS-FN consistently yields higher discriminative performance across different comparisons, validating its effectiveness over existing approaches.
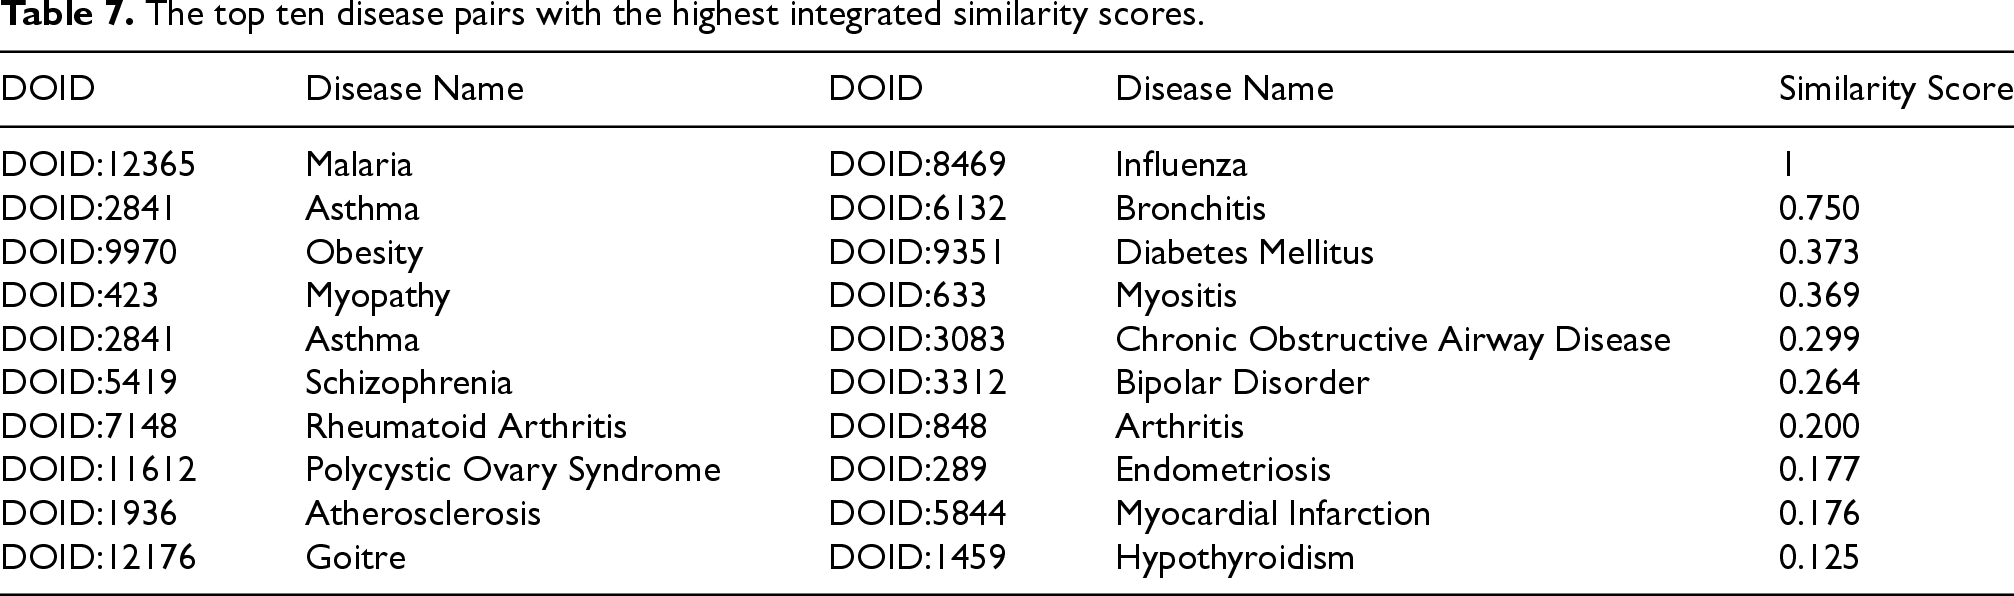
To further explore potential associations, all disease pairs were ranked in descending order according to their integrated similarity scores. The top ten pairs, presented in Table 7, represent the most promising candidates for biological validation and deeper investigation. Notably, pairs such as atherosclerosis–myocardial infarction, asthma–bronchitis and asthma–chronic obstructive airway disease emerged as highly significant, which aligns with well-established clinical and biological evidence. These findings underscore the capability of DiGeS-FN not only to capture known associations but also to uncover novel and meaningful disease–disease relationships.
Delong's test results comparing the AUC of the proposed method with baseline approaches.
The top ten disease pairs with the highest integrated similarity scores.
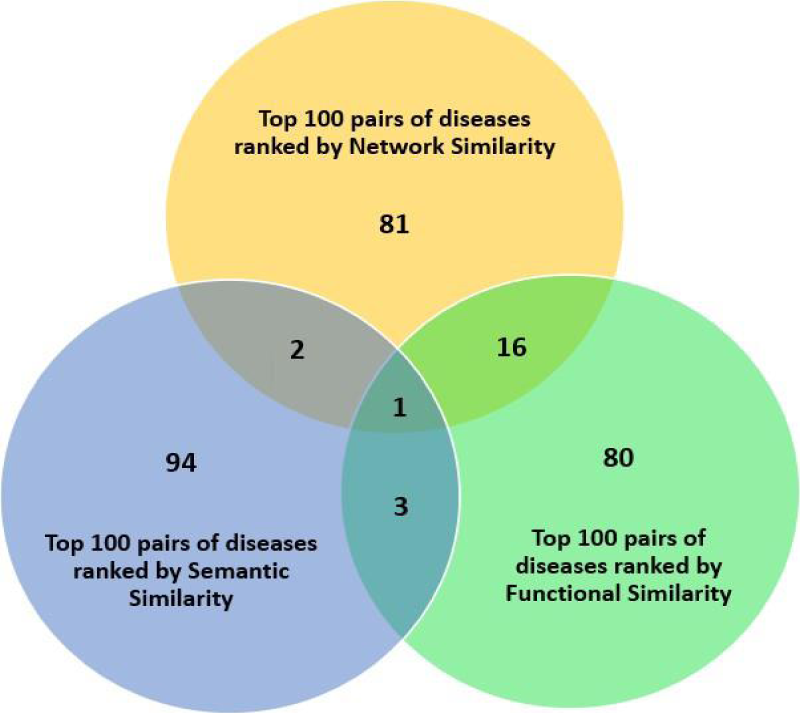
Analysis via Venn diagram for disease pairs ranked by network, semantic and functional similarity metrics.
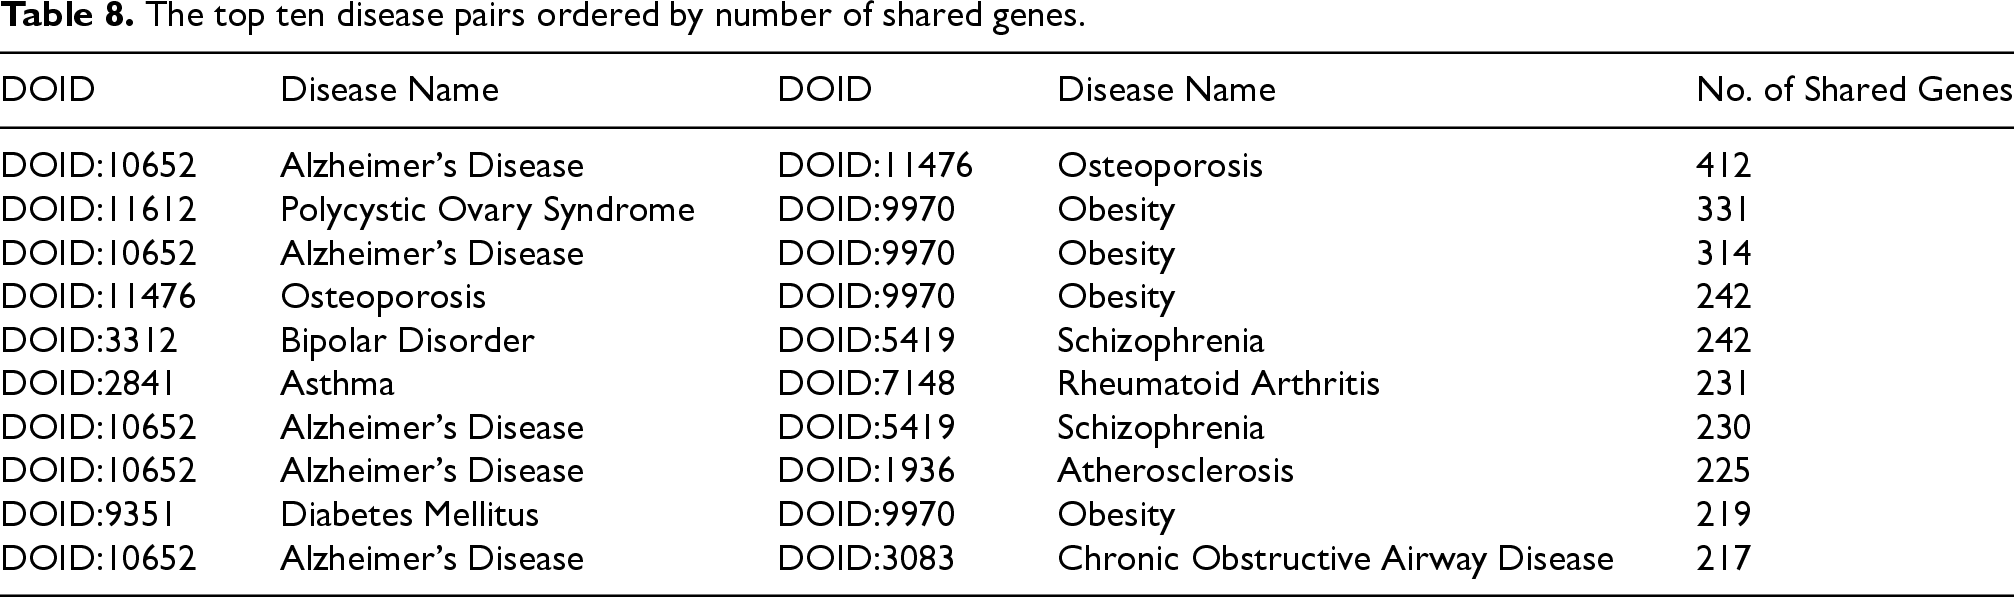
Additionally, we created a network using the ten disease pairs and their associated genes. The network's topological characteristics were analyzed. We identified 35 genes from the network, having the highest degree, which are potentially relevant to diseases. Prior studies have shown that these genes are linked to multiple diseases. A disease pair with a greater number of shared genes indicates a stronger likelihood of genetic similarity among them. Therefore, ten potential disease pairs were prioritized according to the number of genes they have in common, as shown in Table 8.
The top ten disease pairs ordered by number of shared genes.
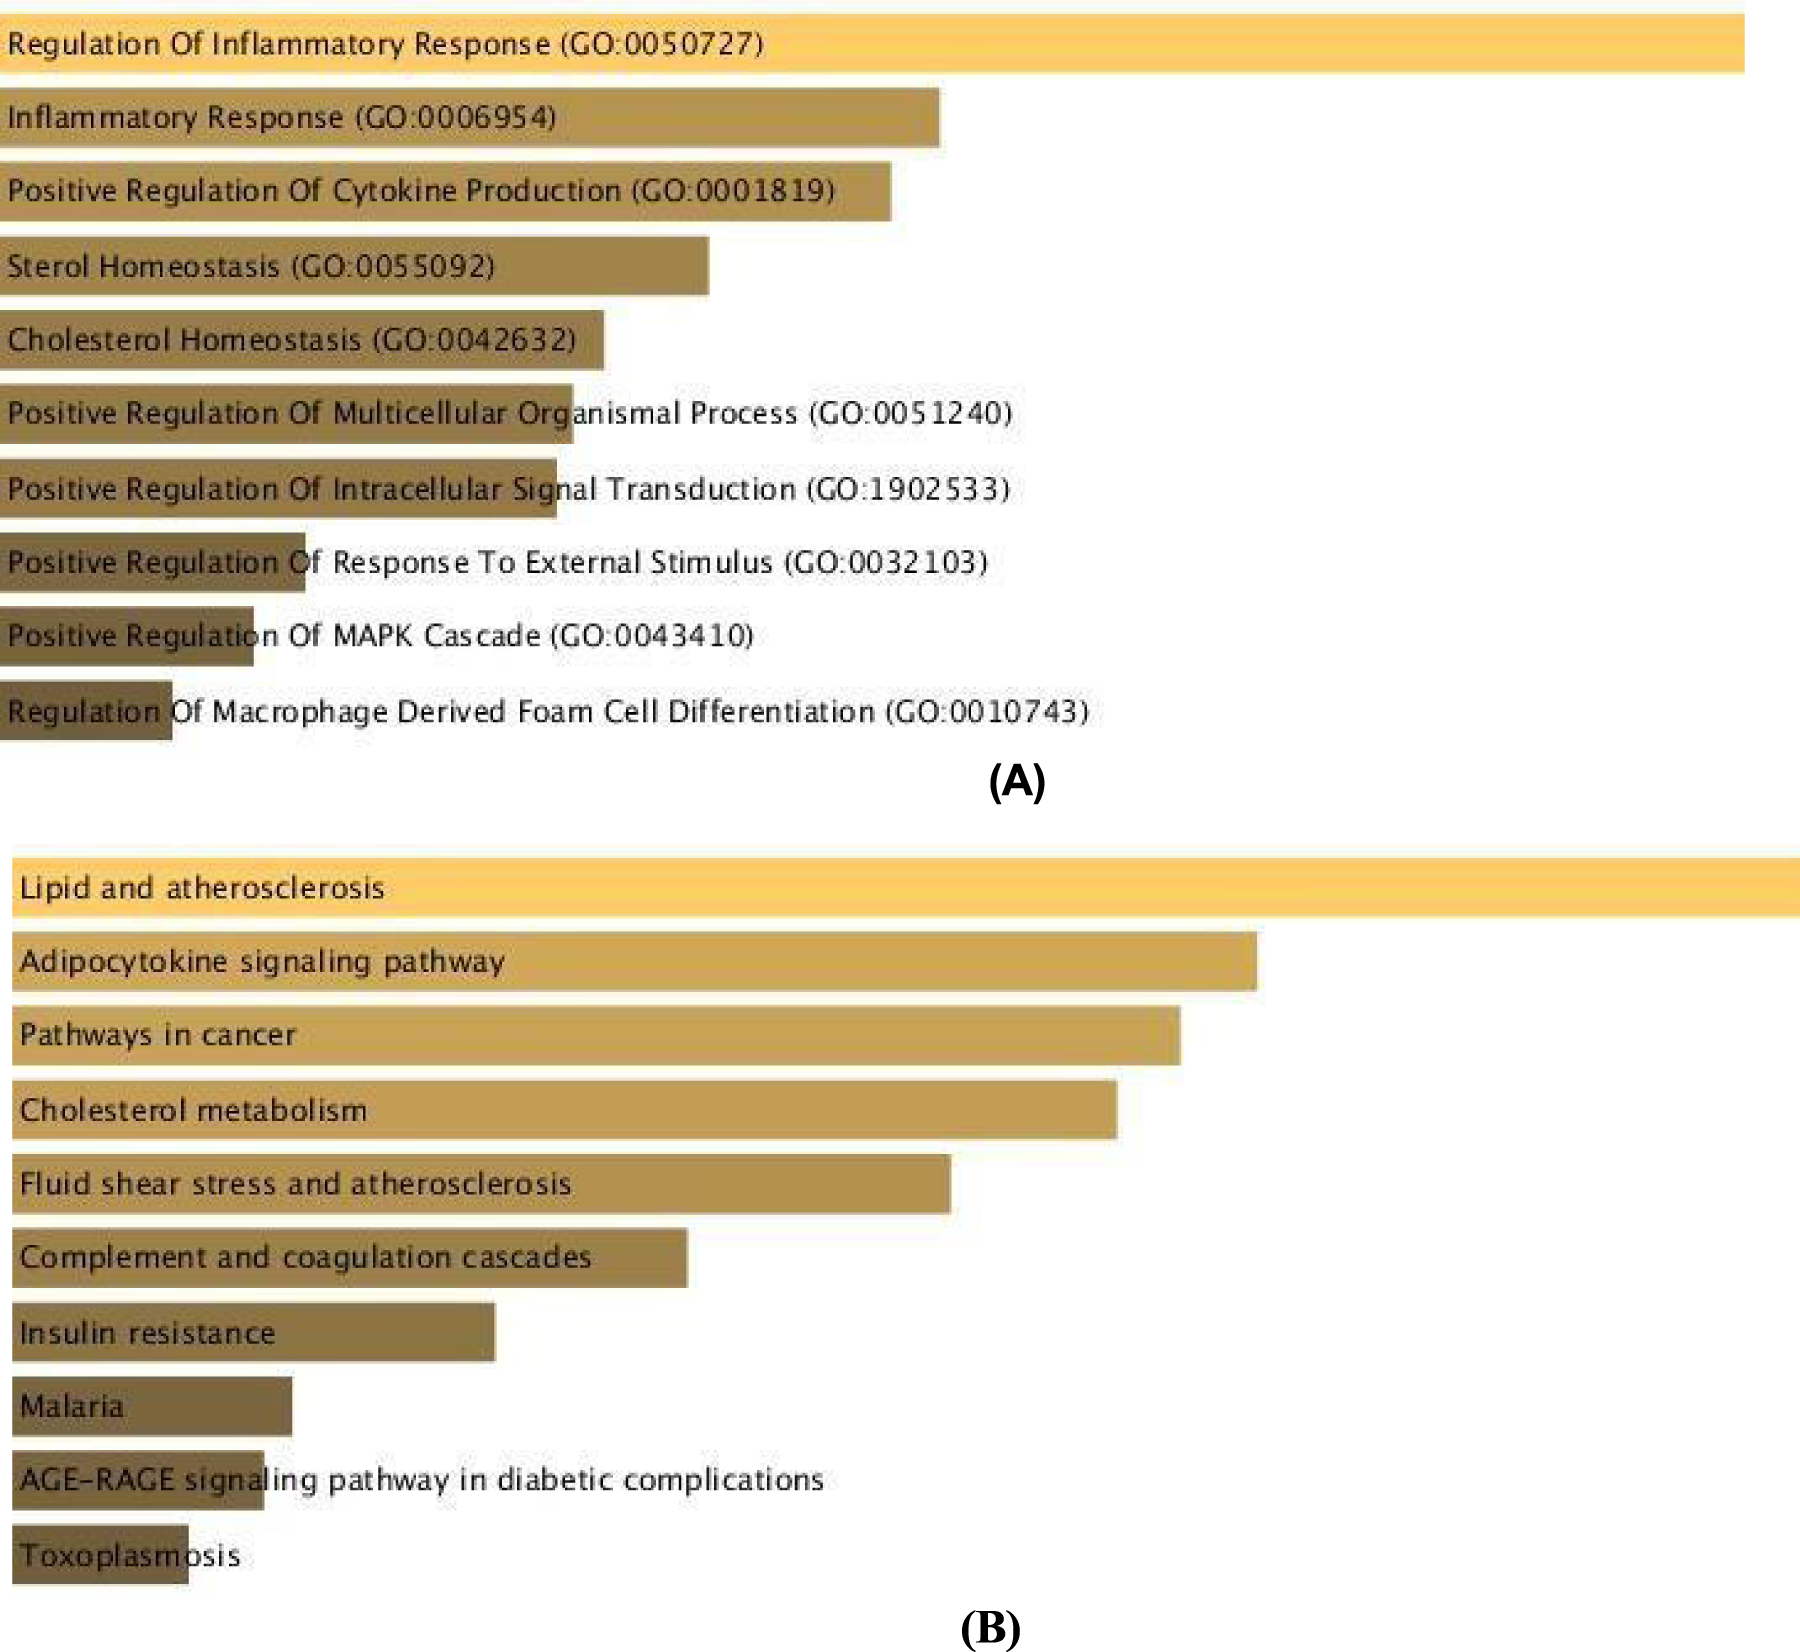
Functional Enrichment Analysis of Atherosclerosis and Myocardial Infarction (A-B) Functional enriched terms are ranked in descending order as per their p-values. For the key disease pairs, the top ten GO terms in Biological Process (BP) and KEGG Pathways were utilized for additional analysis.
We computed similarity among 47 diseases using a proposed method, DiGeS-FN framework that combines the best semantic, functional, and network metrics effectively. We identified ten pairs of potentially similar diseases based on the similarity score and the count of shared genes, which offered vital insights into understanding the shared mechanisms among multiple disease pairs (shown in Table 7 & 8). One notable example is atherosclerosis and myocardial infarction, for which we further examined the shared functional terms. Functional enrichment analysis revealed that genes associated with both diseases were significantly enriched in GO terms related to Regulation of Inflammatory Response (GO:0050727), Inflammatory Response (GO:0006954), and Positive Regulation of Cytokine Production (GO:0001819). The pathways that showed significant enrichment includes Lipid and Atherosclerosis, Adipocytokine signalling pathway and Pathways in cancer. This strong molecular link between atherosclerosis and myocardial infarction suggests that patients diagnosed with atherosclerosis may benefit from early cardiovascular screening and preventive interventions to mitigate myocardial infarction risk.
The clinical and translational relevance of DiGeS-FN framework lies in its ability to support disease comorbidity analysis, drug repurposing, and biomarker discovery
A) Atherosclerosis (DOID:1936) and Myocardial Infarction (DOID:5844): It was demonstrated in Libby et al. 49 that atherosclerosis is a major contributing factor to myocardial infarction. It was emphasized in Ross 50 that atherosclerosis has an inflammatory nature and focuses on its contribution to CAD (coronary artery disease) and myocardial infarction. The importance of the immune system in the evolution of atherosclerosis and its adverse outcomes, such as myocardial infarction, is discussed in Hansson and Hermansson. 51 An update on pathological mechanisms associated with Atherosclerosis to coronary syndromes, including myocardial infarction, is provided in Falk et al. 52 It was demonstrated in Davies 53 that atherosclerosis is the leading factor in causing myocardial infarction.
B) Asthma (DOID:2841) and Bronchitis (DOID:6132): Another significant disease pair association identified by our proposed method is the asthma–bronchitis pair, which shows a similarity score of 0.75. This pair stands out as a well-documented association, validating the model's accuracy. Clinical studies show that these two respiratory conditions share overlapping pathophysiology, including airway inflammation, hyper responsiveness, and early-life viral triggers.54,55. Genetic studies further reveal shared susceptibility loci linked to inflammatory responses and lung development. 56
C) Asthma (DOID:2841) and Chronic Obstructive Airway Disease (DOID:3083): Asthma and Chronic Obstructive Airway Disease form another identified disease pair, exhibiting a similarity score of 0.299.
The recovery of known comorbidities such as asthma and COPD (commonly referred to as Asthma–COPD Overlap, ACO) further supports the reliability of DiGeS-FN. Asthma and COPD share overlapping airway inflammation, remodeling processes, and genetic predispositions, and ACO has been increasingly recognized as a distinct clinical entity with worse outcomes than either disease alone.57–59 By correctly identifying this established pair, the model demonstrates its capacity to reproduce known biological relationships while also uncovering less obvious disease associations.
D) Polycystic Ovary Syndrome (PCOS) and Endometriosis: To demonstrate the discovery potential of DiGeS-FN beyond well-documented comorbidities, we highlight the disease pair Polycystic Ovary Syndrome (PCOS) and Endometriosis, which achieved a relatively high similarity score (0.177). Although PCOS and endometriosis are clinically distinct gynecological disorders, emerging literature suggests partial overlap in hormonal dysregulation, inflammatory pathways, and genetic susceptibility. For instance, Zondervan et al. 60 and Sapkota et al. 61 report genetic correlations and shared reproductive traits among women with these conditions. However, the biological basis of their co-occurrence remains underexplored. By identifying this connection, DiGeS-FN emphasizes its ability to capture less obvious disease relationships, which may guide future research into shared mechanisms and therapeutic targets.
Conclusion
This study demonstrates that two diseases with a significant similarity score, though clinically distinct, may share common genetic mechanisms and induce similar biological responses in the human body. Such genetically related diseases can often be managed using similar therapeutic strategies. Similarity among diseases can be found using three metrics: semantic, functional, and network. Each metric has its own importance. We found that the functional metric achieves the highest accuracy in the identification of similar diseases. We integrated all three metrics effectively and proposed a novel method, DiGeS-FN, to compute similar diseases to achieve the highest AUC area. The experimental results were evaluated on the benchmark dataset. The experimental evaluation shows that the proposed approach attains an AUC of 0.81% with strong TPR while maintaining low FPR. Beyond the case study of atherosclerosis–myocardial infarction, DiGeS-FN also identified several clinically meaningful pairs, including asthma–bronchitis, asthma–COPD, and polycystic ovary syndrome (PCOS)–endometriosis, which are supported by prior biological and clinical evidence. The paper further explored the biological processes and key pathways associated with these pairs, with enrichment observed in inflammatory responses, lipid metabolism, adipocytokine signalling, and cancer-related pathways. Although DiGeS-FN has been evaluated on a curated benchmark dataset of 47 diseases, the framework is inherently scalable and generalizable and can be extended to larger and more diverse disease datasets by incorporating additional ontologies and updated association networks. The modular nature of DiGeS-FN also allows it to be adapted to evolving biomedical databases, making it a useful tool for precision medicine.
Despite its strong performance and improved results over traditional approaches, there remain several opportunities for further enhancement. First, the framework depends heavily on the quality and completeness of input data, including gene-disease associations and interaction networks, which may introduce bias or noise. Second, the integration strategy assumes equal reliability of semantic, network, and functional metrics, which might not hold true across all disease types. Additionally, DiGeS-FN currently focuses on pairwise disease similarity and does not capture higher-order relationships (e.g., disease triads or clusters). Future work could address these issues by incorporating dynamic weighting schemes and expanding the model to multi-disease associations. DiGeS-FN can also be extended by incorporating multi-omics data and advanced multi-view learning models, thereby enhancing its utility in precision medicine and translational research.
Footnotes
Acknowledgements
The authors would like to thank their supervisor, colleagues, and family for their valuable contributions to this study.
Consent for publication
All authors have read and approved the final manuscript and have provided consent for publication.
Funding
The author received no financial support for the research, authorship and/or publication of this article.
Declaration of conflicting interests
The author declared no potential conflicts of interest with respect to the research, authorship, and/or publication of this article.