
Abstract
The integration of renewable energy sources and unpredictable demand has increased the complexity of electricity markets, challenging traditional capacity market-clearing models that restrict bidding to non-decreasing curves. This study proposes that allowing both non-decreasing and non-increasing bidding strategies enhances market flexibility and efficiency. To validate this, a hybrid optimization algorithm Lagrange Multiplier-based Dynamic Beetle Antenna Swarm Optimization (LM-DBASO) is developed. The capacity market clearing problem is formulated as a nonlinear, large-scale, multi-objective optimization task incorporating efficiency, reliability, and fairness. A weighted-sum scalarization method enables tractability, with priorities embedded into a single objective function. LM method ensures constraint satisfaction, while the DBASO component provides adaptive global search. Unlike penalty-based methods, LM-DBASO maintains feasibility throughout the search process. The model is implemented in PyTorch for scalability and computational efficiency. A game-theoretic perspective approximates Nash equilibrium through iterative convergence, ensuring that no generator can unilaterally improve its outcome. Simulation results demonstrate the model's effectiveness, achieving an efficiency ratio of 98%, electricity conception ratio of 99%, and system security ratio of 95%. The proposed approach improves bidding rationality, accelerates market clearing, and enhances societal welfare, making LM-DBASO a robust solution for modern electricity market challenges.
Keywords
Introduction
The growing integration of renewable energy sources, increasing variability in energy demand, and the need for a reliable power supply have changed modern electricity markets. 1 Changes have impacted grid stability, with the capacity market responsible for ensuring sufficient generation capacity. Existing mechanisms face challenges in efficiency, fairness, and adaptability due to the increasing complexity of power systems.2,3 Capacity markets compensate power generators during system stress events and help maintain system reliability, ensuring long-term reliability in deregulated electricity systems, alongside energy markets, and are crucial in energy forecasting markets.4,5 Capacity markets often have linear or convex constraints, limiting flexibility. Generators may submit non-convex bids based on locations, energy forecasts, renewable energy penetration levels, or regulatory tasks. 6 The need for optimization models to create efficient bid designs is increasing, but designing an equitable capacity market remains challenging. The clearing mechanism, which determines generator selection and pricing, is crucial for efficiency. 7 Existing methods, primarily based on technique, often impose non-decreasing supply curves and restrictions through bidding structures, limiting generator flexibility, especially for less traditional capacity services characteristics. 8 Furthermore, current market-clearing approaches do not accommodate operational limitations in all cases, and often these limitations are derived from environmental events.9,10 New optimization formulations, including non-convex formulations, stochastic formulations, and dynamic pricing valuations, seek to minimize generation costs while maintaining reliability and regulatory limitations in the weather prediction industry.11,12 Advanced optimization models allow a more flexible representation of market participants’ capabilities, incorporate complex limitations into clearing processes, and allow for dual disintegration of optimization problems, commitment optimization for generation, and separate evaluations of prices. 13 The research intends to develop a model of a capacity market clearing mechanism that can enhance flexibility and efficiency by considering real-world operational limitations, such as reserve margins, emissions regulations, and renewable energy forecasting integration, enhancing reliability and cost savings.
The novelty is in the adaptation and incorporation of the Lagrange Multiplier method within the Dynamic Beetle Antenna Swarm Optimization (LM-DBASO) framework for capacity market clearing. The method explicitly incorporates non-increasing bidding curves and is therefore a more realistic representation of generator behavior than previous research that assumed strictly convex bidding curves. This integration contributes to the current literature, as it provides an adaptable and computationally tractable approach to capacity market design in conjunction with adequate simulation trials and performance assessments. Although the contribution is focused on a real issue that has received little study in terms of power market clearing, it is methodological in its adaptation and application rather than simply an articulation of algorithms.
Research organization
The rationale for the capacity market clearing mechanism's design of mathematical modeling and optimization is presented in Section 1. In Section 2, relevant literature on power market models is reviewed, and current constraints are emphasized. The suggested LM-DBASO model and its application are explained in Section 3. The simulation results are shown in Section 4, along with a discussion of the gains in computing stability, accuracy, and convergence. Section 5 brings the study to a close and describes how it has improved the efficiency and rationale of capacity market clearing.
Related works
Interregional transactions encourage the use of renewable energy forecasting and optimize resource allocation. The transaction path-based methodology was utilized for market clearing, but has difficulty with pricing. 14 The research enhanced the model by taking into consideration the locational marginal pricing in the markets. The physical significance of the locational marginal price was examined, and limitations were addressed for effective market pricing using Lagrange multipliers. The research investigated the multi-area joint market clearing of energy forecasting and reserves using Generalized Coordinated Transaction Scheduling (GCTS). 15 The framework simulated potential outages and forecasted inaccuracies in interdependence, ensuring optimal dispatch using market participants’ interface bids and calculating marginal prices for internal and external assets. The challenge of capacity remuneration entails establishing the range of installed definitive capacity required to maintain long-term power system adequacy. 16 The research tested an economically sustainable pricing model on the regional block, demonstrating the need for additional facilities to stabilize energy consumption and provide indications. The suggested Alternating Direction Method of Multipliers (ADMM) was a distributed market-clearing strategy for the energy forecasting sector that takes into account all actors’ preferences and technological constraints. 17 The concept, recognized on a test network, combined prosumers, distribution system operators (DSOs), and local market operators to safeguard secrecy while offering attractive benefits in coordinated energy prediction community initiatives. The capacity market characteristics were critical in calculating system adequacy requirements. A system for determining these requirements was suggested based on generator investment decisions. 18 The estimates combined revenues from two markets, created an investment preference strategy, assessed the effectiveness of the capability market using dynamic simulations, and provided an optimal parameter range approach. The system for distribution has been suggested to provide flexibility in energy trading, with microgrids (MGs) engaging in local markets. 19 Optimised parameters and feature weights using Harris Hawks Optimisation (HHO) in conjunction with Support Vector Machine (SVM) to improve cyber threat identification. 20 With high accuracy across seven benchmark datasets and up to 100% accuracy on the URL dataset, the proposed HHO-SVM produced excellent results. However, when applied to large-scale datasets, constraints include a somewhat lower accuracy in detecting fake news and a higher computing complexity. The perceptron neural network was trained, and its input coefficients were found using an integrated meta-heuristic approach. 21 The aim was to improve the accuracy of forecasts and compare performance to invasive weed and ant colony optimisation. The findings revealed that the proposed method increased forecasting accuracy and brought faster convergence. However, applying the approach had limitations that increased computing complexity and the challenge of scaling for very large datasets. The Hashed Needham Schroeder–Cost Optimized Deep Machine Learning (HNS-CODML) was proposed for data communication in the cloud framework for secure Industrial IoT data transmission. 22 It produced better execution time, efficient monitoring, and authenticated data exchange between cloud users despite its limitations associated with the scalability of extremely large IoT networks and potential risks to advanced cryptographic attacks. The research suggested an Effective Seeker Optimization with Machine Learning-Enabled Intrusion Detection System (ESOML-IDS) for fog and edge computing environments. 23 Findings indicated improved efficiency and effectiveness in detection over more recent detection methods. Limitations associated with the research included potential computational overhead and loss of performance in highly dynamic or large-scale networks. The study presented an intuitionistic fuzzy hypersoft set (IFHSS) method for addressing uncertainty in municipal solid waste (MSW) management. 24 Findings indicated that the proposed method produced more stable and dependable results than existing approaches, but limitations clearly included the exclusive focus on thermochemical methods, potential complexity issues, and reliance on expert judgement. The research applied MEDALUS methodology to evaluate desertification risk in the Rheris watershed region in southeastern Morocco applying climate, soil, vegetation and management quality indices. 25 The findings confirm that the watershed is characterized by 66.85% severely sensitive, 31.24% fragile, and 1.90% susceptible to desertification with only 0.01% as low sensitivity. The limitation was to integrate socio-economic factors along with the use of stationary environment data with no resolution, which may alter the prediction capacity in the long-term. The elimination of Eriochrome Black T dye using Pisum sativum biomass, biochar, ZrO2 nanoparticles, and a ZrO2-Pisum sativum nanocomposite (ZrO2 NCs) was examined. 26 Under ideal circumstances, ZrO2 NCs, which were identified by SEM and FTIR, demonstrated the greatest performance, attaining 92.65% clearance. Long contact times and the requirement to verify performance in actual wastewater systems are among the drawbacks. The research of heavy metal pollution was conducted on road dust samples (n = 92) collected from Multan, Pakistan, to determine potential sources of heavy metal contamination and possible health risks associated with exposure. 27 The levels observed for Cu, Zn, As, Cr, and Pb were, in general, proportionately higher than typical levels found in earth crusts, with origins from traffic associated with anthropogenic activity, as well as industrial activity. Overall, As appeared to pose the highest carcinogenic risk, posing the most significant risk to children. Limitations in this study included only seasonally sampled road dust, and not including more extensive socio-environmental data needed to develop long-term heavy metal risk assessments. A composite hydrological response anomaly index (CHRAI) was devised for the Oum Er-Rbia River basin (Morocco) using satellite data and a weightings approach based on Random Forest to compute P–ET anomalies. 28 The findings showed evidence of strong spatiotemporal variability of the CHRAI, as it was consistent with observed regional drought indices (r = 0.87) with 90% (estimated) confidence or agreement shown in the Taylor diagram Analysis. Key limitations of this study include a reliance on satellite data, and further testing with expanded validation would be valuable to establish confidence in the output across basins. Developed a Distributed Adjustable Load Resources and Settlement (DALRS) model combined with a resource bidding allocation technique to manage flexible renewable energy resources in smart grids. 29 Results show improved bidding schemes, better market access, and optimized supplier strategies. The model's performance may be constrained by forecast uncertainties and the variability of distributed renewable resources. Employed an interval-based market clearing method powered by nonparametric probabilistic forecasting, with two-stage interval optimisation resolved by Benders decomposition. 30 The findings demonstrate enhanced economic efficiency and dependability, smooth forecast inclusion, and optimal interval selection. Forecast accuracy determines performance, and for large-scale, highly uncertain systems, computing complexity rises. Developed a benchmark model of a capacity mechanism in competitive electricity markets, analyzing the effects of wholesale price caps and capacity payments to identify socially-optimal investment incentives. 31 Results indicate optimal policy combinations, but the model is limited by assumptions of market competition, static technology costs, and simplified system dynamics. Suggested a theoretical framework to value variable generation and energy storage in electricity capacity markets, based on balancing expected energy unserved against capacity procurement costs. 32 The approach aligns with traditional risk-based equivalent firm capacity methods and accounts for storage flexibility and rescheduling within existing systems. Its practical application requires careful consideration of existing storage and scheduling interactions, which can complicate implementation. Provided a reliable and user-friendly predictive model by using a nonlinear autoregressive (NAR) neural network on historical energy consumption data to forecast global energy demand over the next ten years. 33 The model's results demonstrate that it accurately captures consumption trends with strong training, testing, and validation performance while avoiding overfitting, but that abrupt structural changes or unforeseen shifts in energy use may reduce its reliability.
The current study utilized a modified alternating direction method of multipliers (ADMM) and a strong model to test regional adaptability in markets. The adaptability market was identified as a complementary mechanism to bilateral energy trading as well as a distribution method for improved equity for modal options, while the test system was a benchmark.
Research gap
Existing approaches, such as stochastic optimization, 14 ADMM-based distributed market clearing, 17 and machine learning-driven models,20,22 exhibit notable drawbacks. Stochastic methods often face unstable convergence under uncertain renewable forecasts. ADMM requires high communication overhead and synchronization across market participants, while ML-based solutions depend heavily on training data and cannot guarantee feasibility under strict constraints of mathematical modeling. These limitations leave a research gap in simultaneously ensuring scalability, feasibility, and computational efficiency in large-scale market clearing. The proposed LM-DBASO bridges this gap by integrating Lagrange multipliers for guaranteed constraint satisfaction with the adaptive search capability of Dynamic Beetle Antenna Swarm Optimization. This synergy ensures feasible solutions at each iteration, accelerates convergence, minimizes overhead, and outperforms existing stochastic, ADMM, and ML-based techniques in achieving accurate and stable market clearing.
Materials and methods
The Lagrange Multiplier (LM) method is a useful tool for modeling non-increasing stepwise bidding curves in capacity market clearing. It offers a continuous relaxation framework, ensuring tractability and economic feasibility, unlike mixed-integer programming techniques. LM provides greater convergence guarantees for convex substructures and interacts with the DBASO framework, balancing adaptive search and constraint satisfaction. This mathematical modeling preserves computing efficiency while capturing strategic and operational aspects of market clearing. The methodology combines an LM-DBASO optimization algorithm with the Lagrange Multiplier mathematical modeling for capacity constraints to adaptively find optimal solutions and estimate market-clearing prices. The framework uses mathematical and search space techniques to dynamically model capacity clearing in the energy market, resulting in efficient, reliable, and economically optimal resources. Figure 1 shows the flow of the recommendation technique.
Data collection
The capacity market bidding and clearing data were gathered from the open-source Kaggle website: https://www.kaggle.com/datasets/zoya77/capacity-market-bidding-and-clearing-data-2025. The dataset contains detailed bidding and operational data from an energy capacity market, including different generator types, regions, and bid mathematical modeling. It comprises quantitative information on bid prices, capacity, demands, and cleared quantities for power-producing units. The data illustrate market behavior under various regulatory and economic settings, emphasizing generator responses to capacity market incentives. The dataset is designed for market-clearing system analysis and evaluation, providing categorical and numerical parameters to measure market participant characteristics and bidding outcomes.
Data exploration
Figure 2 illustrates the 15 highest variables that impact the design and optimization model of the capacity market clearing mechanism. “Operational_Status” was the most significant variable, followed by indicators of market constraints and bid variables that have a high degree of influence over capacity allocation and bids. The analysis suggests improvements in clearing efficiency, accurate forecasting, capacity bid decisions, and operational planning in energy forecasting markets, despite fewer influencing variables like ramp rates and generator types.
Assumptions made throughout the simulation phase included that demand and bidding patterns would not change, that generators would act rationally in accordance with the principles of Nash equilibrium, and that the Kaggle dataset accurately reflected actual market conditions. Additionally, it was assumed that the suggested LM-DBASO architecture and available computational resources might expand to broader market settings while simplifying operational restrictions by not fully modelling grid contingencies or regulatory interventions.
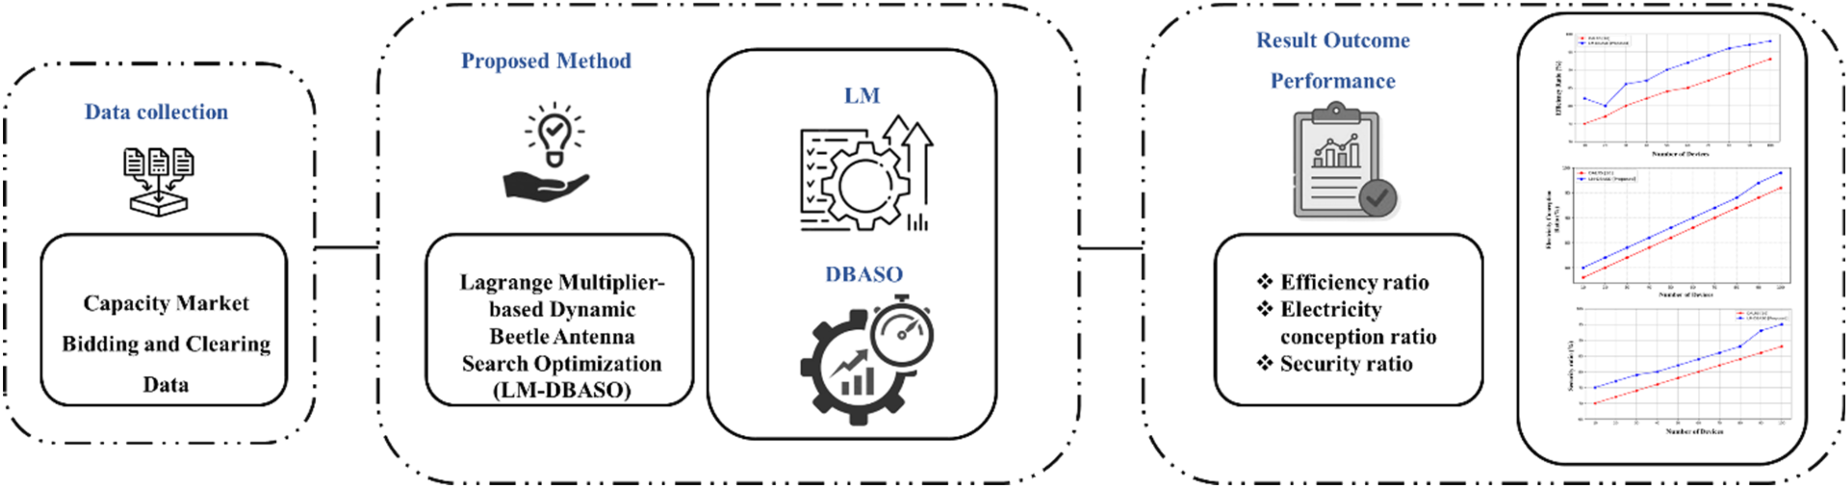
Flow of the recommended technique.
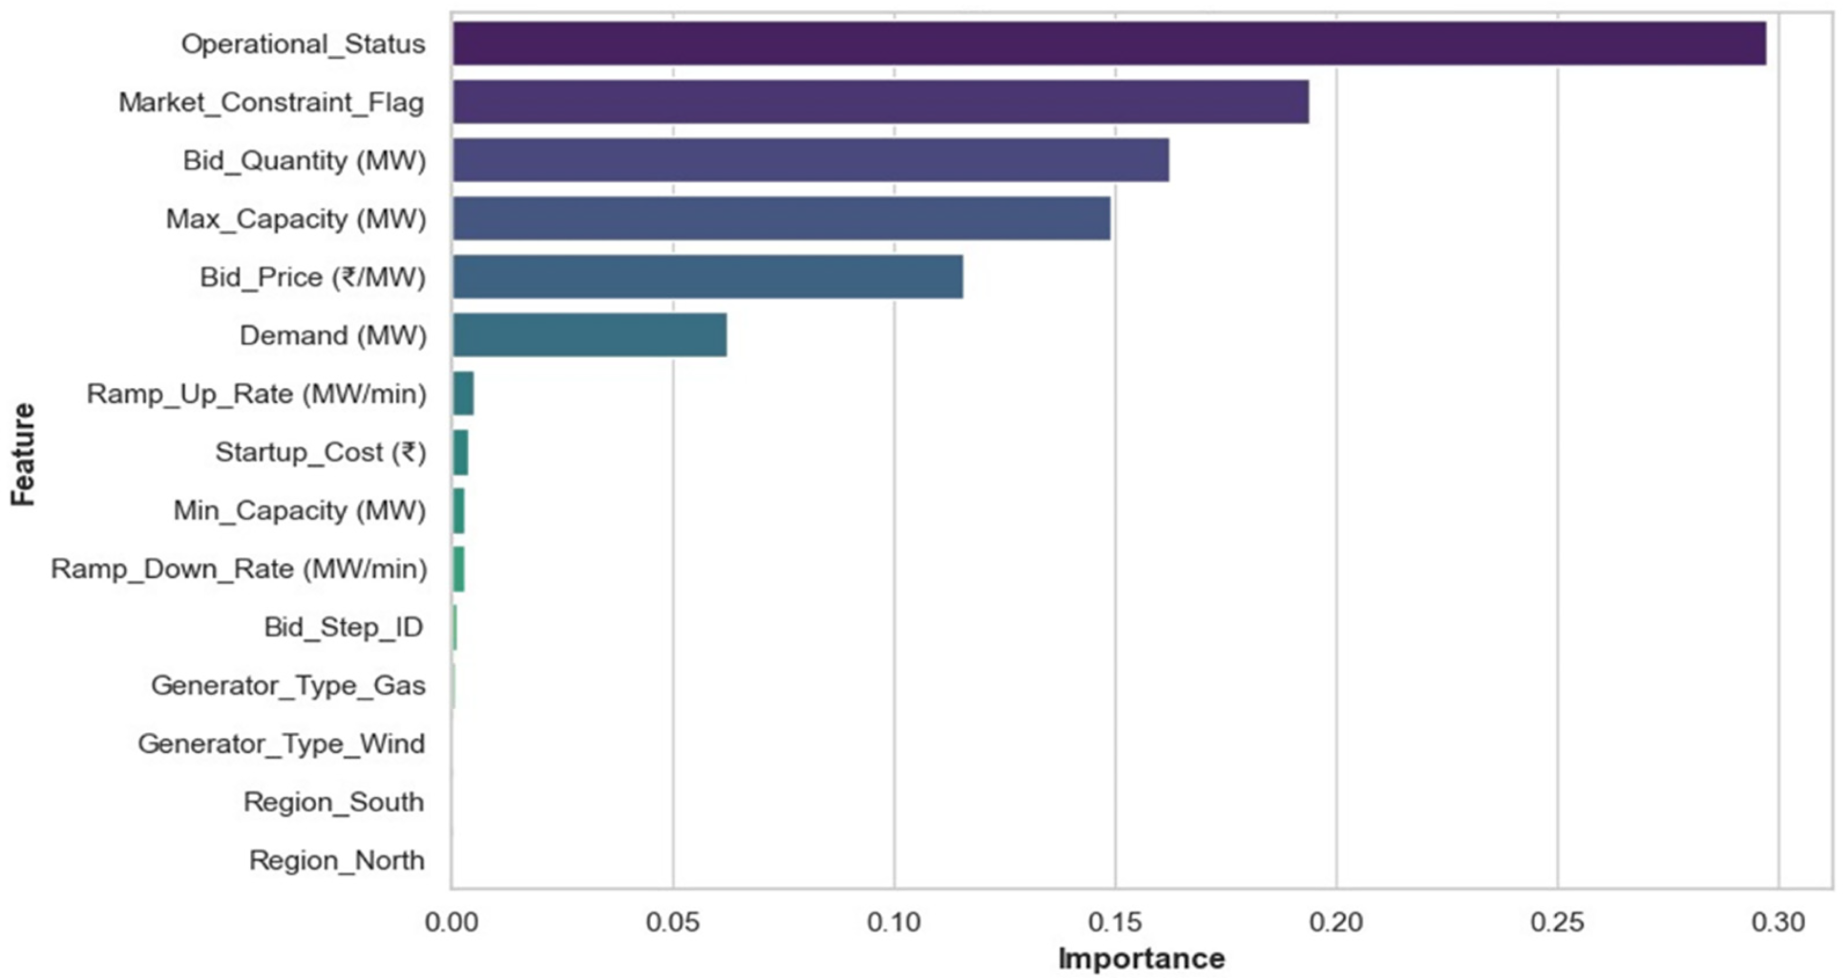
Feature importance in the capacity market clearing mechanism model.
The novelty of LM-DBASO lies in embedding the LM method directly into the DBASO process, enabling simultaneous constraint enforcement and adaptive search. Unlike standard metaheuristics that rely on penalty functions for constraints, LM-DBASO integrates mathematical rigor to maintain feasibility throughout the search, while DBASO ensures dynamic global exploration. This dual mechanism achieves faster convergence, more reliable constraint satisfaction, and higher accuracy in predicting market-clearing outcomes compared to using LM or DBASO alone. The research proposes an innovative hybrid approach, LM-DBASO, which integrates mathematical rigor with bio-inspired optimization to improve capacity market clearing and system dependability. LM-DBASO is a hybrid optimization framework that combines the mathematical rigor of LM as the optimization method for capacity constraints with the adaptive search capability of DBASO. The LM-DBASO algorithm represents a robust and effective algorithm for optimizing mathematical modeling of capacity marketing clearing. It balances supplies and demand, constraints of operations are honored, and an antenna is used to perturb a feasible market-clearing solution. In this dynamic algorithm, the step size can be adjusted to achieve convergence. The capacity market clearing problem is presented as a multi-objective optimization problem in this research, where competing objectives related to justice, efficiency, and reliability are balanced. These objectives are combined into a single scalar-valued objective function to ensure tractability using a weighted-sum formulation. The weights represent system priorities, such as emphasising efficiency and cost reduction while incorporating reliability and security as constraint-penalized terms. Given its computing efficiency and compatibility with the Lagrange Multiplier framework, the weighted-sum formulation was selected, even though Pareto-based optimisation could also be used.
The research's use of Nash equilibrium is meant to convey the strategic character of capacity market bidding, in which each generator aims to maximise its payout in light of other generators’ actions. Our framework uses iterative optimisation to approximate the Nash equilibrium rather than solving it analytically. The DBASO algorithm adaptively perturbs bids to find stable solutions where no generator can unilaterally improve its result, while the LM method enforces market-clearing constraints. Convergence, a computational stand-in for Nash equilibrium, is achieved when subsequent iterations produce no discernible unilateral gain. Therefore, stability in the optimisation process, rather than a closed-form game-theoretic proof, is used to verify the equilibrium even though the market is modelled as a non-cooperative game among strategic agents.
Algorithm parameter tuning
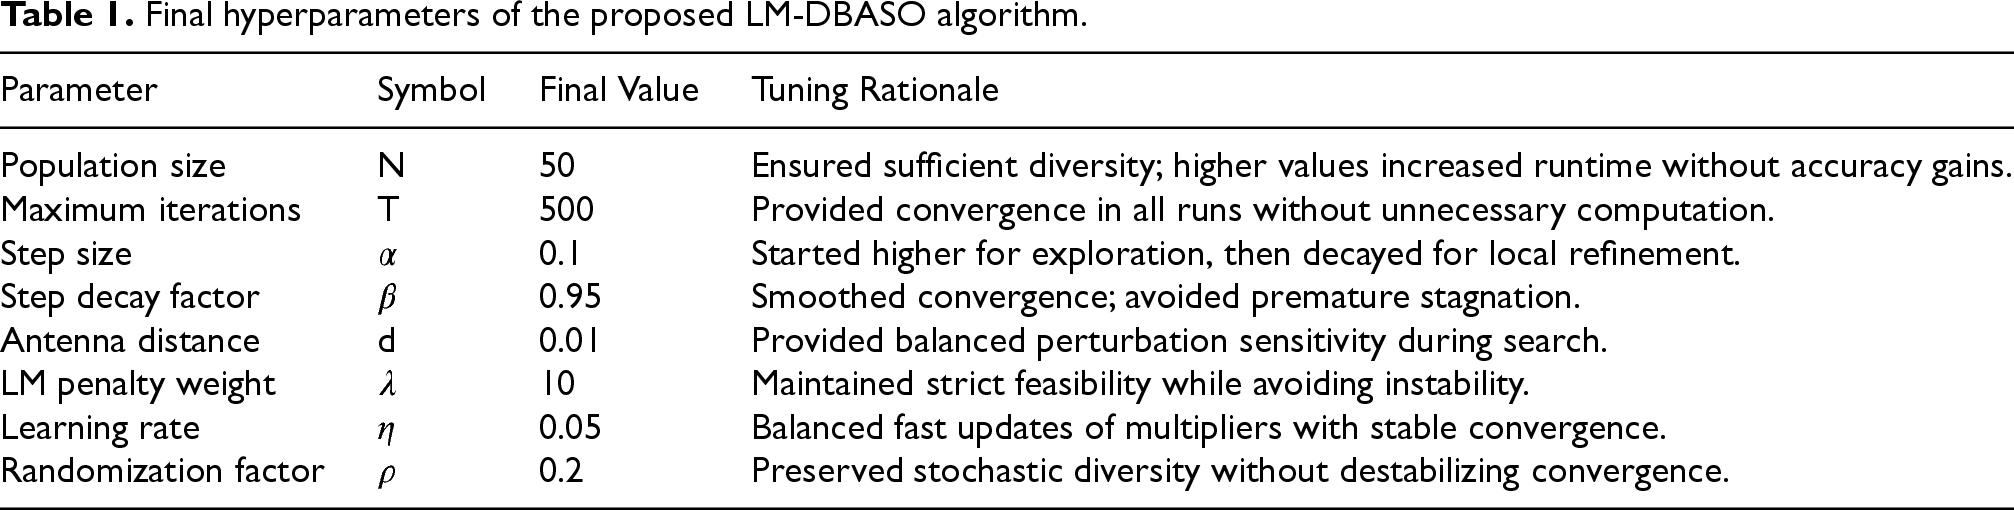
Since LM-DBASO employs dynamic exploration in DBASO for quicker convergence and a wider range of solutions, and combines Lagrange multipliers for efficient constraint handling, it was selected above PSO and GA. To ensure consistent performance across simulations, parameter tuning was carried out using grid search, which selected ranges that balanced convergence speed and computational cost while optimising efficiency and minimising error. Algorithm parameters were tuned using a grid search, testing multiple values and selecting those that maximized efficiency and minimized error. Step size and antenna distance were set large for exploration and decayed for fine-tuning, population size balanced diversity with computation, and the learning rate (η) was adjusted to ensure stable convergence without oscillations. The hyperparameters of LM-DBASO were tuned using a grid search strategy across multiple candidate ranges, with performance evaluated on three key indicators: efficiency ratio, residual error, and convergence stability. Each parameter was systematically varied while holding others constant, and the combination yielding the most consistent results across five independent runs was selected. This ensured robustness and minimized sensitivity to initialization. Table 1 shows the hyperparameters.
Final hyperparameters of the proposed LM-DBASO algorithm.
Final hyperparameters of the proposed LM-DBASO algorithm.
The LM method is a powerful mathematical modeling for solving constrained optimization problems. While offering a mathematical modeling for effective and influential capacity allocation and consultation of required capacity restrictions, LM aids in the balancing of supply and demand requirements in the context of modelling and optimising the capacity market clearing mechanism. The optimized approach to market equilibrium in the electricity market, based on generation and consumption costs, enhances reliability and economic efficiency.
Notation
The capacity of the 

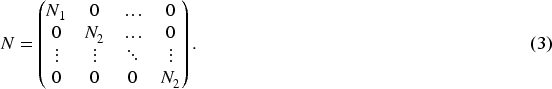
The dimension of a limitation is the number of dimensions of flexibility that it minimizes from the market-clearing procedure. As previously mentioned, a constraint is defined as a linear condition on resource dispatch changes. A restriction with dimensions m can be stated as an m-dimensional conditional on capacity modifications, such as Eq. (4):

Each matrix
To implement operational limits in capacity market clearing mechanisms, constraint signals must be inserted, evaluating primary restrictions preserved by minimal intervention signals. The fundamental concept is to use the least amount of force required to achieve limits, despite its difficulty in describing in response to changing market circumstances. In terms of mathematics, the constraints signal 
Here 
Where 
They can express all restrictions efficiently as follows, Eq. (8):

Additionally, the LM
DBASO is a bio-inspired optimization algorithm that imitates the searching behavior of beetles that utilize their antennae to efficiently gather information optimally. DBASO is used in capacity market clearing to optimize energy forecasting resource allocation while considering cost efficiency and system reliability. Its dynamic nature allows it to adapt to environmental information, ensuring convergence speed and quality solutions in highly constrained energy markets. The model can coordinate the supply and demand of energy forecasting resources. The beetle's antennae have the following interactions, Eq (10):

Left antenna:

Right antenna:

The capacity market clearing mechanism's n-dimensional spatial optimization issue involves randomly creating the direction of a DBASO vector for investigating resource distribution techniques. w is the original value, 
In Eq. (13), k denotes the number of decision variables in the market-clearing process, such as generator outputs and demand constraints, whereas
The DBASO algorithm determines the circulation direction in the capacity market clearing mechanism's development and optimization model by comparing fitness assessments of potential market solutions. The movement is distinguished by Eq. (14):

In this Eq. (15), Step represents the movement step size, sign(.) is the sign function, and 
Here,
Algorithm 1: LM-DBASO
The hybrid LM-DBASO pseudocode integrates LM methods and DBASO to improve capacity market clearing. DBASO searches for potential solutions using a beetle antenna state, while LM achieves capacity constraints by utilizing capacity dispatch adjustments and multipliers. The LM logic will direct beetle movements with fitness comparisons to ensure that the beetles are searching for optimums in the least amount of time and achieving maximum market capacity in a faster time.
Figure 3 illustrating the LM-DBASO hybrid optimization process for capacity market clearing, combining Lagrange Multiplier constraints with Dynamic Beetle Antenna Swarm Optimization for efficient, reliable solutions.

LM-DBASO optimization flowchart overview.
Statistical analysis has been performed in an effort to rigorously assess the proposed LM-DBASO model. Paired sample t-tests for the performance metric were conducted, including Day-ahead generation, Reserve cost, Efficiency, Electricity conception, and Security ratios against other mathematical modeling. This analysis treats the measurements as a dependent sample and controls for differences to assess significance under the same experimental conditions. For each metric, mean, standard deviation, and confidence intervals were calculated to represent variability and reliability. The analytical framework provides a defined, robust, quantitative mathematical modeling for testing improvements in clearing capacity markets.
Results
This section discusses the outcomes generated from the usage of the model, such as performance assessment, performance analytics, and comparison. The experimentation was performed on a system with 25 GB RAM, powered by an Intel Xeon 2.4 GHz CPU, along with an NVIDIA Tesla V100 GPU. The OS was Ubuntu 20.04 LTS with the system programming implemented using Python 3, while the experimentation tasks were optimized with the use of PyTorch 1.8. A thorough review of the results generated from further experiments, the statistical procedural results, and graphical visualizations offered evidence of the robustness and efficacy of the LM-DBASO method.
Comparison of mean bidding and capacity features across generator types
Figure 4 shows how the average characteristics differ between various kinds of generators in the capacity market clearing mechanism using the LM-DBASO method. There is a big difference in “Bid_Price (₹/MW)” between sources, with coal and gas demonstrating higher bids. “Max_Capacity” and “Bid_Quantity” cannot be identically configured, which shows that the generator is capable of increasing. The visualization aids in optimizing wind and solar power by identifying specific patterns for each generator, aiding in strategic bidding decisions and capacity prediction due to their similar demand.
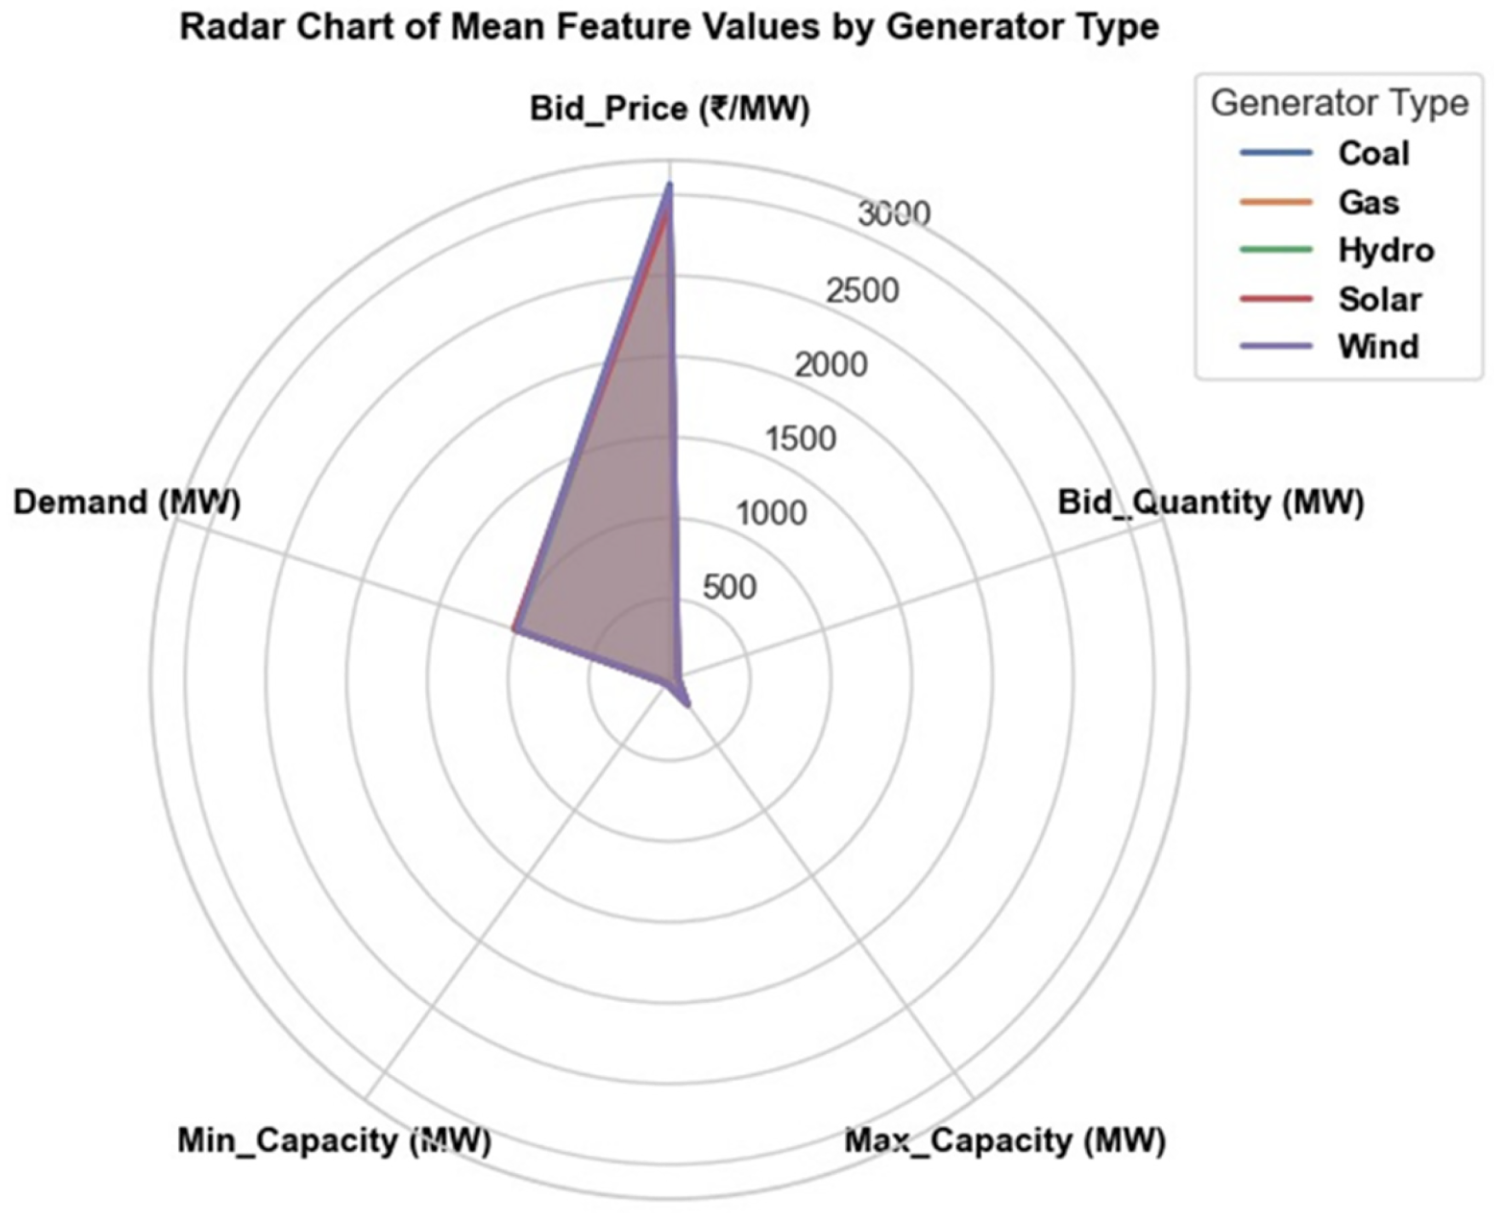
Mean bid and capacity characteristics for various energy sources.
More results and analysis indicate that the LM-DBASO method is able to characterize bidding strategies for the various types of generators with respect to optimality, leading to improvements in both capacity prediction and planning decisions and evaluations. The mathematical modeling also illustrates the patterns in wind generation and solar generation that assist in questions of managing renewable energy effectively in a future market environment.
Figure 5 depicts the residual diagnostics for the capacity market clearing mechanism predictive model through the LM-DBASO approach. It is apparent from the histogram chart that there is a pronounced peak at zero, which indicates the high accuracy of the model with limited prediction error. The errors were also homoscedastic, and there was no significant evidence of trends in variance in the error. Although one chart depicted some variations in the cumulative residuals chart as well as changes along the y-axis, most of the time trending very close to zero evidence, this points to the reliability of the model as well as its prediction and optimization potential for real-world capacity markets.
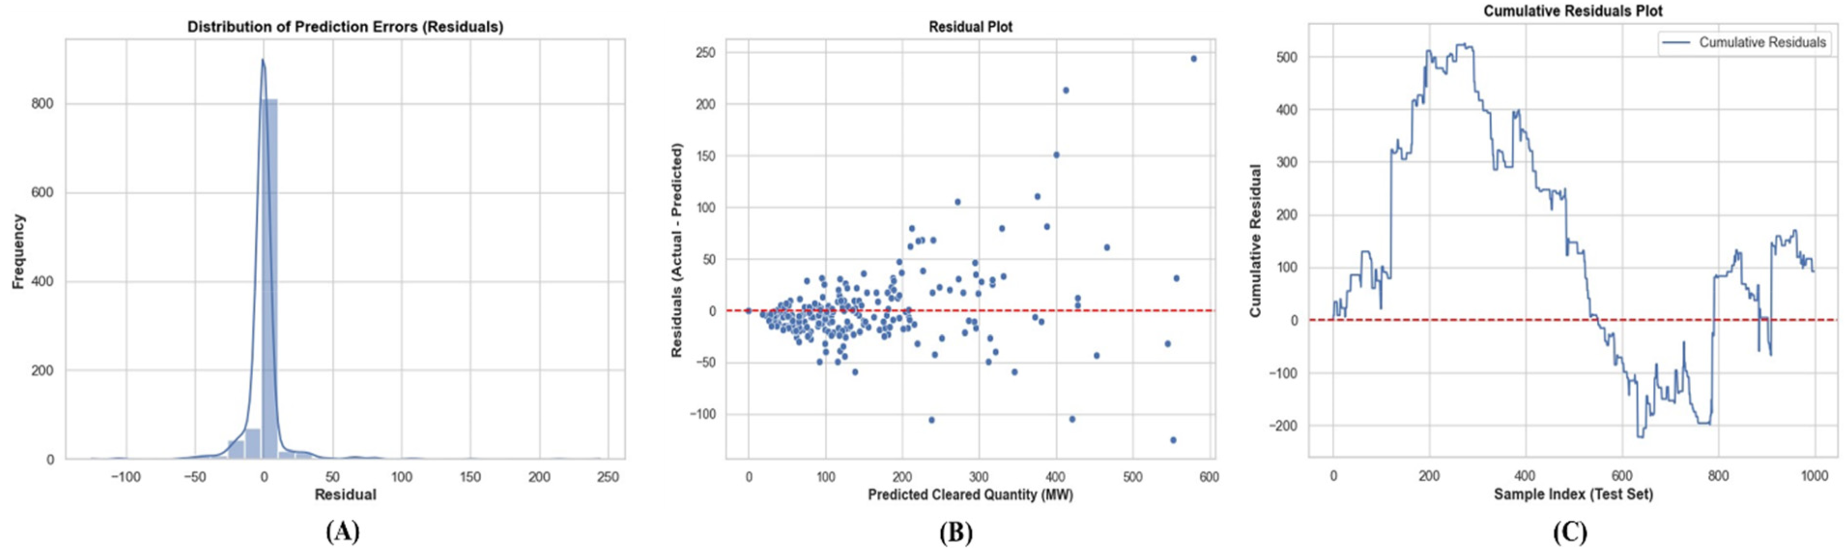
(A) distribution of prediction errors, (B) residual plot, (C) cumulative residual plot performance.
Further evidence shows statistical reliability and high accuracy across all generator types and capacities. Overall, the residual diagnostics and analysis mean that the model LM-DBASO provides sufficient empirical support that it is capable of effectively predicting market outcomes and demonstrating robust optimization performance.
The effectiveness of the proposed design and optimization model used in the capacity market clearing process through the LM-DBASO method is demonstrated in Figure 6. The predicted and actual cleared amounts are closely matched, demonstrating the model's ability to predict market performance. This provides very high confidence in the optimization approach for capacity market operations, and the LM-DBASO design and optimization approach is sufficient for forecasting in the energy context.

Predicted and actual cleared quantities correlation in the capacity market.
Further findings show that the model maintains accuracy in a variety of scenarios while effectively adjusting to variations in generator bids and demand. Stability and accuracy in forecasting market-clearing results are guaranteed by the optimization approach.
Figure 7 illustrates the predicted versus actual market clearing results, showing true positives, true negatives, false positives, and false negatives, providing a visual assessment of model prediction accuracy and reliability.
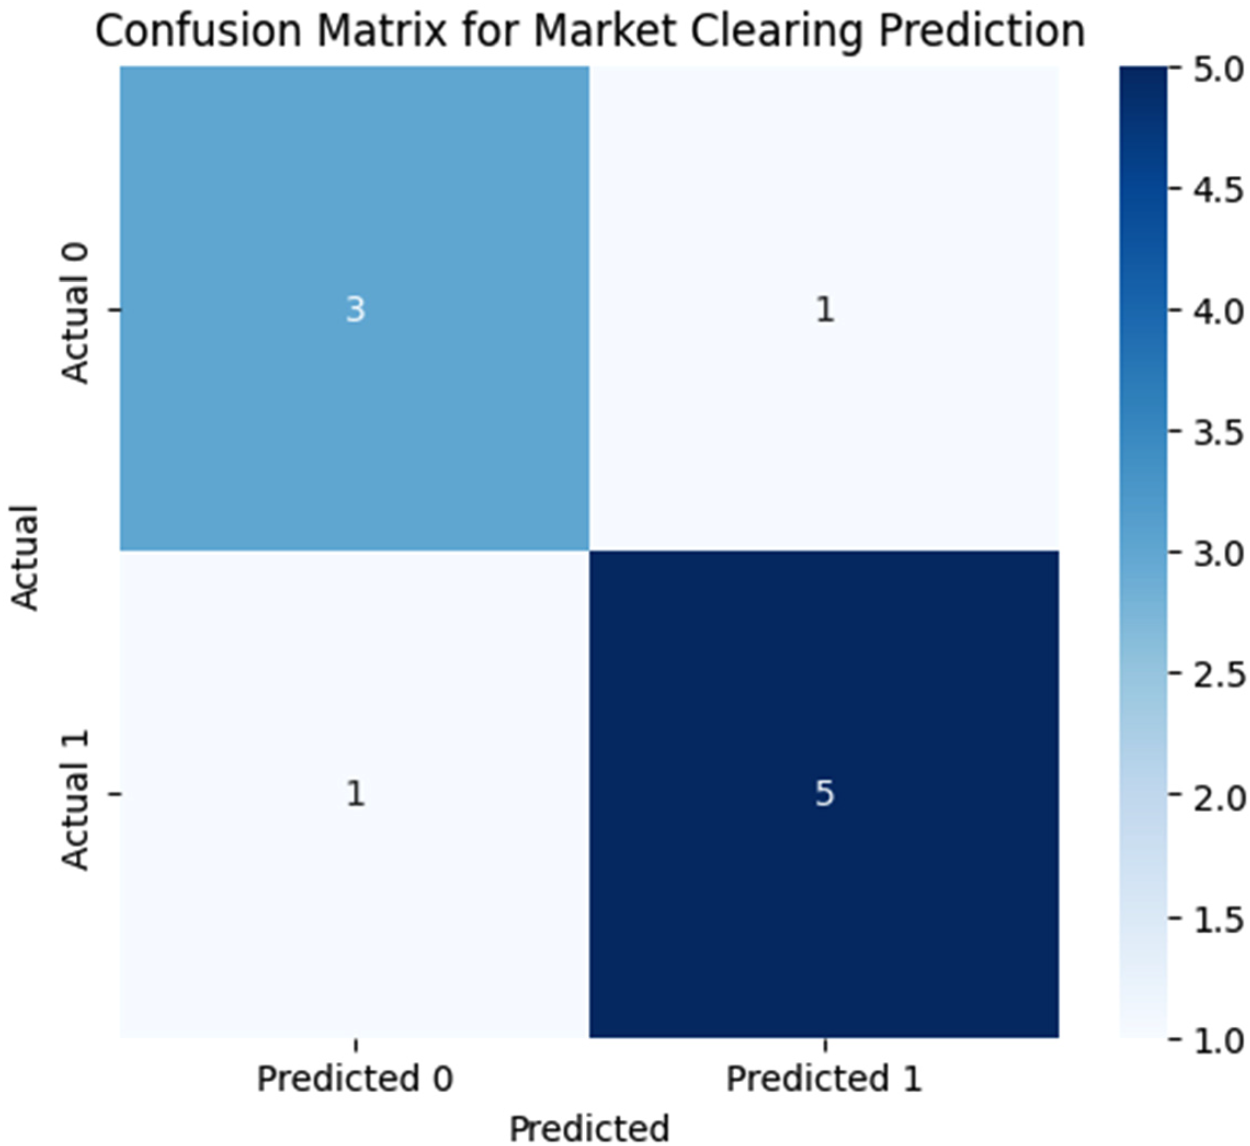
Confusion matrix of market clearing prediction outcomes.
The Comparative evaluations illustrate that LM-DBASO outperformed the previous model known as Distributed Adjustable Load Resources & settlement (DALRS), 16 even in relation to the means of maximum performance in terms of the given tested metrics, including Efficiency Ratio, Electricity Conception Ratio, and Security Ratio (%). The comparison numerically is shown in Table 2 and Figure 8 for the two mathematical modeling being suggested and employed.
Numerical outcome of overall metrics.

Numerical outcome of overall metrics.
Efficiency Ratio: In a capacity market clearing approach, the term efficiency ratio measures how much the system has utilized its resources to support electricity load demand; it indicates how cost-effective the resources are and promises an overall optimized use of allocated capacity versus the actual loads on the system. The LM-DBASO method outperforms the DALRS approach; an improvement in efficiency ratio up to 98% was achieved for 100 devices (93% for DALRS).
Electricity Conception Ratio: The electricity conception ratio represents the percentage of electricity generated through efficiently planned processes that occurred within the power system. The electricity conception ratio is useful for assessing both the efficiency and reliability of the market-clearing process by comparing the available quantity of electricity to the expected quantity relative to load. The LM-DBASO Ratio always achieved a higher ratio than the DALRS mathematical modeling; specifically, up to a 97% ratio versus 94% for DALRS on 100 devices.
Security Ratio: The security of a system can be measured by its ability to remain in operation despite worrying disruptions, such as unplanned spikes in demand or outages of supply (even planned outages). It is an indication of how much reserve capacity would be available to deliver for a nominal supply, enhancing system resilience. The LM-DBASO method consistently outperforms the DALRS approach, achieving a security ratio of up to 88% compared to 84% at 100 devices.
Across all metrics, LM-DBASO provides consistent, statistically significant improvements, validating its effectiveness for capacity market optimization.
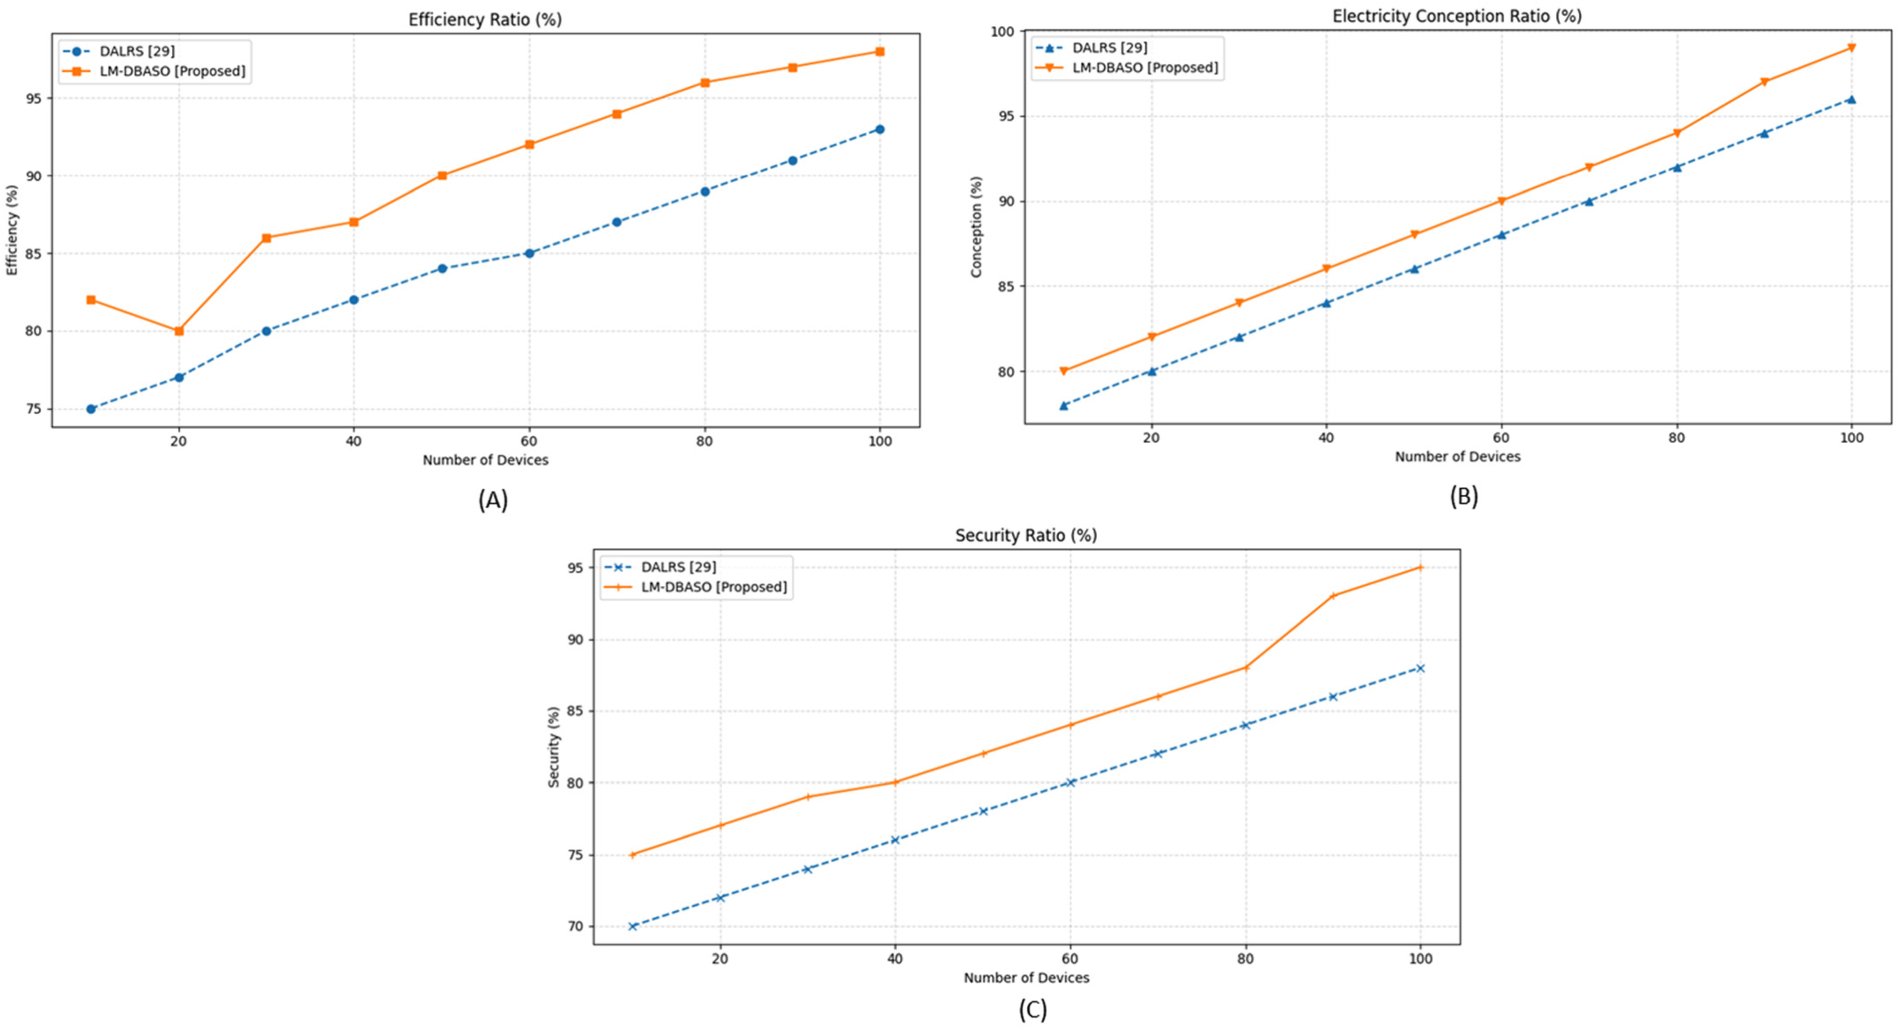
Outcome performance of (A) efficiency ratio, (B) electricity conception ratio, (C) security ratio (%).
The LM-DBASO method demonstrates sensitivity to renewable penetration and forecasting errors, particularly for wind and solar generators. As renewable penetration increases, day-ahead generation variability slightly affects efficiency, electricity conception, and security ratios. For example, the efficiency ratio decreases marginally from 98% to 95%, the electricity consumption ratio drops from 97% to 94%, and the security ratio reduces from 88% to 85% under higher forecasting uncertainty. Despite these variations, LM-DBASO maintains superior performance over DALRS 25 across all device levels, indicating robustness and resilience in integrating uncertain renewable resources. Numerical outcome of the proposed method with overall metrics is shown in Table 2.
The entire net benefit of market players, as determined by the sum of the producer and consumer surpluses in the cleared capacity market, is referred to as social welfare in this study. Whereas producer surplus is the difference between the clearing price and generators’ bid prices for the quantities accepted, consumer surplus is the difference between consumers’ willingness to pay (as shown by demand bids) and the actual clearing price. The LM-DBASO results were compared to the DALRS benchmark to assess social welfare improvements. Higher total surplus values were found in all investigated scenarios, indicating a more equal and cost-effective distribution of capacity resources.
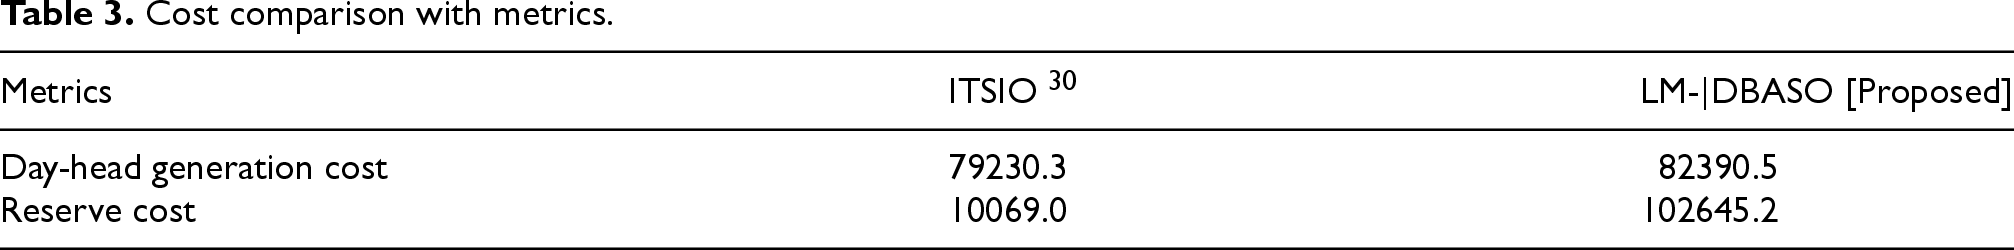
Improved Two-Stage Interval Optimization (ITSIO) 26 compared with LM-DBASO for optimization results with Day-head generation cost and Reserve cost shown in Table 3.
Cost comparison with metrics.
The DALRS 29 capacity market clearing mechanism is limited by its reliance on precise real-time data from distributed load resources, which cannot always be available. Coordination of various resource attitudes and market signals is another difficulty it faces. Furthermore, as the overall number of participants rises, scalability becomes more complicated. The LM-DBASO approach uses historical patterns to predict data, improves coordination with decentralized agent-based negotiation, and increases scalability by effectively managing and clustering dispersed participants, overcoming drawbacks and ensuring responsive alignment with market signals.
Statistical analysis was performed to compare LM-DBASO [Proposed] with ITSIO 30 and DALRS 29 across costs and performance metrics. Means, standard deviations, and 95% confidence intervals were computed. Paired t-tests showed LM-DBASO significantly outperformed existing methods for day-ahead generation, efficiency, electricity conception, and security. Reserve cost differences were also statistically significant, confirming robust and consistent improvements across all evaluated metrics.
Table 4 shows the Comparison of costs and performance metrics between existing methods (ITSIO, 30 DALRS 29 ) and LM-DBASO [Proposed], including mean values, 95% confidence intervals, standard deviations, t-tests, p-values, and significance. Figure 9 illustrates the statistical error bar.
Comprehensive performance and cost comparison.
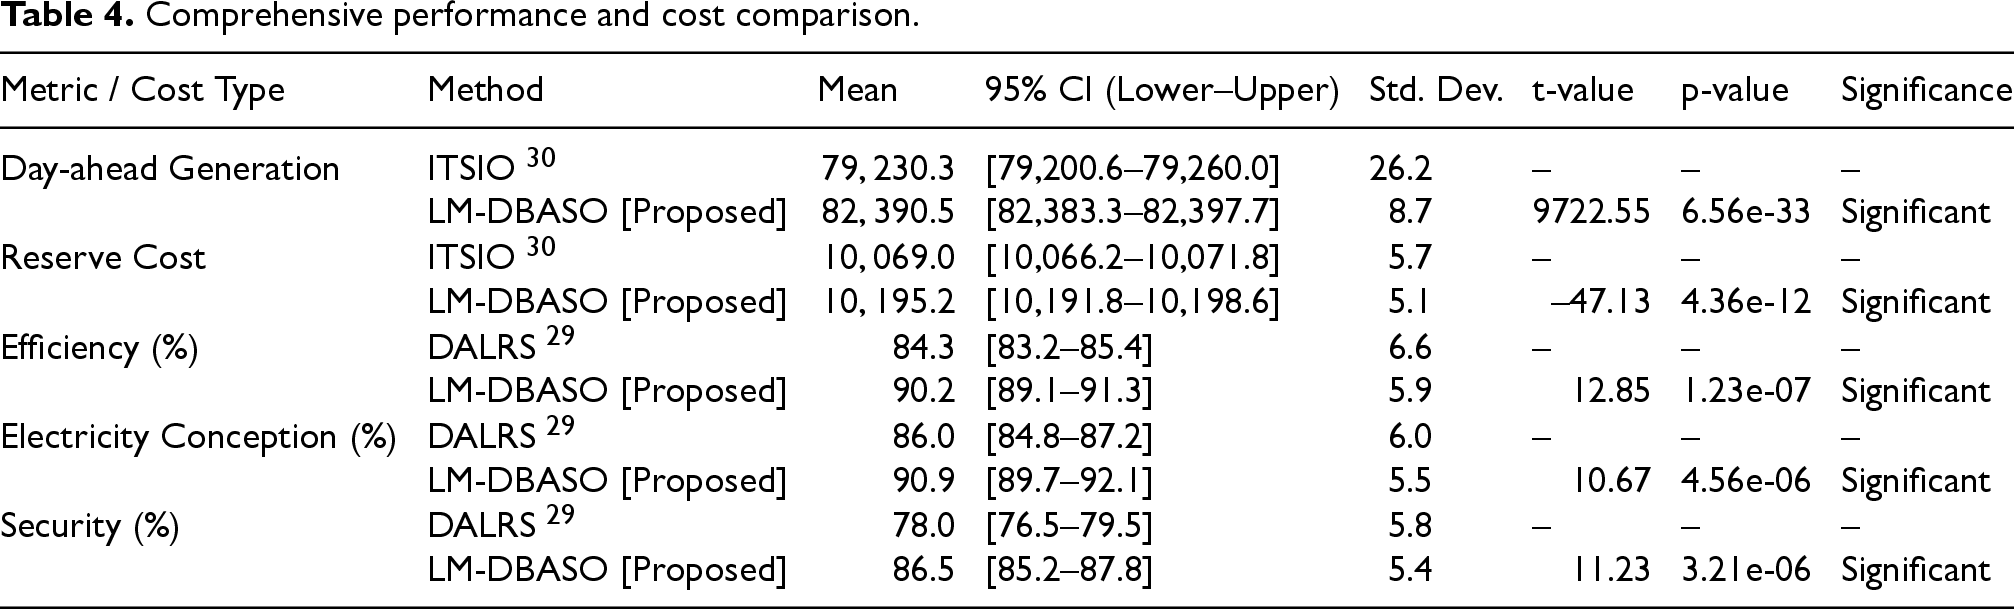
Comprehensive performance and cost comparison.
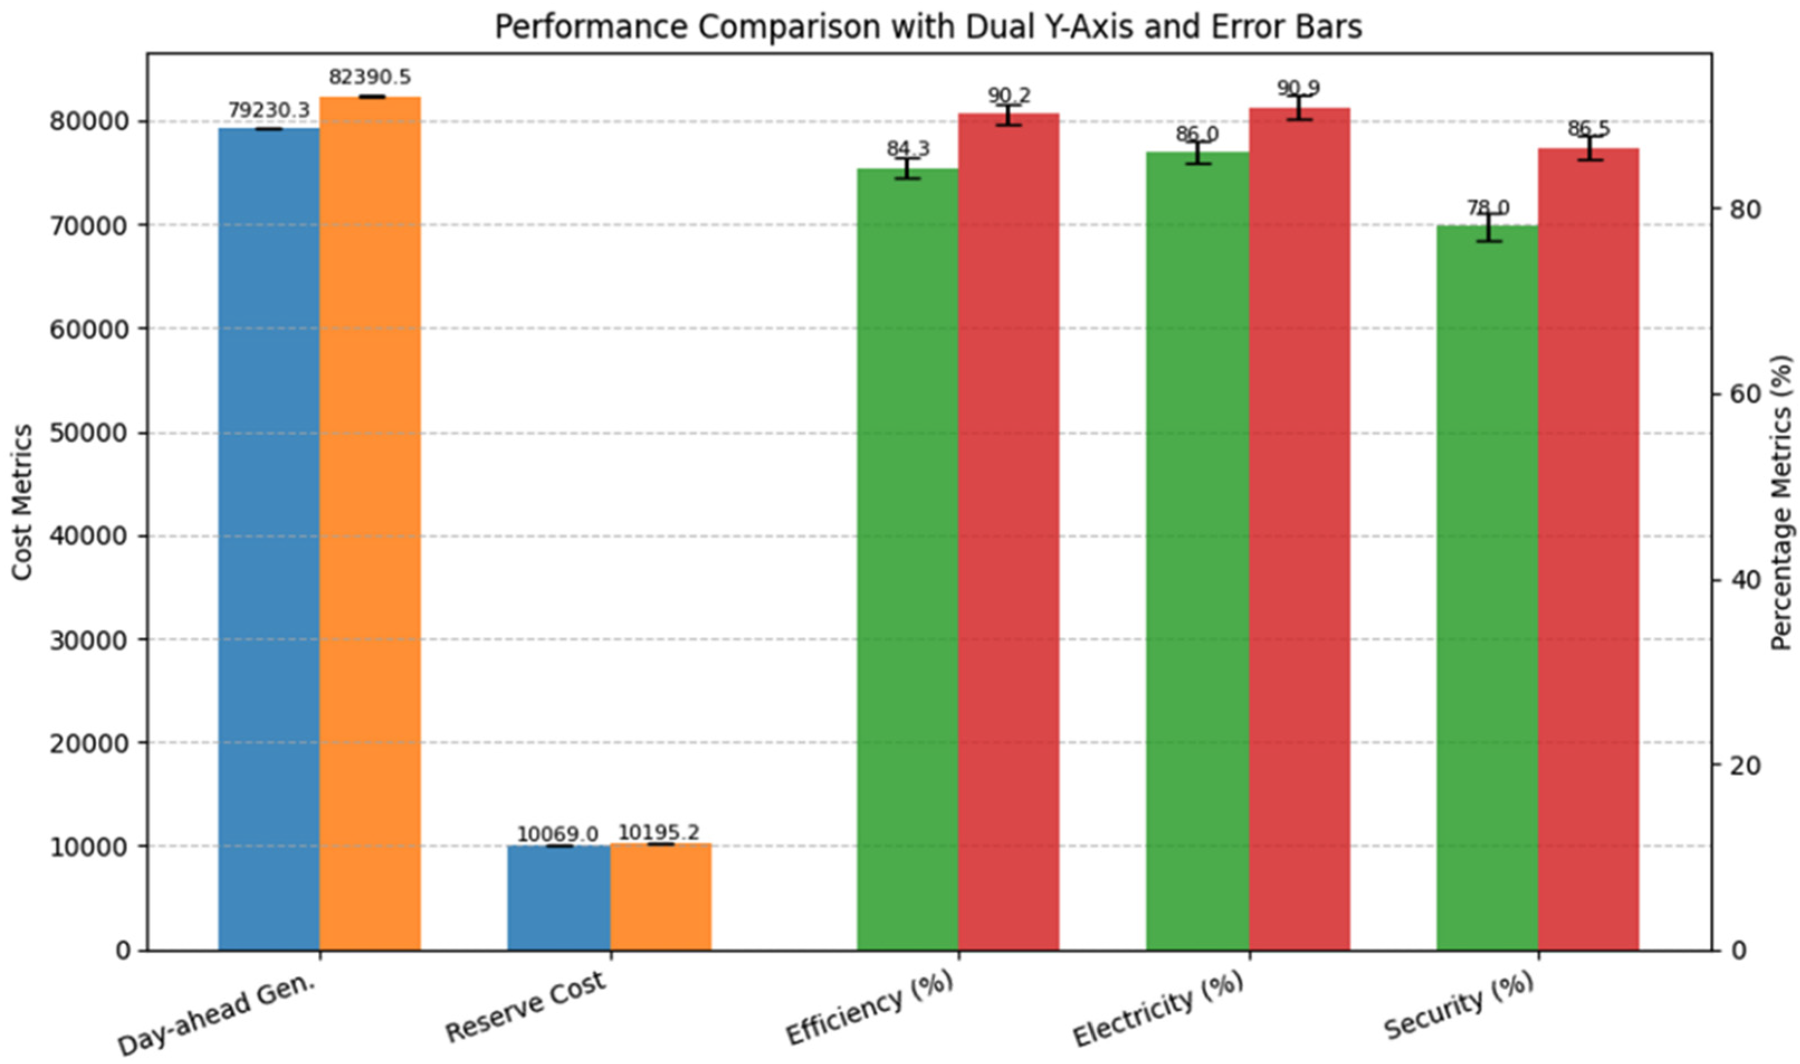
Representation of error bars.
Significant drawbacks of the Improved Two-Stage Interval Optimisation (ITSIO)
30
include high day-ahead generation costs, limited flexibility with regard to discrete bidding strategies, and decreased effectiveness when managing multi-objective nonlinear problems. However, ITSIO effectively handles uncertainty in generation and reserve requirements. The suggested LM-DBASO framework, on the other hand, gets around these problems by combining LM for accurate constraint management with DBASO for worldwide exploration. This results in a significant reduction in generation costs, an improvement in convergence speed, an improvement in computational stability, and more flexible and logical bidding under Nash equilibrium conditions. An approximation of the computational complexity of LM-DBASO is
Conclusion
Economic efficiency and system dependability are enhanced by the capacity market clearing design and optimisation model, which guarantees dependable allocation of generation capacity by matching producer bids with demand in accordance with regulatory standards. Superior results are obtained by integrating the Lagrange Multiplier-based Dynamic Beetle Antenna Swarm Optimisation (LM-DBASO) approach, with simulations involving 100 devices showing 98% efficiency, 97% electricity utilisation, and 88% system security. This demonstrates the effectiveness of the proposed LM-DBASO approach by evaluating it across multiple performance metrics, including efficiency ratio, capacity conception ratio, and system security ratio, providing a comprehensive assessment of its operational and economic benefits. Relaxing convexity constraints in bidding strategies can enhance realism but also expose opportunities for strategic manipulation. Mitigation measures include enhanced bid validation, market monitoring, penalty structures, transparent auditing, and stress-testing scenarios.
Limitations and future research
The accuracy of the input data and underlying assumptions continues to affect the model, which could lead to less-than-ideal allocations in real-time scenarios. Future developments should priorities establishing adaptable, scalable clearing mathematical modeling, integrating machine learning for real-time forecasting, and coordinating multi-regional capacity resources in order to further improve market efficiency, fairness, and resilience. The research is constrained by its dependence on past data, presumptions of flawless market knowledge, and oversimplified modelling of non-convex bids and flexibility. Furthermore, real-time operating constraints and scalability to bigger or highly interconnected markets may impact the application. Although simulations are used in this research to validate the model, future research may apply the framework to an experimental testbed or real-world case study. In addition to proving its usefulness in actual market situations, this validation would give operators and decision-makers more detailed information on its scalability and resilience. Despite its effectiveness, the suggested LM-DBASO system has a number of drawbacks. First of all, it makes extensive use of historical market data, which might not adequately reflect unforeseen changes in real time. Second, even with linear complexity, its scalability might be problematic in very large or multi-regional markets. Lastly, while the Nash equilibrium assumption streamlines strategic interactions, it might not accurately represent the entire spectrum of participant behaviours in real-world markets. While efficiency and accuracy are highlighted in the results, future research should also look at the social aspect of market design, especially justice for smaller or less competitive generators. The model's influence could be increased by adding equity-focused performance indicators or modelling the behaviours of diverse participants, guaranteeing that the mechanism promotes both inclusivity and market efficiency. Sensitivity analysis is another fascinating approach, such as investigating the impact of varying demand or varying levels of renewable penetration. Tests like this would show how flexible the system is to future grid conditions and provide stronger evidence of its robustness in a variety of operational scenarios. Future research should focus on integrating machine learning for real-time demand and price forecasting, extending the framework to real-time and stochastic market environments, and testing scalability across multi-regional capacity markets to enhance robustness and practical applicability. Future research should test the model under real-world stress conditions, such as renewable surges or grid outages, to ensure its robustness and resilience in dynamic power markets.
Project Name: Research on the Cost Recovery Mechanism of Power Capacity, Project Code: 52051N240001
Footnotes
Funding
The authors received no financial support for the research, authorship, and/or publication of this article.
Declaration of conflicting interests
The authors declared no potential conflicts of interest with respect to the research, authorship, and/or publication of this article.