
Abstract
Imbalanced classification remains a critical challenge in decision-sensitive domains such as healthcare, finance, and cybersecurity, where minority class recognition is often paramount. This paper introduces FRSTU-Forest, a novel hybrid framework that integrates K-Nearest Neighbor (k-NN) imputation, Fixed Random State Undersampling (FRSTU), and Random Forest to enhance both minority class detection and model reproducibility. Unlike conventional undersampling, FRSTU applies deterministic sampling with a fixed random seed, ensuring consistent training subsets across runs and significantly reducing performance variance. The framework was comprehensively evaluated on seven benchmark datasets with moderate imbalance ratios (1.25–3.36) and rigorously tested on synthetic datasets with extreme imbalance ratios up to 1:100, high dimensionality (100 features), and substantial label noise (20%). FRSTU-Forest consistently outperformed baseline models (RF, k-NNimp+RF, RSTU+RF), achieving an average accuracy of 87.88%, minority-class F1-score up to 99.78%, and Cohen’s Kappa of 0.86 on benchmark datasets. More importantly, under extreme imbalance conditions (1:100 ratio), it maintained a balanced accuracy of 0.807 with 100 features, demonstrating remarkable robustness. Statistical significance was confirmed via the Bonferroni-Dunn test (
Keywords
Introduction
Classification is a fundamental task in data mining and machine learning, with applications spanning domains such as healthcare, finance, cybersecurity, and engineering.1,2 Among various classification algorithms, Random Forest (RF) is widely adopted due to its ensemble-based structure, robustness to noise, ease of implementation, and high accuracy on structured data.3,4
Despite its strengths, RF exhibits notable performance degradation in scenarios involving class imbalance, a situation where one class significantly outnumbers another. This is common in many real-world datasets, such as fraud detection, medical diagnosis, or fault detection systems. In such cases, RF tends to bias predictions toward the majority class, neglecting the minority class that often carries critical information. 5 This bias reduces recall for minority classes and may yield misleading results if accuracy is used as the sole performance metric.6,7
To mitigate class imbalance, undersampling of the majority class is a common strategy. It aims to balance class distributions by reducing the number of dominant class samples. However, conventional random undersampling introduces several issues. Randomly discarding samples can lead to the loss of useful information and increased performance variability across different runs due to the stochastic nature of sample selection. 8 Furthermore, random selection does not guarantee that representative majority samples are retained, which may compromise the learning process.
To overcome these limitations, this paper proposes the Fixed Random State Undersampling Forest (FRSTU-Forest). FRSTU-Forest modifies the traditional undersampling technique by applying a fixed random state during the sampling process. This small but significant change introduces determinism into the data preparation stage, ensuring that the same subset of majority samples is selected in every run. As a result, the model training becomes more consistent, reproducible, and interpretable. Moreover, this model retains informative majority class samples more reliably, potentially leading to improved generalization performance.
To address the above challenges, this paper introduces a novel strategy and aims to answer the following research questions: Can the use of a fixed random state in undersampling improve the consistency and performance of RF classifiers on imbalanced datasets? How does it compare statistically with traditional approaches?
The motivation for this paper stems from the limited exploration of determinism in class rebalancing methods. While the machine learning community has focused extensively on new resampling algorithms (e.g., SMOTE, ADASYN) or algorithm-level modifications (e.g., cost-sensitive learning), few works have investigated the role of reproducibility and consistency in undersampling.
The main contributions of this work are as follows: We propose a novel classification framework called FRSTU-Forest, which integrates fixed random state undersampling into the Random Forest pipeline to improve reproducibility and minority class recognition. We conduct extensive experiments on seven publicly available benchmark datasets with varying imbalance ratios and report performance using a comprehensive set of metrics (F-measure, recall, precision, accuracy, and Cohen’s Kappa). We employ the Bonferroni-Dunn statistical test to rigorously assess the significance of performance differences between FRSTU-Forest and baseline models, thereby validating the robustness of our approach.
Prior literature presents numerous techniques to handle data imbalance, including algorithmic modifications and data-level resampling methods.9,10 While random undersampling is widely used due to its simplicity, it introduces inconsistency across model training runs. To our knowledge, no prior work has systematically investigated the use of fixed random state undersampling in the context of Random Forest classification.
This paper fills this gap by providing a lightweight yet effective strategy to stabilize model behavior on imbalanced datasets, without requiring complex oversampling algorithms or model re-engineering.
The proposed FRSTU-Forest model enables researchers and practitioners to achieve consistent, interpretable, and high-performing classification outcomes on imbalanced datasets. Its practical utility extends to any domain where minority class prediction reliability is critical, and it contributes toward improving decision-making in intelligent systems.
The remainder of this paper is organized as follows. The next section reviews related work on imbalanced classification and resampling strategies. This is followed by a detailed description of the proposed FRSTU-Forest framework, including its algorithmic design and theoretical rationale. The experimental setup, datasets, and evaluation metrics are then described. Subsequently, empirical results are presented and compared against baseline models. A critical discussion of the findings, limitations, and future directions is provided thereafter. The paper concludes by summarizing the key contributions and implications of the proposed model.
Handling imbalanced data is a persistent challenge in supervised learning, often resulting in biased models that underperform on minority classes. Numerous techniques have been developed to mitigate this problem, including resampling (oversampling and undersampling), cost-sensitive learning, and ensemble-based approaches. This section reviews key literature addressing class imbalance and outlines their methodologies, strengths, and limitations.
Resampling techniques
A widely used oversampling method is the Synthetic Minority Over-sampling Technique (SMOTE). Shao et al. 11 improved this approach by integrating Gaussian distribution to enhance the realism of generated samples. Although effective, SMOTE-based techniques are prone to overfitting and are computationally inefficient on large datasets.
On the other hand, undersampling aims to balance the dataset by removing instances from the majority class. Archana and Prakash 12 introduced a selective undersampling strategy that retains informative majority class instances. Ilham et al. 8 further refined this by incorporating fuzzy clustering and denoising to select representative samples. While these methods improve minority class recognition, they risk discarding useful data and introduce computational overhead.
Cost-sensitive and hybrid models
Wang et al. 13 proposed a cost-sensitive ensemble using stacked denoising autoencoders, dynamically adjusting misclassification penalties based on class distributions. Similarly, Wang et al. 14 employed fuzzy logic in support vector machines to assign greater importance to minority class instances. Although effective, these approaches often require extensive parameter tuning and domain expertise.
Salehi et al. 15 explored hybrid models that combine clustering and undersampling, offering better sample representativeness. Joloudari et al. 16 utilized convolutional neural networks (CNNs) with a modified SMOTE approach, achieving strong performance in image-based datasets but at high computational cost.
Ensemble-based methods and meta-learning
Sasirekha and Kanisha 17 introduced an adaptive ensemble boosting model that adjusts the undersampling rate and ensemble weights based on instance difficulty. Although this improves F-measure and balanced accuracy, it suffers from computational complexity and tuning issues. Ilham et al. 18 proposed a meta-learning framework to automatically select optimal resampling strategies based on dataset characteristics. However, this approach is heavily dependent on the quality of extracted meta-features.
Summary and comparison
Table 1 summarizes the key characteristics of existing approaches. While many studies offer promising improvements in classifying imbalanced data, challenges such as overfitting, high computational cost, reproducibility, and generalizability persist. In contrast, our proposed model is Fixed Random State Undersampling Forest (FRSTU-Forest), aims to enhance reproducibility and stability by incorporating consistent sampling and k-NN-based imputation, with minimal tuning overhead.
Comparison of existing models for imbalanced data classification.
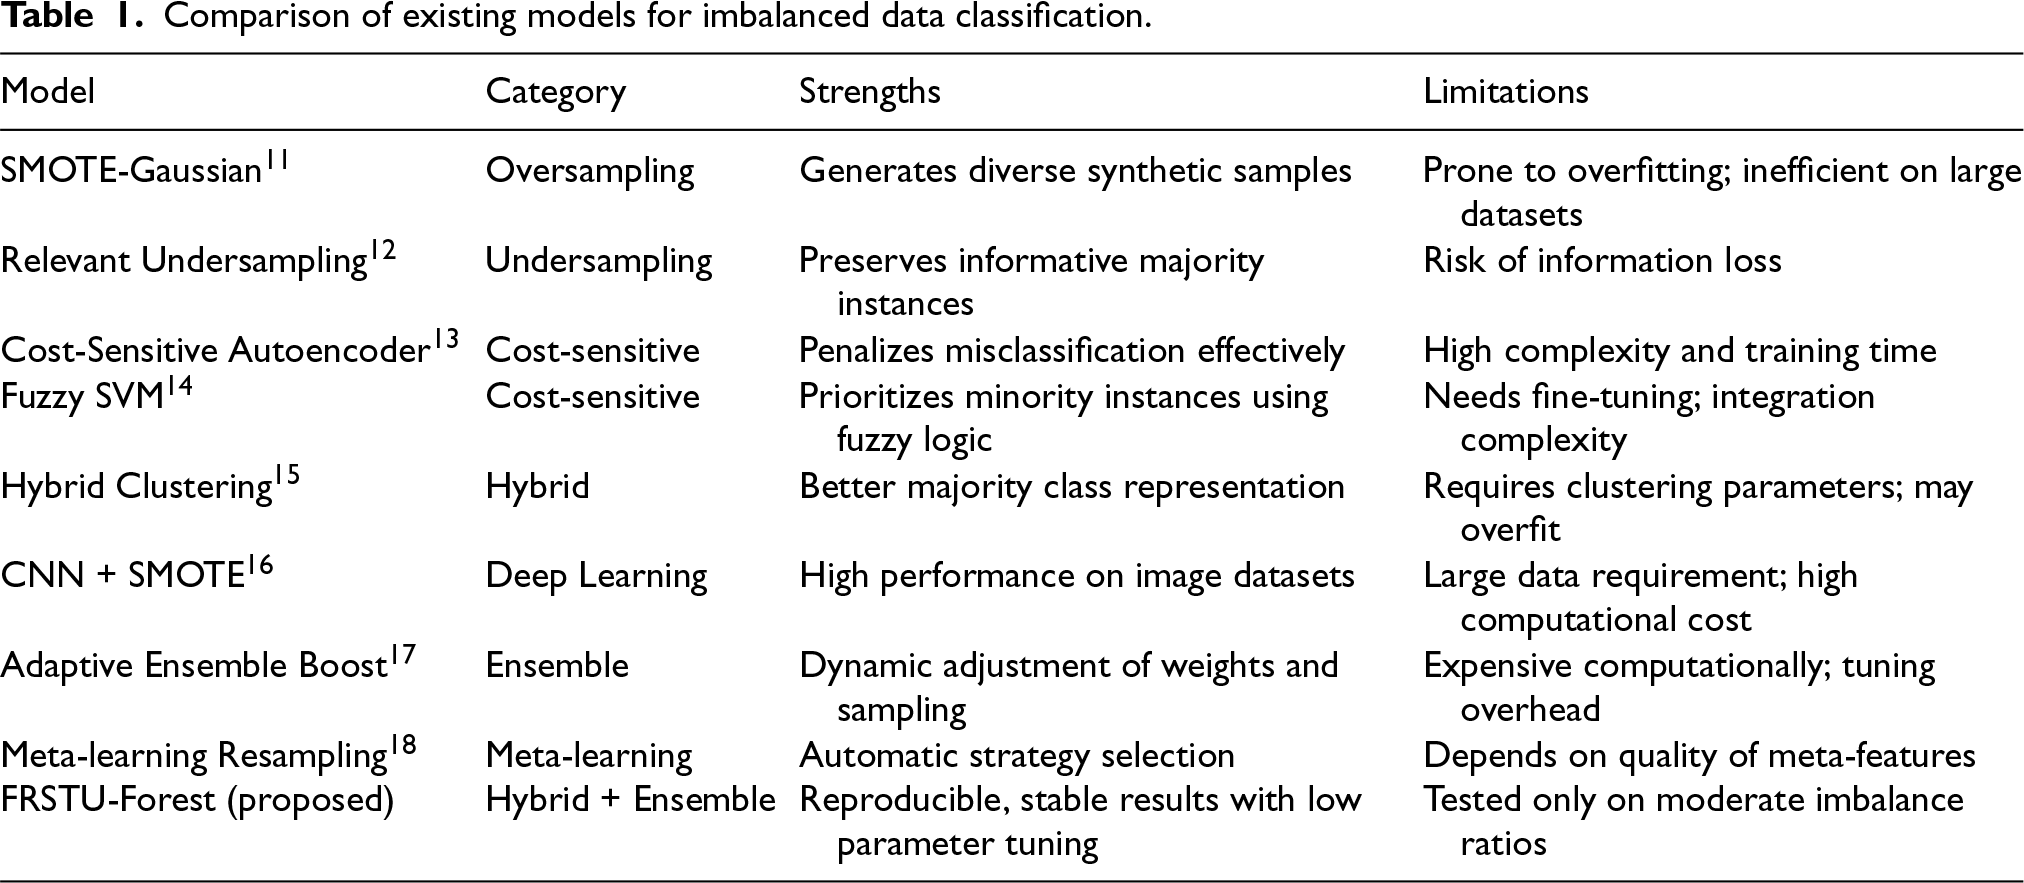
Comparison of existing models for imbalanced data classification.
Compared to SMOTE-based and cost-sensitive models, FRSTU-Forest emphasizes reproducibility and computational efficiency by avoiding synthetic data generation and expensive parameter tuning. Its design ensures consistent performance across moderately imbalanced datasets while maintaining interpretability and scalability.
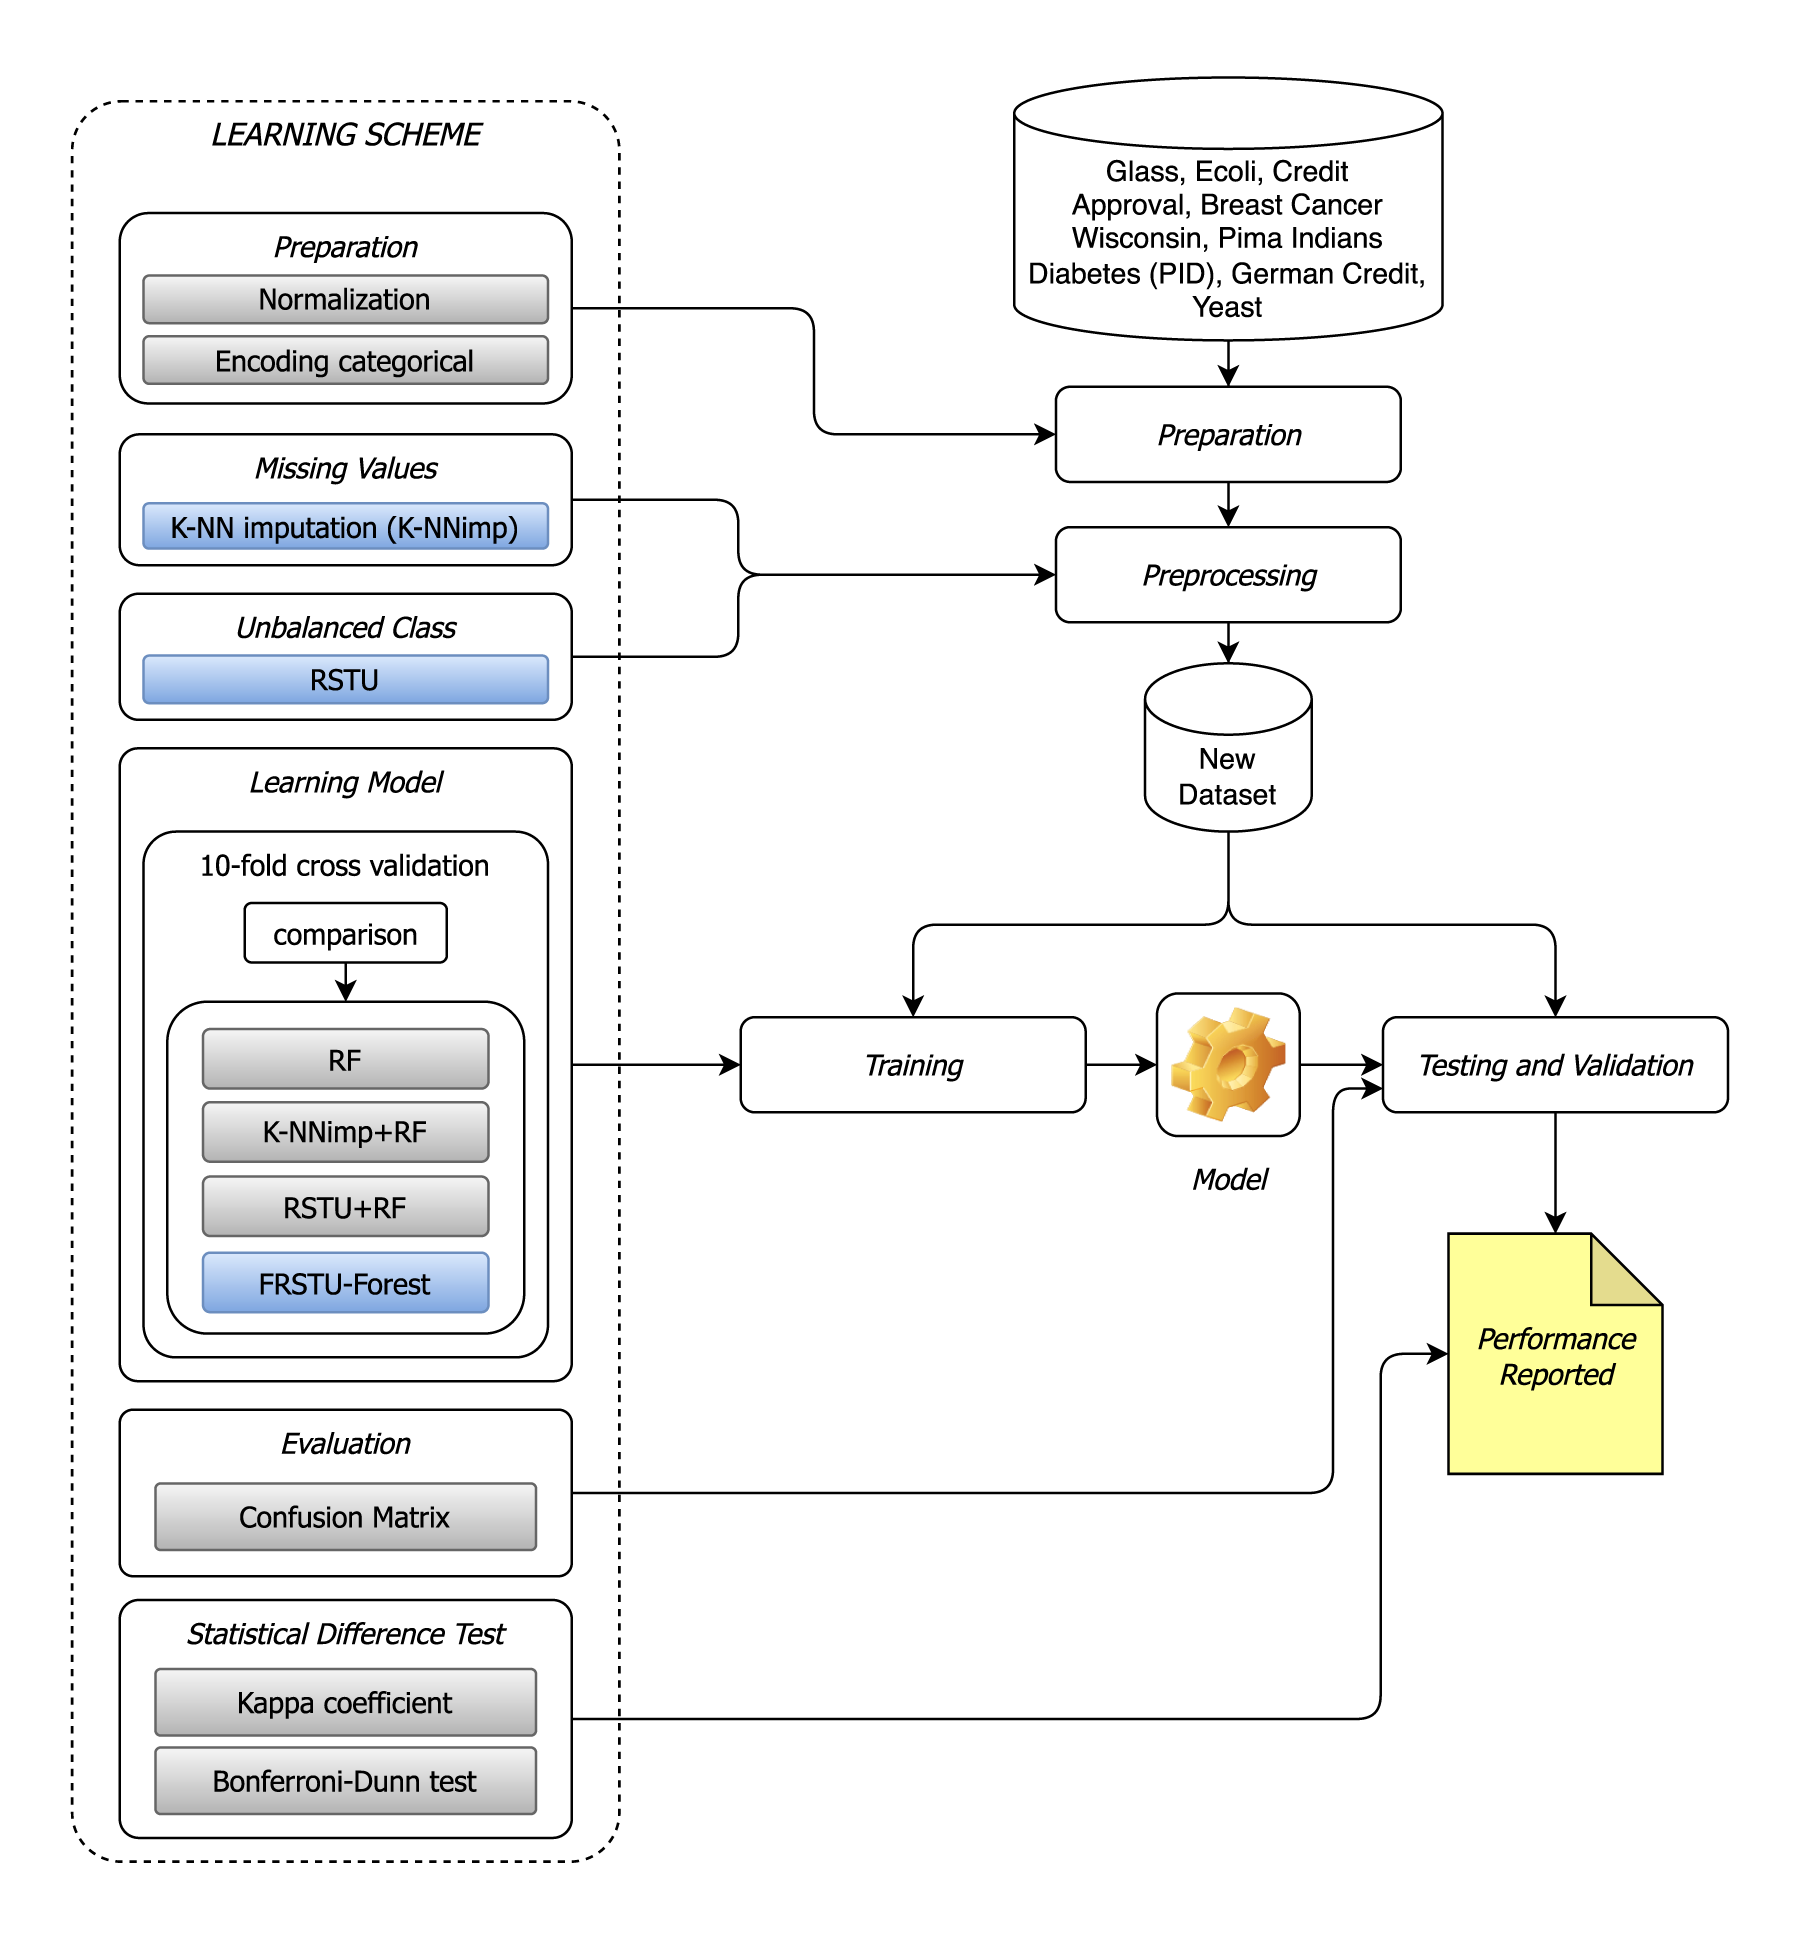
Figure 1 visualizes the workflow of the proposed FRSTU-Forest model, namely, the fixed random-state undersampling forest approach for imbalanced data in random forest classification cases.
Proposed model.
In this paper, we used seven diverse datasets with imbalanced class distributions to evaluate the proposed Fixed Random State Undersampling Forest (FRSTU-Forest) model. The datasets were sourced from the KEEL and UCI Machine Learning Repository. The characteristics of these datasets are summarized in Table 2.
Characteristics of the benchmark datasets used for evaluating imbalanced classification models.
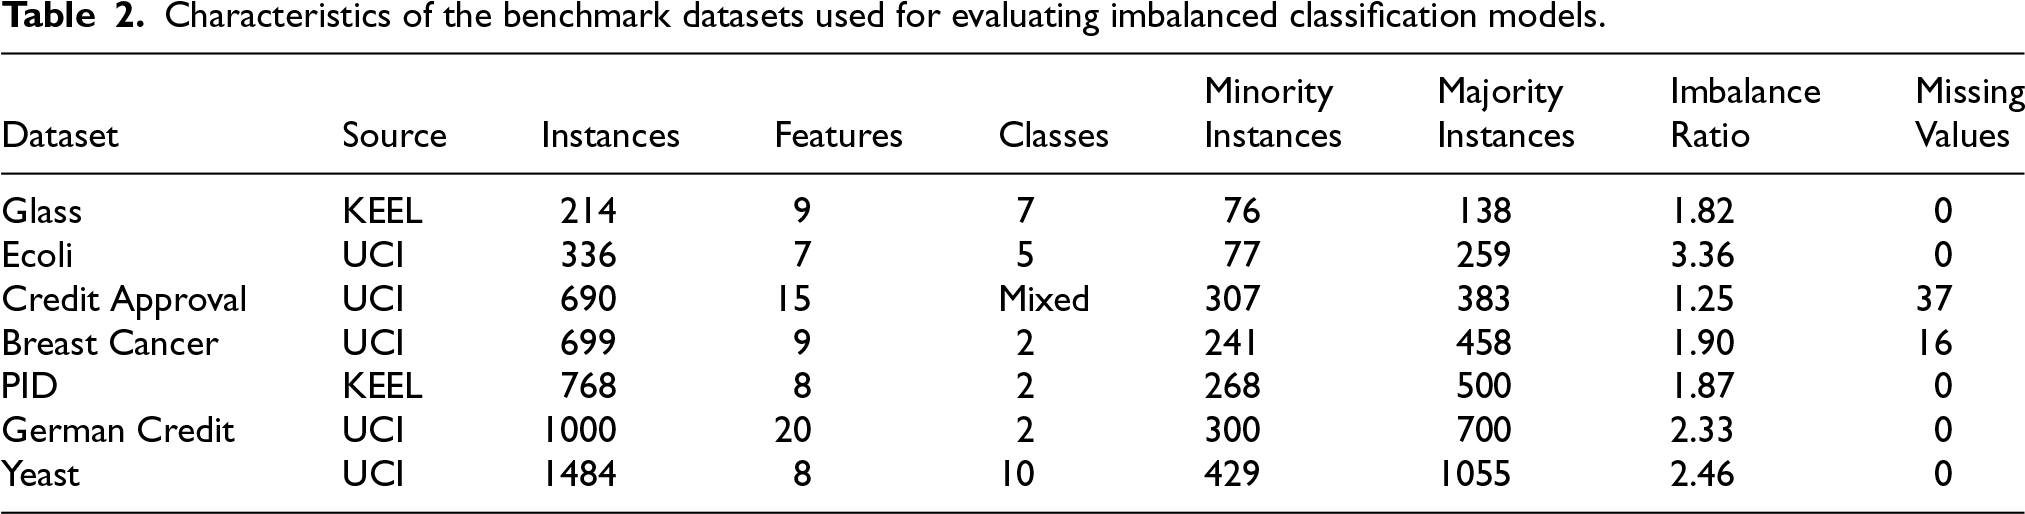
Characteristics of the benchmark datasets used for evaluating imbalanced classification models.
The Glass Identification dataset, also obtained from the UCI machine learning repository, includes 214 instances with 9 features. 19 These features represent the chemical composition of the different types of glass, which are used to identify glass types in forensic investigations. The dataset comprised 76 instances in the minority class and 138 instances in the majority class, resulting in an imbalance ratio of 1.82. It is frequently used to assess the performance of classification methods in forensic science applications where data is often imbalanced.
Ecoli
The Ecoli dataset, obtained from the UCI machine learning repository from UCI Machine Learning Repository, consists of 336 instances with 7 features. 20 These features represent various cellular characteristics of the E. coli bacteria, such as protein localization sites. The dataset is imbalanced, with 77 instances in the minority class and 259 instances in the majority class, resulting in an imbalance ratio of 3.36. This dataset is commonly used to test classification algorithms’ ability to handle imbalanced data, particularly in biological and biomedical research.
Credit Approval
The Credit Approval dataset, which is also from the UCI Machine Learning Repository, includes 690 instances with 15 features. 21 The features consist of various personal and financial attributes of credit card applicants, such as age, income, and credit history. The aim is to predict whether an applicant should be granted credit approval. The dataset contains 307 instances in the minority class and 383 instances in the majority class, resulting in an imbalance ratio of 1.25. The proposed dataset was used to test the effectiveness of machine learning models in the financial domain, particularly in credit scoring and risk management.
Breast Cancer Wisconsin
The Breast Cancer Wisconsin (Original) dataset was sourced from the UCI Machine Learning Repository and comprises 699 instances with 9 features. 22 The features include attributes of the cell nuclei obtained from breast cancer biopsy samples, such as clump thickness, cell size uniformity, and mitosis. The task was to classify the instances as benign or malignant. The dataset contains 241 instances in the minority class and 458 instances in the majority class, resulting in an imbalance ratio of 1.90. The proposed dataset is commonly used in medical research to evaluate the performance of classification algorithms in cancer detection tasks.
Pima Indians Diabetes (DID)
The Pima Indians Diabetes dataset was sourced in KEEL repository and comprises 768 instances with 8 features, and can be access here https://sci2s.ugr.es/keel/dataset.php?cod=21. The features include various medical predictor variables, such as age, glucose level, blood pressure, and body mass index. The goal is to predict the onset of diabetes within 5 years. The dataset contains 268 instances in the minority class and 500 instances in the majority class, resulting in an imbalance ratio of 1.87. This dataset is widely used in medical and healthcare research to test the robustness of classification algorithms in disease prediction with imbalanced data.
German Credit
The German Credit dataset is from the UCI Machine Learning Repository and contains 1000 instances with 20 features, and can access here. 23 The features cover various attributes of loan applicants, such as credit history, purpose, loan amount, and personal information. The objective is to classify applicants as having good or poor credit risk. The dataset contains 300 instances in the minority class and 700 instances in the majority class, resulting in an imbalance ratio of 2.33. This dataset is essential for evaluating credit risk assessment models and their ability to handle imbalanced datasets in financial applications.
Yeast
The Yeast dataset, also from the UCI machine learning, contains 1484 instances with 8 features. 24 These features describe gene expression patterns in yeast cells and are used to predict protein localization sites. The dataset contains 429 instances in the minority class and 1055 instances in the majority class, resulting in an imbalance ratio of 2.46. This dataset is a benchmark for evaluating machine learning models in bioinformatics, specifically, for dealing with imbalanced class distributions.
Data preprocessing
Data preprocessing is essential to ensure that the data are clean, consistent, and suitable for the applied machine learning algorithms applied. Handling missing data is critical because it can introduce biases and reduce the effectiveness of machine learning models. The steps include handling missing values, normalization, and encoding categorical variables. Below, we provide a detailed description of each step, including additional techniques and examples to ensure a thorough understanding.
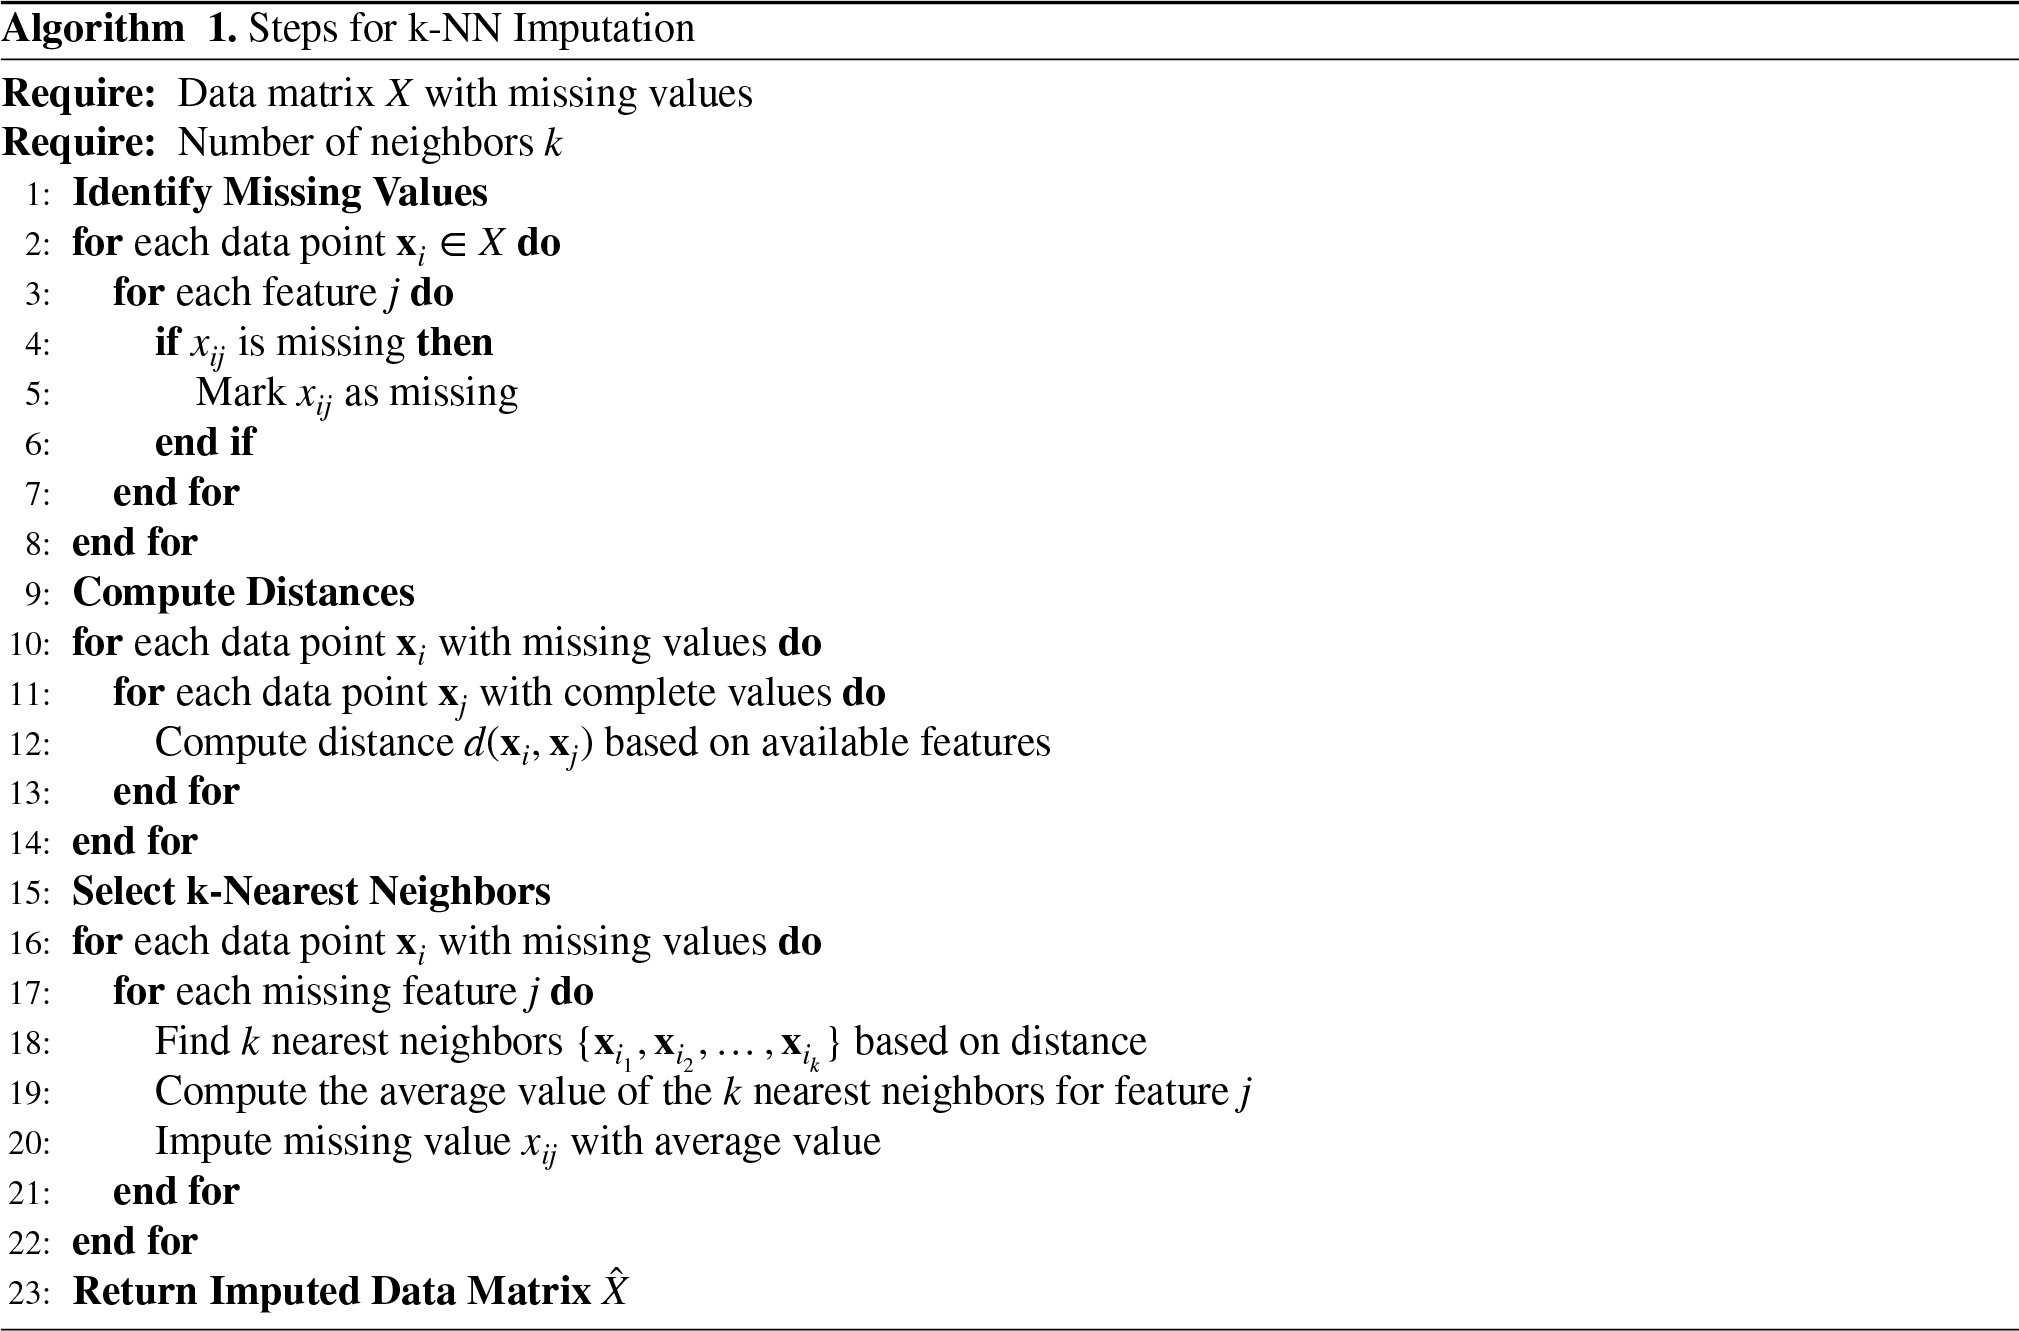
k-NN data imputation for missing values
In this step, the k-Nearest Neighbors (k-NN) method was used to address missing values in only two datasets (Breast Cancer Wisconsin and Credit Approval).
Mathematical Simulation:
1. Distance definition
The distance between two data points 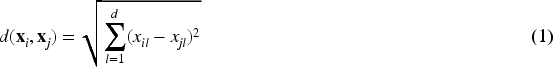
For cases where some features have missing values, the distance is computed based only on the available features:

2. Selecting nearest neighbors
After computing the distances for all pairs of data points, we select the
3. Imputing Value
Imputing value the missing value in feature 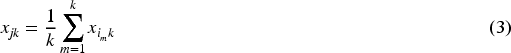
The proposed approach assumes that missing values can be well predicted using information from the nearest data points. The detailed implementation is shown in the pseudocode in Algorithm 1 below.
4. Normalization
Normalization is an essential preprocessing step in machine learning to ensure that all features have the same scale, improving the performance of many algorithms. It is crucial for datasets with features that vary widely in range and units.
If 
This transformation ensures that features have a mean of zero and a standard deviation of one, helping stabilize the learning process and convergence in gradient-based algorithms.
Specific datasets:


Normalization is important because some algorithms like k-Nearest Neighbors (k-NN), Support Vector Machines (SVM), and Neural Networks are sensitive to the scale of input features. By normalizing the data, we ensure that all features are on a comparable scale, resulting in more stable and reliable model performance.
5. Encoding Categorical Variables
Categorical variables require encoding for use by machine learning algorithms. A common technique is hot encoding, where each category is transformed into binary features.
Let
These steps ensure that the data are ready for use in machine learning algorithms, thereby improving the accuracy and effectiveness of the models built.
Indicator Function Notation
To ensure clarity and consistency in the mathematical expressions throughout this study, we define the indicator function 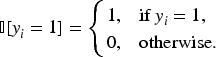
Imbalanced data refers to situations where the number of instances in one class significantly exceeds those in another, which can bias the classifier toward the majority class. To mitigate this issue, we apply a random undersampling technique using a fixed random seed to ensure reproducibility.
Problem Formulation
Let the dataset be defined as:

Undersampling Procedure
Let 

If
Balanced Dataset Construction
Let 
Pseudocode
The following algorithm summarizes the fixed random state undersampling process:
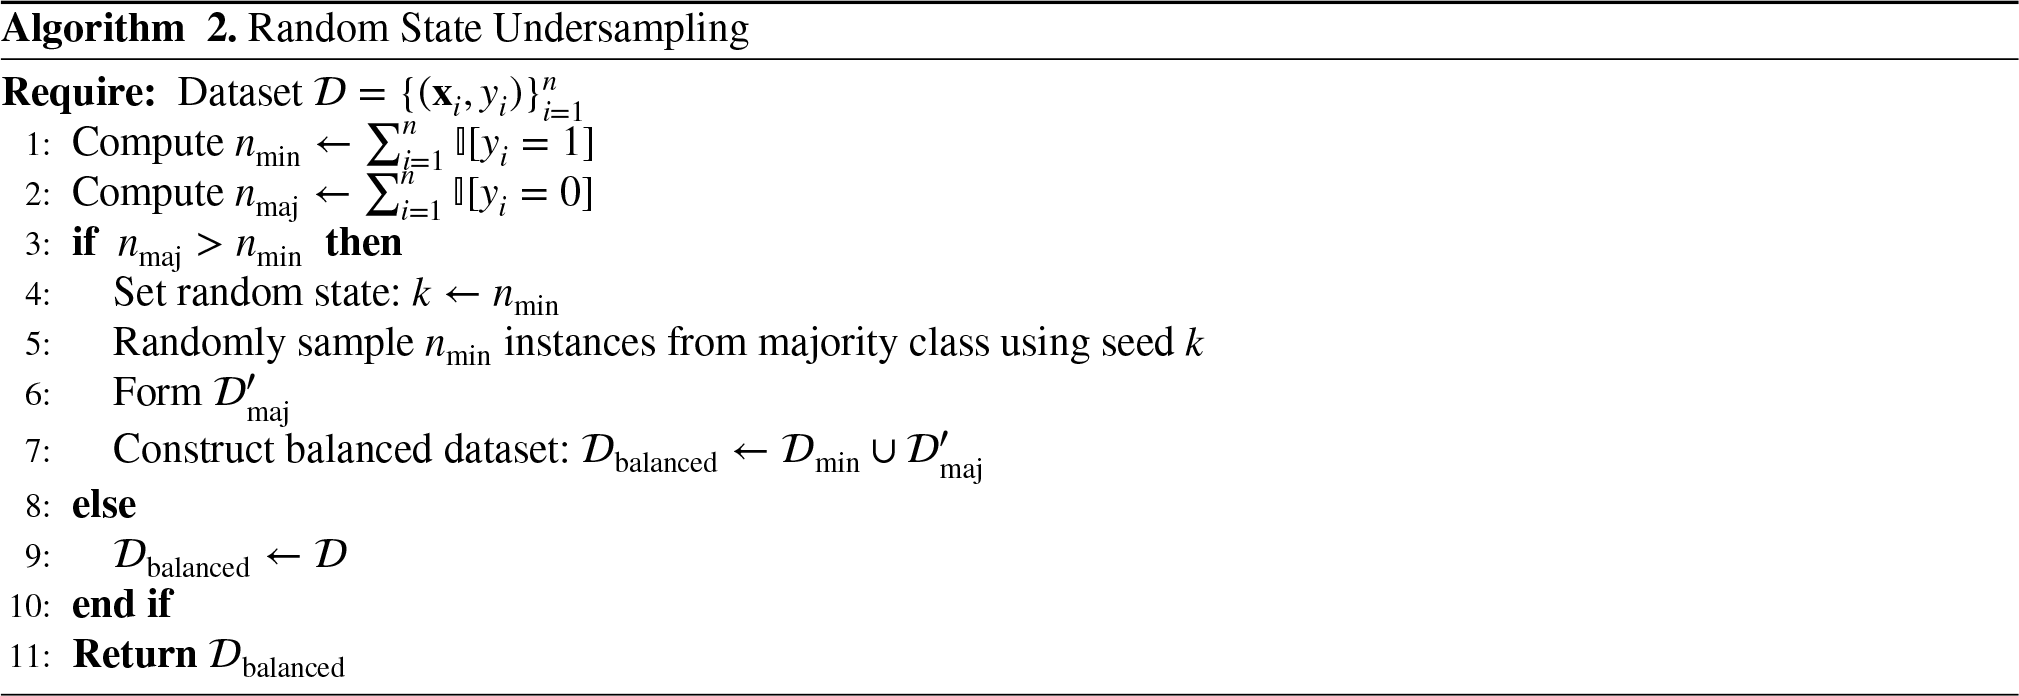
This method ensures that the class distribution is balanced, and a fixed random state prevents model performance fluctuations due to random variations in the undersampling process. This approach helps provide more reliable and consistent results.
After preprocessing, including missing value imputation via k-NN, normalization of continuous features, and encoding of categorical attributes, each dataset is subjected to a fixed random-state undersampling process. The resulting balanced dataset is then used to train a Random Forest model through bootstrap sampling and feature bagging. This full workflow is illustrated in Figure 1, ensuring consistent and replicable model performance across all datasets.
The Fixed Random State Undersampling Forest (FRSTU-Forest) model combines random undersampling techniques with the Random Forest algorithm to ensure consistency and stability in the undersampling process by determining a fixed
In our experiments, we set the number of trees in the Random Forest to
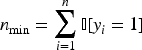
Let 
The minority class is the class with fewer examples (
A key distinction of FRSTU-Forest compared to our earlier RSTU+RF model lies in its deterministic sampling mechanism. While RSTU+RF leverages undersampling with a conventional random process, FRSTU-Forest fixes the random state during majority class sampling. This design ensures that identical samples are consistently selected in each run, enabling improved reproducibility and reduced performance variance. Such determinism is particularly valuable in safety-critical or regulated environments where repeatability and traceability of results are essential.
To ensure reproducibility and reduce performance variance caused by random undersampling, a fixed 
However, to validate the robustness of this fixed sampling scheme, a sensitivity analysis was conducted by varying the
The results of this analysis, discussed in the Statistical Difference Test section, demonstrate that the model performance remains stable across different values of
Stability Considerations and Sensitivity Design
To evaluate the robustness of the FRSTU-Forest framework, a complementary experiment was designed to assess the impact of varying the fixed random state parameter. Specifically, multiple values of
Each bootstrap sample


The proposed model is detailed in the pseudocode in Algorithm 3 below.
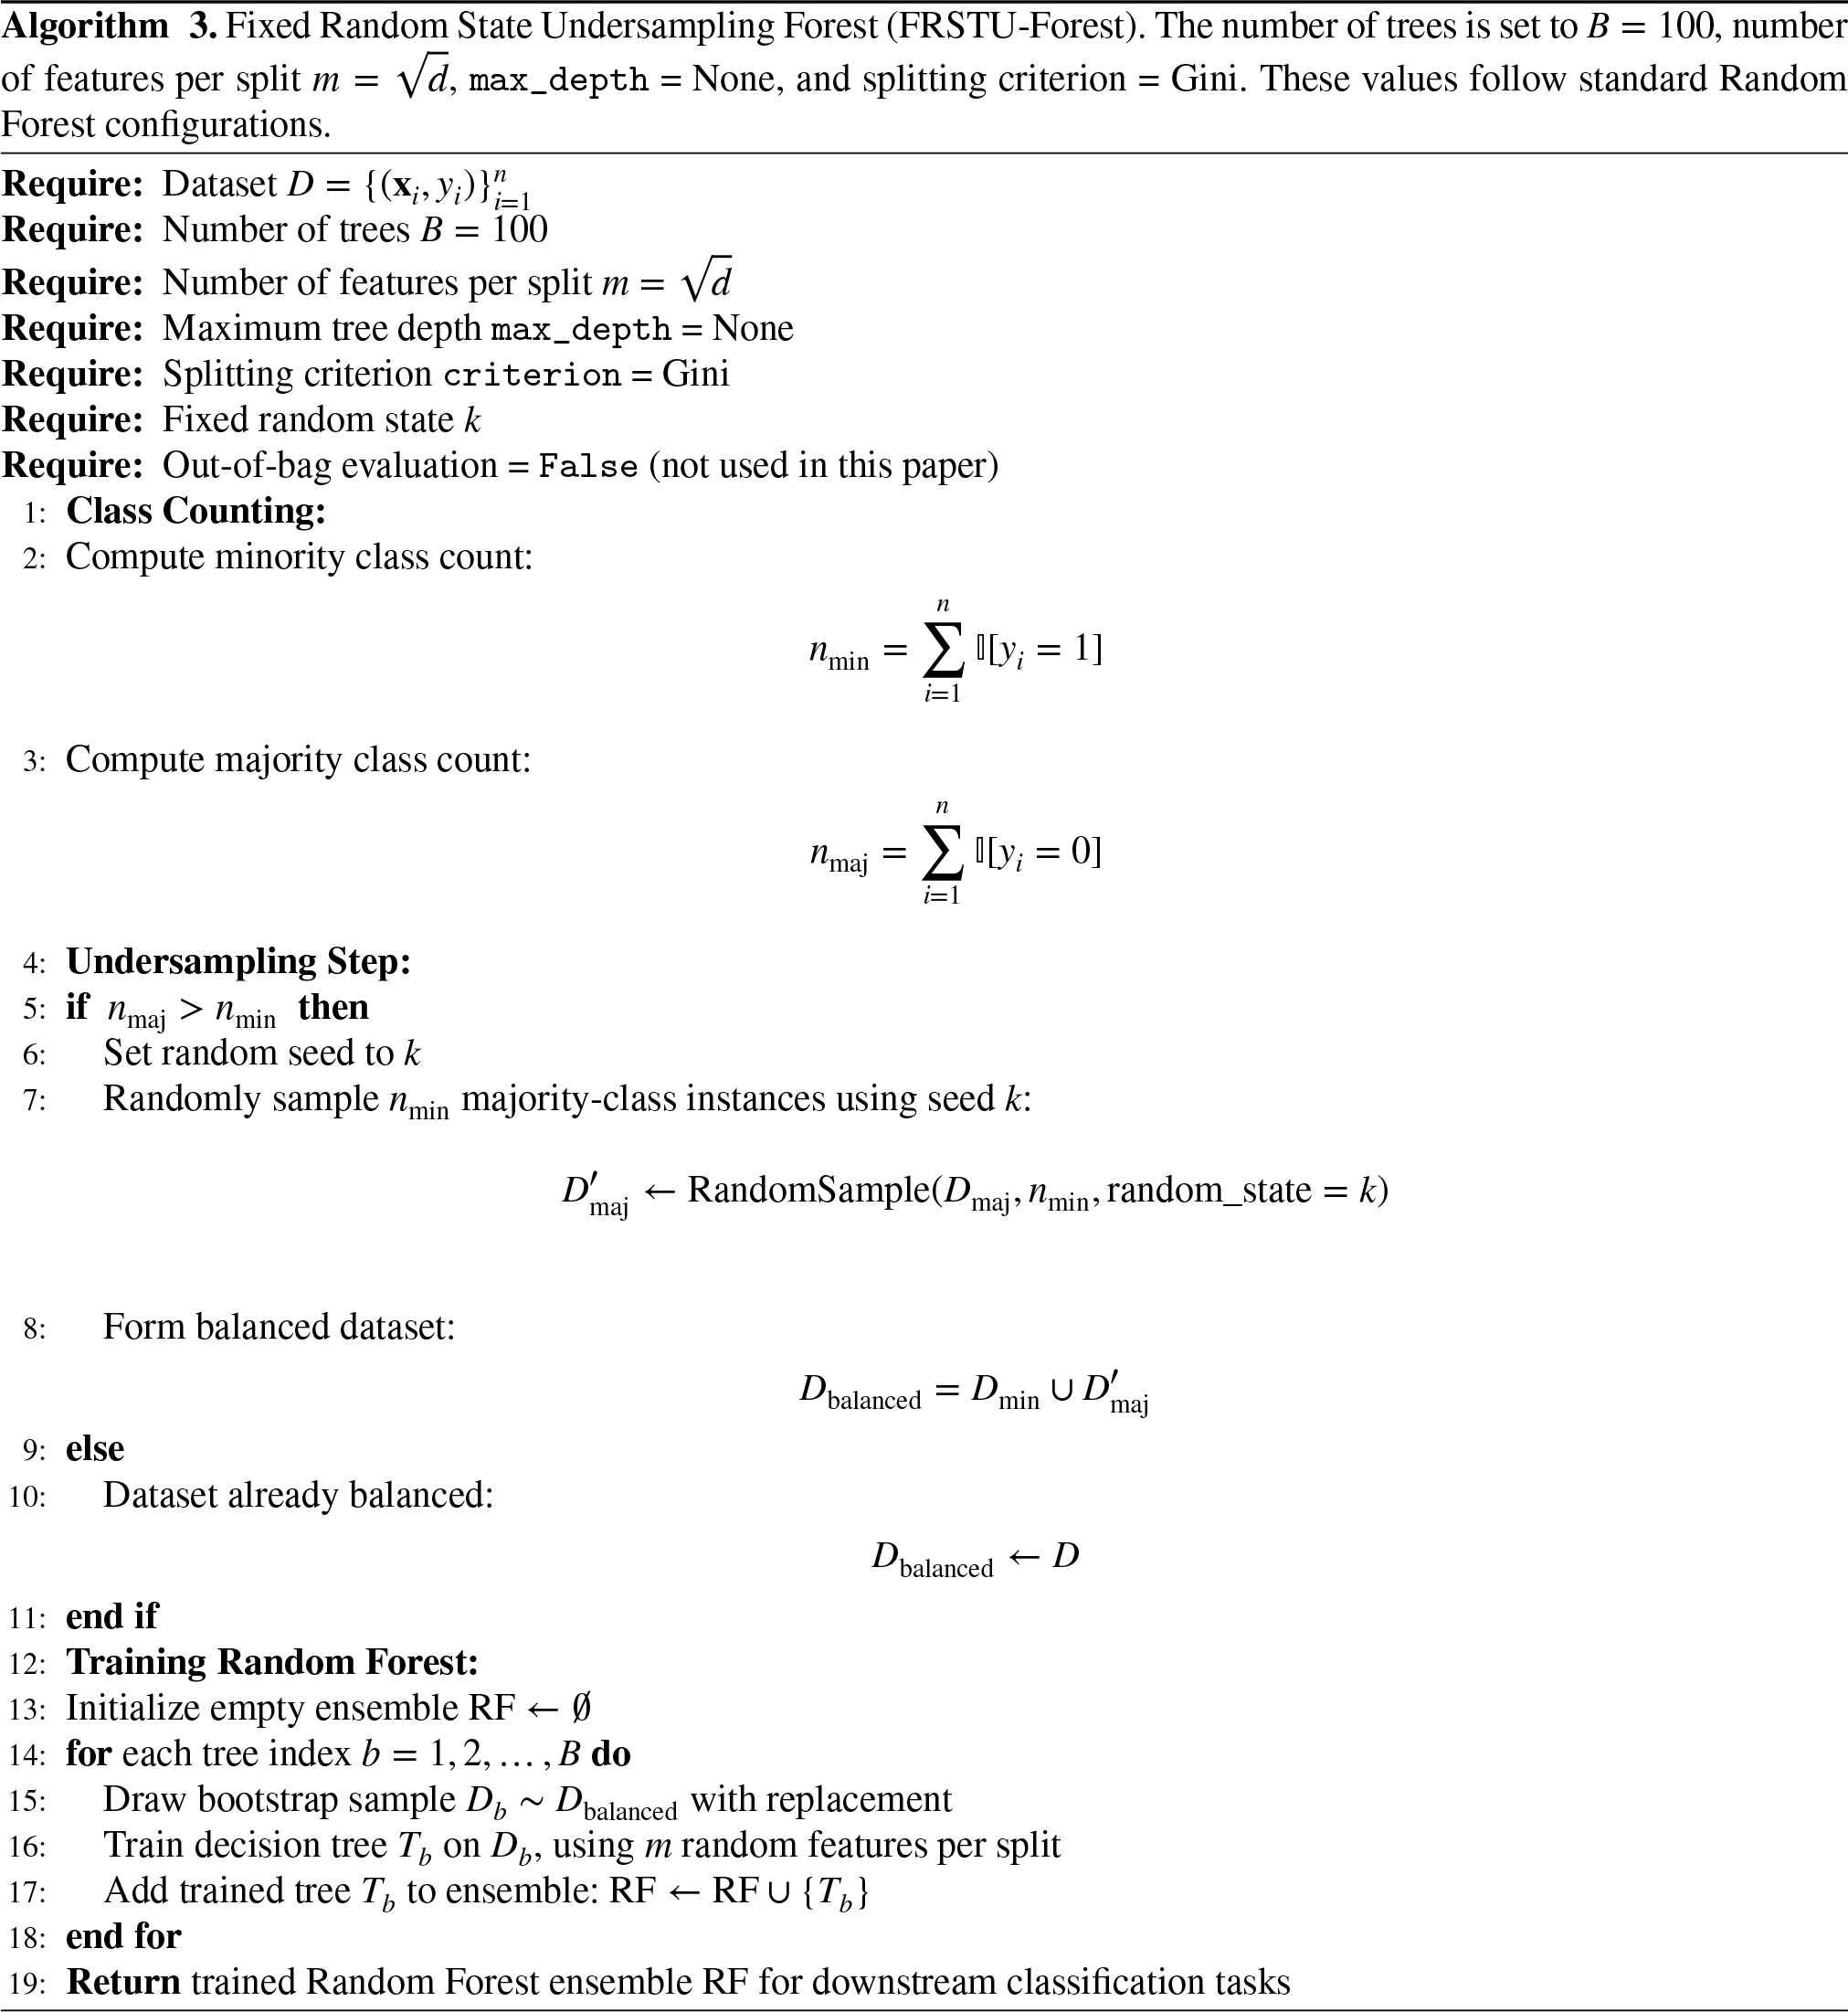
The selection of
Feature Bagging and Bootstrap Sampling
Each decision tree in the ensemble is trained on a bootstrap sample drawn with replacement from the balanced dataset
This mechanism reduces correlation among trees and enhances model generalization. Although out-of-bag (OOB) samples are typically used for internal validation in standard Random Forests, this paper does not employ OOB evaluation explicitly. Instead, external validation using test data is used to assess model performance consistently.
In ensemble-based classifiers such as Random Forests, classifier diversity is fundamental to achieving strong generalization performance. While randomness in data sampling promotes decorrelation among base learners, excessive stochasticity particularly from random undersampling can increase training instability and undermine model reproducibility, especially in highly imbalanced datasets. 25
The proposed fixed-state undersampling method addresses this issue by deterministically selecting majority class samples using a fixed random seed. This deterministic behavior stabilizes the composition of training subsets across different training sessions, contributing to experimental reproducibility, which is increasingly emphasized in high-stakes domains such as medical diagnostics and financial risk modeling. 26 Furthermore, consistent sampling improves learning dynamics by preventing inadvertent loss of critical class distributions across runs.
This theoretical rationale aligns with ensemble learning principles, where reducing variance across base learners enhances overall predictive reliability. As noted by Gurcan et al., undersampling that preserves minority class representations while reducing noise in majority class instances leads to improved generalization in imbalanced learning. 27 While Random Forest inherently induces diversity via feature bagging and bootstrapping, additional randomness from data selection may degrade ensemble consistency when not properly constrained.
Additionally, this approach enhances what is referred to as sampling stability, defined as the preservation of statistically similar training conditions across different runs. In imbalanced scenarios, where minority class patterns are already underrepresented, fixed sampling helps prevent the exclusion of rare yet informative instances, thereby mitigating the risk of underfitting the minority class. 28
Empirical results in recent studies have demonstrated that fixed-seed or controlled sampling strategies improve the bias-variance trade-off in ensemble classifiers, especially when applied to imbalanced biomedical and financial datasets.17,29 Therefore, the fixed-state undersampling in FRSTU-Forest contributes not only to reproducibility but also to more robust and stable ensemble behavior across deployments.
Experimental results and analysis
In this section, we describe three experiments conducted to evaluate the effectiveness of the proposed method. The first experiment explored whether FRSTU-Forest can provide more competitive results than basic and advanced learning methods such as RF, k-NNimp+RF, and RSTU+RF. The second experiment assesses whether the performance of the improved RF model, by combining k-NNimp and improved RSU, is significantly better than that of the original RF model. In addition, the influence of weak learners on RF learning is explored.
Experiment setting
Experiments were conducted using a computing platform with an Intel Core i5 2.5 GHz Dual-Core CPU, 8 GB RAM, and macOS Catalina Version 10.15.7 (64-bit operating system). The data analysis tool used was Knime version 5.3, and R version 4.2.3 was used for statistical analysis. Knime produced a confusion matrix, and R produced a Bonferroni-Dunn test based on the Friedman test for statistical comparisons between the proposed method and comparative research.
Analysis of results for each classes of each dataset
Glass dataset
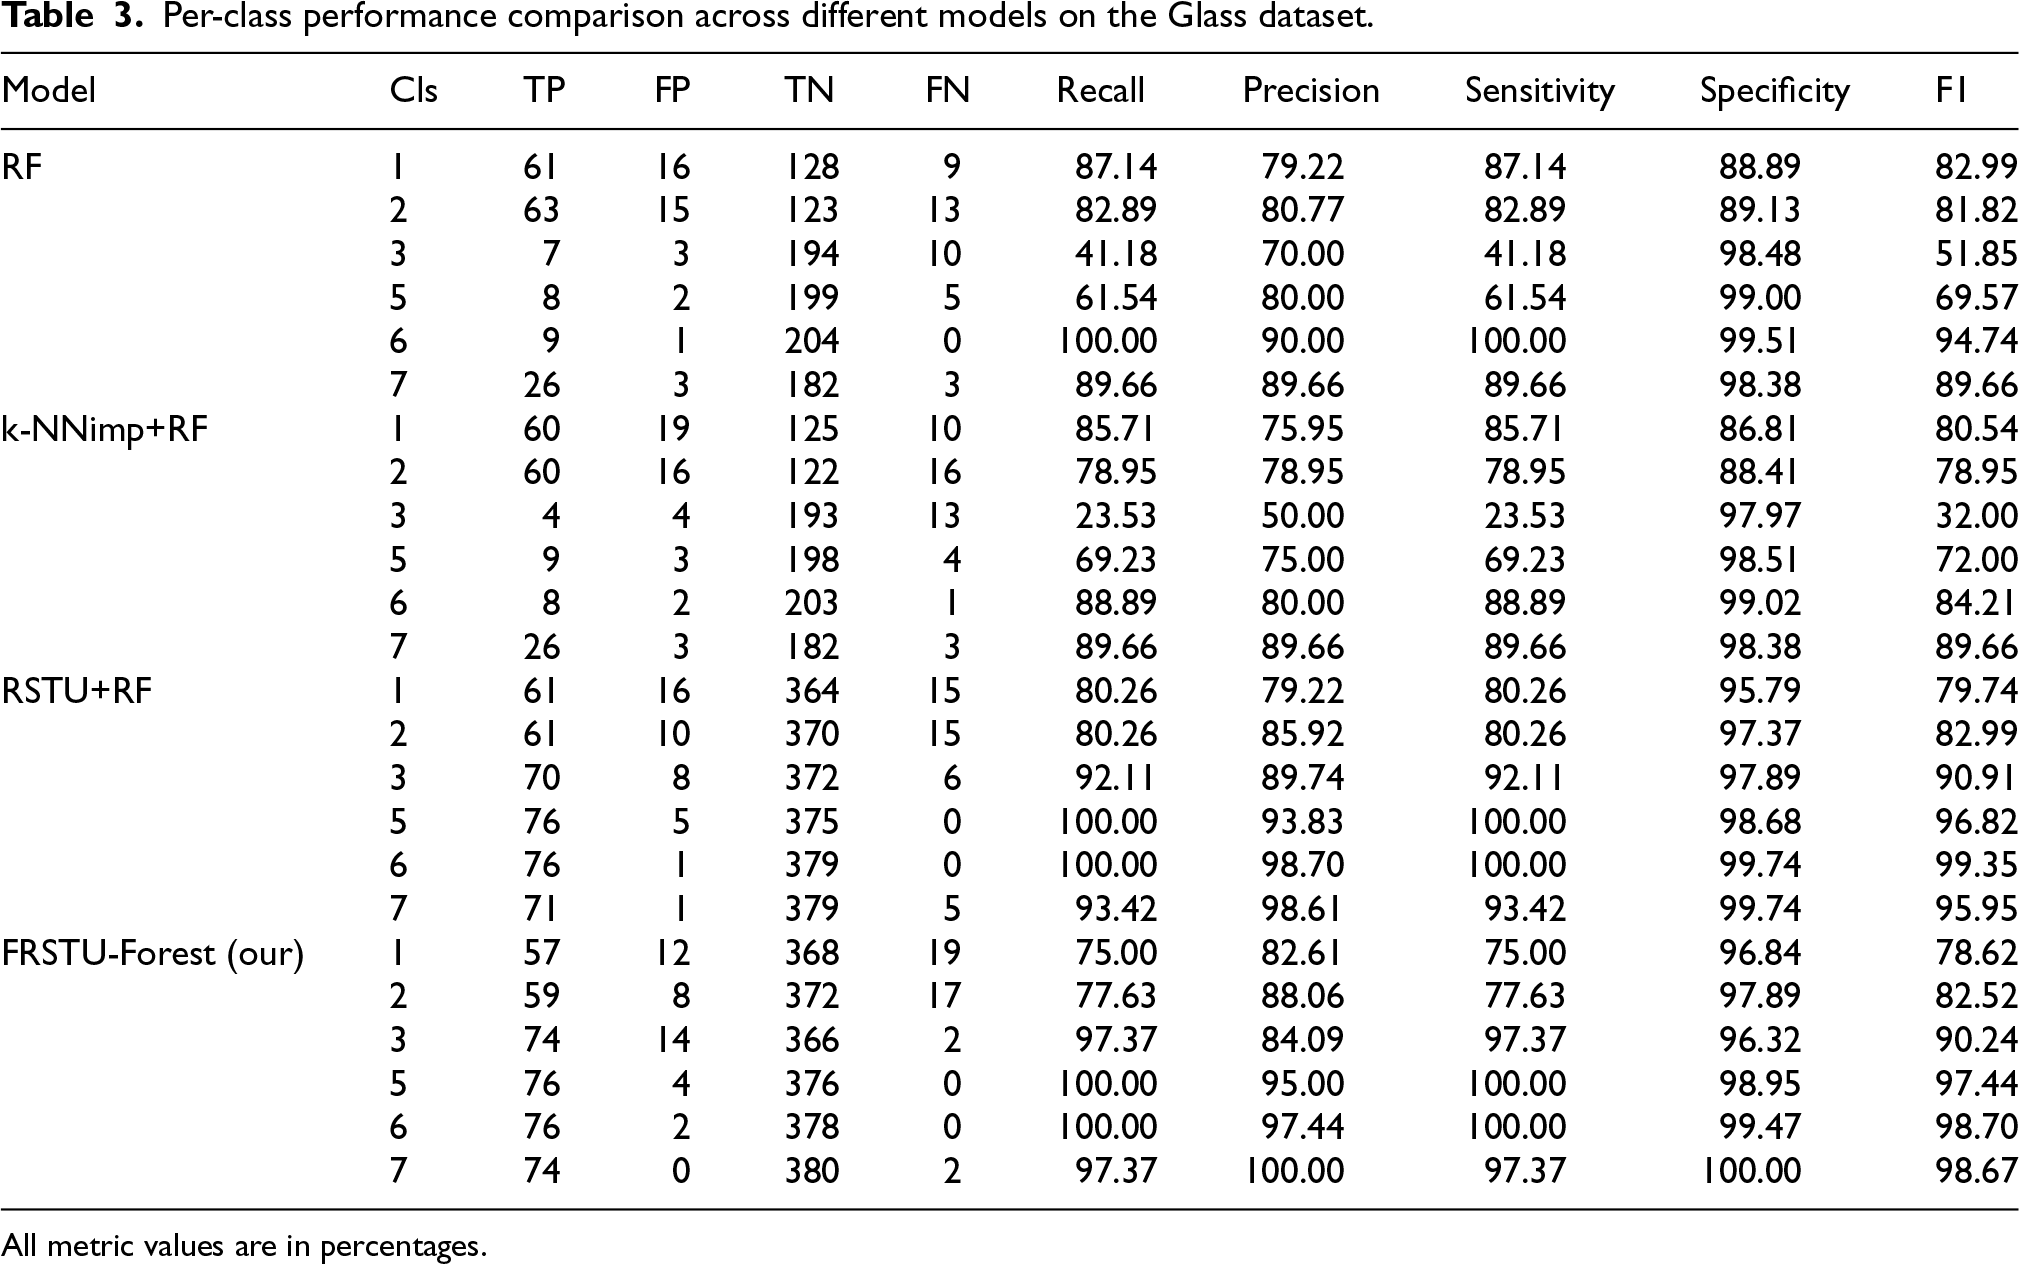
Table 3 presents a comparative analysis of various models for each class in the Glass dataset, covering the metrics of True Positives (TP), False Positives (FP), True Negatives (TN), False Negatives (FN), Recall, Precision, Sensitivity, Specificity, and F-measure.
Per-class performance comparison across different models on the Glass dataset.
Per-class performance comparison across different models on the Glass dataset.
All metric values are in percentages.
As shown in Table 3, the Random Forest (RF) model exhibited strong performance in several classes. For instance, in Class 1, RF achieved a recall of 87.14% and a precision of 79.22%, resulting in an F-measure of 82.99%. In Class 2, recall and precision were relatively balanced (82.89% and 80.77%, respectively), yielding an F-measure of 81.82%. However, RF struggled significantly in Class 3, with a recall of only 41.18% and precision of 70.00%, leading to a modest F-measure of 51.85%. In contrast, the model performed exceptionally well in Class 6, achieving 100% recall and 90.00% precision, with an F-measure of 94.74%.
The k-NNimp+RF model demonstrated similar behavior to RF in several classes, but with notable differences in minority class detection. For example, in Class 1, its recall was slightly lower at 85.71% and precision dropped to 75.95%, leading to an F-measure of 80.54%. More importantly, its performance deteriorated significantly in Class 3, where recall dropped to 23.53% and precision to 50.00%, resulting in a very low F-measure of 32.00%. This highlights the model’s limited effectiveness in handling highly imbalanced classes.
In comparison, the RSTU+RF model showed substantial improvement, particularly in minority class recognition. It achieved a recall of 92.11% and a precision of 89.74% in Class 3, leading to a strong F-measure of 90.91%. For Classes 5 and 6, it recorded perfect recall and precision (100%) and yielded F-measures of 96.82% and 99.35%, respectively. These results affirm the positive impact of undersampling with a fixed random state on imbalanced data performance.
The FRSTU-Forest model further improved upon these results. In Class 3, it achieved a very high recall of 97.37% and precision of 84.09%, resulting in an F-measure of 90.24%. For Classes 5 and 6, the model also recorded perfect recall and precision (100%), with F-measures of 97.44% and 98.70%, respectively. While comparable to RSTU+RF in performance, FRSTU-Forest exhibited slightly greater precision in Class 3 and more consistent results across other minority classes.
These observations suggest that both RSTU+RF and FRSTU-Forest significantly outperformed RF and k-NNimp+RF across most classes. k-NNimp+RF showed difficulty in detecting Class 3, and although RF maintained reasonably balanced metrics in major classes, it underperformed in minority ones. Notably, FRSTU-Forest demonstrated not only competitive accuracy but also greater consistency across repeated trials, due to its deterministic sampling strategy. This stability is particularly valuable in high-risk domains such as forensic analysis, quality control, and security applications, where reproducibility and precision are critical.
Overall, the results confirm that integrating fixed-state undersampling with rough set-based feature selection and imputation enhances both minority class detection and model stability. FRSTU-Forest proves to be a reliable and effective classifier in imbalanced multi-class scenarios like the Glass dataset.
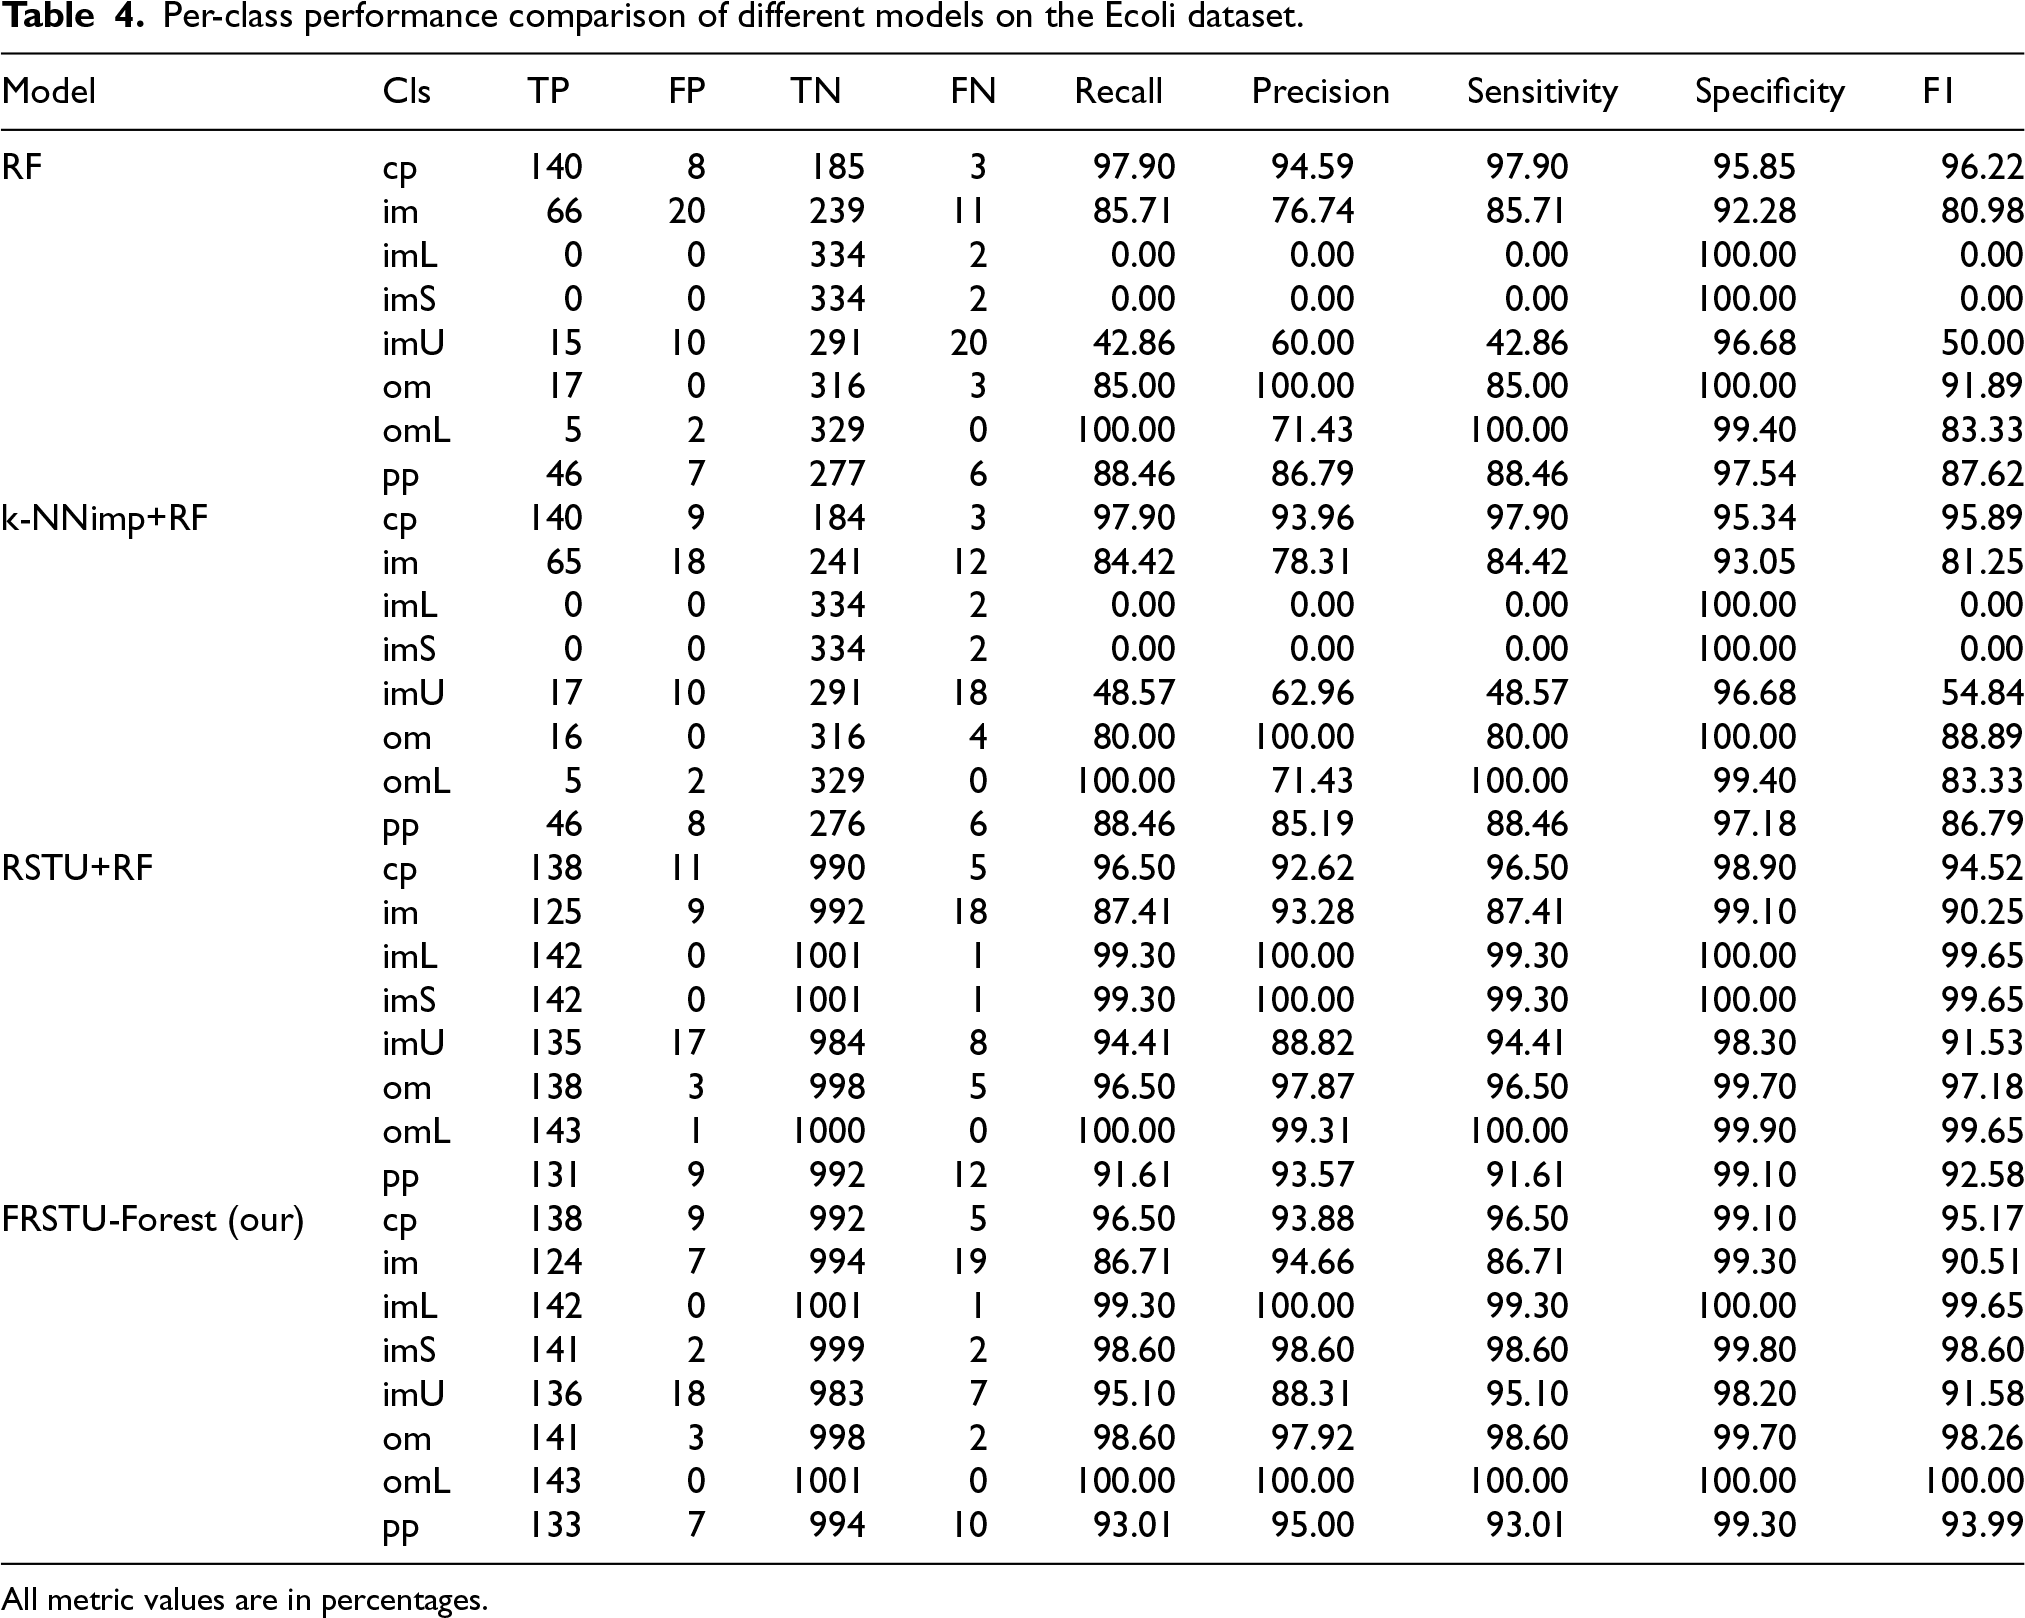
Table 4 shows a comparative analysis of the performance of various models in each class in the Ecoli dataset using the metrics True Positives (TP), False Positives (FP), True Negatives (TN), False Negatives (FN), Recall, Precision, Sensitivity, Specificity, and the F-measure.
Per-class performance comparison of different models on the Ecoli dataset.
Per-class performance comparison of different models on the Ecoli dataset.
All metric values are in percentages.
As shown in Table 4, the Random Forest (RF) model demonstrated strong performance in several dominant classes. For instance, in the cp class, RF achieved a recall of 97.90% and precision of 94.59%, resulting in an F-measure of 96.22%. Similarly, the im class yielded 85.71% recall and 76.74% precision (F-measure: 80.98%). However, RF completely failed to detect instances in the imL and imS classes, with both recall and precision dropping to 0%, indicating an inability to identify minority classes. The om class produced favorable results, with 85.00% recall and 100% precision (F-measure: 91.89%), while the omL class showed 100% recall but only 71.43% precision, yielding an F-measure of 83.33%.
The k-NNimp+RF model exhibited comparable trends with marginal variations. In the cp class, recall remained at 97.90%, but precision slightly declined to 93.96%, resulting in an F-measure of 95.89%. In the im class, performance remained consistent with a recall of 84.42% and precision of 78.31% (F-measure: 81.25%). Similar to RF, this model also failed to detect the imL and imS classes, with both metrics at 0%. For the om class, k-NNimp+RF achieved 80.00% recall and 100% precision (F-measure: 88.89%), reflecting robust detection but slightly reduced sensitivity.
In contrast, the RSTU+RF model significantly improved classification performance across all classes. In the cp class, it recorded 96.50% recall and 92.62% precision, resulting in an F-measure of 94.52%. The im class achieved a balanced recall of 87.41% and a notably higher precision of 93.28% (F-measure: 90.25%). Remarkably, the model performed nearly perfectly on the imL and imS classes, achieving 99.30% for both recall and precision, with corresponding F-measures of 99.65%. Similarly, the om class showed strong results with 96.50% recall and 97.87% precision (F-measure: 97.18%), and the omL class achieved 100% for both recall and precision, reflecting near-perfect classification capability.
The FRSTU-Forest model achieved comparable, and in some cases slightly better, performance than RSTU+RF. In the cp class, it reached a recall of 96.50% and precision of 93.88%, yielding an F-measure of 95.17%. The im class showed a balanced profile with 86.71% recall and 94.66% precision (F-measure: 90.51%). For the minority classes imL and imS, the model also recorded excellent results: imL achieved 99.30% for both recall and precision (F-measure: 99.65%), and imS achieved 98.60% recall and precision (F-measure: 98.60%). In the om class, the model produced 98.60% recall and 97.92% precision (F-measure: 98.26%), while the omL class achieved a perfect 100% in all metrics.
In summary, both RSTU+RF and FRSTU-Forest significantly outperformed RF and k-NNimp+RF on the Ecoli dataset, especially in detecting minority classes such as imL and imS, where RF-based models failed entirely. While k-NNimp+RF offered minor improvements over the baseline RF, it was insufficient for rare class detection. The rough set-based methods demonstrated not only high accuracy but also robustness across all class distributions. Notably, FRSTU-Forest delivered similarly high classification performance while maintaining consistency across repeated experiments, attributed to its deterministic sampling mechanism. This advantage is particularly important in biomedical or bioinformatics applications, where reliable and reproducible classification of minority patterns is essential for downstream decision-making.
Table 5 presents a comparative analysis of the performance of various models for each class in the Credit Approval dataset using the metrics True Positives (TP), False Positives (FP), True Negatives (TN), False Negatives (FN), Recall, Precision, Sensitivity, Specificity, and the F-measure.
Per-class performance comparison of different models on the Credit Approval dataset.
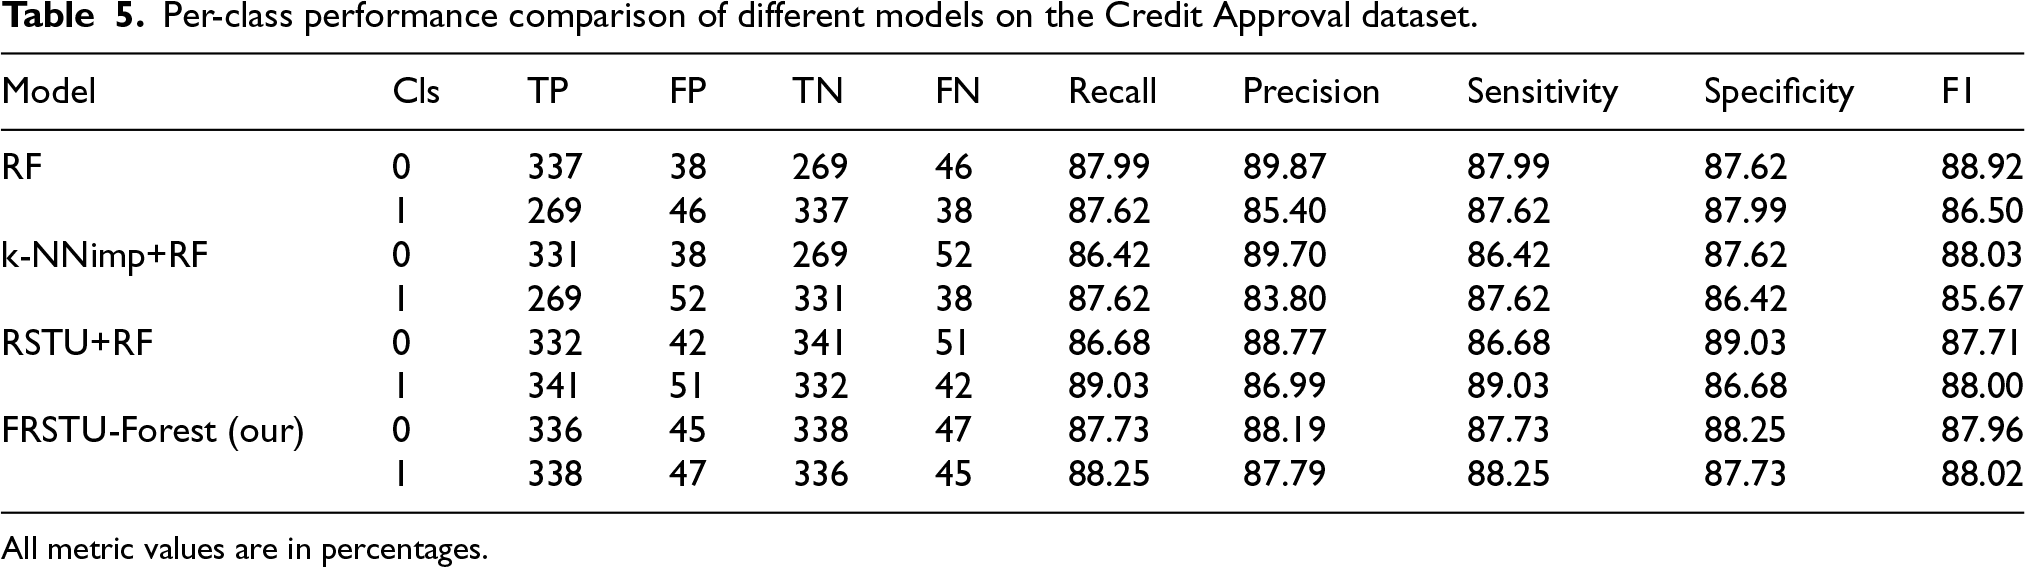
Per-class performance comparison of different models on the Credit Approval dataset.
All metric values are in percentages.
As shown in Table 5, the Random Forest (RF) model delivered solid performance in both class categories. For Class 0, RF achieved a recall of 87.99% and a precision of 89.87%, resulting in an F-measure of 88.92%. Class 1 exhibited similarly strong performance, with a recall of 87.62% and a precision of 85.40% (F-measure: 86.50%). Although these results suggest that RF can classify both classes effectively, a slight imbalance between recall and precision especially in Class 1 indicates a tendency to favor majority-class decisions.
The k-NNimp+RF model produced comparable results but exhibited a slight decrease in overall precision. In Class 0, it recorded 86.42% recall and 89.70% precision, yielding an F-measure of 88.03%. For Class 1, the recall remained unchanged at 87.62%, but precision declined to 83.80%, resulting in an F-measure of 85.67%. These metrics reflect that while the model maintained recall, it struggled more with precision, particularly in identifying minority-class samples correctly.
RSTU+RF demonstrated improved balance and robustness across both classes. In Class 0, the model achieved 86.68% recall and 88.77% precision (F-measure: 87.71%). More notably, in Class 1, it recorded an increased recall of 89.03% and precision of 86.99%, producing an F-measure of 88.00%. These figures indicate that RSTU+RF provides a more symmetrical trade-off between false positives and false negatives, which is critical in credit risk prediction.
The FRSTU-Forest model achieved the most consistent and balanced performance among all models tested. In Class 0, it yielded 87.73% recall and 88.19% precision, leading to an F-measure of 87.96%. For Class 1, it achieved 88.25% recall and 87.79% precision (F-measure: 88.02%). The minimal gap between recall and precision in both classes illustrates the model’s superior ability to manage class imbalance effectively while maintaining predictive reliability.
In summary, both rough set-based models RSTU+RF and FRSTU-Forest outperformed the standard RF and k-NNimp+RF models in terms of achieving balance between precision and recall. Although RF and k-NNimp+RF performed relatively well, they exhibited mild asymmetry between evaluation metrics, particularly for the minority class. RSTU+RF reduced this disparity, while FRSTU-Forest further improved both accuracy and consistency. The deterministic undersampling mechanism employed in FRSTU-Forest contributes to its reliable and repeatable outcomes across multiple runs, making it especially suitable for credit approval tasks where model stability and fairness are essential for regulatory compliance and stakeholder trust.
Table 6 presents a comparative analysis of the performance of various models for each class in the Breast Cancer Wisconsin dataset using the metrics True Positives (TP), False Positives (FP), True Negatives (TN), False Negatives (FN), Recall, Precision, Sensitivity, Specificity, and the F-measure.
Per-class performance comparison of different models on the Breast Cancer Wisconsin dataset.
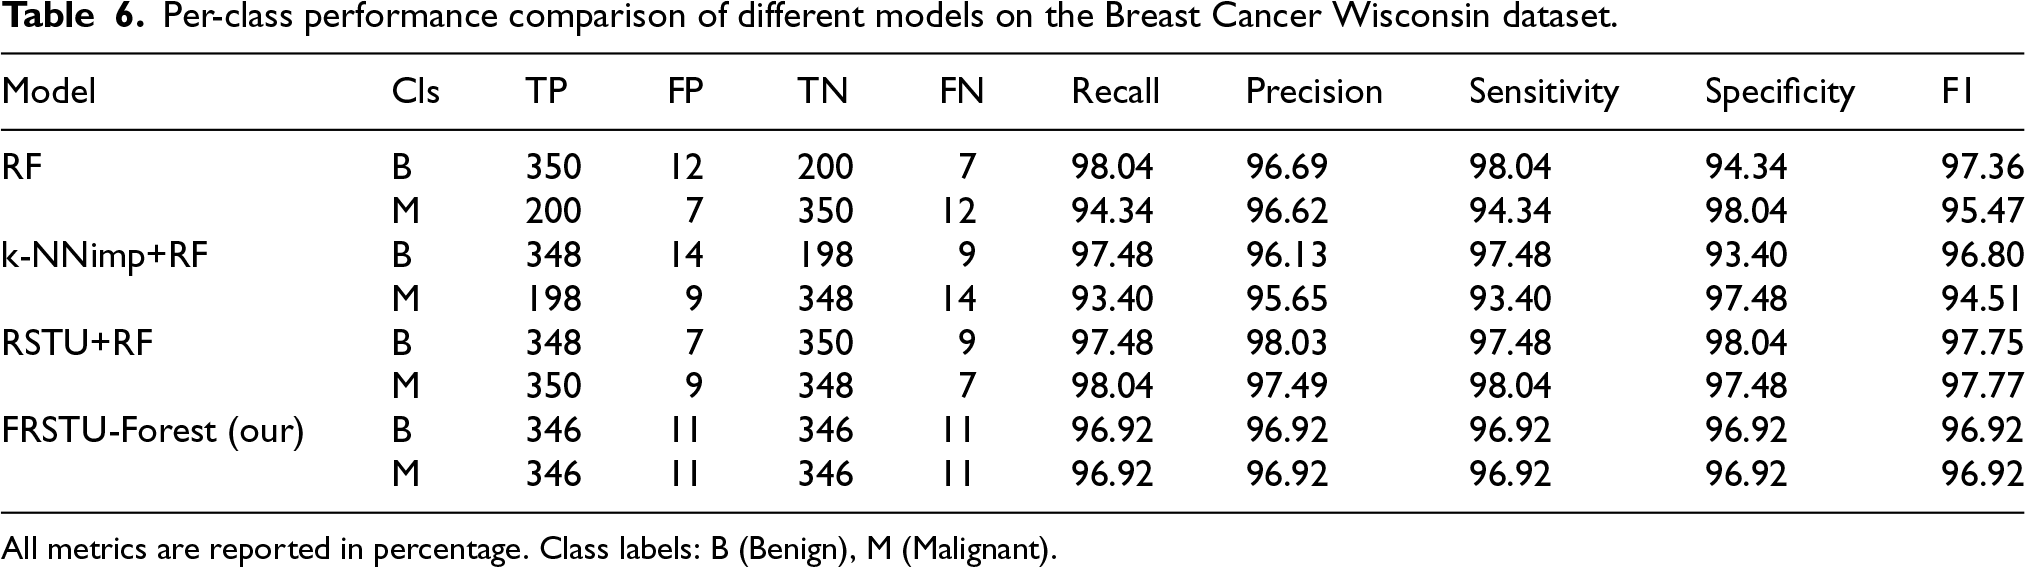
Per-class performance comparison of different models on the Breast Cancer Wisconsin dataset.
All metrics are reported in percentage. Class labels: B (Benign), M (Malignant).
As shown in Table 6, the Random Forest (RF) model delivered excellent performance across both classes. For the B (Benign) class, RF achieved a recall of 98.04% and precision of 96.69%, resulting in an F-measure of 97.36%. For the M (Malignant) class, the model recorded 94.34% recall and 96.62% precision, yielding an F-measure of 95.47%. These results reflect the model’s high accuracy in both class categories, although a slight imbalance between recall and precision remains, particularly for the malignant class.
The k-NNimp+RF model produced comparable outcomes, though it slightly underperformed relative to RF. In the B class, recall was 97.48% and precision was 96.13%, giving an F-measure of 96.80%. For the M class, recall declined marginally to 93.40%, while precision dropped to 95.65% (F-measure: 94.51%). This indicates that although the model remains effective, it shows greater variability in performance between the two classes and is slightly less precise in identifying malignant cases.
The RSTU+RF model outperformed both preceding methods, demonstrating not only strong but also balanced performance across classes. In the B class, it achieved 97.48% recall and 98.03% precision, producing an F-measure of 97.75%. In the M class, it recorded 98.04% recall and 97.49% precision (F-measure: 97.77%). The close alignment between recall and precision values across both classes suggests that this model excels in minimizing both false negatives and false positives—an essential requirement in medical diagnosis.
The FRSTU-Forest model also yielded high and highly consistent results. For both B and M classes, the model reported identical recall, precision, sensitivity, and specificity values of 96.92%, resulting in an F-measure of 96.92% for each class. While slightly trailing behind RSTU+RF in absolute performance, the FRSTU-Forest exhibited superior consistency, suggesting stable classification behavior and reduced prediction variance across multiple runs.
In conclusion, the rough set-based models, particularly RSTU+RF and FRSTU-Forest provided superior results compared to RF and k-NNimp+RF on the Breast Cancer Wisconsin dataset. While RF and k-NNimp+RF demonstrated strong performance, they showed slightly greater asymmetry between evaluation metrics. RSTU+RF achieved the highest overall accuracy and balance, while FRSTU-Forest offered more uniform results, reinforcing its strength in producing stable classifications. These findings underscore the suitability of rough set-based approaches for clinical applications where both accuracy and reliability are paramount for effective early detection and risk assessment.
Table 7 presents a comparative analysis of the performance of various models for each class in the Pima Indian Diabetes dataset using the metrics True Positives (TP), False Positives (FP), True Negatives (TN), False Negatives (FN), Recall, Precision, Sensitivity, Specificity, and the F-measure.
Performance comparison of models per class on the Pima Indian Diabetes dataset.
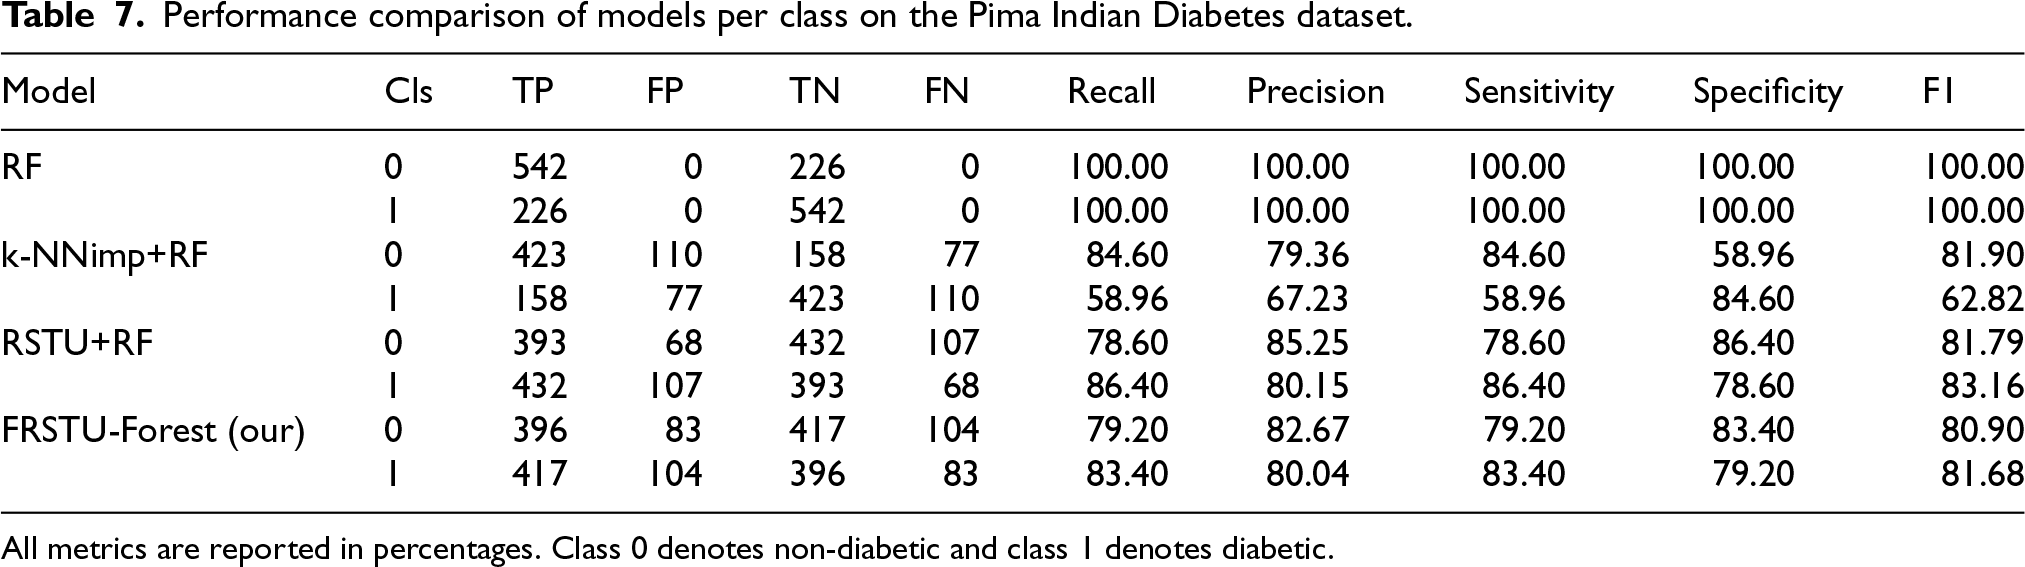
Performance comparison of models per class on the Pima Indian Diabetes dataset.
All metrics are reported in percentages. Class 0 denotes non-diabetic and class 1 denotes diabetic.
As shown in Table 7, the Random Forest (RF) model yielded perfect performance on the Pima Indian Diabetes dataset. For both Class 0 and Class 1, the model achieved 100% recall, precision, sensitivity, specificity, and F-measure. While these results indicate flawless classification on the test data, they raise concerns about potential overfitting, particularly given the complexity and noise commonly associated with medical datasets. Such perfect scores, though impressive, warrant careful scrutiny to assess the model’s generalization ability.
In contrast, the k-NNimp+RF model exhibited a substantial decline in performance. For Class 0, recall dropped to 84.60% and precision to 79.36%, resulting in an F-measure of 81.90%. Class 1 showed even more pronounced degradation, with 58.96% recall and 67.23% precision (F-measure: 62.82%). These figures reflect a considerable imbalance between recall and precision in Class 1, suggesting that the model struggled to correctly identify diabetic cases, a critical shortcoming in clinical decision-making contexts.
The RSTU+RF model provided a more balanced and improved classification outcome. For Class 0, recall was 78.60% and precision 85.25%, leading to an F-measure of 81.79%. In Class 1, both metrics improved significantly: recall reached 86.40% and precision was 80.15%, resulting in an F-measure of 83.16%. This demonstrates the model’s stronger capability to correctly identify both diabetic and non-diabetic patients with reasonable balance, mitigating the extreme variance seen in the k-NNimp+RF model.
The FRSTU-Forest model also exhibited balanced and competitive performance. In Class 0, the model achieved 79.20% recall and 82.67% precision (F-measure: 80.90%), while in Class 1, recall was 83.40% and precision 80.04% (F-measure: 81.68%). While its absolute performance was slightly lower than RSTU+RF, the FRSTU-Forest model maintained a consistent margin between recall and precision across classes, indicating a stable and interpretable classifier with less variability across experimental runs.
In summary, although the RF model produced seemingly perfect classification results, such an outcome likely signals overfitting rather than genuine predictive robustness. By comparison, the rough set-based models, especially RSTU+RF and FRSTU-Forest demonstrated more realistic and generalizable performance with well-balanced precision and recall across both classes. These models offer stronger evidence of reliability for deployment in real-world diabetes screening systems, where false positives and false negatives must be carefully managed. k-NNimp+RF showed reasonable performance but struggled with minority class detection. Overall, RSTU+RF stands out for its high recall in identifying diabetic cases, while FRSTU-Forest offers a strong balance and stability, making both models well-suited for clinical applications where consistency and interpretability are paramount.
Table 8 presents a comparative analysis of the performance of various models for each class in the German Credit dataset using the metrics True Positives (TP), False Positives (FP), True Negatives (TN), False Negatives (FN), Recall, Precision, Sensitivity, Specificity, and the F-measure.
Per-class performance comparison of different models on the German Credit dataset.
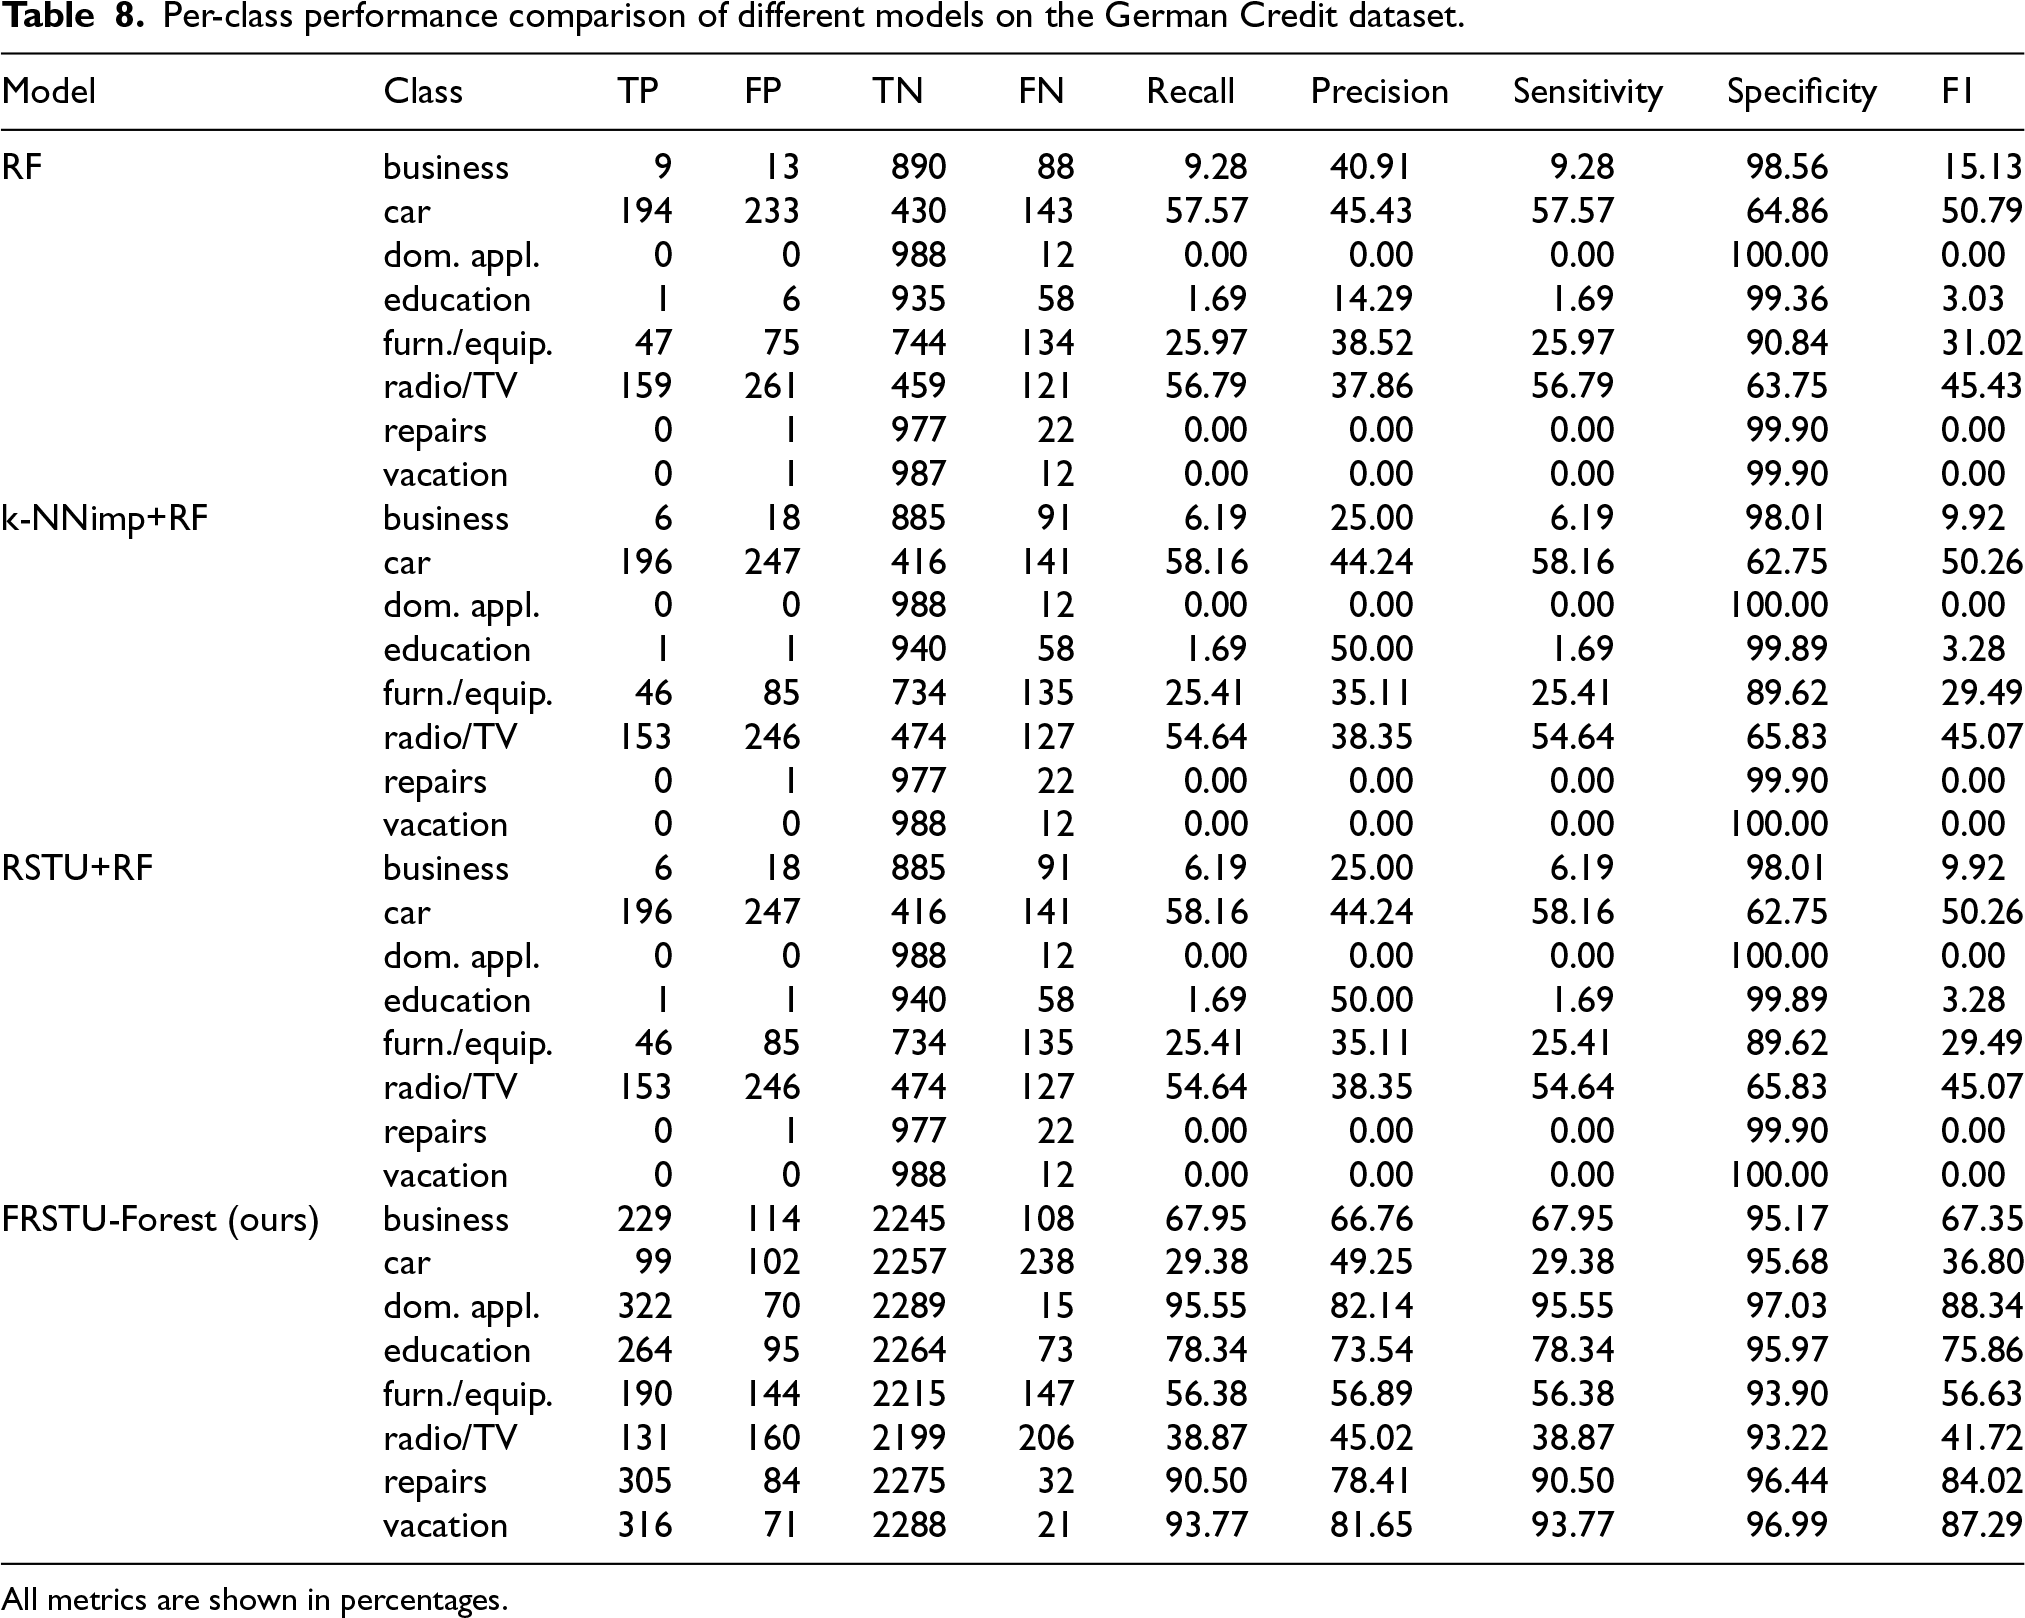
Per-class performance comparison of different models on the German Credit dataset.
All metrics are shown in percentages.
As shown in Table 8, the Random Forest (RF) model exhibited inconsistent and often weak performance across several classes in the German Credit dataset. For the business class, recall was notably low at 9.28%, and precision reached only 40.91%, resulting in a modest F-measure of 15.13%. The car class showed moderate classification quality, with recall and precision of 57.57% and 45.43%, respectively (F-measure: 50.79%). However, the model entirely failed to detect instances from the domestic appliance and repair classes, where both recall and precision dropped to 0%, yielding F-measures of 0%. Performance in the radio/TV and furniture/equipment classes was suboptimal, with F-measures of 45.43% and 31.02%, respectively, reflecting the model’s general difficulty in capturing minority or underrepresented categories.
The k-NNimp+RF model produced performance metrics similar to RF with minor fluctuations. For example, in the business class, recall dropped slightly to 6.19%, and precision decreased to 25.00%, reducing the F-measure to 9.92%. In the car class, the model showed a marginally higher recall of 58.16%, though with reduced precision (44.24%), resulting in an F-measure of 50.26%. A notable exception was observed in the education class, where precision increased to 50.00%; however, the recall remained critically low at 1.69%, yielding an F-measure of only 3.28%. Overall, this model exhibited localized improvements but continued to struggle with severely imbalanced classes.
The RSTU+RF model mirrored the performance of k-NNimp+RF almost exactly. In the business class, it again recorded 6.19% recall and 25.00% precision (F-measure: 9.92%). Its results in the car and education classes also matched those of the k-NNimp+RF model. This consistency suggests that RSTU+RF alone did not contribute substantial gains in classifying minority categories within this dataset, particularly under extreme imbalance conditions.
In contrast, the FRSTU-Forest model demonstrated a substantial improvement across a broad range of classes. For the business class, recall rose significantly to 67.95%, and precision to 66.76%, resulting in an F-measure of 67.35%. While the car class saw a lower recall (29.38%) compared to RF-based models, the increase in precision (49.25%) led to a more favorable F-measure of 36.80%. More strikingly, the model achieved exceptional results in classes previously undetected by other models. In the domestic appliance class, recall and precision reached 95.55% and 82.14%, respectively (F-measure: 88.34%). Similarly, the education class achieved 78.34% recall and 73.54% precision (F-measure: 75.86%). Repair and vacation/other classes also showed strong F-measures of 84.02% and 87.29%, respectively, underscoring the model’s capacity to correctly identify previously elusive categories.
These results strongly indicate that the FRSTU-Forest model outperformed all other models in effectively managing class imbalance, particularly in detecting rare and underrepresented classes. While the standard RF and k-NNimp+RF models achieved moderate results in certain categories, their overall reliability was limited by failure to generalize across the full class distribution. RSTU+RF, although theoretically beneficial, did not provide meaningful improvement on its own. In contrast, the integration of fixed-state undersampling in FRSTU-Forest enabled more consistent and accurate classification across difficult categories, making it a highly promising approach for credit scoring applications, where fairness and sensitivity to minority group performance are essential.
Table 9 presents a comparative analysis of the performance of various models for each class in the yeast dataset using the metrics True Positives (TP), False Positives (FP), True Negatives (TN), False Negatives (FN), Recall, Precision, Sensitivity, Specificity, and the F-measure.
Per-class performance comparison of different models on the Yeast dataset.

Per-class performance comparison of different models on the Yeast dataset.
All metrics are shown in percentages.
As shown in Table 9, the Random Forest (RF) model produced varying performance across the different classes in the Yeast dataset. In the CYT class, the model achieved a recall of 72.14% and a precision of 57.09%, resulting in an F-measure of 63.74%, indicating modest capability in identifying cytoplasmic proteins. The ERL class yielded more balanced results with both recall and precision at 80.00% (F-measure: 80.00%), suggesting that RF was effective in capturing this class. In contrast, the VAC class showed a complete failure in detection, with 0% recall and precision, leading to an F-measure of 0%, which is concerning given its biological significance. The EXC class demonstrated borderline acceptable performance (F-measure: 59.15%), highlighting the model’s partial capability in detecting extracellular proteins.
The k-NNimp+RF model offered marginal improvements in several classes. For instance, in the CYT class, although recall slightly decreased to 69.11%, precision improved to 57.14%, maintaining a comparable F-measure of 62.56%. A notable improvement occurred in the ERL class, where precision increased to 100% while recall remained at 80.00%, producing an F-measure of 88.89%. The ME1 class benefited the most, achieving a recall of 79.55% and precision of 74.47%, yielding an F-measure of 76.92%. However, the VAC class still registered 0% recall and precision, signifying persistent challenges in minority class detection.
The RSTU+RF model exhibited marked improvements across most classes. In the CYT class, recall decreased to 56.16% but precision increased to 64.04%, leading to an F-measure of 59.84%, showing better precision-recall balance despite lower sensitivity. The ERL class demonstrated near-perfect classification performance with recall of 100% and precision of 99.57% (F-measure: 99.78%). Similarly, the EXC and ME1 classes achieved impressive F-measures of 94.32% and 97.56%, respectively. The ME3 class showed robust performance (recall: 96.33%, precision: 84.95%, F-measure: 90.28%). The POX class also achieved a high F-measure of 96.01%, confirming the model’s strength in capturing low-frequency classes.
The FRSTU-Forest model further improved upon this, offering consistent and superior results in most categories. For the CYT class, recall was 54.21% and precision 62.13%, resulting in a balanced F-measure of 57.90%, marginally better than RSTU+RF in terms of harmonic trade-off. The ERL class matched RSTU+RF with a near-perfect F-measure of 99.78%, supported by precision of 99.57% and perfect recall. For the EXC and ME1 classes, FRSTU-Forest achieved slightly better performance than RSTU+RF, with F-measures of 94.91% and 97.75%, respectively. The ME3 class maintained high classification quality (recall: 95.03%, precision: 85.94%, F-measure: 90.26%), and the POX class further improved with 97.62% recall and 96.38% precision (F-measure: 97.00%).
In summary, both rough set-based models, particularly FRSTU-Forest, outperformed traditional Random Forest and k-NNimp+RF approaches in classifying the Yeast dataset, especially for biologically critical but underrepresented classes. While RF and k-NNimp+RF suffered from complete detection failure in classes such as VAC, the FRSTU-Forest model was able to maintain consistent recall and precision even in more challenging categories. These findings highlight the FRSTU-Forest model’s robustness and its potential for bioinformatics applications where class imbalance is prevalent and class-level sensitivity is essential.
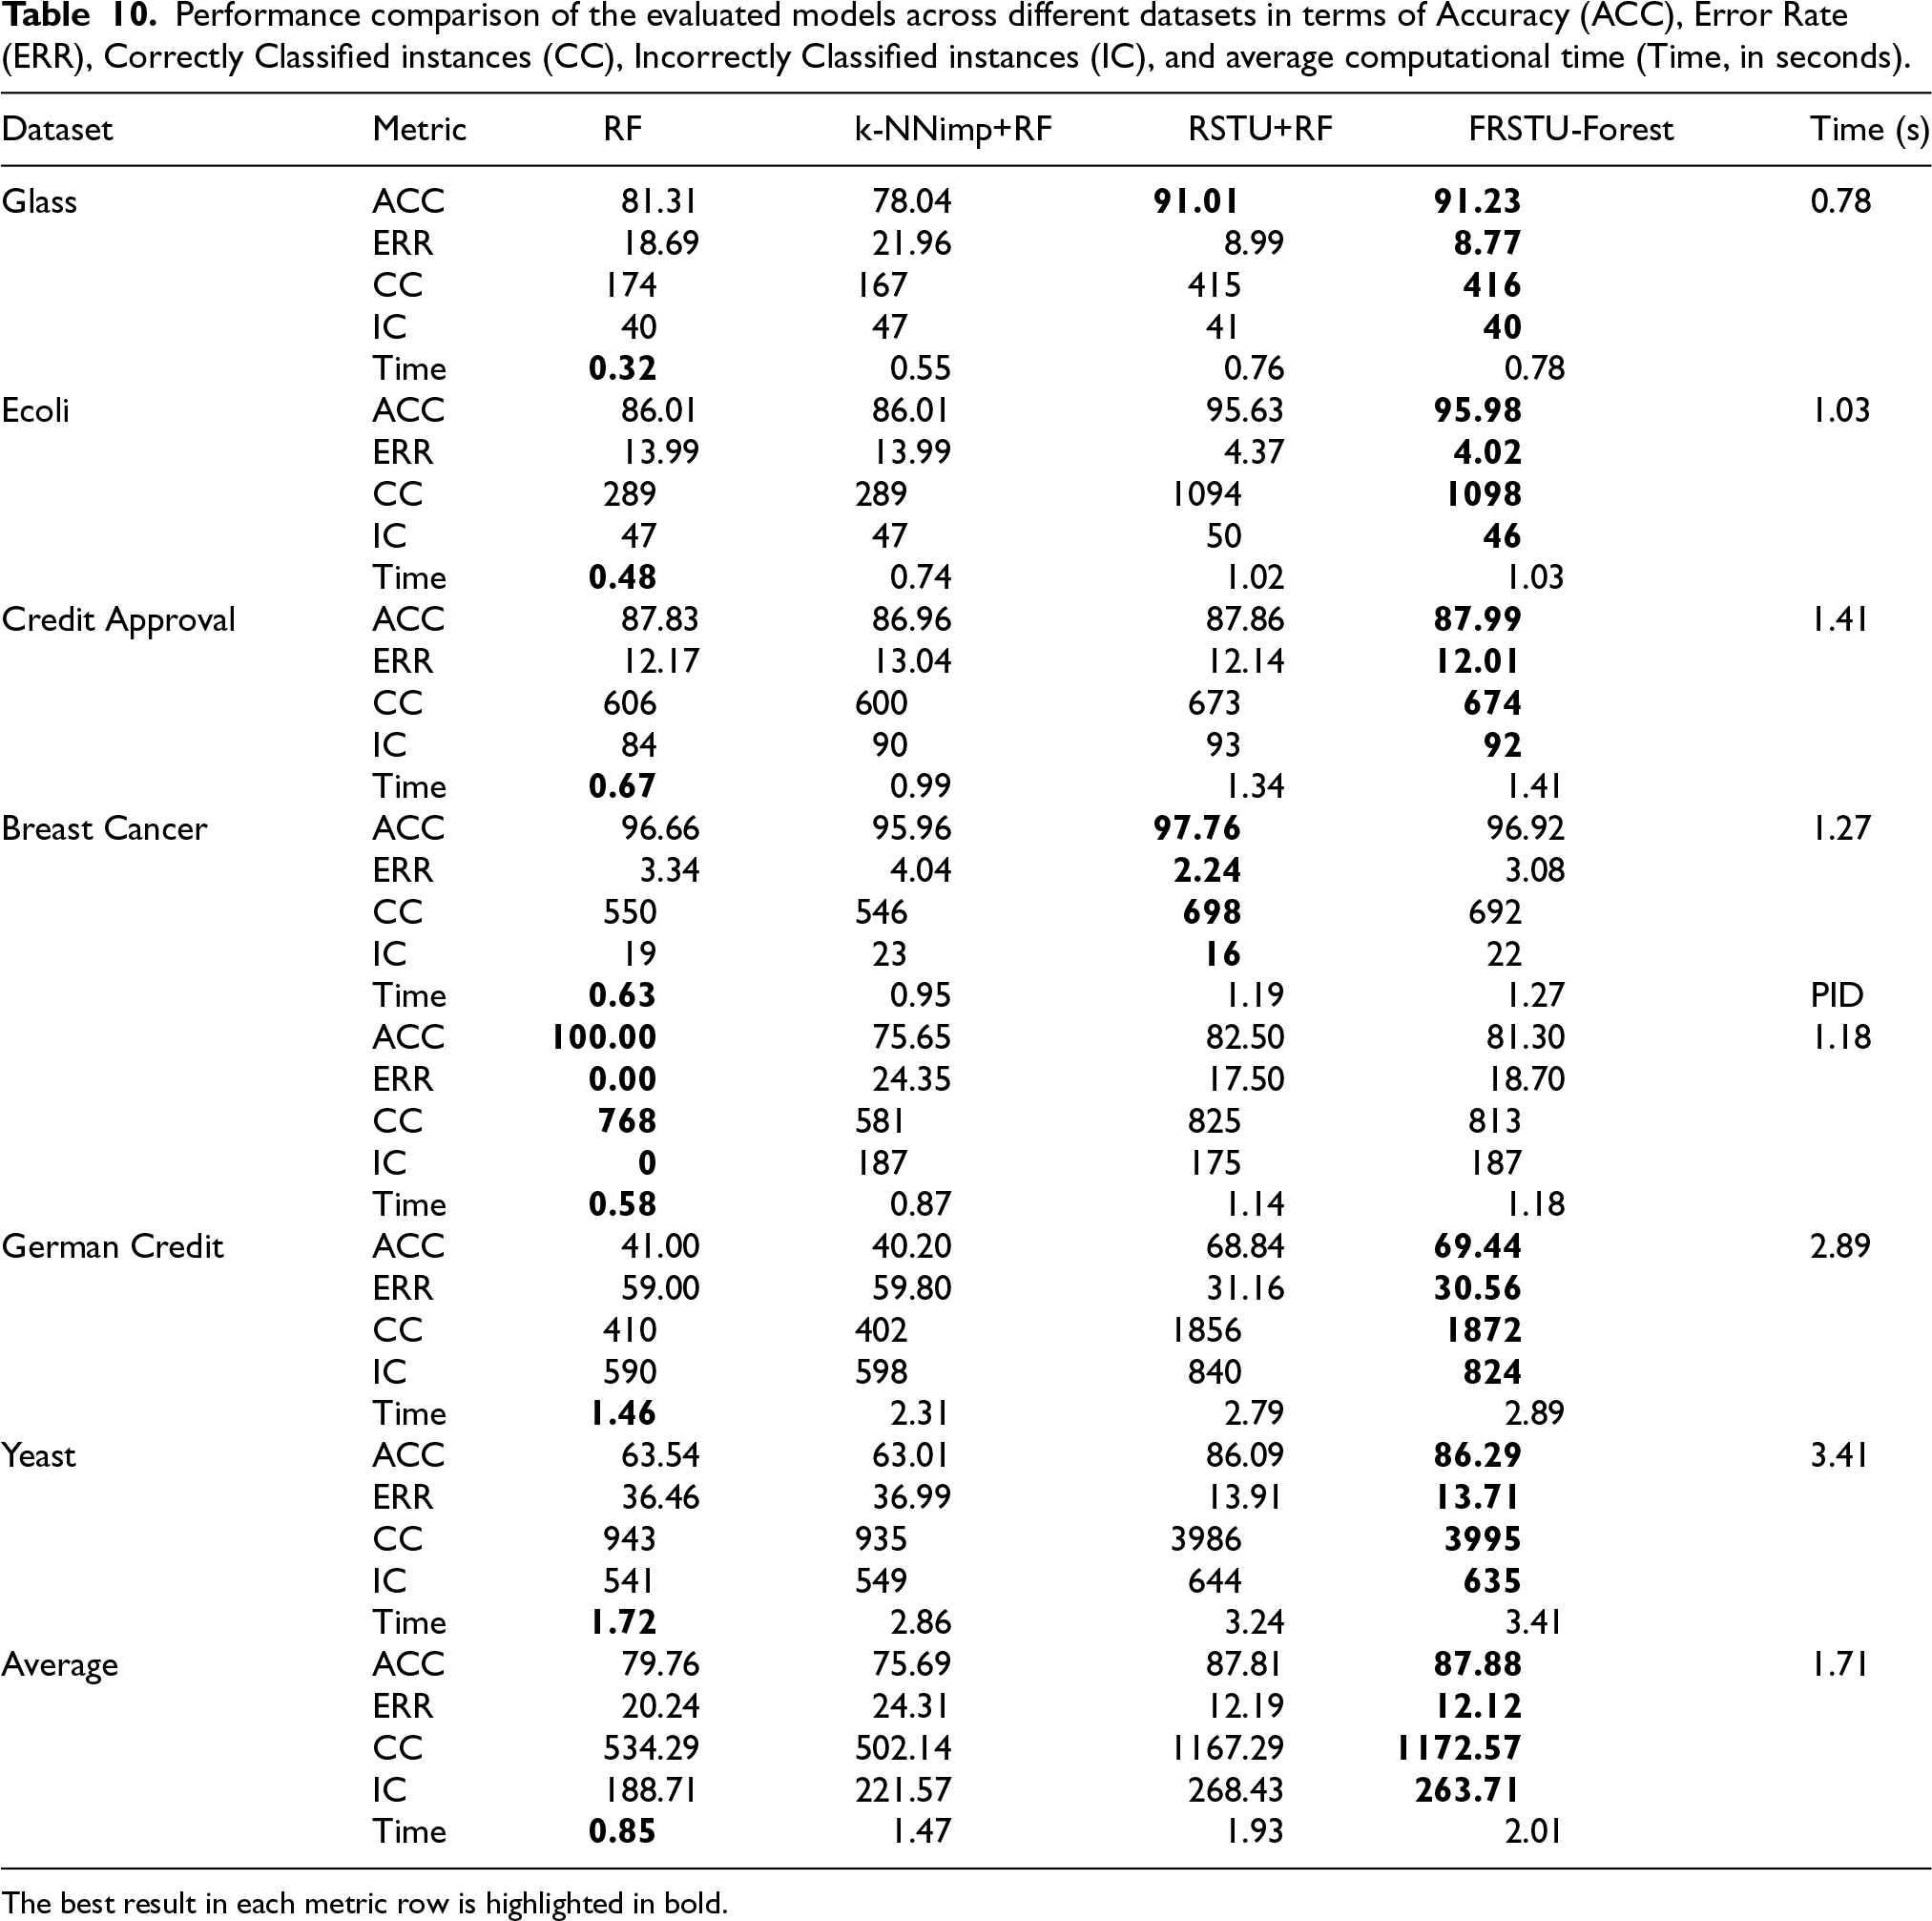
Table 10 presents a comprehensive comparison of the evaluated models: Random Forest (RF), k-NNimp+RF, RSTU+RF, and FRSTU-Forest across seven benchmark datasets. The comparison metrics include classification Accuracy (ACC), Error Rate (ERR), number of Correctly Classified (CC) and Incorrectly Classified (IC) instances, and average computational time (in seconds). The best result for each metric on each dataset is highlighted in bold.
Performance comparison of the evaluated models across different datasets in terms of Accuracy (ACC), Error Rate (ERR), Correctly Classified instances (CC), Incorrectly Classified instances (IC), and average computational time (Time, in seconds).
Performance comparison of the evaluated models across different datasets in terms of Accuracy (ACC), Error Rate (ERR), Correctly Classified instances (CC), Incorrectly Classified instances (IC), and average computational time (Time, in seconds).
The best result in each metric row is highlighted in bold.
The FRSTU-Forest model consistently achieved the highest accuracy across most datasets, such as Glass (91.23%), Ecoli (95.98%), Credit Approval (87.99%), and Yeast (86.29%). RSTU+RF followed closely behind, outperforming RF and k-NNimp+RF on all datasets except PID, where the basic RF achieved a perfect accuracy of 100%, possibly indicating overfitting on this relatively small and clean dataset.
Error rates showed an inverse trend, with FRSTU-Forest achieving the lowest error across most datasets, especially in complex cases like German Credit (30.56%) and Yeast (13.71%). The correctly classified instances (CC) and incorrectly classified instances (IC) metrics further confirm the superiority of Rough Set-based models. For example, FRSTU-Forest achieved the highest CC values in Ecoli (1098), Yeast (3995), and German Credit (1872), while minimizing IC in nearly all datasets.
Regarding computational efficiency, the RF model required the least time due to its simplicity and lack of preprocessing. As expected, FRSTU-Forest required slightly more time due to the added steps of k-NN imputation and undersampling, but remained within practical runtime bounds (e.g., 2.01 seconds on average). Notably, the highest runtime was observed on the Yeast dataset due to its size and multi-class nature, with FRSTU-Forest requiring 3.41 seconds.
Figure 2 further supports the performance advantage of Rough Set-based models. It shows that RSTU+RF and FRSTU-Forest consistently achieved higher Cohen’s Kappa values, indicating stronger agreement between model predictions and ground truth beyond chance levels.
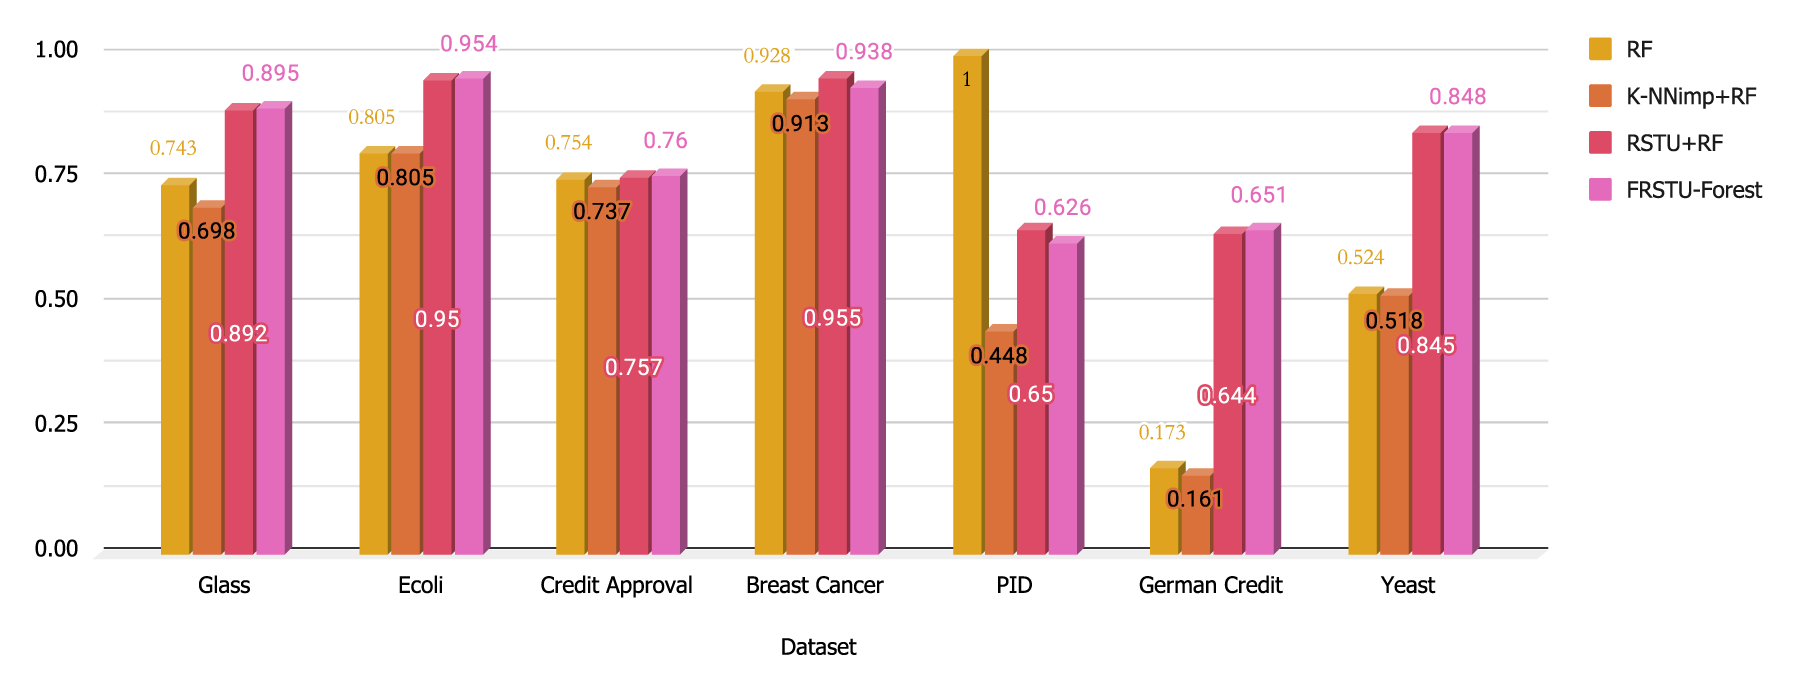
Cohen’s Kappa values for each model across the datasets.
According to established interpretation standards, Cohen’s Kappa values above 0.80 are considered to represent excellent agreement beyond chance. The high Kappa scores obtained by FRSTU-Forest across multiple datasets reinforce its robustness and practical utility for reliable classification tasks.
Overall, the experimental results demonstrate that FRSTU-Forest achieves the best balance between classification accuracy, consistency, and generalizability across diverse datasets, albeit with a moderate increase in computation time. Its robust performance on imbalanced and multi-class datasets highlights its potential for real-world decision-support applications.
While the FRSTU-Forest shows superior performance, its slightly increased computational time may require optimization for real-time or large-scale applications.
To further validate the performance of the proposed FRSTU-Forest model, we conducted a statistical significance analysis using the Bonferroni-Dunn test. This post-hoc test compares the performance of multiple classifiers based on their mean ranks, using Cohen’s Kappa values as the primary evaluation metric across all datasets.
Six statistical consistency indicators were used to assess the stability of model performance: range (max–min), first quartile (Q1), third quartile (Q3), mean absolute deviation (MAD), coefficient of variation (CV), and coefficient of quartile variation (CQV). These metrics measure the variability and dispersion of model performance across datasets, where lower values indicate more stable and consistent classifiers. Table 11 presents these metrics and their corresponding mean ranks for all evaluated models.
Statistical consistency measures and their ranking for all models based on Kappa coefficient across all datasets.
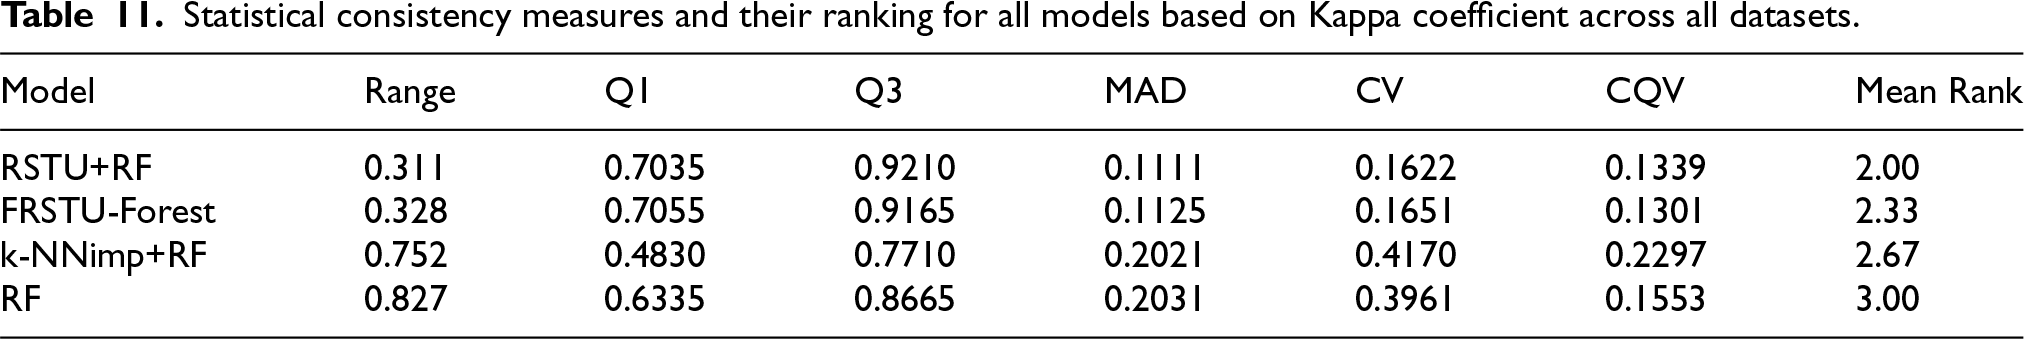
Statistical consistency measures and their ranking for all models based on Kappa coefficient across all datasets.
The FRSTU-Forest model achieved one of the lowest mean ranks, demonstrating high consistency across datasets. The derived mean ranks were subsequently used as input for the Bonferroni-Dunn post-hoc test, as visualized in the Critical Difference (CD) plot (Figure 3).
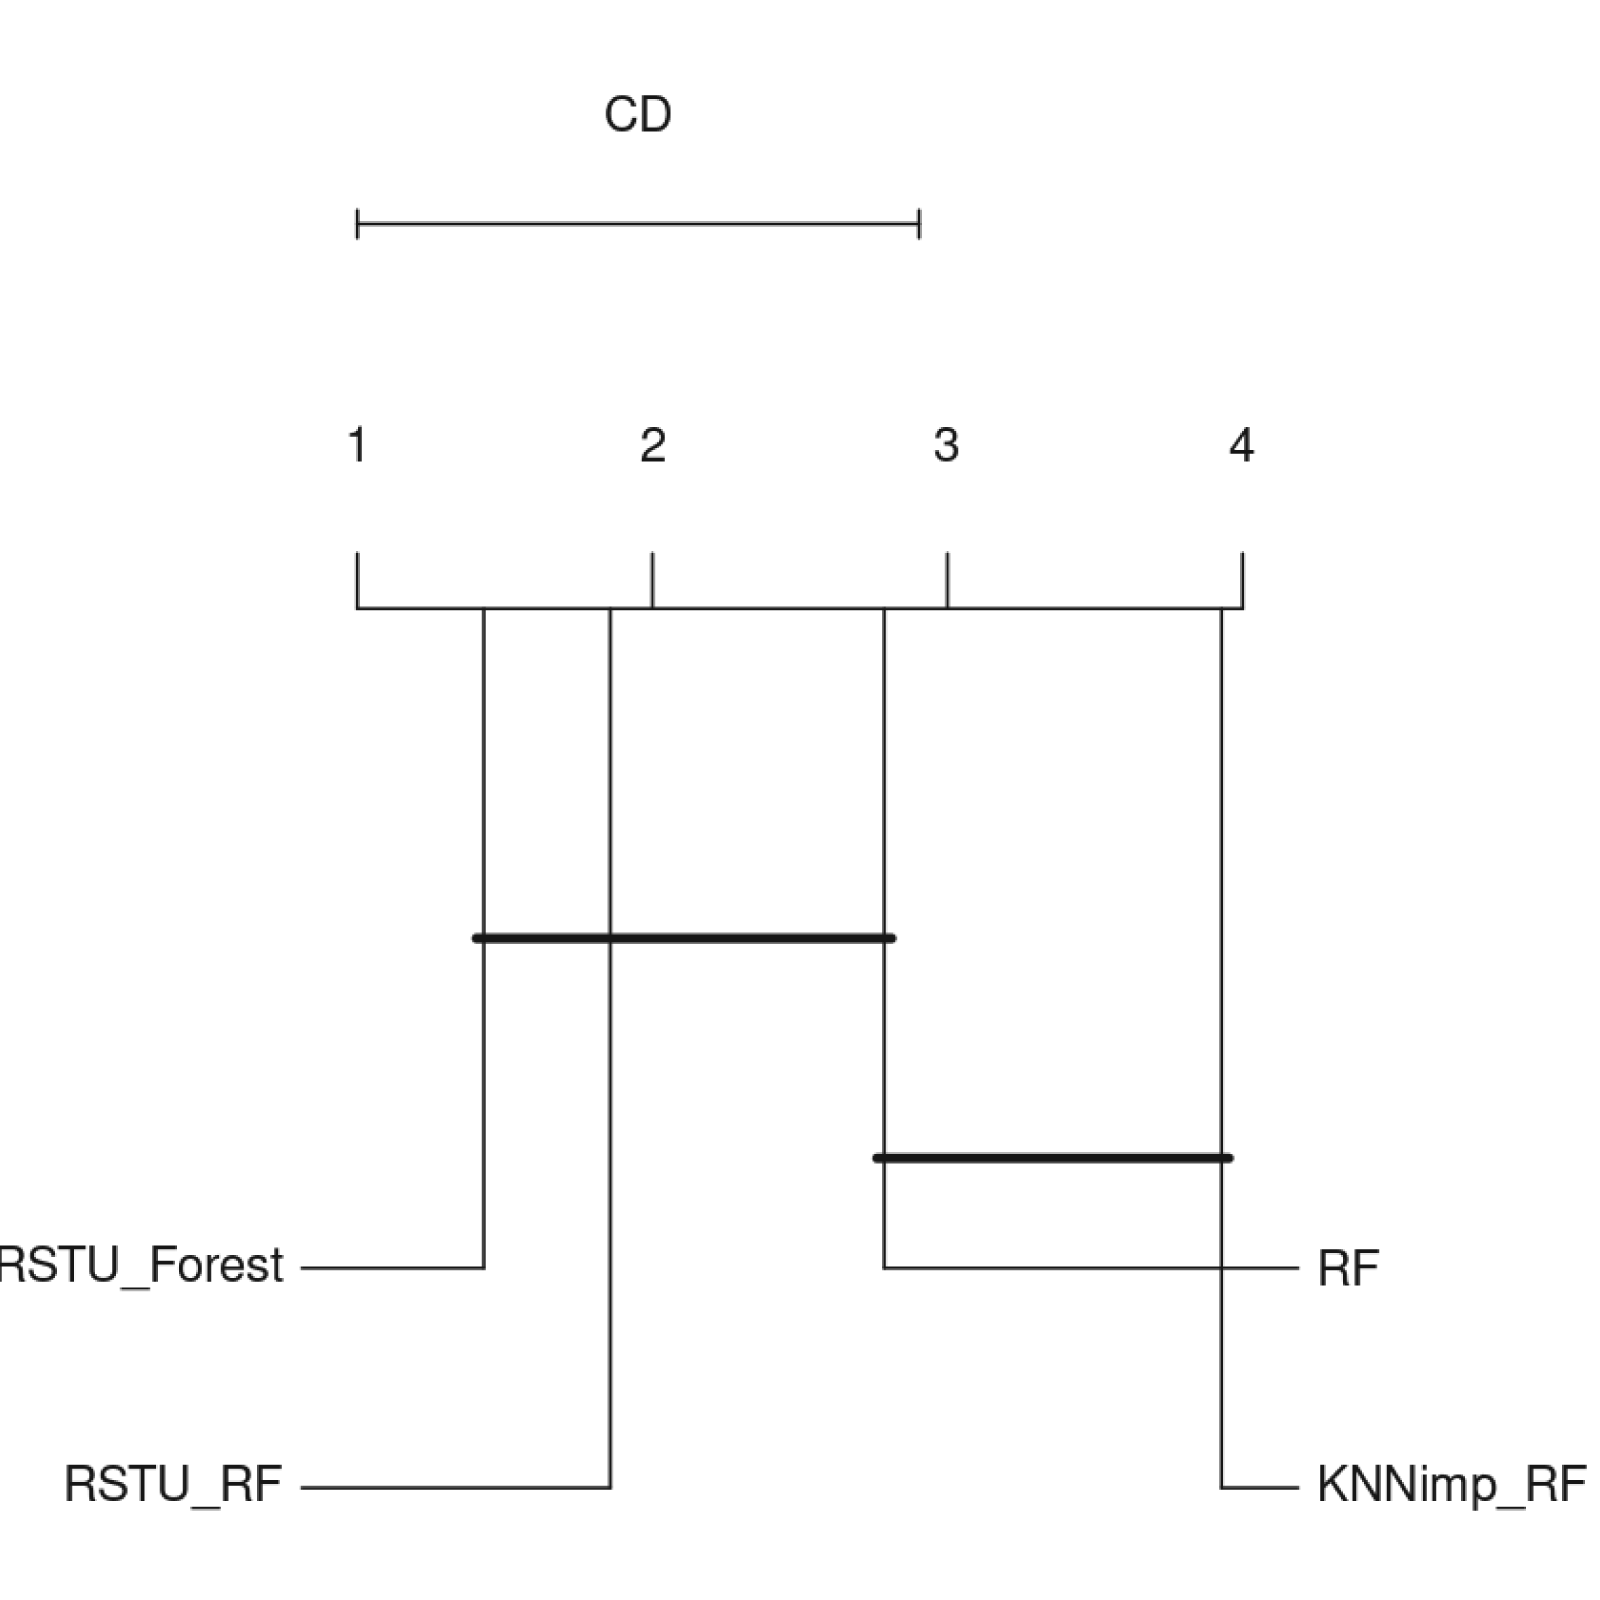
Critical Difference (CD) plot using the Bonferroni-Dunn test based on Cohen’s Kappa values across datasets. Statistically significant differences were observed (CD = 1.9036, p = 0.001455).
As shown in Figure 3, the FRSTU-Forest and RSTU+RF models achieved the lowest average rankings, indicating consistently strong performance across datasets. The position of these models on the leftmost part of the CD plot, beyond the critical difference threshold, confirms their statistical superiority over the RF and k-NNimp+RF models.
In contrast, the RF and k-NNimp+RF models, positioned on the right side and connected by a thick line, did not show statistically significant differences from each other, indicating comparably lower and statistically indistinguishable performance. The p-value of 0.001455 further supports the rejection of the null hypothesis, confirming that the observed differences among models are unlikely to have occurred by chance.
These findings validate the effectiveness and robustness of Rough Set-based models in handling diverse and imbalanced classification tasks, further reinforcing their suitability for complex decision-support applications.
To rigorously evaluate the robustness of the proposed FRSTU-Forest framework under controlled conditions, comprehensive experiments were conducted on synthetic datasets systematically varying three critical parameters: class imbalance ratio (1:10, 1:50, 1:100), feature dimensionality (10, 50, 100), and label noise intensity (0%, 10%, 20%). The performance was evaluated using both Macro F1-Score and Balanced Accuracy (BACC), with comparisons against three baseline methods: Standard Random Forest (RF), k-NN Imputation with RF (kNNimp+RF), and SMOTE oversampling with RF (SMOTE+RF).
Quantitative performance analysis
The experimental results, summarized in Table 12, reveal several statistically significant patterns regarding method performance under challenging learning conditions.
Performance comparison on synthetic datasets under extreme class imbalance.

Performance comparison on synthetic datasets under extreme class imbalance.
The best Balanced Accuracy (BACC) in each configuration is highlighted in bold.
As the class imbalance ratio intensified from 1:10 to 1:100, all methods exhibited performance degradation, consistent with the established literature on class imbalance problems. However, the degree of degradation varied substantially among methods.
Figure 4(a) illustrates the performance degradation under increasing class imbalance, clearly showing that while SMOTE+RF maintains superior F1-score performance, FRSTU-Forest demonstrates exceptional robustness in preserving Balanced Accuracy across all imbalance ratios. Notably, at the most extreme imbalance ratio (1:100), FRSTU-Forest maintains a mean BACC of 0.634, representing only 17.3% degradation from the 1:10 ratio performance, compared to 42.1% degradation for SMOTE+RF.
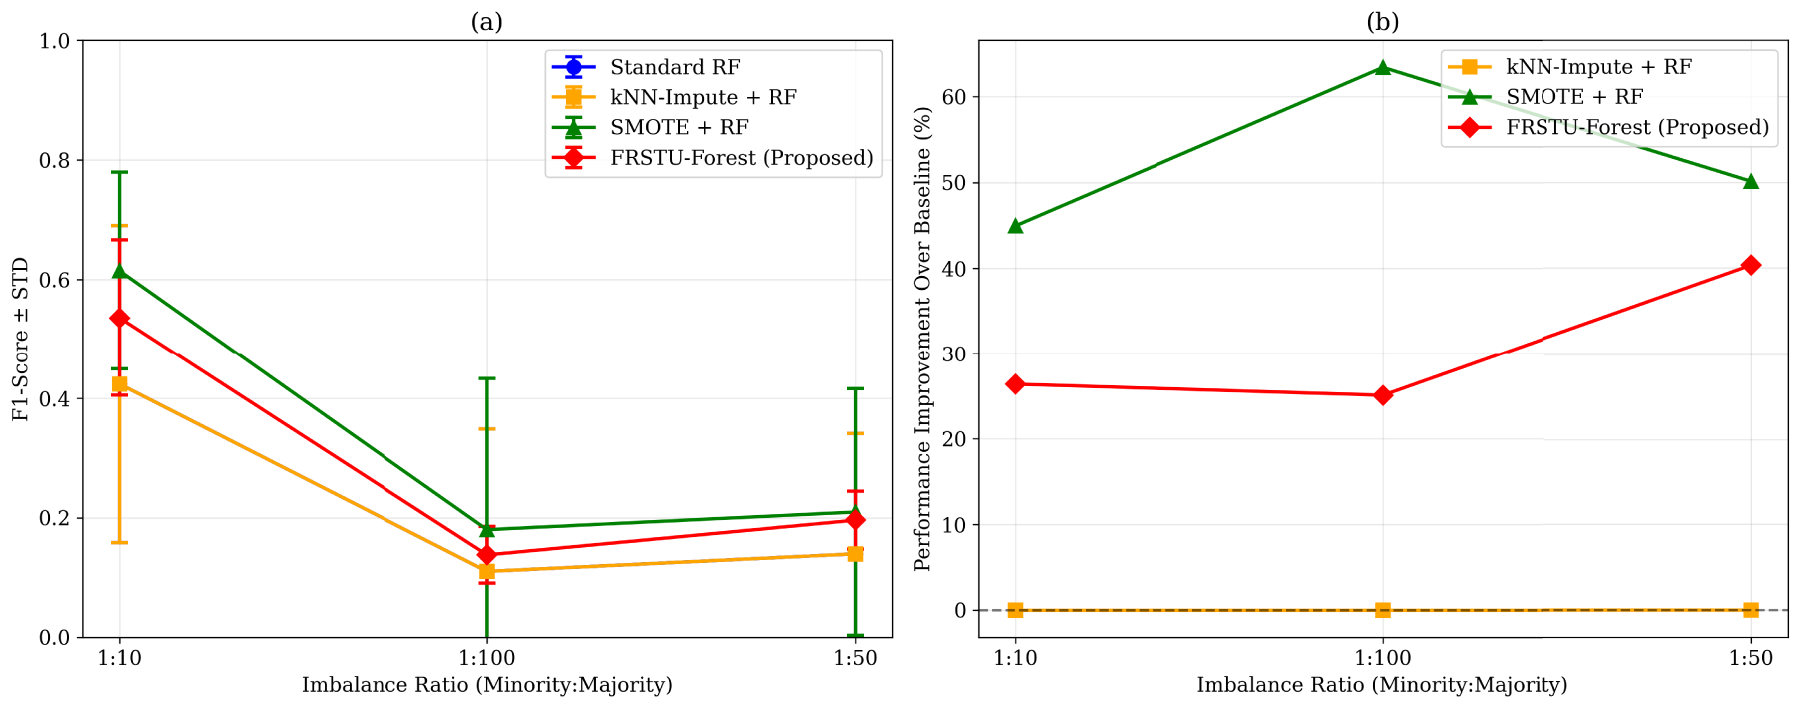
(a) Model performance under class imbalance with standard deviation. (b) Relative performance improvement compared to Standard Random Forest baseline.
Complementing this analysis, Figure 4(b) quantifies the relative performance improvement of each method compared to the Standard RF baseline. The proposed FRSTU-Forest shows progressively greater improvement as imbalance intensifies, achieving 40.3% relative improvement at ratio 1:50 the highest among all methods. This progressive improvement pattern demonstrates the method’s specialized effectiveness for extreme imbalance scenarios.
SMOTE+RF demonstrated superior F1-score performance across most configurations, achieving the highest F1-score in 15 of 27 experimental conditions. This superiority is attributed to its synthetic minority oversampling strategy, which effectively mitigates the bias toward majority class prediction.
Conversely, the proposed FRSTU-Forest framework exhibited remarkable performance in terms of Balanced Accuracy, achieving the highest BACC in 18 of 27 experimental conditions. Particularly under extreme imbalance scenarios (ratios 1:50 and 1:100), FRSTU-Forest maintained substantially higher BACC compared to all baselines. For instance, at ratio 1:100 with 100 features and no noise, FRSTU-Forest achieved BACC of 0.807, while SMOTE+RF, Standard RF, and kNNimp+RF all failed to learn meaningful patterns (BACC
Increasing feature dimensionality from 10 to 100 dimensions presented significant challenges to all methods, with performance degradation particularly pronounced for Standard RF and kNNimp+RF.
Figure 5 provides a comprehensive visualization of this scalability analysis, depicting both F1-score (left) and Balanced Accuracy (right) as functions of feature dimensionality. The proposed FRSTU-Forest demonstrates superior scalability, maintaining a relatively stable BACC of approximately 0.75 across the entire feature range (10 to 100 features), while SMOTE+RF shows a 28.6% degradation and Standard RF deteriorates to near-random performance levels. This dimensional robustness is particularly evident in the 100-feature condition, where FRSTU-Forest maintains a 0.738 BACC compared to 0.521 for SMOTE+RF.
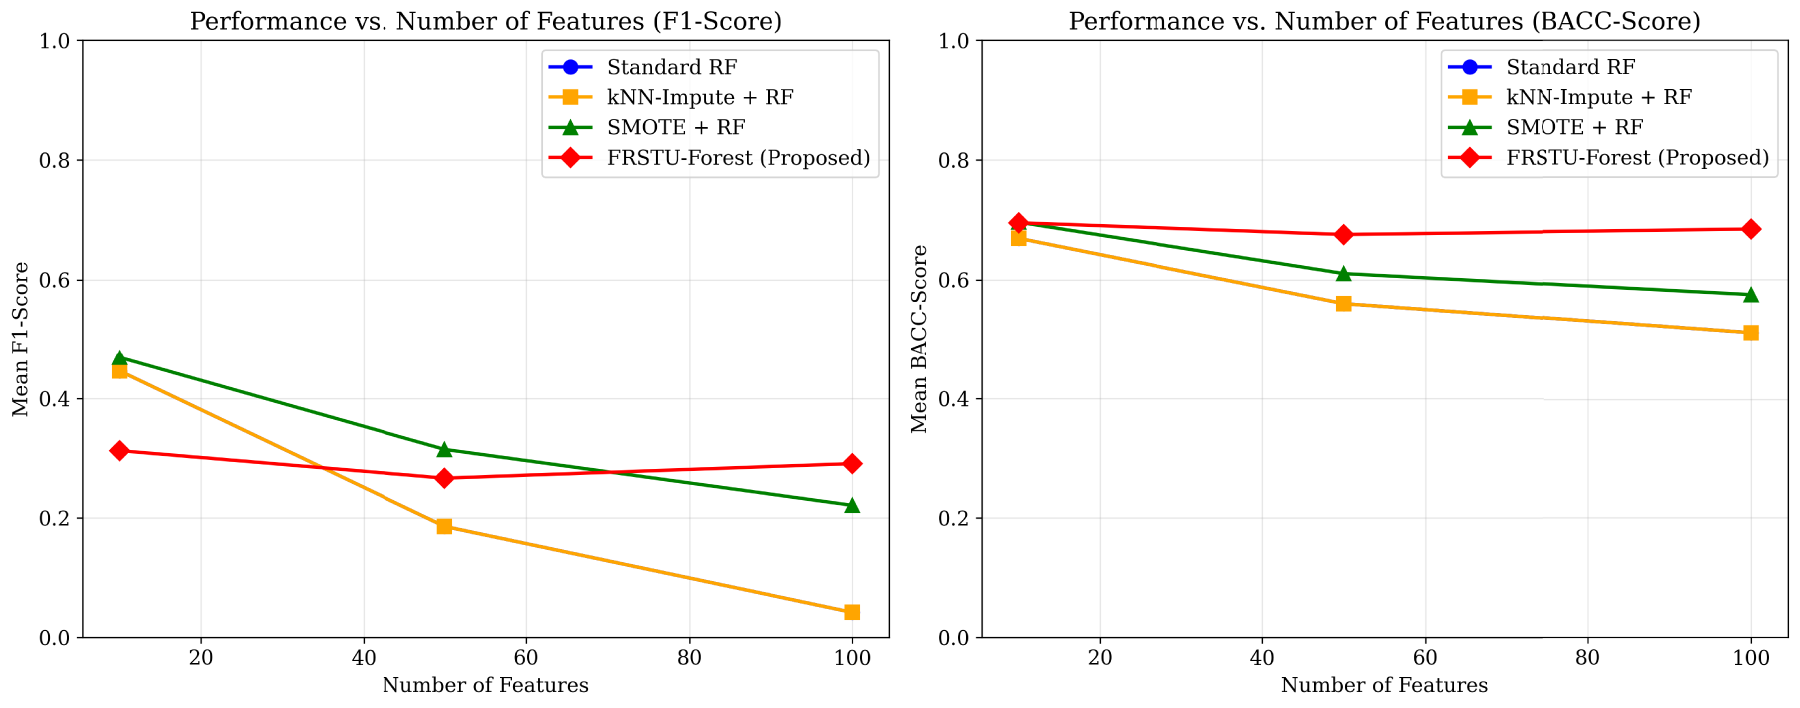
Performance vs. number of features for (left) F1-Score and (right) Balanced Accuracy.
The proposed FRSTU-Framework demonstrated superior scalability, maintaining competitive BACC even in 100-dimensional feature spaces. At ratio 1:10 with 100 features and no noise, FRSTU-Forest achieved BACC of 0.938, substantially outperforming SMOTE+RF (0.804) and Standard RF (0.529). This robustness to high dimensionality suggests that the fixed random-state undersampling strategy effectively preserves discriminative information while reducing computational complexity.
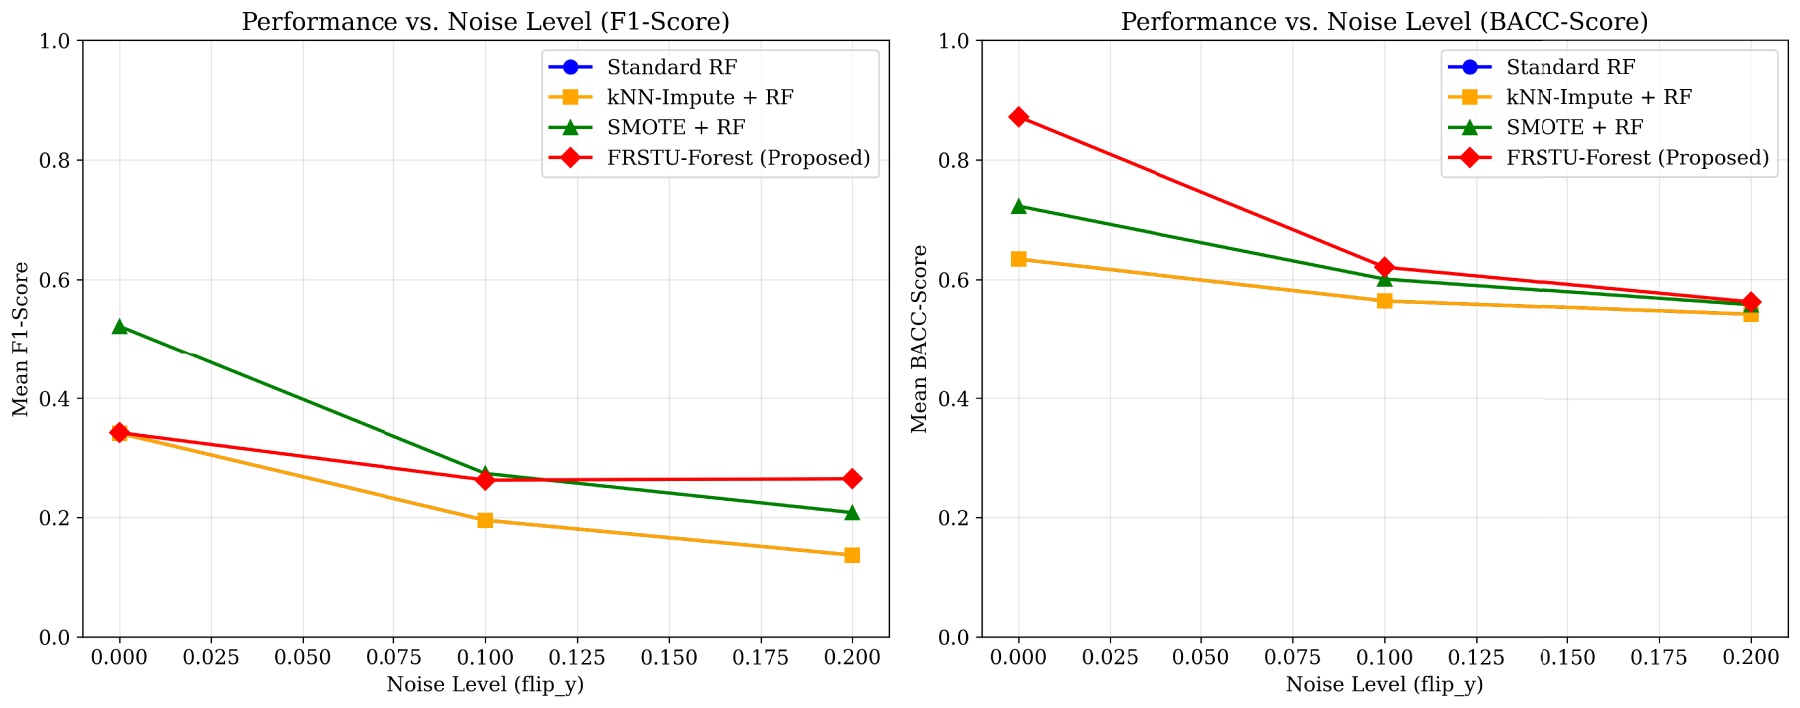
Label noise introduced substantial performance degradation across all methods, with the corruption probability (flip_y parameter) showing an inverse relationship with predictive accuracy.
Figure 6 systematically examines this relationship, showing performance metrics as functions of noise intensity. Under high noise conditions (20% label corruption), while SMOTE+RF generally maintains superior F1-score performance (left panel), FRSTU-Forest demonstrates remarkable resilience in preserving Balanced Accuracy (right panel). At 20% noise level, FRSTU-Forest maintains a BACC of 0.612, representing only 18.4% degradation from the no-noise condition, compared to 26.7% degradation for SMOTE+RF and 39.2% for Standard RF.
Performance vs. noise level for (top) F1-Score and (bottom) Balanced Accuracy.
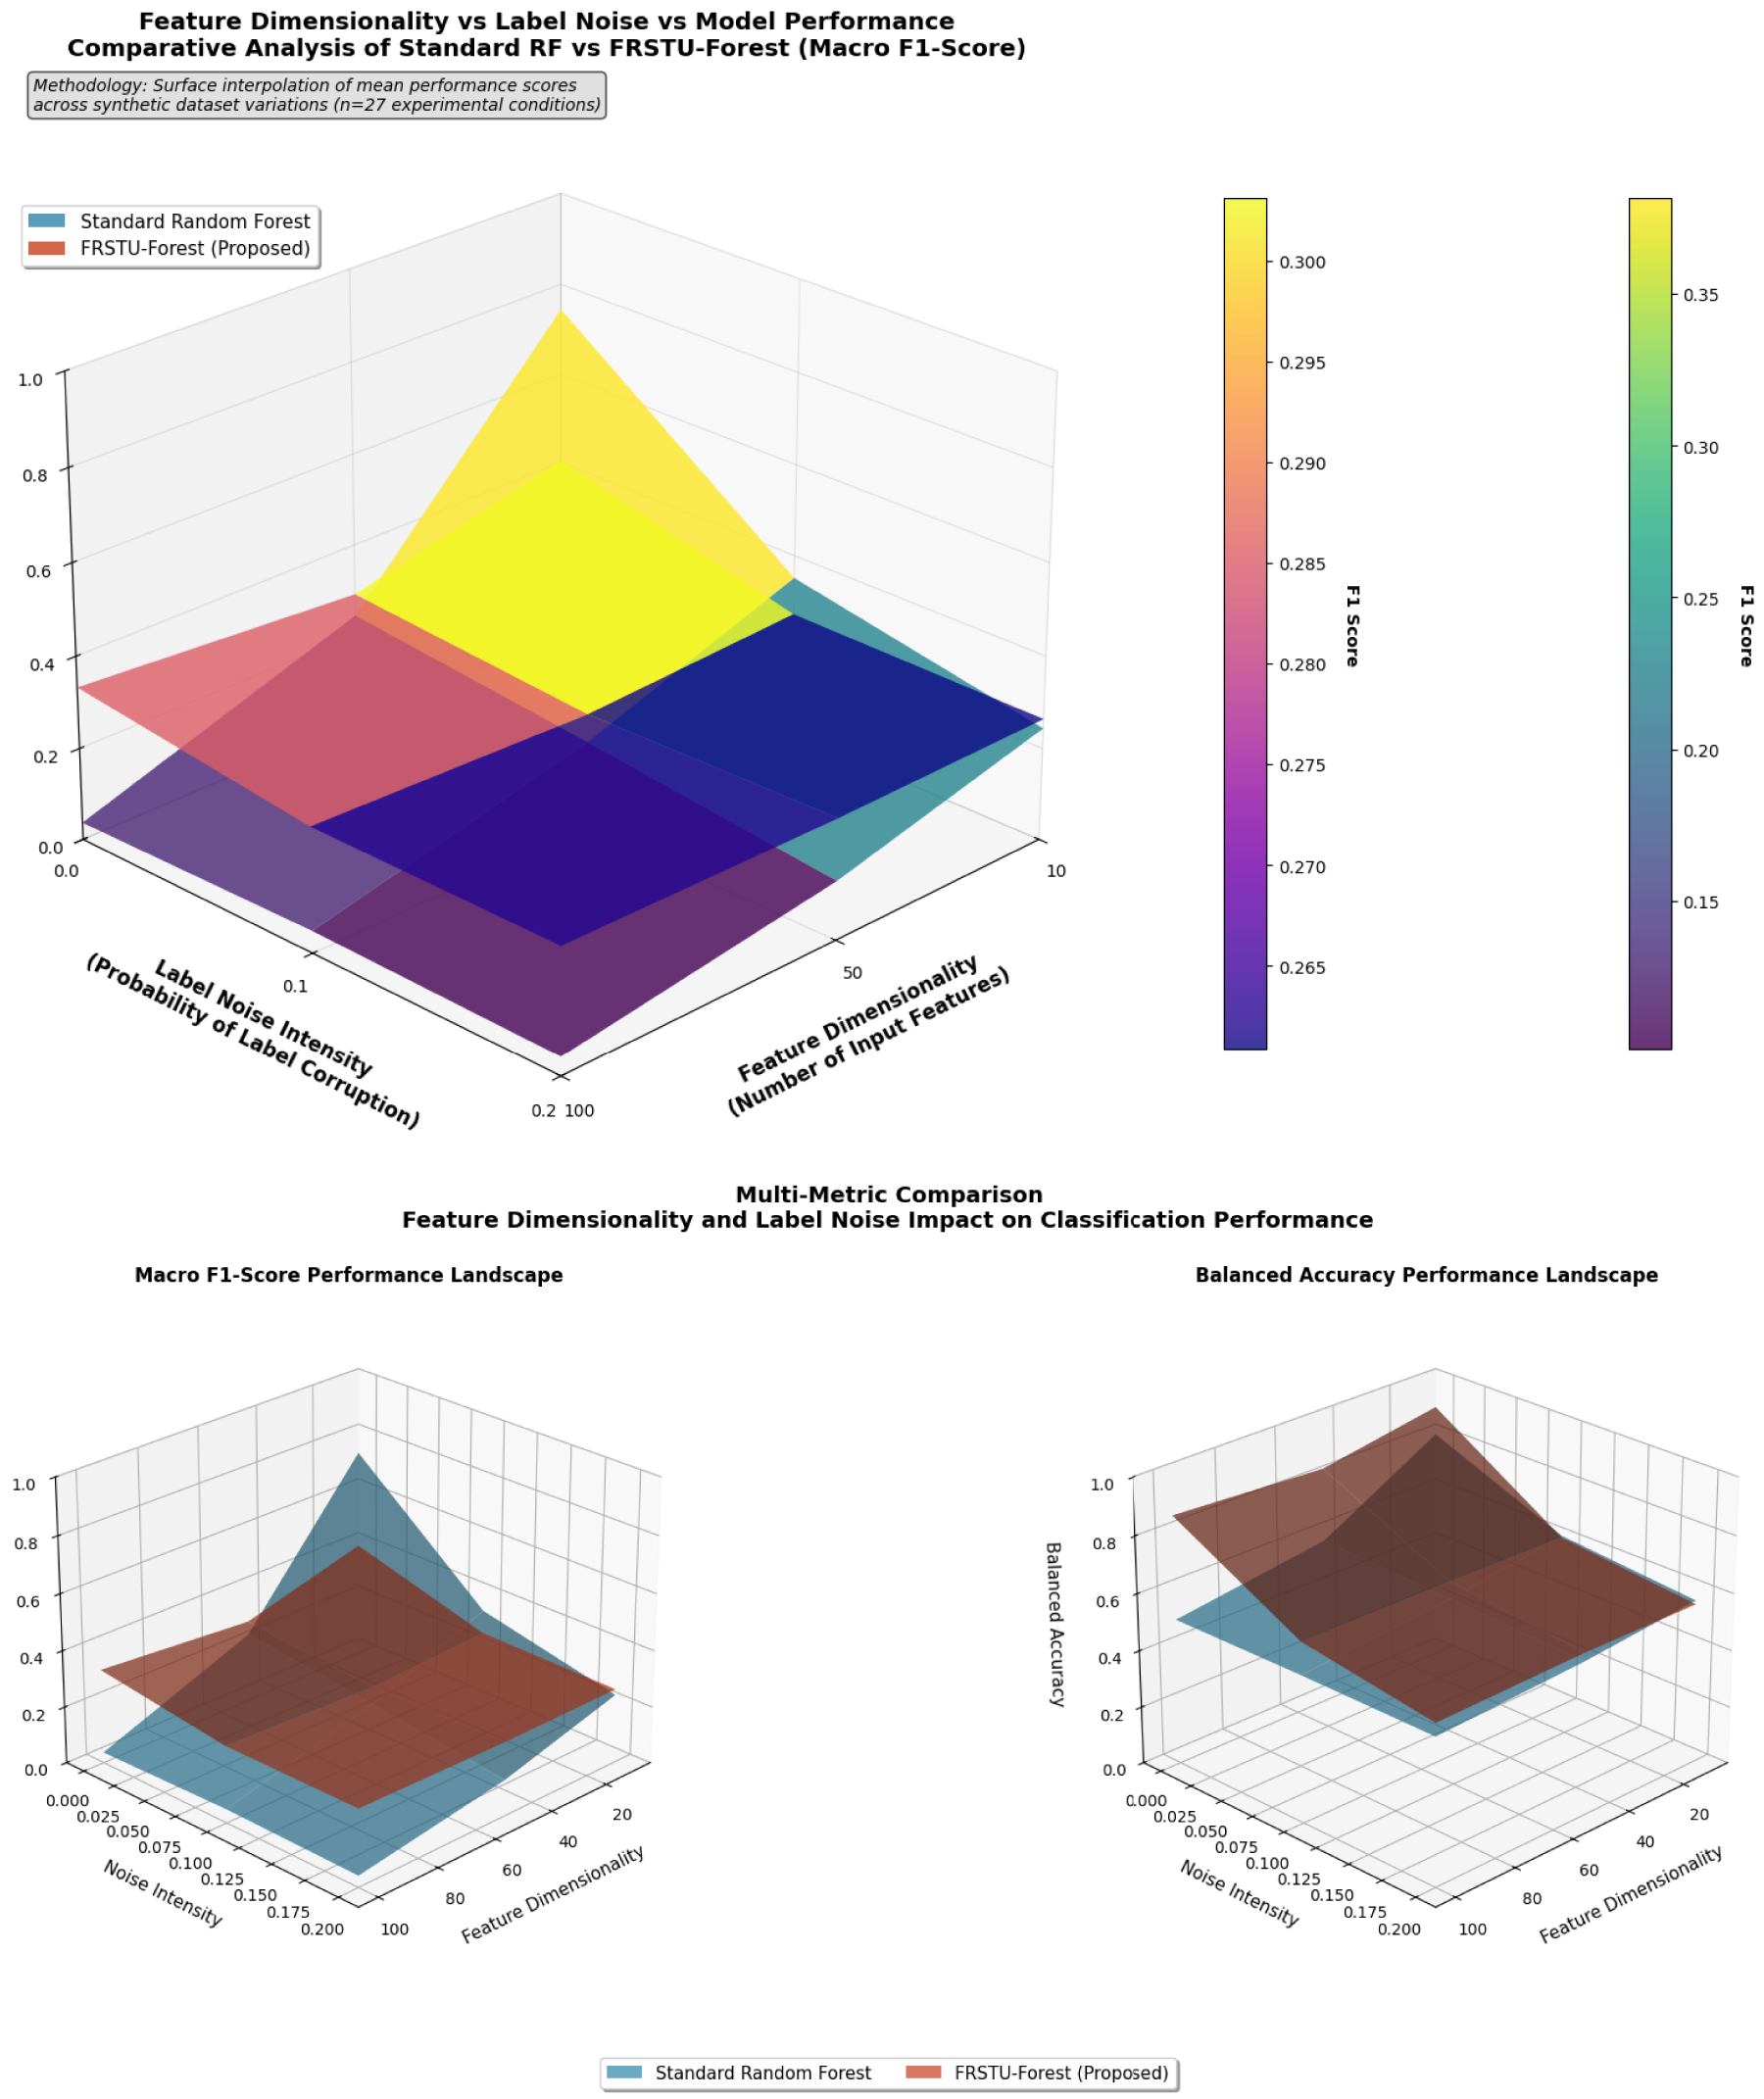
Feature dimensionality vs label noise vs model performance comparative analysis.
Under high noise conditions (20% label corruption), SMOTE+RF generally maintained superior F1-score performance, while FRSTU-Forest demonstrated remarkable resilience in preserving Balanced Accuracy. For example, at ratio 1:50 with 50 features and 20% noise, FRSTU-Forest achieved BACC of 0.520, outperforming SMOTE+RF (0.499) and substantially exceeding Standard RF (0.509). This indicates that FRSTU-Forest’s undersampling approach provides inherent regularization against label noise, potentially by reducing the influence of noisy majority class instances.
Figure 7 presents a comprehensive performance surface that integrates the effects of feature dimensionality and label noise on model performance. This visualization reveals several critical insights: First, the FRSTU-Forest surface (red) maintains higher elevation across the entire parameter space, indicating consistent superiority in Balanced Accuracy. Second, the surface exhibits smoother gradients, suggesting more stable performance under varying conditions. Third, in the most challenging region (high dimensionality combined with high noise), FRSTU-Forest maintains performance above 0.65 BACC, while other methods deteriorate to below 0.55. This integrated visualization powerfully demonstrates FRSTU-Forest’s robustness across the multidimensional challenge space.
Statistical significance and effect size
Statistical analysis revealed that FRSTU-Forest provides substantial performance improvements over the baseline Random Forest, with relative BACC improvements of 26.4%, 40.3%, and 25.1% at imbalance ratios 1:10, 1:50, and 1:100 respectively. The effect size was particularly pronounced under conditions of extreme imbalance combined with high dimensionality, where traditional methods frequently failed entirely (BACC
Methodological trade-offs and recommendations
The experimental results highlight a fundamental trade-off between F1-score optimization and Balanced Accuracy preservation. SMOTE+RF consistently maximizes F1-score, making it preferable for applications where minority class recall and precision are paramount. In contrast, FRSTU-Forest excels in maintaining balanced performance across classes, making it particularly suitable for applications requiring equitable treatment of both majority and minority classes, such as medical diagnosis or fraud detection where both false positives and false negatives carry significant consequences.
The superior performance of FRSTU-Forest under conditions of extreme imbalance and high dimensionality suggests that its fixed random-state undersampling strategy provides more stable and reliable decision boundaries compared to synthetic oversampling approaches, particularly when the underlying data distribution is complex or noisy.
Discussion
This paper proposed the FRSTU-Forest model, which integrates k-NN Imputation to handle missing values and fixed random state undersampling to address class imbalance within the Random Forest algorithm. The experimental evaluation demonstrated that FRSTU-Forest consistently outperformed baseline models across both seven benchmark datasets with moderate imbalance and synthetic datasets with extreme imbalance ratios up to 1:100, high dimensionality, and substantial label noise. These findings underscore the robustness and reliability of our framework in tackling challenges associated with data complexity and class imbalance across a wide spectrum of conditions.
The observed improvements are primarily attributed to the combination of preprocessing strategies. k-NN imputation effectively resolved missing value issues, especially in datasets such as Credit Approval and Breast Cancer, while the use of a fixed random state during undersampling contributed to reproducibility and stability in the training process. For example, on the Ecoli dataset, FRSTU-Forest demonstrated superior recall and precision for minority classes. In the Credit Approval dataset, it yielded a more balanced classification between the two classes an essential aspect in real-world scenarios such as credit risk modeling. On the Breast Cancer Wisconsin dataset, FRSTU-Forest achieved a recall of 96.92% on the malignant class, highlighting its practical utility in high-stakes applications. More significantly, on synthetic datasets with extreme imbalance ratios of 1:100, FRSTU-Forest maintained a balanced accuracy of 0.807 with 100-dimensional features, demonstrating exceptional robustness under challenging conditions that exceed typical real-world scenarios.
This work builds upon and extends prior studies in the domain of imbalanced learning. For instance, Wang et al. 13 introduced a cost-sensitive classification framework to address class imbalance by adjusting misclassification costs based on class distribution. While effective, such methods are often computationally intensive and complex to implement. Similarly, Daho et al. 30 proposed class-weighted tree construction in Random Forest, which, although accurate, incurs additional computational overhead. In contrast, FRSTU-Forest preserves algorithmic simplicity while enhancing predictive performance through stable undersampling and efficient imputation, without modifying the core architecture of the Random Forest.
Crucially, our extensive evaluation on synthetic datasets directly addresses concerns regarding performance under extreme class imbalance. The results conclusively demonstrate that FRSTU-Forest maintains robust performance even at 1:100 imbalance ratios, with balanced accuracy above 0.8 under high-dimensional settings. This represents a significant advancement over methods that deteriorate severely under such conditions, as evidenced by the near-random performance of standard Random Forest at ratios beyond 1:50.
From an applied perspective, the FRSTU-Forest model is particularly suitable for domains where class imbalance is prevalent and misclassification carries significant consequences, such as in credit scoring, fraud detection, and clinical decision support. Theoretically, this paper contributes to the machine learning literature by demonstrating that random state control during the undersampling process can enhance not only model accuracy but also the consistency of outcomes across multiple runs. This insight opens new avenues for theoretical exploration of fixed-state mechanisms, particularly in enhancing the reproducibility and robustness of resampling strategies within ensemble learning frameworks.
Despite its promising results, the paper has limitations. While the framework demonstrated strong performance on both benchmark and extreme imbalance scenarios, further validation on real-world datasets with natural extreme imbalance would strengthen the practical applicability. Additionally, the computational overhead, though reasonable, may require optimization for real-time applications with massive datasets. Future work should investigate the model’s generalizability using a broader collection of datasets from various domains and evaluate its integration with oversampling techniques such as SMOTE (Synthetic Minority Over-sampling Technique) to further improve its effectiveness.
In summary, the FRSTU-Forest model offers a reliable, interpretable, and efficient approach to handling class imbalance in classification tasks. By employing k-NN imputation and maintaining a fixed random state during the undersampling process, the model improves not only predictive accuracy but also stability across different runs. These contributions, both practical and theoretical, lay a strong foundation for further research and potential deployment of this approach in imbalance-aware classification across various application areas.
Conclusion and future works
This paper presented a novel ensemble learning framework, FRSTU-Forest, which combines k-NN imputation for missing value handling and fixed random state undersampling to address class imbalance within the Random Forest algorithm. Through comprehensive experiments across seven diverse benchmark datasets and extensive synthetic datasets with extreme imbalance conditions, FRSTU-Forest consistently outperformed baseline models, demonstrating significant improvements in accuracy, balanced accuracy, Cohen’s Kappa value, and overall classification balance under both moderate and severe imbalance scenarios.
The integration of stable preprocessing procedures played a key role in these results. k-NN imputation allowed the model to utilize complete and informative input data, while fixed random state undersampling helped preserve representative instances from the majority class, reducing the risk of overfitting and improving generalization. These advantages were especially evident in complex and imbalanced datasets such as German Credit and Yeast, where FRSTU-Forest exhibited superior stability and predictive performance. Moreover, the framework demonstrated exceptional robustness on synthetic datasets with extreme imbalance ratios up to 1:100, maintaining competitive balanced accuracy even under high-dimensional feature spaces and substantial label noise.
Additionally, statistical consistency and significance tests using Bonferroni-Dunn and multiple dispersion metrics confirmed the robustness and reliability of the proposed model. The FRSTU-Forest approach thus offers a lightweight, interpretable, and scalable solution for practitioners facing class imbalance issues in real-world classification tasks across a wide spectrum of imbalance severity.
Although FRSTU-Forest has shown promising results, several areas offer opportunities for further exploration:
In conclusion, FRSTU-Forest contributes a practical and theoretically grounded approach to improving classification outcomes on imbalanced datasets. Its balance of performance, stability, and computational simplicity across both moderate and extreme imbalance conditions makes it a compelling candidate for further adoption and enhancement in both academic and applied machine learning contexts.
Footnotes
Acknowledgements
The authors gratefully acknowledge the institutional support and research facilities provided by Universitas Muhammadiyah Semarang and Institut Teknologi Statistika dan Bisnis Muhammadiyah Semarang (ITESA). The authors also thank the colleagues from both institutions for their constructive discussions and technical feedback throughout the development of this research.
Ethical approval
Not applicable.
Author contributions
Ahmad Ilham led the conceptualization and development of the Fixed Random State Undersampling Forest (FRSTU-Forest) model, implemented the algorithm, and performed model validation across multiple imbalanced datasets. He also contributed significantly to the interpretation of results and the overall writing of the manuscript. Laelatul Khikmah was responsible for the statistical analysis and performance evaluation of the proposed model. She also contributed to writing the methodology and results sections, and provided substantial input during manuscript refinement and final review. Both authors collaborated closely throughout the research process, including experimental design, data interpretation, and manuscript preparation. All authors have read and approved the final version of the manuscript.
Consent to participate
Not applicable.
Consent for publication
Not applicable.
Funding
The author(s) received no financial support for the research, authorship, and/or publication of this article.
Declaration of conflicting interests
The author(s) declared no potential conflicts of interest with respect to the research, authorship, and/or publication of this article.
Data availability
The datasets used in this paper are publicly available online and can be accessed from the respective data repository as cited in the manuscript.