
Abstract
To check the accuracy and consistency of the data collected through the survey, two concepts are used: measurement error and reliability ratio. The existing methods, when interval data is recorded under uncertainty, to calculate the measurement error and reliability ratio using classical statistics and the approach based on mid-values of the intervals, cannot be applied appropriately. To overcome these issues in the existing method, this paper presents a novel method to handle interval-valued data while calculating measurement error, descriptive statistics, and the reliability ratio. The proposed method for analyzing interval data considers the degree of uncertainty when evaluating interval-valued responses, which is ignored by the existing methods. A simulated dataset from a questionnaire about the knowledge and use of artificial intelligence tools is used to calculate the measurement error and the reliability ratio. The results show that the outcomes from the proposed method and the existing methods are quite different, and the proposed method is more flexible, informative, and suitable for applying to survey data analysis when recorded under uncertainty.
Introduction
The surveys are conducted to collect information directly from the people living in a certain region. The questionnaires are designed in such a way that the respondents can easily understand the questions and select the suitable response from the given options. Surveys are helpful to get information from the people and to understand their behavior and the real problems they face. During the survey, analyzing the collected data helps identify patterns, trends, or preferences that are shared among participants, as well as between the groups under study. The results of the data collected through the survey help the organizations and government to make policies for the future or to update previous policies. As the sampling method is applied for the collection of the data, therefore, there is no need to study all individuals, and selected people are chosen to collect the data, which makes the survey cost-effective. 1 studied the problems in the estimation and presented the detailed work on the interpretation of the reliability of the data obtained from the survey. 2 presented a detailed study about the measurement error in the surveys. 3 studied the measurement error and sources in household surveys. 4 studied the methods of estimation of measurement error in surveys. 5 studied the measurement error in the earnings data. 6 presented the study using the interval-valued responses. 7 presented the work on measurement error and reliability in medicine studies. 8 studied the factors which leads for the measurement error in the surveys. 9 studied the measurement error using German's longitudinal earnings data. 10 studied the exposure the measurement error in surveys related to modern epidemiology. 11 presented the work on the study of public opinion toward artificial intelligence (AI). More details about the knowledge and use of AI can be seen in 12 and. 13 More information can be seen in14,15 and. 16
The generalized interval-valued method is used to analyze the imprecise and interval-valued data by considering the degree of uncertainty which is ignored in the existing interval-valued method. 17 The generalized interval-valued methods are an extension of classical statistics and interval-valued methods. The classical statistics cannot be applied when the data is in intervals and the interval-valued methods do not consider the degree of uncertainty even when the data is collected under uncertainty. The use of the existing interval-valued methods by ignoring the degree of uncertainty in the data analysis may mislead the decision-makers.18,19 worked on the methods to analyze the engineering data using the generalized-interval methods. 20 provided several examples to show that the generalized interval-valued method is an extension of the interval-valued method. 21 applied the generalized interval-valued method in the social sciences.
From the review of the literature on survey sampling, it can be seen that there is a rich literature on the methods of measurement error and the reliability ratio. By exploring the literature and according to the best of the authors’ knowledge, there is no work on the calculations of the measurement error and reliability ratio using the survey data collected from the surveys under uncertainty. The main objectives of the paper are to introduce the methods to calculate the measurement error and the reliability ratio using the survey data by considering the degree of uncertainty. The design of the questionnaire with interval responses will be given for the use and knowledge of the AI tools. This questionnaire will be used to generate the data by simulation. The measurement error and reliability ratio using the proposed method will be compared with the results obtained using the classical statistics and the methods that used the mid values of the interval. The comparative study will be given to show the efficiency of the proposed method for the analysis of uncertain data by considering the degree of uncertainty. The proposed framework is expected to have potential applications in survey design, data analysis, and decision-making processes where uncertainty and ambiguity in the collected responses.
Methodology
Suppose the true value is
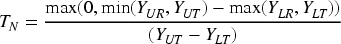
Note that if there is no overlap between the respondent's answer and the target range, then
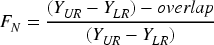
It is important to note that if the respondent's answer lies entirely within the target range, then

In this section, we present the methodology to calculate the measurement error in the survey sampling methods under uncertainty. The measurement error in the survey sampling occurs due to several factors including, for example, misunderstanding the questions, errors in recording the data, complex questions, sensitive questions and errors in coding and analysis. The measurement error is defined as the difference between the target value and the response value. Classical statistics and interval analysis ignore the degree of uncertainty in data, which can lead to wrong conclusions. Neutrosophic statistics considers truth, falsity, and indeterminacy, giving more accurate results from survey data under uncertainty. Suppose that

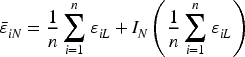
The measurement by considering the degree of uncertainty, is given by

The measurement error under the uncertainty can be rewritten as follows

The mean measurement error by considering the degree of uncertainty is defined by

The measurement error based on the classical statistics part and the indeterminate part is given by
Note that
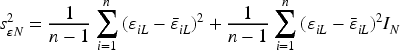
In this section, the variance in the survey sampling under the uncertainty will be presented. By following the properties of the variances described in the last section, suppose that the true variance of

The variance of true values based on the classical statistics part and the indeterminate part is given by

The variance of the measurement error under the proposed method is given by
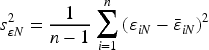
The variance of measurement error based on the classical statistics part and the indeterminate part is given by
These variances are the extension of the variances under classical statistics. These variances reduce to the variances under classical statistics if there is no uncertainty in the data or the data has precise information.
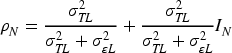
The reliability of the ratio in survey sampling under uncertainty will be derived in this section. The reliability ratio is denoted by
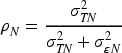
The reliability ratio based on the classical statistics part and the indeterminate part is given by
The uncertain reliability ratio is interpreted as: when
In this section, the design of the questionnaire under uncertainty will be presented. The questionnaire related to the use of artificial intelligence (AI) will be given, where the options in each question will be given in intervals rather than the precise options. In many real-life surveys, especially those related to emerging technologies, respondents often provide incomplete, approximate, or uncertain answers rather than exact or precise information. Therefore, the questionnaire should be designed in such a way that this uncertainty can be captured during the data collection phase. The proposed questionnaire allows responses in interval from while accounting for the degree of uncertainty, which cannot be effectively handled using classical statistical methods. Thus, the questionnaire provides a practical example to illustrate how survey data can be analyzed under uncertainty. The objective of the questionnaire is to evaluate the knowledge and use of the AI tools while considering the uncertainty, ambiguity and partial knowledge while conducting the survey. Another objective is to assess the frequency, the amount of time and the knowledge of the AI tools and applications. The questions related to evaluating the use and knowledge of AI tools and applications are reported in Table 1. The twenty questions have four choices: A, B, C and D, with responses in the interval rather than a single value and therefore the data naturally considers the uncertainty. When the responses are intervals, the use of the existing statistical methods is unable to consider the degree of indeterminacy. In addition, the use of the mid-values of each interval may mislead or give different results for decision-making. In addition, it is important to note that the results from the interval-analysis for such responses do not reduce to the results of classical statistics when there is no uncertainty. Therefore, the proposed generalized interval-analysis by considering the degree of indeterminacy when the responses are inherent have the uncertainty can be applied for the analysis of the data. The use of the proposed generalized interval methods presents a more realistic interpretation of the data in the interval for human judgment about the use and application of AI tools and applications. By collecting the imprecise data from the respondents, the aim of the study is to seek to capture the overall experience of the people related to the use and knowledge of the AI tools and applications.
Questionnaire related the use of AI under uncertainty.

Questionnaire related the use of AI under uncertainty.
In this section, we present the descriptive analysis of neutrosophic components, namely the degree of truth, degree of falsity, and degree of indeterminacy. The averages of these components are computed using the questionnaire given in Table 1, where a target range is specified for each question. For illustration, consider the first question where respondents selected option B = [3, 5], while the target range is [4, 8]. The overlap is calculated as
The average of the three degrees.

The average of the three degrees.
The main objective of the study is to present the methods to calculate the measurement error and reliability ratio using the responses with uncertainty. The simulation procedure is conducted as follows: first, a sample of 200 respondents is generated. For each respondent, a true score representing the target value is assigned. Next, the responses are generated in interval form according to the options given in the questionnaire in Table 1, which reflect in the uncertainty in the respondents’ answers. The respondents are asked to select the suitable choice from the four given options and by fixing the true score for each respondent is fixed for the calculation of the measurement error and the reliability ratio under uncertainty. The use of the simulated data gives somewhat accurate results as they do not consider factors such as the respondent's bias and missing responses. Although the main aim of the study is to present the method using the simulated data in the calculation of the measurement error and reliability ratio, the proposed framework can be used in the real analysis by collecting the data from the underlying population and by following the proposed methods in calculating the measurement error and reliability ratio.
Uncertainty-Based data analysis
Using the simulated data, the statistical analysis under uncertainty is performed on the data collected from 200 respondents. The respondent's data is recorded along with the target true values for the calculations of the measurement error and the reliability ratio analysis. The descriptive statistical analysis performed and the results of the average values of the target values
Neutrosophic error and variance of the artificial data.

Neutrosophic error and variance of the artificial data.
Reliability ratio from the proposed and the existing method for the artificial data.

In this section, the comparative studies across the results of the proposed method, classical statistics, and the results using the mid-values of the interval will be presented for each question. First of all, the results of the proposed method will be compared with the results from classical statistics, and then with the results obtained by using the mid-values of each interval.
The proposed method vs. Classical Statistics
This section presents the comparison of results obtained from the proposed method and classical statistics using the questionnaire is given Table 1. As mentioned earlier, the proposed uncertainty-based method is an extension of classical statistics. The results from the proposed method reduce to the results of classical statistics when there is precise information. The results in Tables 3–4 reduce to the classical statistics results (lower values) when there is no uncertainty. For example, for the question related to the regular use of the AI tools, the uncertainty-based mean of the target, measurement error, variance of the target values, and measurement error are expressed as
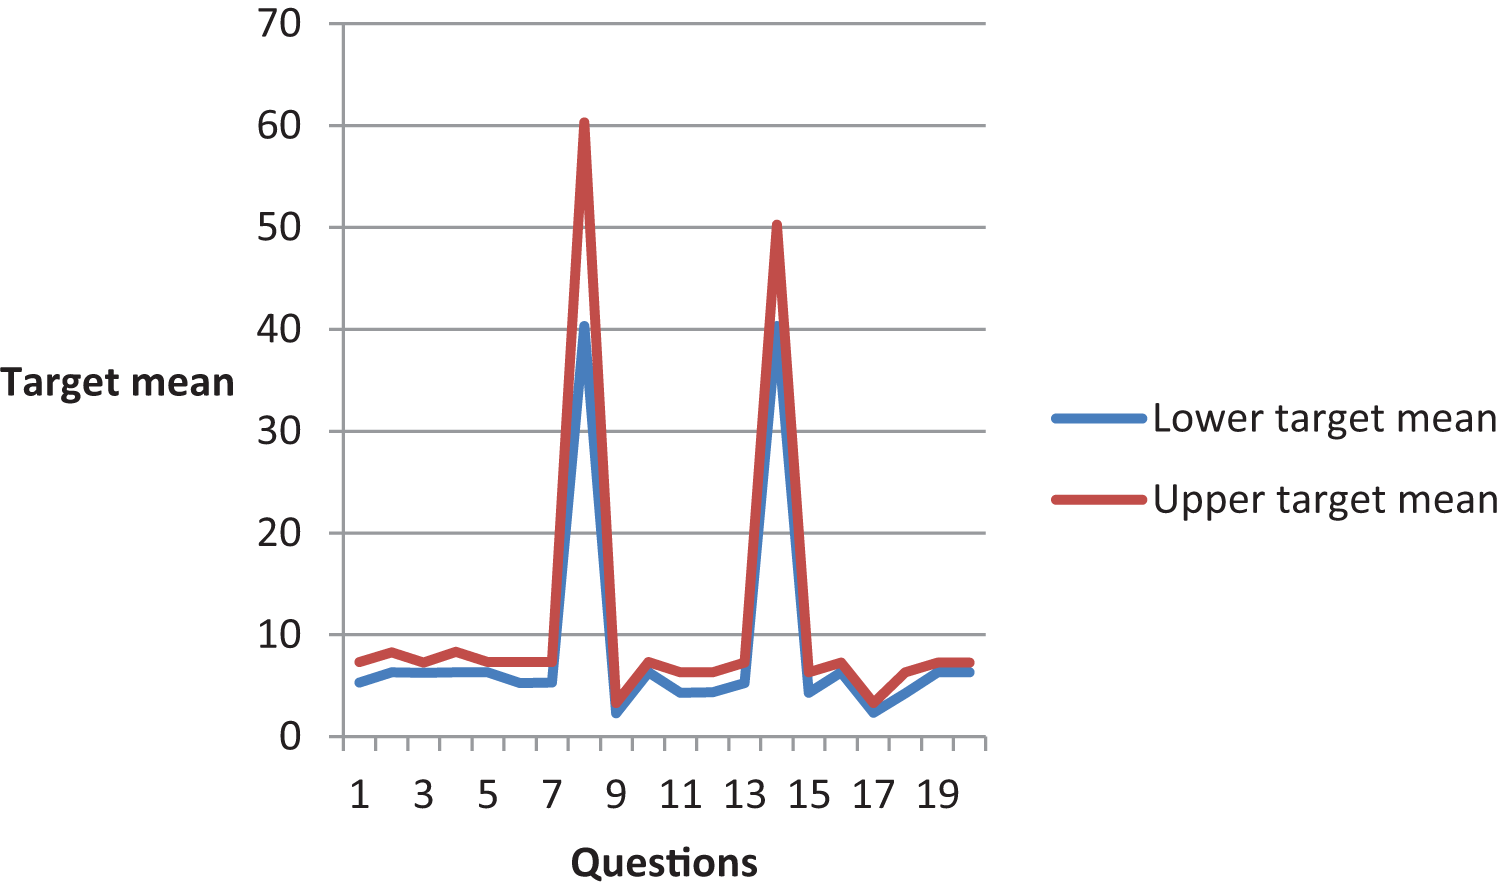
The target mean for lower and upper recorded values.
This section presents a comparison of the results obtained from the proposed method and the existing method that uses the mid-values of the intervals. The reliability ratio results from both the proposed method and the mid-value method are reported in Table 4. The results in Table 4 show that the reliability ratio values from the two methods differ substantially for each question. For example, for the question related to the regular use of the AI tools, the uncertainty-based reliability ratio from the proposed method is
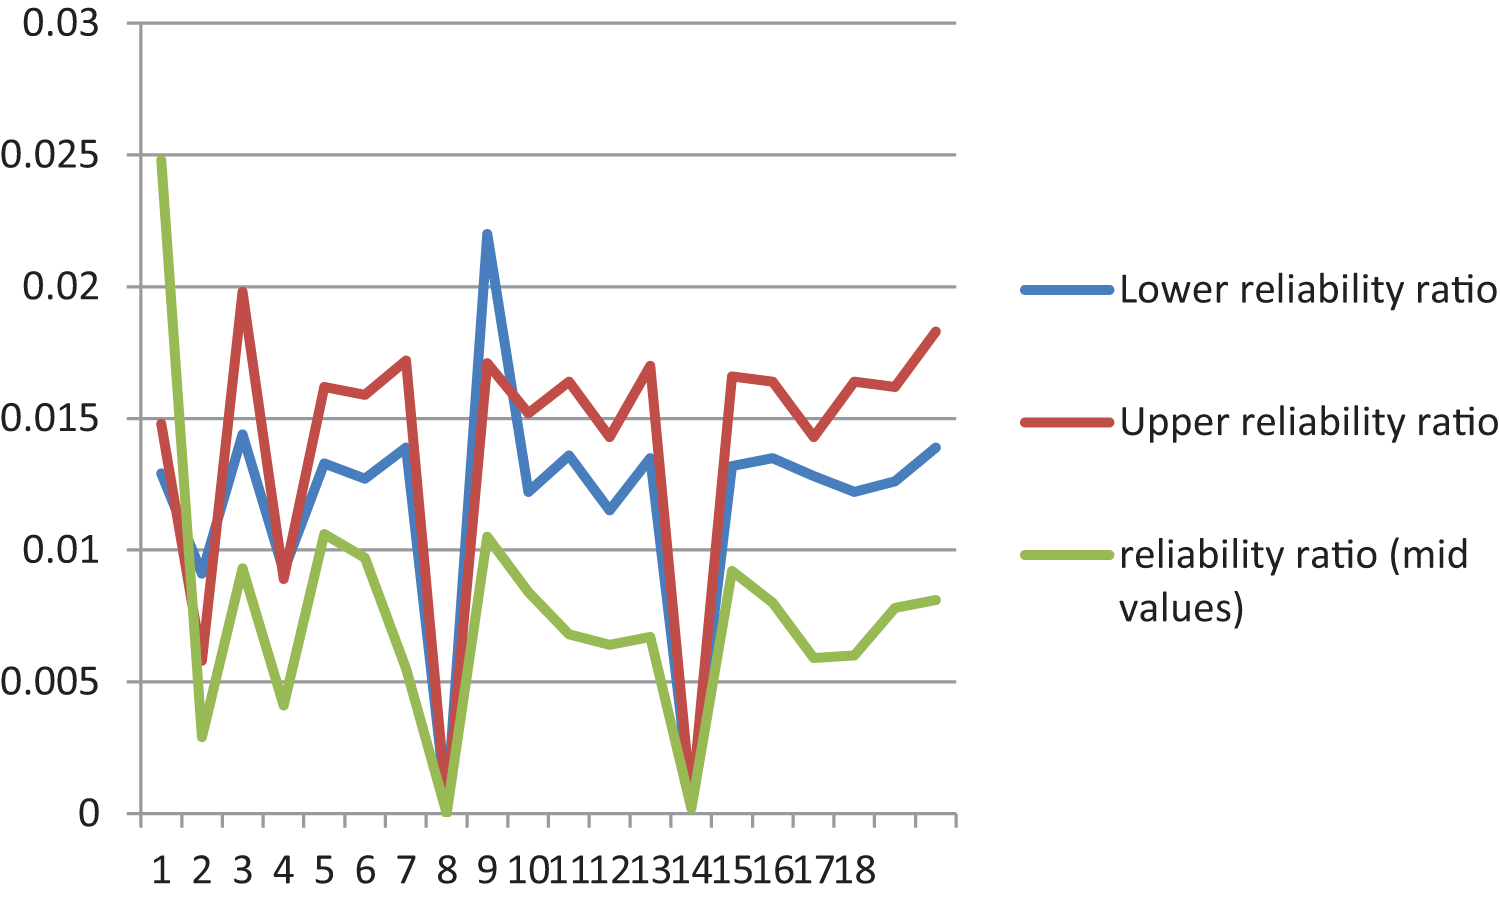
The reliability ratio from the proposed method and using mid-values.
Neutrosophic error and variance of the artificial data using mid values.

The existing methods to calculate the measurement error and reliability ratio under classical statistics and using the mid-values of the intervals are not appropriate for analyzing data recorded under uncertainty. In this paper, the mathematical framework to calculate the measurement error and the reliability ratio was presented under an uncertain environment. Simulated data were generated to apply the proposed method to calculate the descriptive statistics and reliability ratio. Using the simulated data from the questionnaire, the implementation of the proposed method is given and the results were compared with the existing methods under classical statistics and the method using mid-values of the intervals. The results show that the proposed method is more efficient than the existing methods in terms of flexibility and information retention. The results obtained from the mid-value method are not reliable as they are not within the range of the data. The proposed method cannot be applied when all survey data are exact, because it relies on uncertainty to calculate truth, falsity, and indeterminacy. In addition, the proposed method is illustrated using the simulated data for illustrative purposes; collecting real data through an actual survey may be a fruitful avenue. Based on the results obtained from the study, it can be concluded that the proposed method can be applied for the calculation of the measurement error and reliability ratio while conducting surveys in political science, economics, environment and many other fields where the uncertainty is expected.
Footnotes
Acknowledgements
The author is deeply thankful to the editor and reviewers for their valuable suggestions to improve the quality, presentation and novelty of the paper. The authors acknowledge the use of ChatGPT solely for improving the English language, clarity, and readability of our own writing in the manuscript.
Funding
The author received no financial support for the research, authorship, and/or publication of this article.
Declaration of conflicting interests
The author declared no potential conflicts of interest with respect to the research, authorship, and/or publication of this article.