
Abstract
The existing variable control charts using the classical statistics are designed under the assumption that no uncertainty, fuzziness or indeterminate observations or parameters. In practice, the data obtained from the measurement process may have indeterminate or unclear values. In later the situation, it may not possible to apply the variable control chart designed using the classical statistics. The neutrosophic statistics which is the extension of the classical statistics is more suitable to deal with uncertainty/indeterminate observations/parameters issues in the industry. In this paper, we will originally design a variable control chart for the monitoring of data having indeterminate observations using the neutrosophic interval statistics method. The neutrosophic control charts coefficients will be determined and used to calculate the neutrosophic average run length (NARL). A simulation is study is also given to show the efficiency of control chart designed using neutrosophic interval statistics method over the control chart designed using the classical statistics. A real example from the industry is also given. From the comparative study, it is concluded that the proposed control chart under the neutrosophic interval statistics method is more effective and adequate than the chart based on the classical statistics under the uncertainty environment.
Keywords
Introduction
A control chart is an important tool which is introduced by Dr. Shewhart in the 1920s and has been widely used in the industry for the continuous monitoring of the manufacturing process, reduction in variability and analyzing the pattern of common and special causes [1]. The special cause of variations occurs in the process due to several uncountable factors such as temperature, works and machines etc. The special causes of variation shift the process from the given target. As a result, there is chance to produce the non-conforming product. A quick indication about the shift in the process is necessary to minimize the non-conforming product. Acceding to [2], the main aim of the control charts is to detect a shift in the mean and variance of a quality of interest. The monitoring data can be classified into two groups which are attribute data and variable data, respectively. Based on data types, the control chart is designed for the monitoring of the process. The Shewhart attribute control chart and variable control chart have been widely used in the industries for the monitoring of the manufacturing process. Both types of control charts have potential applications in the variety of industries [3]. Attribute control charts are easy to apply in the industry but less informative than the variable control charts. In any type of control chart, the selection of the parameters for the control is done with the help of industrial engineers or sampling [4]. Several authors designed Shewhart control charts using the classical statistics, including for example, [5–14].
In practice, it is assumed that all observations present the quality of interest have no doubt or determinate, clear and precise. According to [2] “observations include human judgments, and evaluations and decisions, a continuous random variable of a production process should include the variability caused by human subjectivity or measurement devices, or environmental conditions. These variability causes create vagueness in the measurement system”. In this situation, the data is recoded in range rather than an exact value of variable under study. Therefore, the analysis based on classical statistics does not represent the real system adequately [2]. Therefore, the fuzzy method is the more appropriate method to analyze data having uncertain observations. [15] designed control chart for the process average and variability using the linguistic data [16] introduced the control chart for linguistic data. More details on the linguistic data can be seen in [17–19] favored the fuzzy base control chart [8] designed the hybrid fuzzy chart using adaptive sampling. Some more studies of a continuous variable can be seen in [20, 21] proposed fuzzy-based mean and range control chart. More details of fuzzy based control charts can be seen in [1, 22–26]. Some recent progresses in decision making based on interval method can be seen in [27–30].
According to [31], the fuzzy logic is the special case of neutrosophic logic. Therefore, the neutrosophic interval statistical methods are the generalization of the classical statistics. More information about the neutrosophic set can be seen in [32, 33]. The neutrosophic statistics is introduced by [34] and has been widely used for the analysis of data having fuzzy, indeterminate and imprecise observations [35, 36] applied the neutrosophic statistics in the rock study. Recently, [37] designed an inspection scheme using the neutrosophic statistics.
The existing variable control charts using the classical statistics are designed under the assumption that no uncertainty, fuzziness or indeterminate observations or parameters. In practice, the data obtained from the measurement process may have indeterminate or unclear values. In later situation, it may not possible to apply the variable control chart designed using the classical statistics. The neutrosophic statistics which is the extension of the classical statistics is more suitable to deal with uncertainty/indeterminate observations/parameters issues in the industry. By exploring the literature and best of our knowledge, there is no work on the variable control chart using the neutrosophic statistics. In this paper, we will originally design a variable control chart for the monitoring of data having indeterminate observations using the neutrosophic interval statistics method. We expect the proposed control will perform better than the existing control chart under the uncertainty environment. The neutrosophic control charts coefficients will be determined and used to calculate the neutrosophic average run length (NARL). A simulation study is also given to show the efficiency of control chart designed using neutrosophic interval statistics method over the control chart designed using the classical statistics. A real example from the industry is also given.
Design of X-bar chart using neutrosophic statistics
Let X
Ni
∈ {X
L
, X
U
} = i = 1, 2, 3, …, n
N
be a continuous neutrosophic random variable under study which is consisted of observations in range. Suppose also that X
Ni
∈ {X
L
, X
U
} is modeled by the neutrosophic normal distribution with neutrosophic mean μ
N
∈ {μ
L
, μ
U
} and neutrosophic standard deviation σ
N
∈ {σ
L
, σ
U
}. The best linear unbiased estimator (BLUE) of μ
N
∈ {μ
L
, μ
U
} and σ
N
∈ {σ
L
, σ
U
} are
We will propose the following
The proposed
The probability of in-control, say P inN , under the neutrosophic statistics derived as follows
The performance of a control chart is measured with help of the average run length (ARL) which defined when on the average first plotting point will be out-of-control. The neutrosophic average run length (NARL) for the in-control process is defined as follows
We suppose not that due to some uncontrollable factors, the process target mean m
N
∈ {m
L
, m
U
} shifted to a new level m1N = m
N
+ cσ
N
; m
N
∈ {m1L, m1U}, σ
N
∈ {σ
L
, σ
U
}, where c denotes the shift constant. The probability of in-control for shifted process, say P1inN, is derived as follows
The simplified form of P inN is given by
The neutrosophic average run length (NARL) for the shifted process is defined as follows
The values of ARL1N determined and placed in the Tables 1–4 for various values of shift constant c, specficied ARL0N, say r0N and neutrosophic subgroup size n N . Table 1 shows the values ARL1N, when ARL0N = [200, 200] , [300, 300] and [370, 370] and n N ∈ 2, 5. Table 2 shows the values ARL1N, when ARL0N = [200, 200] , [300, 300] and [370, 370] and n N ∈ {5, 7}. Table 3 shows the values ARL1N when ARL0N = [200, 200] , [300, 300] and [370, 370] and n N ∈ {8, 10}. Table 4 shows the values ARL1N when ARL0N = [200, 200] , [300, 300] and [370, 370] when n N ∈ {n L , n U } is determined.
The values of NARL when n N ∈{2,5}
The values of NARL when n N ∈ {5, 7}
The values of NARL when n N ∈ {8, 10}
The values of NARL when ARL0N = 200, 300, 370
From Tables 1–4, we note following trends in ARL1N
The values of ARL1N decreases for the increase in the shift constant c. The values of ARL1N decreases as n
N
∈ {n
L
, n
U
} decreases. For example when n
N
∈ {2, 5}, ARL1N ∈ {200.904, 200.945} when c = 0.01 while ARL1N ∈ {199.917, 200.800} when n
N
∈ {5, 7}.
The following algorithm under the neutrosophic interval methods is used to find k
N
∈ {k
L
, k
U
} and ARL1N. Specify the ARL0N and n
N
∈ {n
L
, n
U
} Determine k
N
∈ {k
L
, k
U
} for the in-control process such that ARL0N ≥ r0N
Determine ARL1N, for various shift constant c.
In this section, we will compare the efficiency of the proposed control chart under the neutrosophic statistics with the classical Shewhart X-bar control chart under the classical statistics.
By theoretical computations
In this section, we will compare the performance of the control chart under the neutrosophic interval statistical method to the X-bar control chart under the classical statistics. For the fair comparison, we selected the same parameters for the two methods. We will only present this comparison when ARL0N = 370 and n N ∈ {5, 7} for the proposed method and ARL = 370 and n = 5 for the existing statistical method. We put the values of NARL and ARL of two methods in the Table 5.
The comparison of proposed methods with classical statistics when ARL0N = 370
The comparison of proposed methods with classical statistics when ARL0N = 370
From Table 5, it can be noted that the proposed methods under the neutrosophic statistics indicate the range of ARL1N values while the classical statistics method provides the determined value which is the special case of the proposed method. For example, when c = 0.05, for the proposed control chart, the indeterminacy interval of ARL is ARL1N ∈ {349.429, 342.764} while the existing control chart has ARL = 348.24. Under the uncertainty, it is expected that on the average, there will be a shift in the process between 342th and 349th sample. On the other hand, the existing control chart has a determined value. Similarly, the proposed chart can be compared with the existing control chart for any other parameters. So, the proposed method is more suitable and effective to analyze the data under an indeterminate environment. This theoretical justification of the proposed method meets with [35].
In this section, we will compare the efficiency of the proposed chart using the simulated data. The Shewhart control under the classical statistics presented by [38, 39] For the fair comparison, we will select the same values of control chart parameters say ARL0N = 370 and n
N
= 5 for both control charts. The neutrosophic normal distribution is applied when a random sample is selected from the population having uncertain observations. For the proposed control chart, the first 20 observations are generated for the in-control process from the neutrosophic standard normal distribution when μ
N
∈ {0, 0} and μ
N
∈ {1, 1} and the next 20 observations are generated from the neutrosophic normal distribution when μ
N
∈ {0.70, 0.70} and μ N ∈ {1, 1} from the shifted process with c = 0.70. From Table 4, we note that the indeterminacy interval of ARL1N which is ARL1N ∈ {1.925, 13.265, 0}. This indeterminacy interval shows that the process shift should be detected between 2 and 13 samples. The neutrosophic control limits are shown in Fig. 1. We plot the statistic understudy
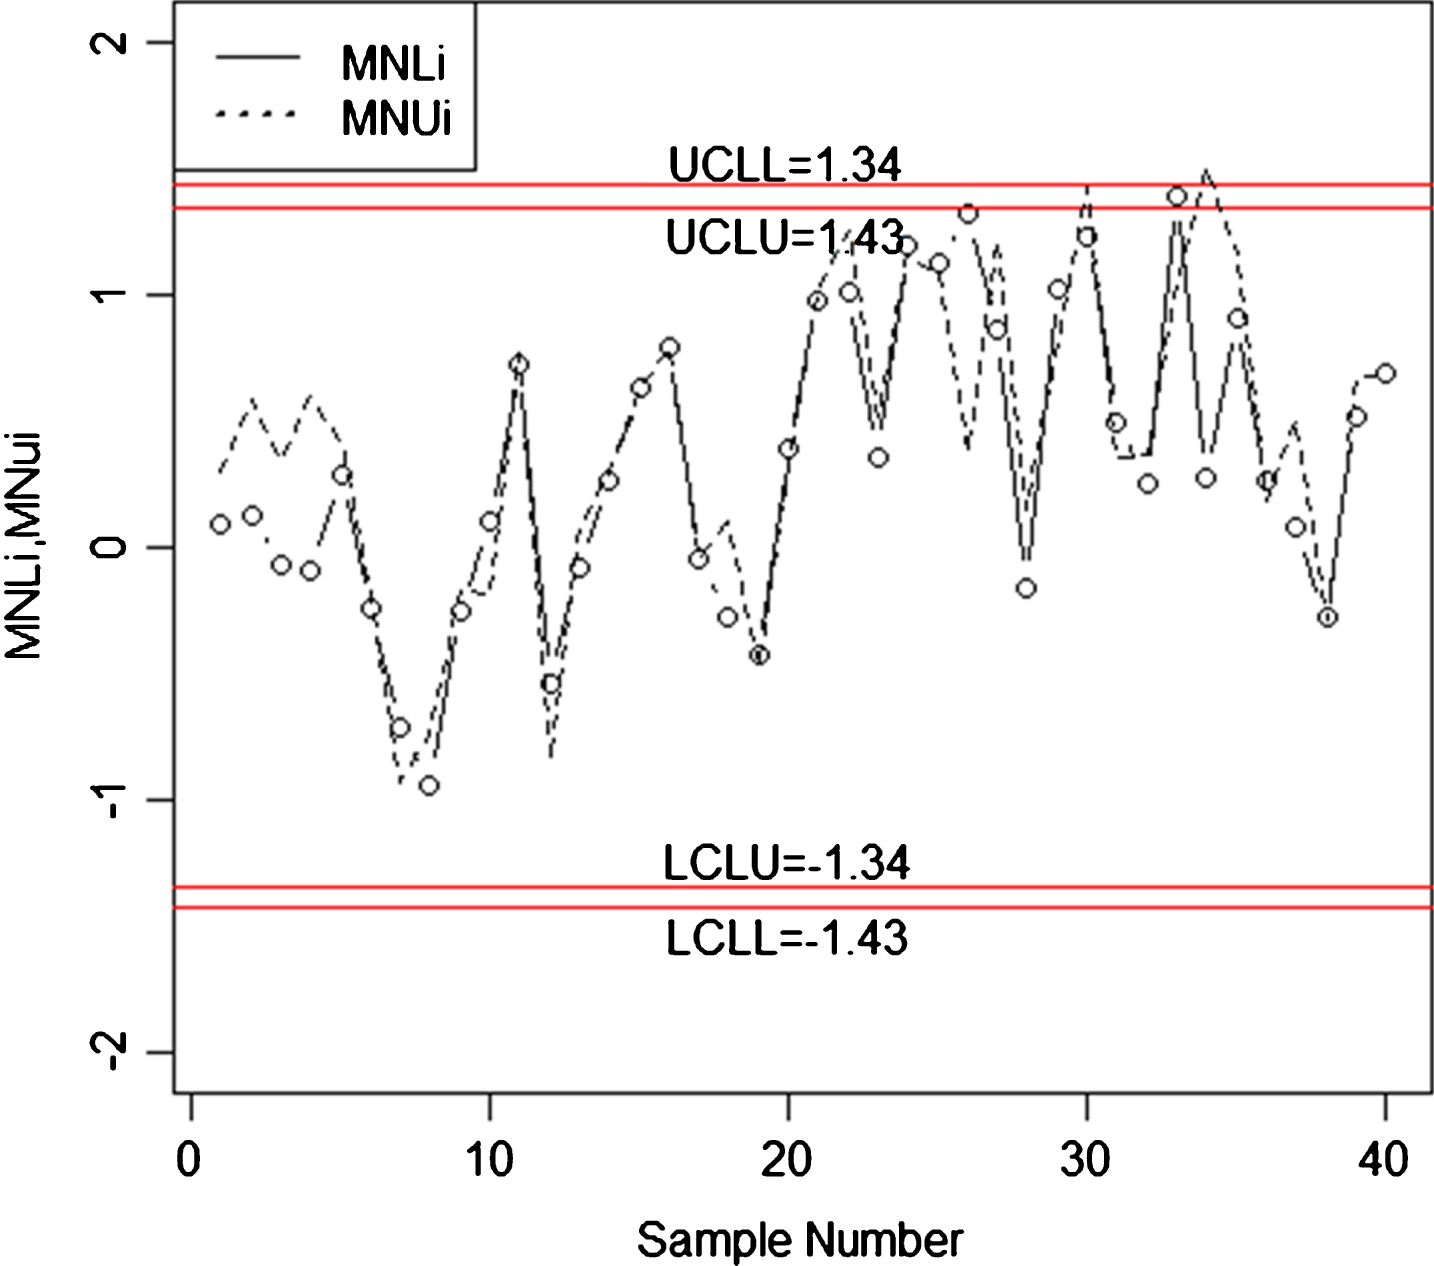
The proposed control chart for simulation study.
We also plotted the statistic X-bar computed using the classical statistics in Fig. 2. We noted that the control chart under the classical statistics is unable to detect the shift in the process. By comparing Fig. 1 with Fig. 2, we note that the proposed neutrosophic interval method is more effective as it provides the range of parameters rather than the determined value as in the classical statistics. Further, the control chart under the neutrosophic statistics has the ability to detect the shift in the process.

The existing chart for simulation study.
In this section, we will discuss the application of the proposed control chart under the neutrosophic interval method in the industry. We will apply the proposed control chart in the automobile industry. In this industry, the inside diameter measurement of automobile engine piston rings is a continuous random variable is obtained by the measurement process. As mentioned by [40] “all observations and measurements of continuous variables are not precise numbers but more or less non-precise. This imprecision is different from variability and errors. Therefore also lifetime data are not precise numbers but more or less fuzzy. The best up-to-date mathematical model for this imprecision is so-called non-precise numbers”. So, the data for inside diameter measurement has some uncertain observations. In this case, the process should be monitored using the proposed control chart under the neutrosophic interval method than the chart under the classical statistics. The data X N ∈ {X L , X U } having some neutrosophic observations is shown in Table 6.
The real example data
The real example data
Suppose for this example, ARL0N = 370 and n
N
= 5. From Table 1, we have k
N
∈ {3.001, 3.002} and m
N
∈ {74.001, 74.001}. We will use
The neutrosophic control limits will be calculated as follows
We plotted the statistic X N ∈ {X L , X U } on control chart in Fig. 3. Figure 3 shows that some plotting values are near to control limits. The same data is also plotted on the X-bar control chart under the classical statistics in Fig. 4. The Fig. 4 shows that the process is an in-control state. By comparing Fig. 3 with Fig. 4,we note that proposed indicates that 3rd and 14th samples are near the control limits which need the engineer attention. Therefore, the proposed control chart is more effective than the existing control chart in detecting shift in the process and used under the uncertainty environment.
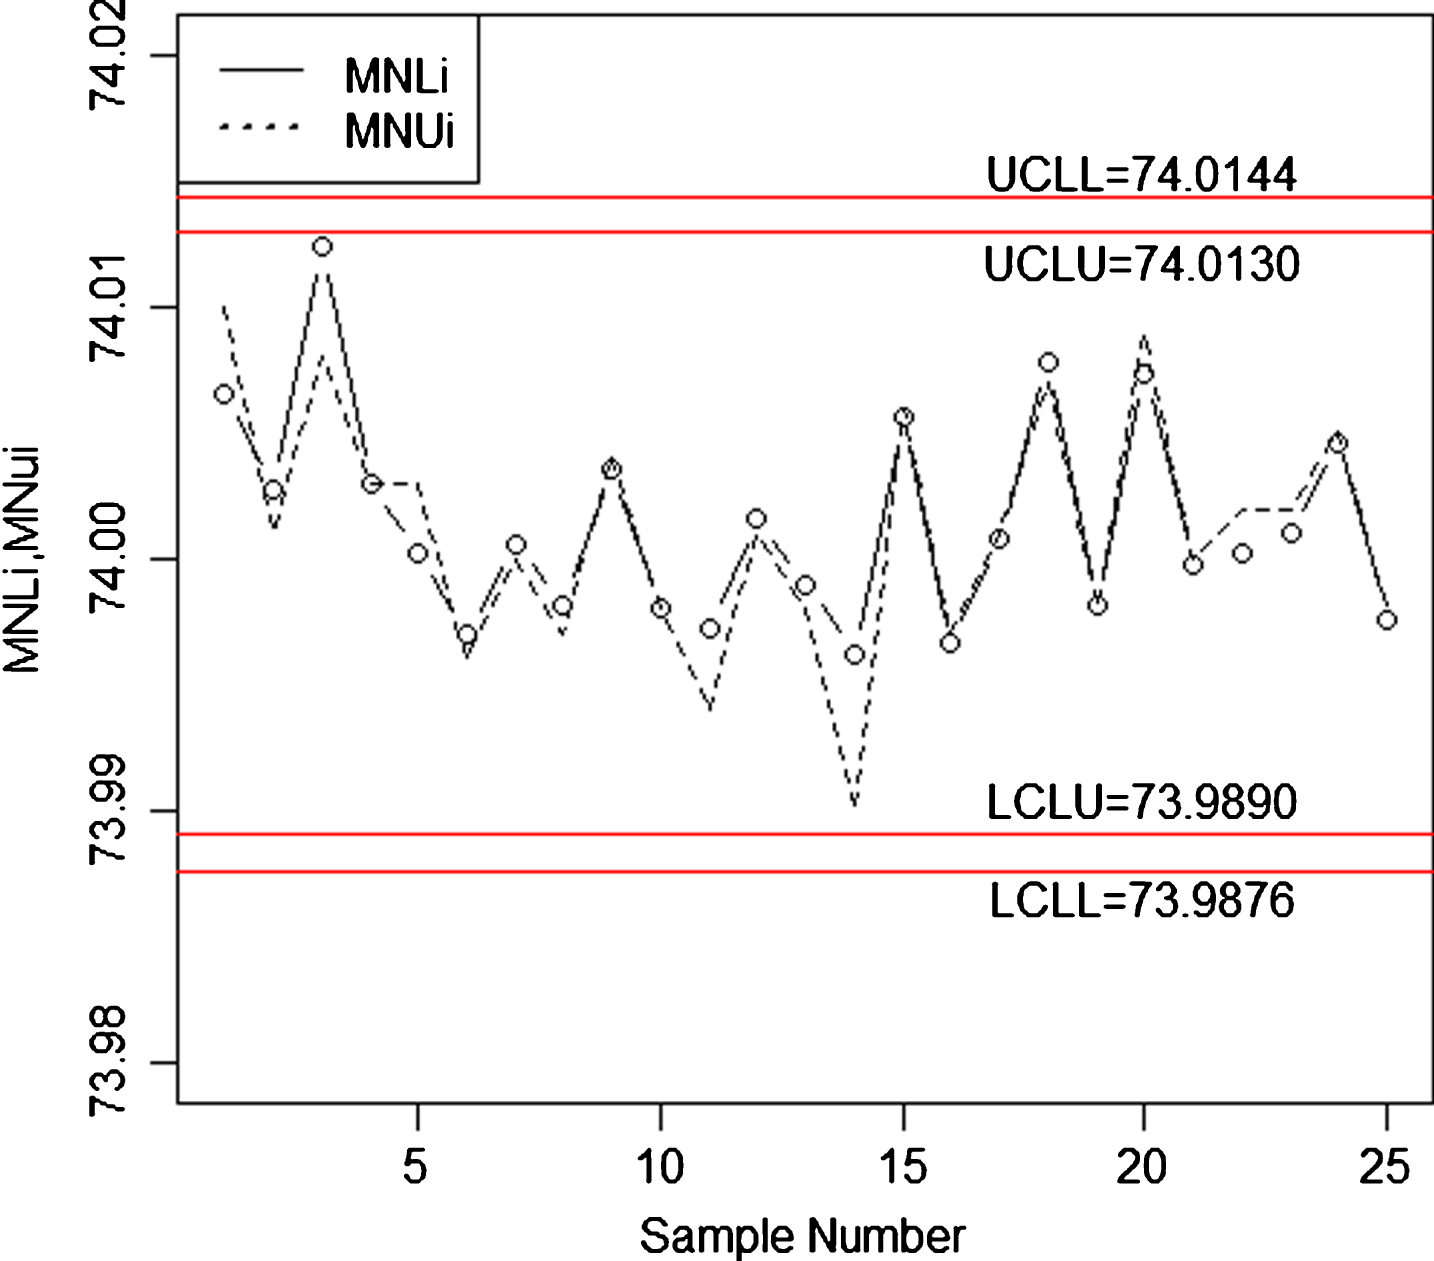
The proposed control chart for real data.
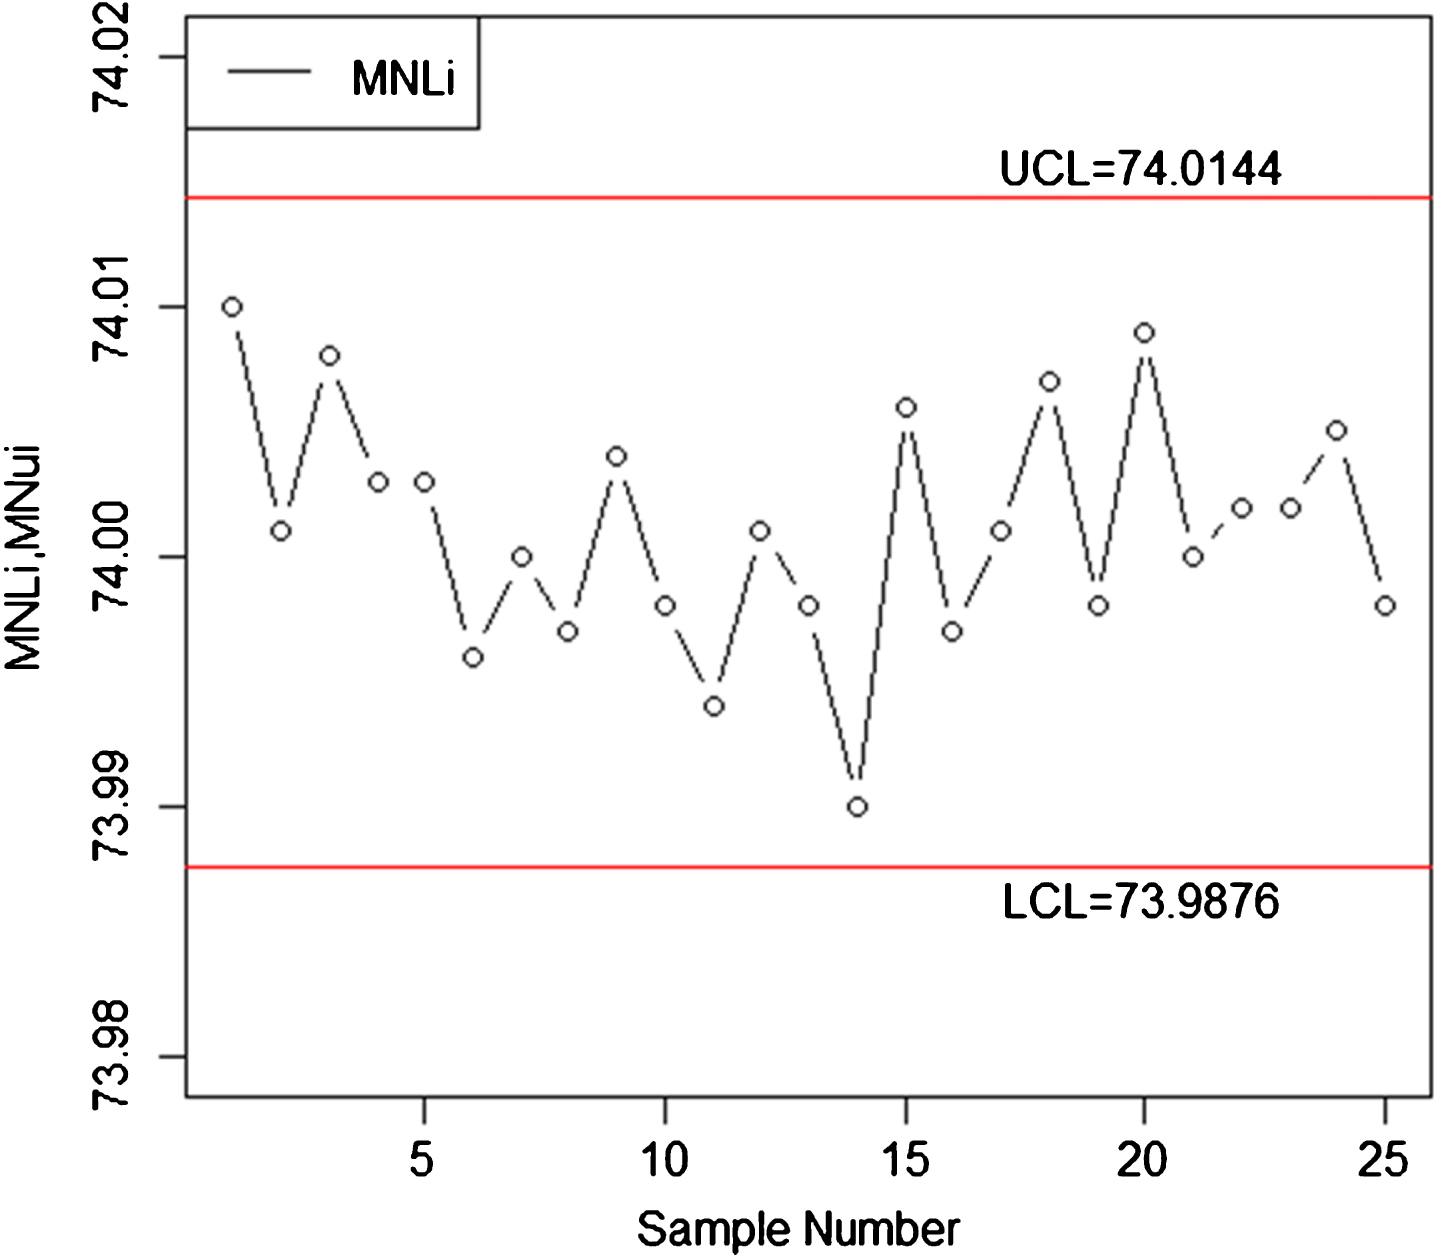
The existing control chart for real data.
We proposed the variable control chart using the neutrosophic statistics. The proposed control chart is an extension of the variable control chart under the classical statistics. In the existing control chart, the data is known and recorded as crisp numbers. Since the proposed control chart consists of indeterminate and determinate parts which makes it very suitable for the monitoring of the variable under the uncertainty environment. From the comparison, it is concluded that the proposed control chart under the neutrosophic interval method is more effective than the existing control chart based on classical statistics. The proposed control chart is more sensitive to detect a shift in the process. The proposed control chart can be applied in the industry when some observations/parameters are uncertain.
The proposed control chart using the ocean big datasets [42] and marine big datasets [43] can be considered as future research. The extension of the proposed control chart using some other sampling schemes will be considered as future research. The proposed control chart using a cost model can also be considered as future research.
Footnotes
Acknowledgments
The authors are deeply thankful to editor and reviewers for their valuable suggestions to improve the quality and presentation of this manuscript. This work was funded by the Deanship of Scientific Research (DSR), King Abdulaziz University, Jeddah, Saudi Arabia. The author, Muhammad Aslam, therefore, acknowledge with thanks DSR technical and financial support.