
Abstract
In recent years, there is a growing need to analyze interval-valued data, and many scholars are also paying attention to the research on interval-valued data modeling and analysis. In this paper, we shall introduce a new model aimed at handling interval-valued data with spatial dependencies. Based on the idea of least square method of single-valued case, we give the parameter estimator for interval-valued spatial error model. Then we prove the estimator’s properties. Finally, we give the numerical simulation analysis. Also the proposed model was applied to three real datasets, and the empirical analysis demonstrates the effectiveness of the proposed model.
Introduction
It is well known that classical linear regression model and time series models are most widely used in statistical inference, including medicine, education, finance, science, technology and many other fields. However, the models are mostly for single-valued random variables. In the real world, there are a lot of random phenomenas, which can not be characterized by a single-valued random variable. For example, the price of a stock on a given day. It is clearly unreasonable by using a single-valued data to describe the stock price (ex. stock’s daily min price or max price) on a given day, it will lose the fluctuation information in the process of stock trading, then the final analysis results provided to decision-makers are also one-sided. People also sometimes will pay more attention to the data in a certain range, such as the temperature for a given day, people do not pay attention to the temperature at a certain time of one day, but pay more attention to the maximum and minimum temperature of one day. In economic forecasting, economists mostly give a prediction range of economic growth rate. In the process of medical imaging diagnosis, the imaging result is usually a two-dimensional plan, and it is not a single-point value. In investment decision-making, investors are not only concerned about the price of a risk asset at a certain point in time, but also about the fluctuation range of the price at a period. So the interval-valued data are more appropriate and valuable, because they can more comprehensively reflect the uncertainty and ambiguity in practical problem. Thus it is necessary to consider the interval-valued statistical models and statistical inference problems.
Interval-valued random variables are special set-valued random variables. In the mid-20th century, Aumann and Debreu firstly used set-valued mapping when studying economic phenomena. Aumann (1965) gave the integral of set-valued random variables. Hiai and Umegaki (1977) gave the concept of conditional expectation of set-valued random variables. Lyashenko (1982, 1983) discussed the properties of set-valued random variables in Euclidean space, and introduced the definition of set-valued Gaussian random variables, and gave the definition of variance for set-valued random variables. Vitale (1985) studied the properties of
For interval-valued statistical models, Billard and Diday (2000) established a linear regression model by using the midpoint of interval-valued random variables. Billard and Diday (2002) established linear regression models by using the two endpoints of interval-valued random variables respectively. Lima Neto and de Carvalho (2008) established linear regression models by using the center and radius of interval-valued random variables. Lima Neto and de Carvalho (2010) imposed non-negative constraints on the regression coefficients of radius on the basis of Lima Neto and de Carvalho (2008). Wang et al. (2012) proposed the complete information method to deal with the interval-valued linear regression model. Souza et al. (2017) introduced the parametrization method to linear regression model. Wang et al. (2015) used set-valued theory to study linear regression problems, and gave the least square estimator and the related properties. Li etc. studied interval-valued linear regression model based on assumption the error is asymmetric Laplace distribution in Guan and Li (2024). Eufr
As for the single-valued spatial error model, Anselin (1988) gave the maximum likelihood estimation method. Prucha (2010) proposed the generalized moment estimation method. Yildirim and Kantar (2020) systematically summarized the methods of parameter estimation of spatial error model and proposed a new parameter estimation method based on likelihood equation. Many scholars have studied the classical linear regression and time series models of interval-valued random variables and achieved wonderful research results. The issue we are considering is the interval-valued spatial error models. This paper attempts to extend the classical spatial error model to interval-valued case. We will provide a parameter estimation method and discuss the properties of the parameter’s estimator. We will conduct numerical simulation analysis to evaluate the performance of the proposed model, and also apply it to actual datasets for validation.
The organization of this paper is arranged as follows: in Section 2, we mainly introduce the notations and basic concepts of interval-valued random theory. In Section 3, we mainly discuss the interval-valued spatial error model, and give the least square estimator of parameter and discuss the unbiasedness of the estimator, a series of digital characteristics and the consistency of parameter estimation. In Section 4, the effectiveness of the method is verified by numerical simulation. In Section 5, the model is applied to case analysis by three actual datasets.
Preliminaries on Interval-Valued Random Variables
Distance and
Distance
Throughout this paper, we assume that


For any sets

The support function of set

The


Call set-valued mapping

Let
Similarly, for interval-valued random variables, the
Further, from Yang and Li (2005),
Moment of Set-Valued Random Variables
The expectation of set-valued random variable

Yang and Li (2005) introduced the variance and covariance of set-valued random variables based on
For set-valued random variable
For two set-valued random variables

If
The covariance of interval-valued random variables
Through calculation, we can easiely have

Interval-valued Spatial Error Model
In this section, we assume the explanatory variable

By transforming, the model (3.1) becomes,
If The row normalization of the space weight matrix is an ordinary assumption in spatial data analysis. Under this assumption, the summation of each row of Specifically, when Here,


Let
For the general single-valued linear model, the idea of the least squares estimation method is to minimize the sum of the squares of the residuals. We shall use the same mathematical idea here.
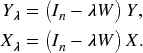
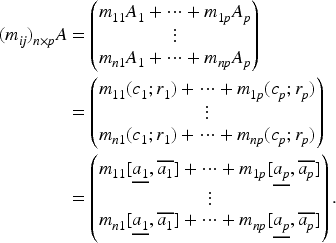
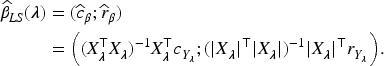
For interval-valued spatial error model, the least square estimation of interval-valued unknown parameter
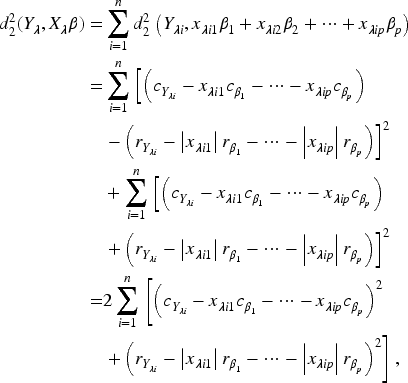
Next, calculate the partial derivatives of
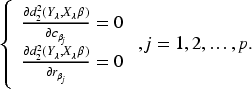
that is,


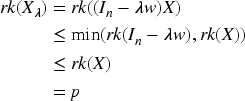
After the regular equation is obtained, the parameter estimation of the interval-valued spatial error model can be obtained by solving the regular equation. The following is the result about the rank of
If
Easy to know that


Based on Lemma 3.1 and suppose
Under the condition of Lemma 3.1, the least squares estimation of interval-valued spatial error model is unique, which is denoted as
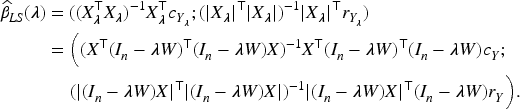
We formulate (3.2) as

After obtaining the estimation form of unknown parameter
When
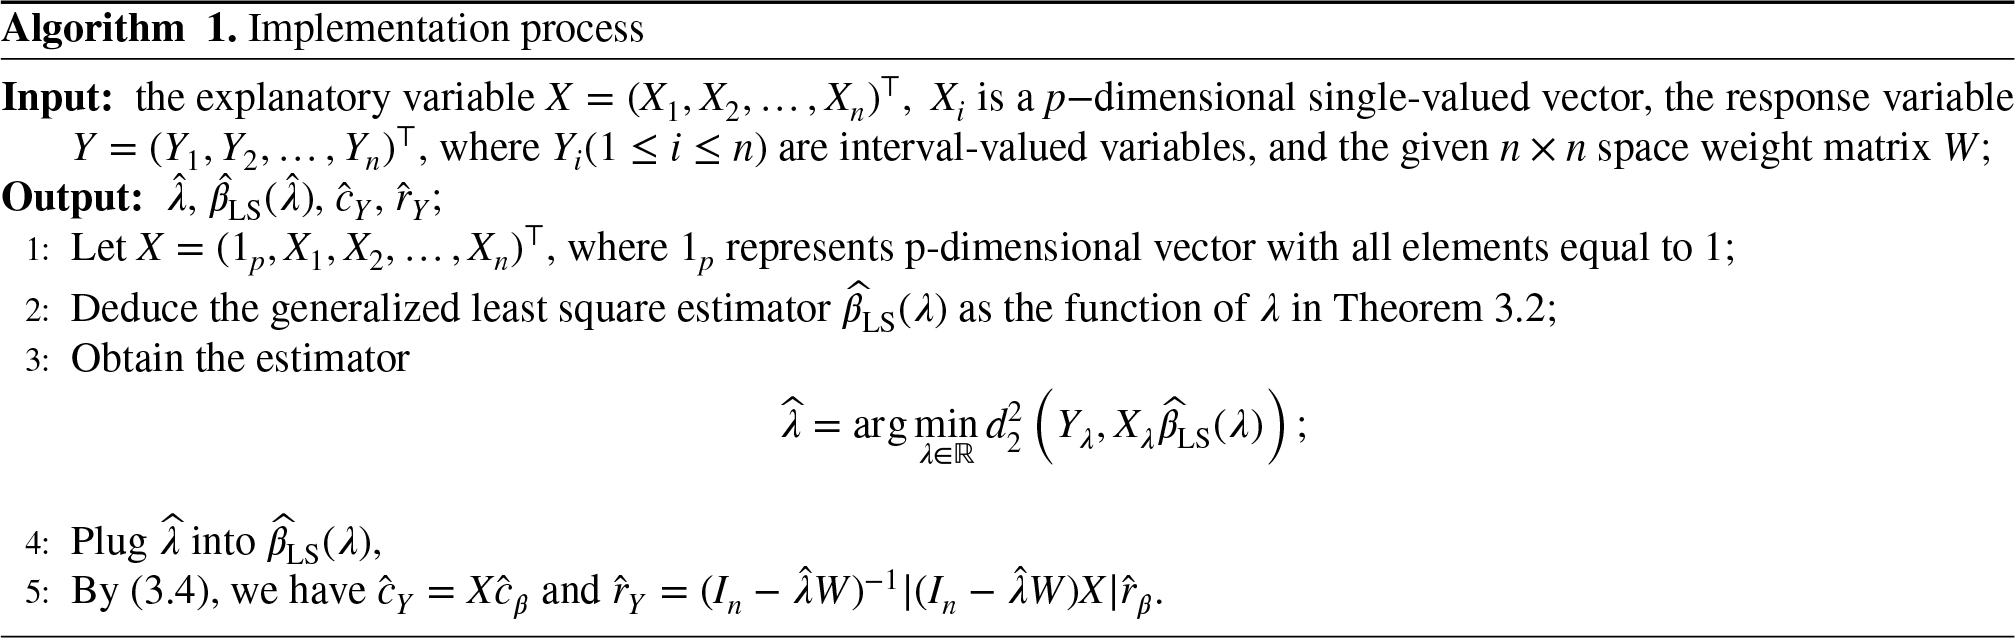
In summary, we give the algorithm 1 to obtain estimates of the model (3.1).
The least squares estimate
By Theorem 3.2,

For the interval-valued spatial error model, when
If
(1) 
(2) 
For the 

The result is proved.
Next we discuss the estimation of error
The error estimator
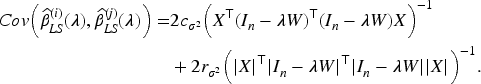
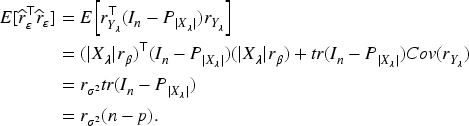
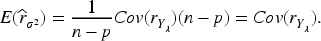
(1) Since

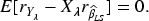
(2) On the other hand,


Where 
From Theorem 3.5, we konw that
Next, we consider the estimation of
Since 

Then the estimator of 
So
The estimator of 
So there is
In the following, we discuss the independence of
Since

It can be seen that
According to the independence theorem of quadratic form and linear form of normal variables, it is necessary to prove that they are independent of each other, that is, the product of linear part, variance part and quadratic part of normal variables is 0.

Similarly, 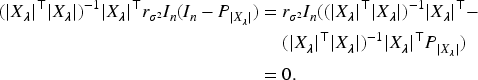
so
In the sense of 
According to Theorem 3.3, 

From condition 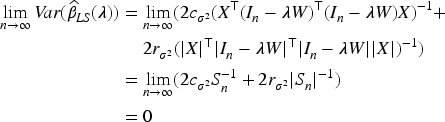

Therefore, in the sense of
In this part, the parameter estimation process of interval-valued spatial error model is further explained by numerical simulation. Based on the
Based on equation (3.4), we obtain observations 
Using the first-order adjacency method, assuming that 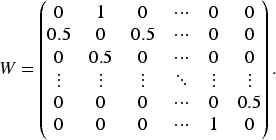
In the simulation, we generate data as follows.
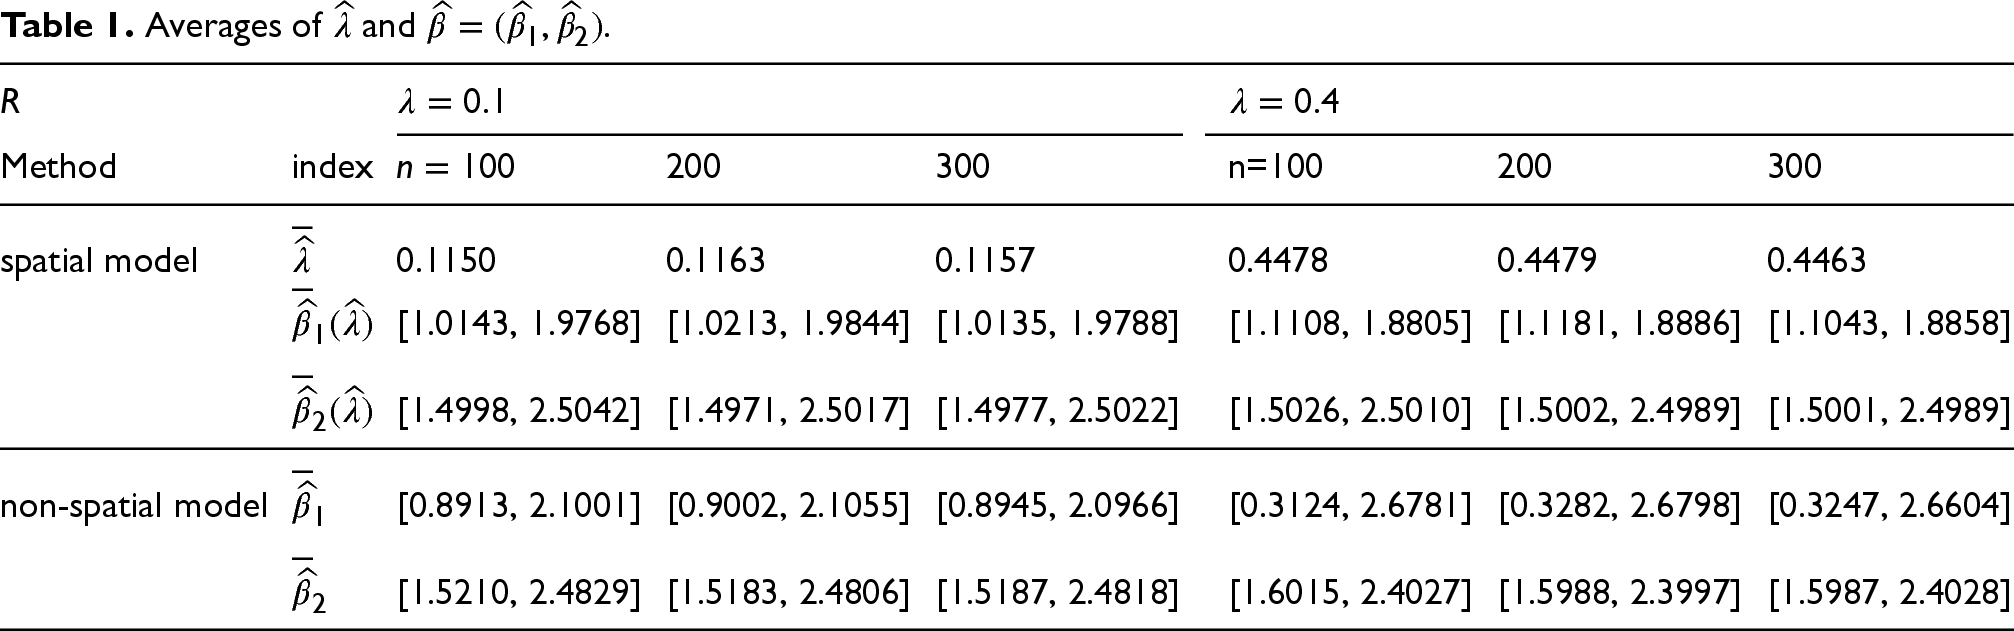
Next, the mean square error (MSE) of the parameter estimation is calculated as one of the criteria to measure the goodness of the estimation. The calculation method is based on interval value 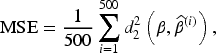
Averages of
and
.
Averages of
Sample Mean Square Error.
It can be seen from Table 1 that whatever value
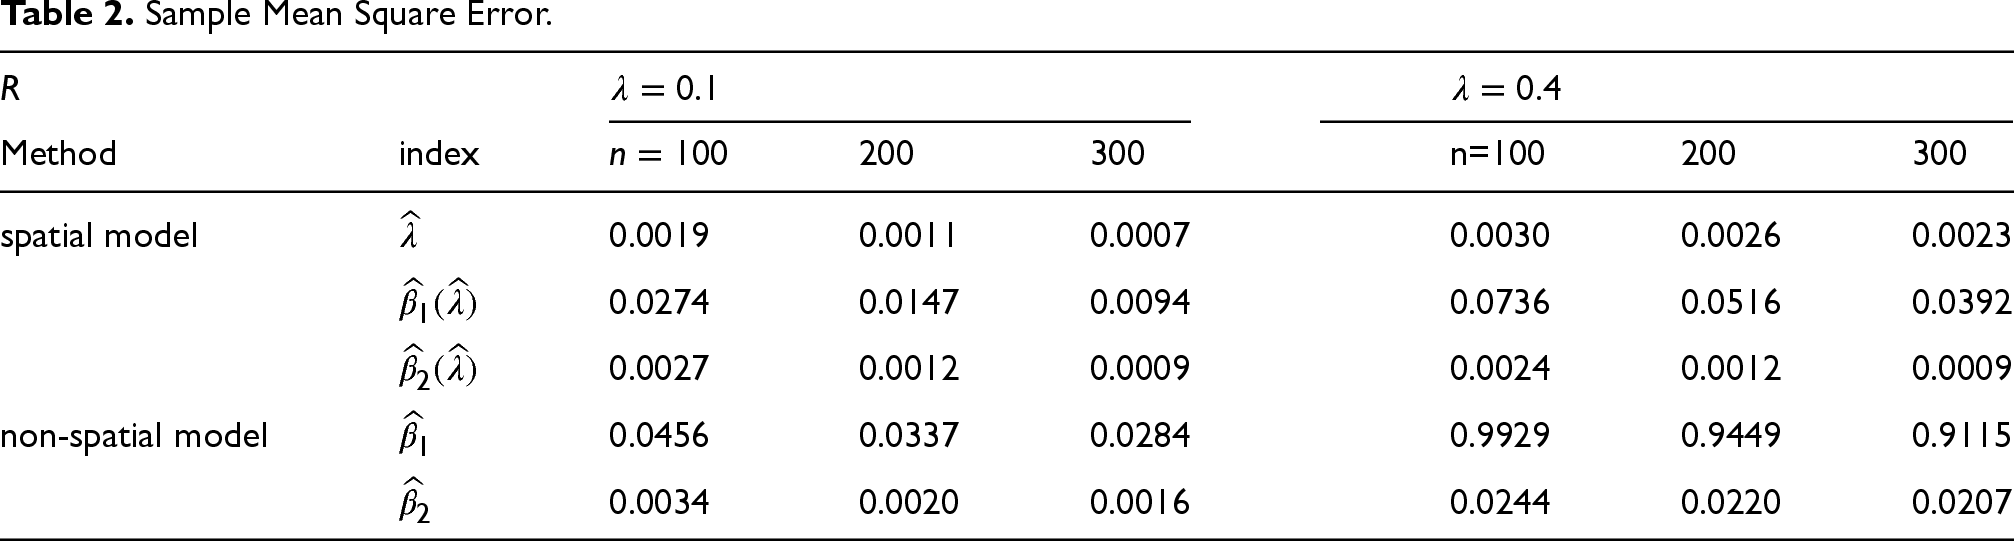
Reversely, we generate data from a data generative design, which is the same as the one described above, except that we set
Results of
Table 3 implies that we can get good results with a spatial model even if the data is generated from a linear model.
In this section, we choose three data sets to evaluate our proposed method. For every data set, We compare the linear regression model (LRM)(
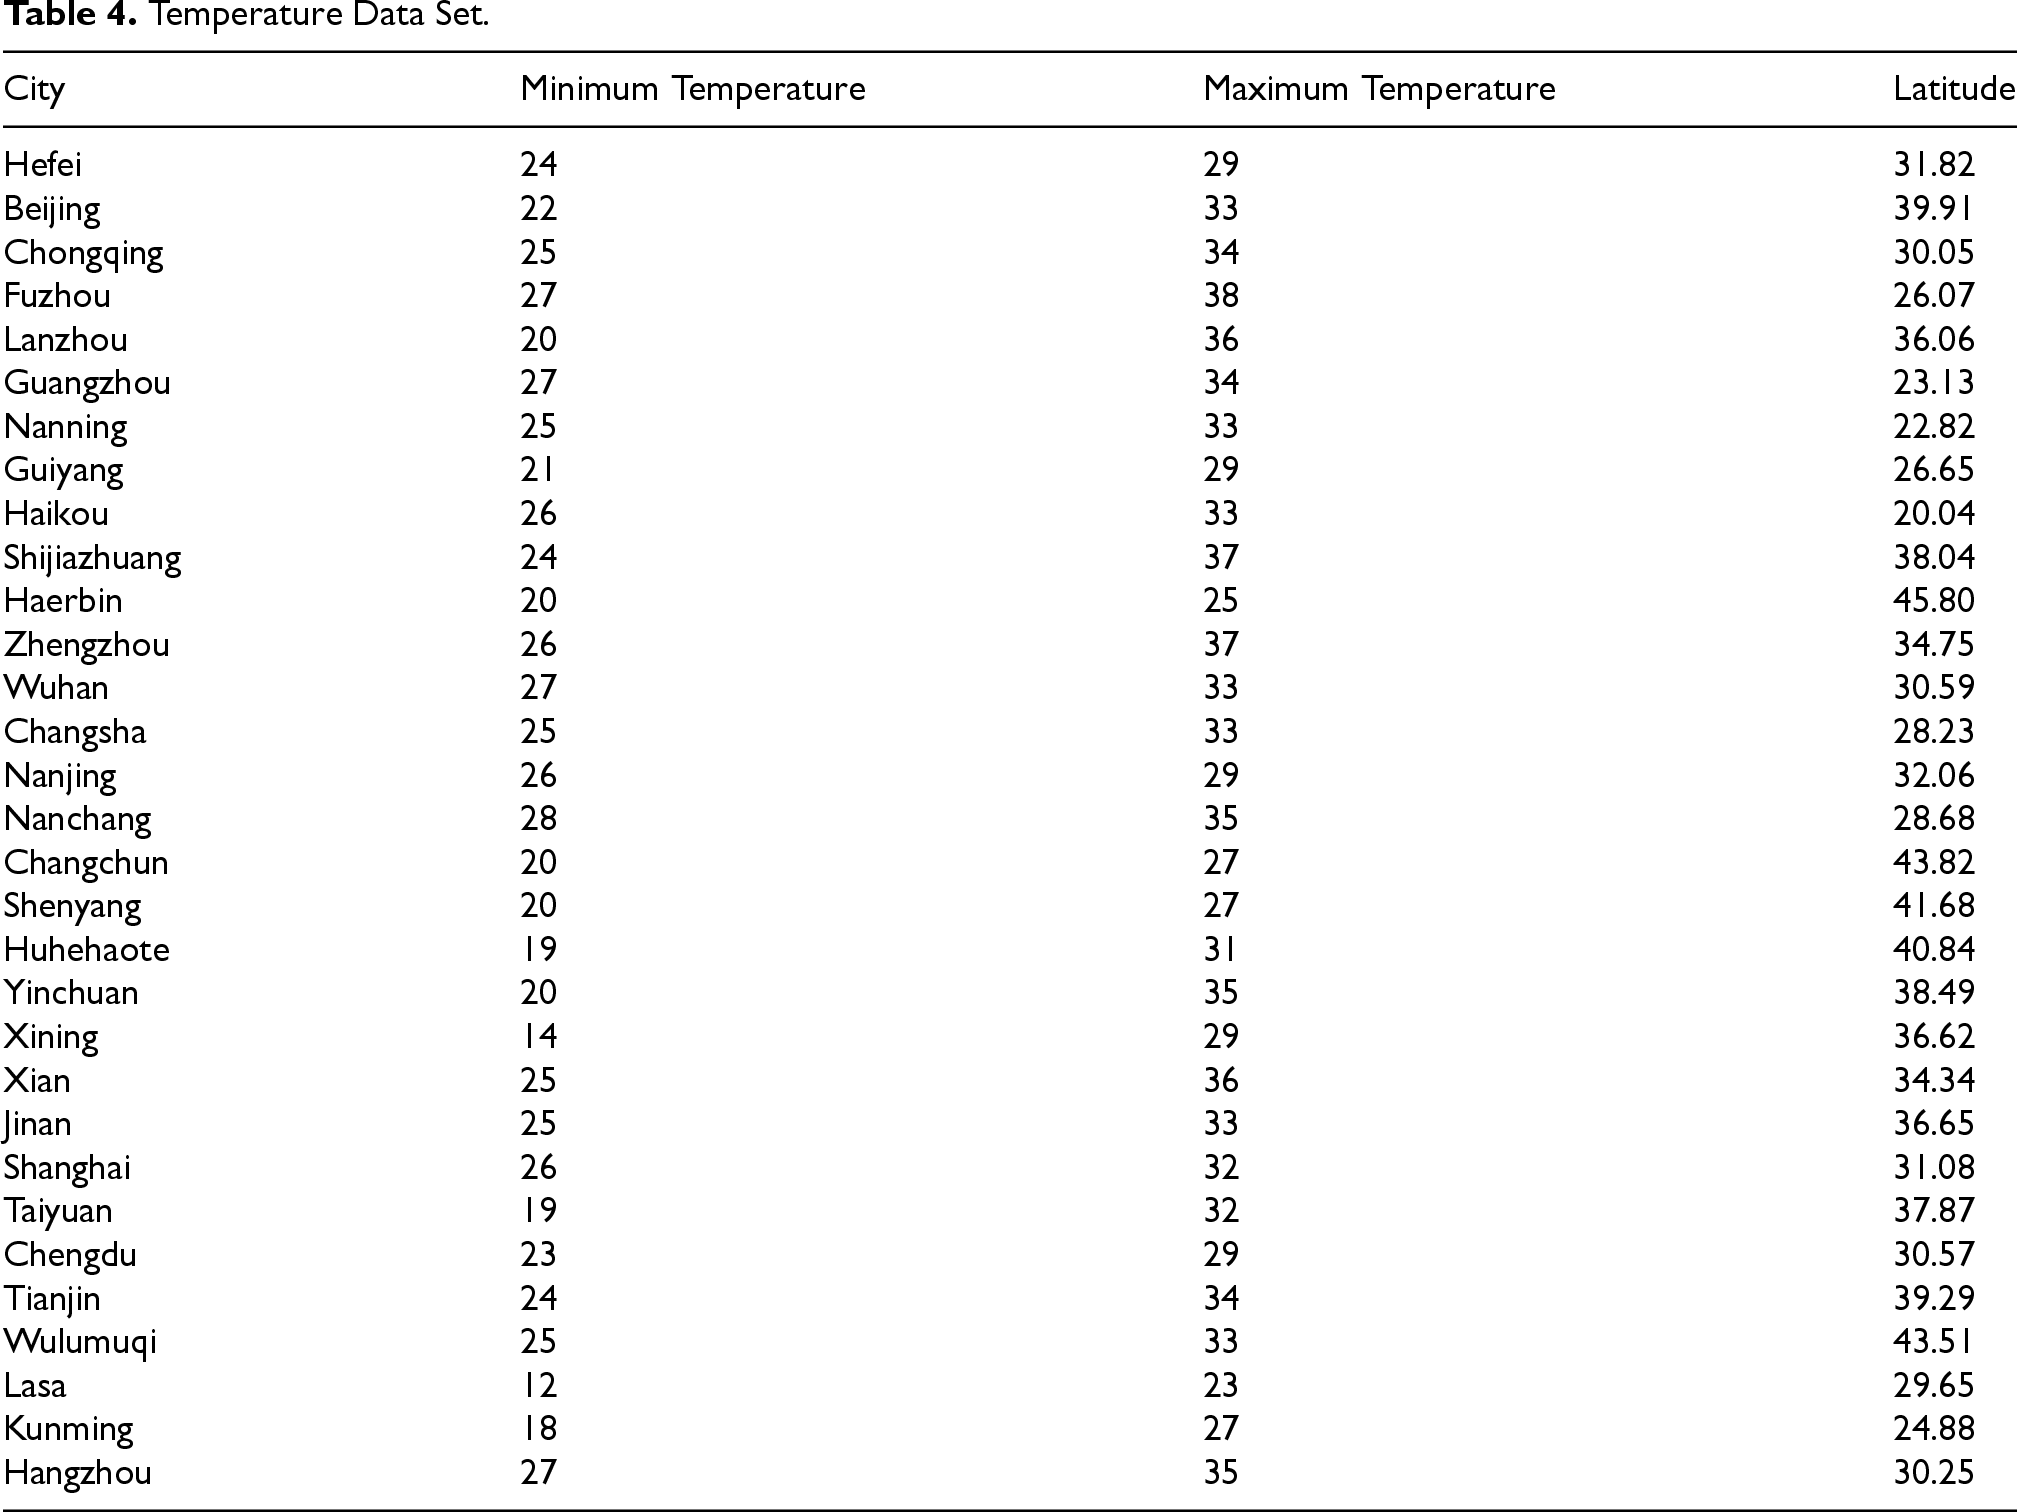
Temperature Data Set
Data Preparation
In this part, we select data of 31 cities from 31 provinces, autonomous regions in China (Excluding Hong Kong, Macao and Taiwan). Concretely, the response variable is air temperature, which is an interval consisting of the lowest and highest air temperatures on July 8, 2021 and the explanatory variable is latitude. The temperature data is sourced from Baidu Weather Forecast and the latitude data is collected from the website https://cn.bing.com/maps. Table 4 summarizes the corresponding data and Figure 1 displays the mean temperature of the day.
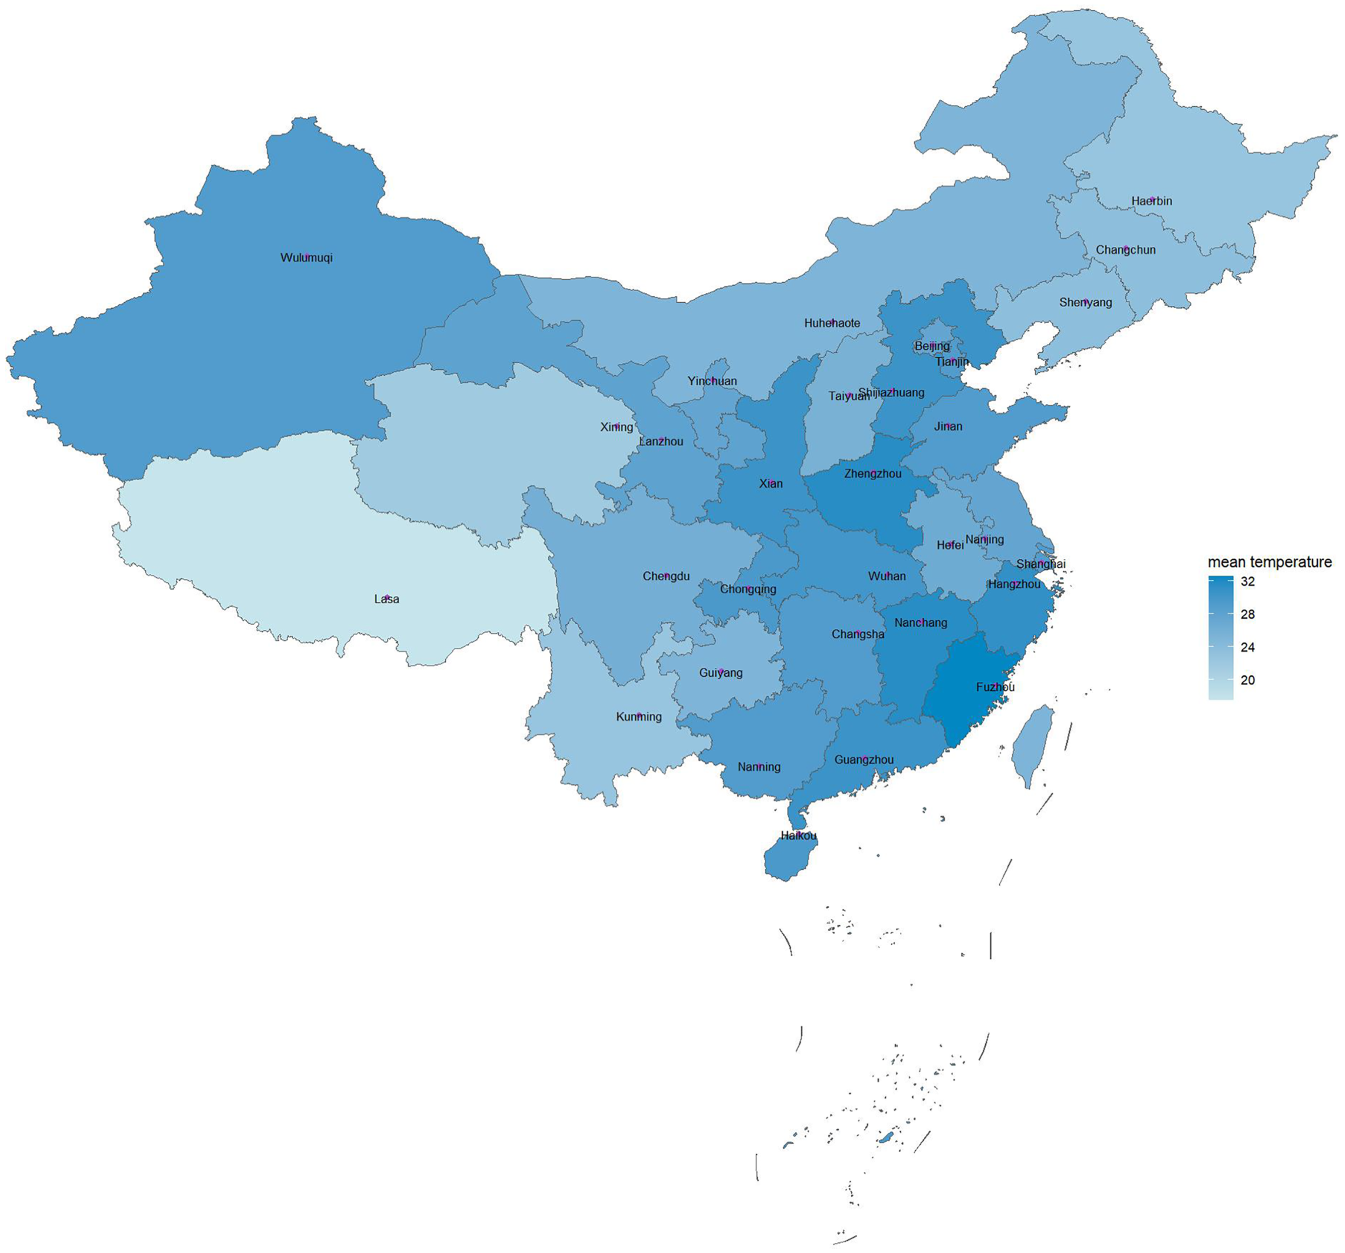
Mean Temperatures on July 8, 2021.
Temperature Data Set.
Before modeling and analysis, spatial autocorrelation test is conducted on the data. Firstly, the spatial autocorrelation test for model (3.1) is based on the spatial weight matrix, which is selected as the distance-based weight matrix
Step 1 For the
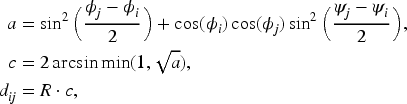
Step 2 Convert degrees to radians, i.e., we transform an angle 
Step 3 Calculate the distance between two cities with Haversine formula, which is widely used for calculating geographic spatial distances. For more information about geospatial distance, readers can refer to Sinnott (2984), Ningchuan (2016).
Step 4 If
Spatial autocorrelation is based on the dependent variable, which is denoted by the interval consisted of the lowest temperature and the highest temperature. Therefore, in the spatial autocorrelation test, general linear models can be used to model the lower and upper endpoints of the interval respectively.
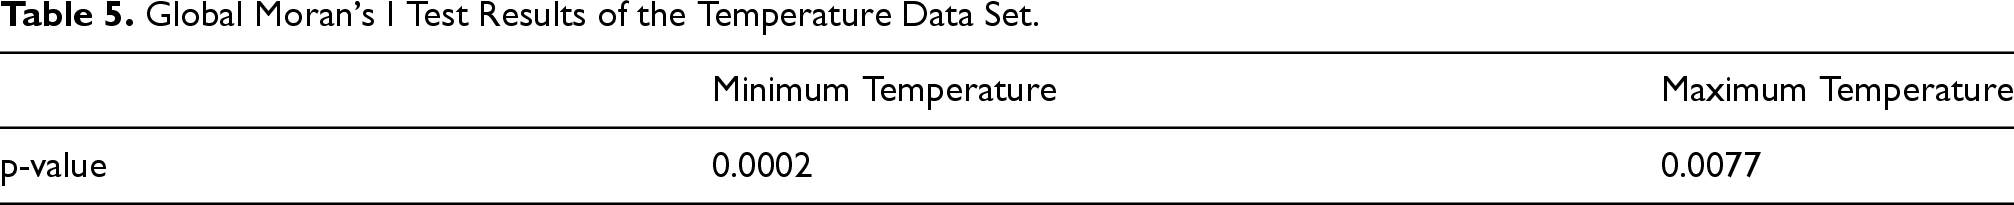
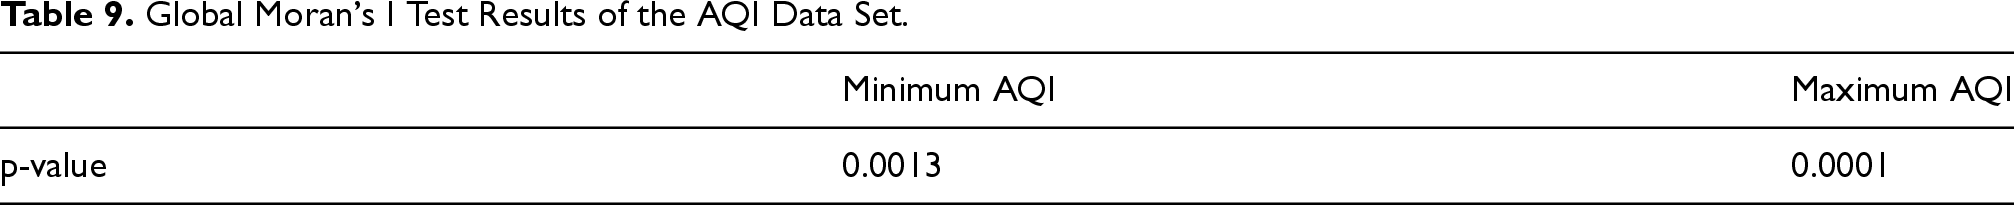
One of the main methods of the spatial autocorrelation test is to conduct global or local Moran’s I test. As can be seen from the Table 5, for the global Moran’s I test, the p values are less than the significant level of 0.05. Therefore, the original hypothesis is rejected and it is considered that the minimum and maximum temperatures of 31 provinces, cities and autonomous regions in China have a certain spatial autocorrelation.
Global Moran’s I Test Results of the Temperature Data Set.
Figures 2 and 3 are Moran scatter plots. It can be seen that the lowest and highest gas temperatures of 31 regions in China have positive autocorrelation, that is, the trend of high high and low low.

The Correlation Between the Minimum Temperature and the Spatially Lagged Minimum Temperature.

The Correlation Between the Maximum Temperature and the Spatially Lagged Maximum Temperature.
For the interval-valued spatial error model, the distance-based weight matrix is established in the way as that described in the
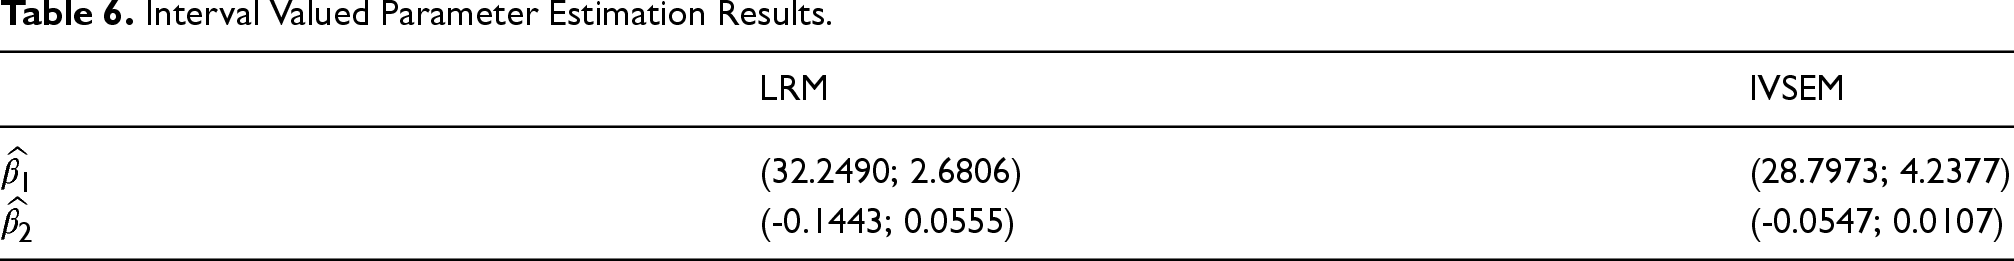
We present interval valued parameter estimation results in Table 6 and obtain the estimate of 
Interval Valued Parameter Estimation Results.
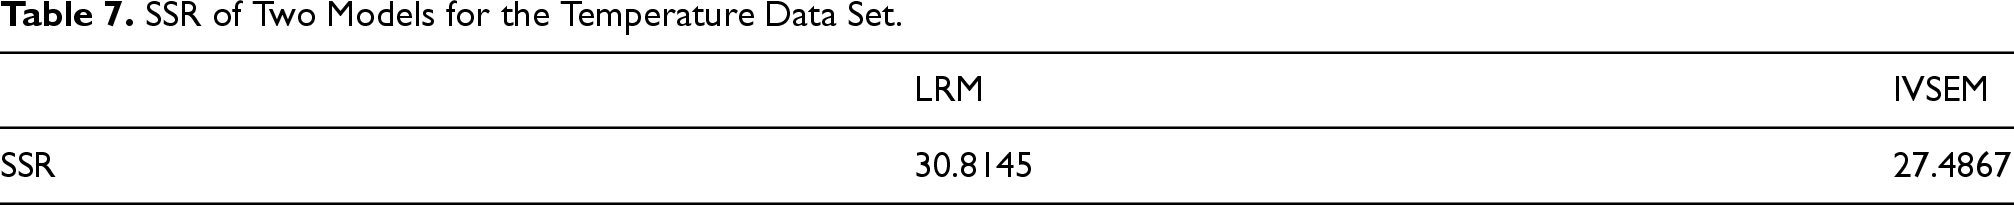
SSR of Two Models for the Temperature Data Set.
Refer to Songgui et al. (2004), we perform a regression diagnostic by plotting studentized residuals. First, we calculate studentized residuals in the next steps.
Step 1 Formulate (3.1) as

Step 2 Obtain the estimates
Step 3 Calculate

Second, we plot studentized residuals in Figure 4. It is visible that points

Studentized Residuals of the Spatial Model.
Figure 5, shows the fitted values of the IVSEM, where
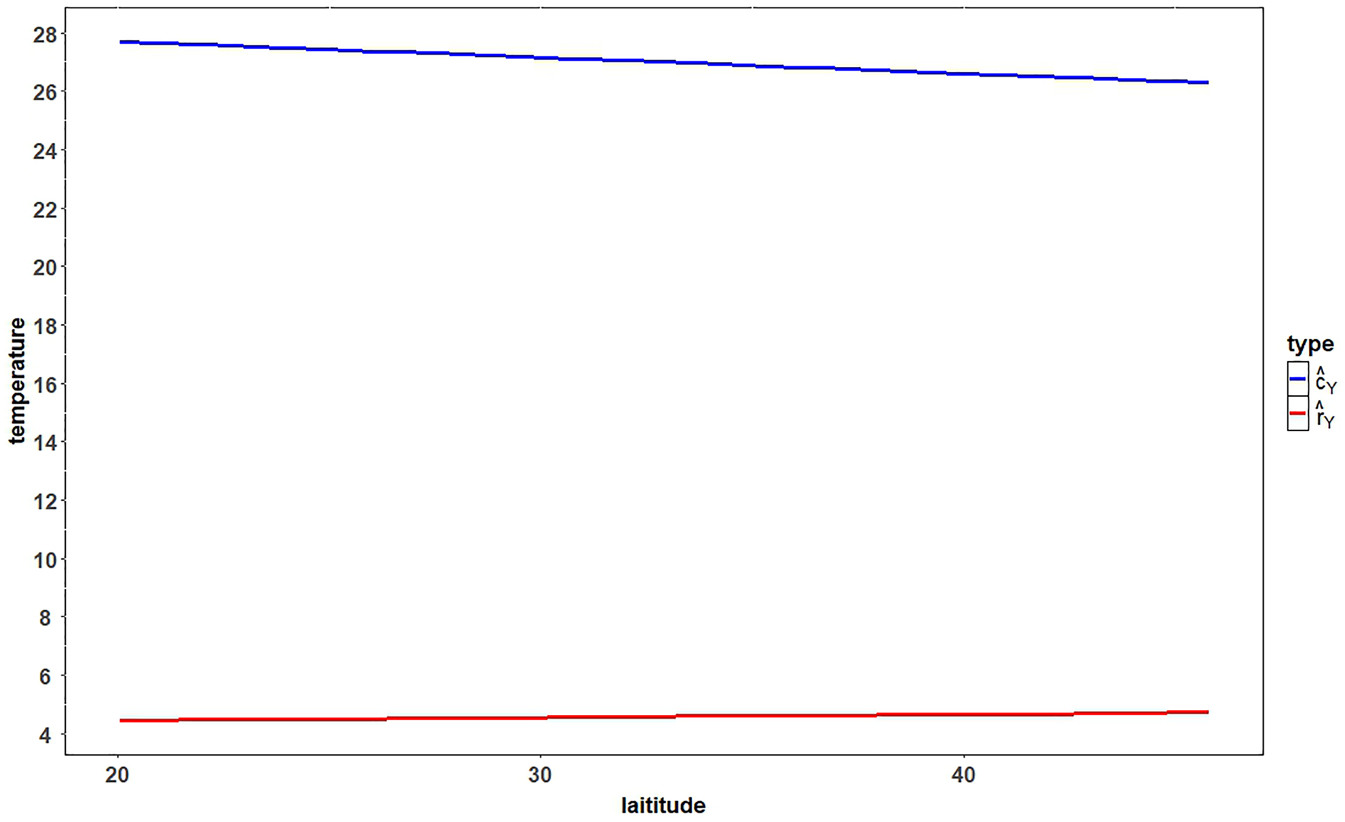
Fitted Lines of IVSEM.
Inspired by Qingqing et al. (2025), we collect air quality index(AQI) and real estate data sets in a similar way to how Qingqing et al. (2025) does. The AQI dataset collected from the website https://www.weather.com.cn/air/ is presented in Tables 8. We collect data regarding the AQI, air humidity, and wind speed for 31 cities on 31 July 2025 hour by hour, then we take the maximum value and the minimum value for AQI and the average value for other indicators.
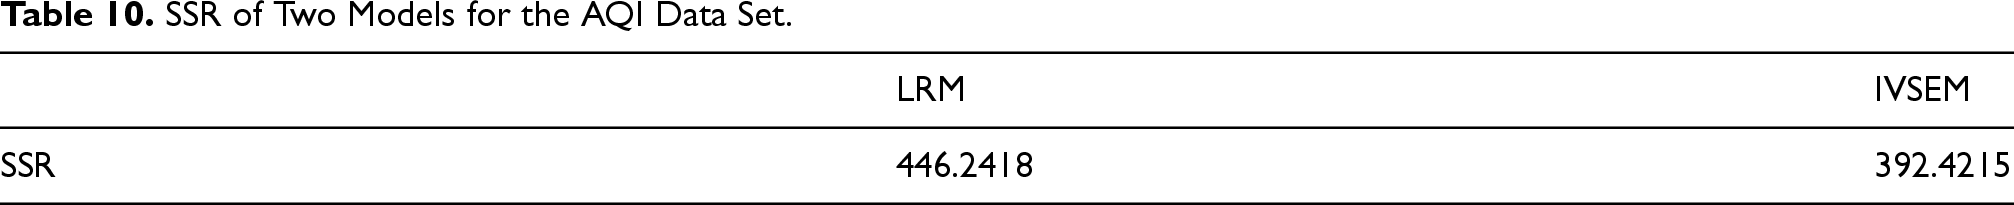
We select a distance-based spatial weight matrix with a specific threshold, which is determined as the distance between Wulumuqi and its nearest neighboring city. This threshold is chosen deliberately to ensure that the sum of each row in the spatial weight matrix equals 1. Based on the spatial weight matrix, we conduct the global Moran’s I tests for the minimum and maximum air quality indices(AQIs) respectively. Table 9 shows that AQIs of cities exist spatial correlation. Therefore, we build IVSEM for the data set and compare it to LRM in Table 10. The result indicates that it is better to consider the spatial information.
AQI Data Set.
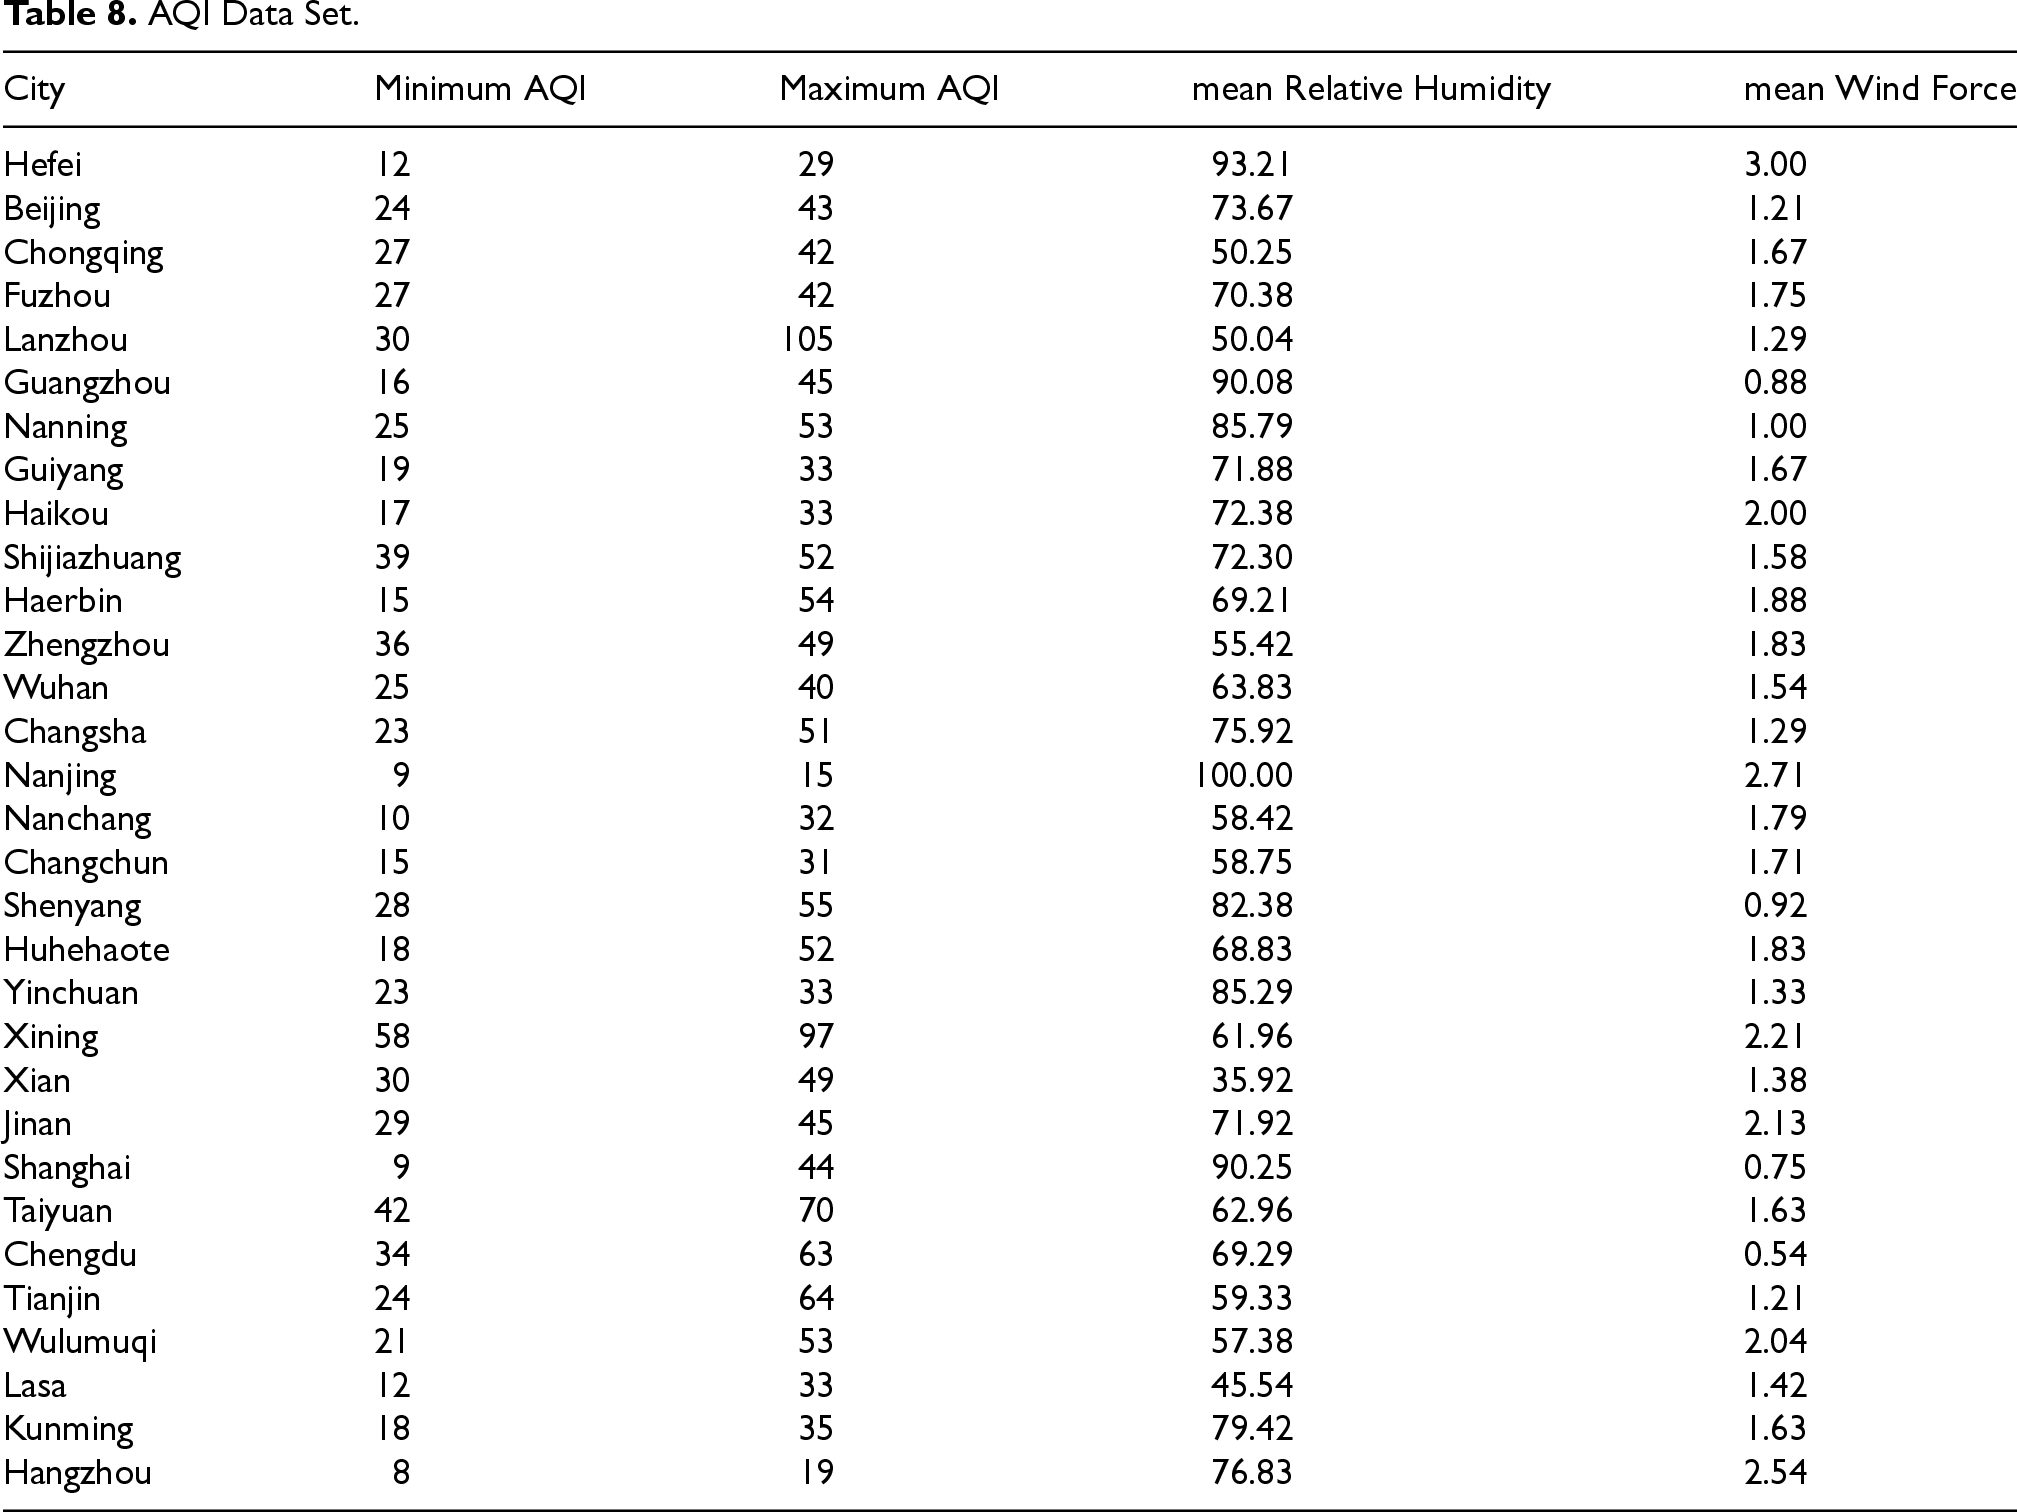
AQI Data Set.
Global Moran’s I Test Results of the AQI Data Set.
SSR of Two Models for the AQI Data Set.
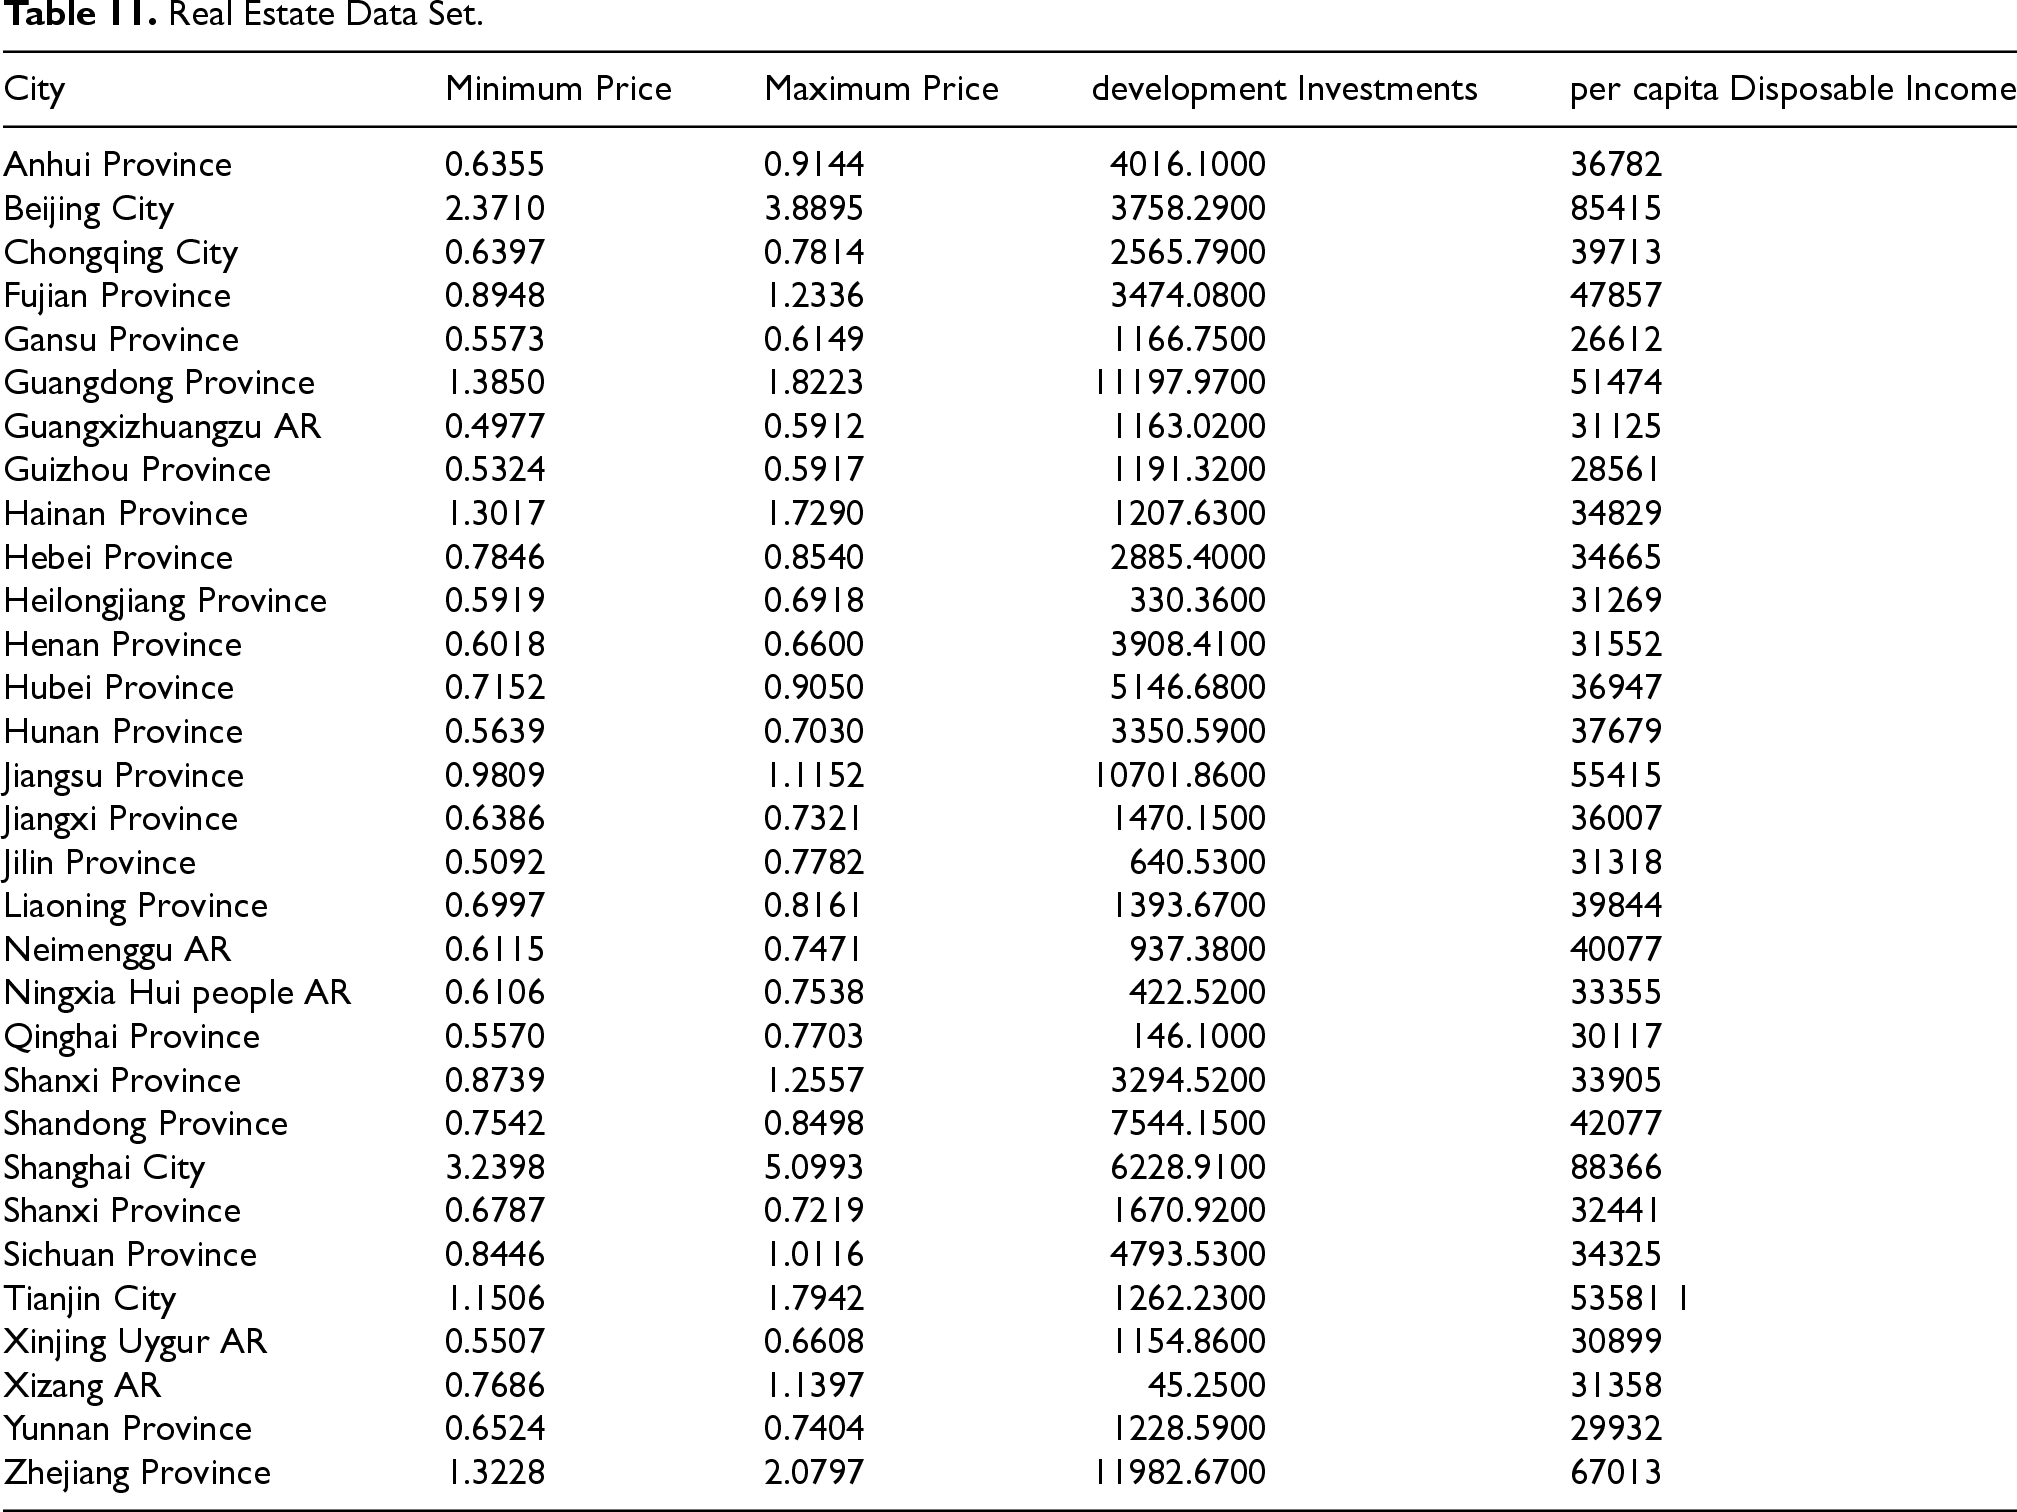
The data set collected from the website https://data.stats.gov.cn/ is shown in Table 11. The units for each indicator in the data are ten thousand yuan per square meter, ten thousand yuan per square meter, hundred million yuan, and yuan. For the maximum and minimum prices,we initially calculate the average monthly sales of commercial housing in each city, then take the highest and lowest values among these averages. We choose Queen contiguity matrix as the spatial weight matrix. Based on the spatial weight matrix, we carry out the global Moran’s I tests for the minimum and maximum prices respectively and build two models for the data set. Table 12 exhibits that prices of real estate of cities have spatial correlation. Table 13 indicates that is compared to LRM, IVSEM is somewhat more suitable for the data set.
Real Estate Data Set.
Real Estate Data Set.
Global Moran’s I Test Results of the Real Estate Data Set.

SSR of Two Models for the Real Estate Data Set.

This paper proposed a novel model, interval-valued spatial error model, for modeling and analyzing interval-valued data with spatial dependence. This model has two advantages, firstly, it can handle the interval-valued data instead of traditional point value data. Secondly, it considers the interdependence between spatial units. This model considers both data uncertainty and spatial dependence simultaneously. In this paper, We give the estimation method for unknown parameters, and prove the properties of estimation. The experimental simulation and real case displayed the advantages of interval-valued spatial error model. Through simulation comparison with non-spatial model, we can easily see that the proposed model is effective. When
The model in this paper is only available for some interval-valued data, such as when the response variable
As a quantitative expression of uncertainty, interval-valued data has wide applications in fields such as financial risk assessment, environmental monitoring, and social surveys. However, there are still significant gaps in current research in areas such as statistical analysis of interval-valued data with missing data, interval-valued nonlinear models, interval-valued nonparametric models and modeling analysis of interval-valued missing data, etc. And the statistical modeling analysis of interval-valued data has theoretical significance. It is of great significance for its application in other fields.
Footnotes
Acknowledgment
The authors are grateful to the anonymous editors and reviewers for their valuable comments and suggestions, which improved this paper. The authors would like to thank the National Social Science Fund of China No.19BTJ017 for its financial support.
Funding
The authors received no financial support for the research, authorship, and/or publication of this article.
Conflict of Interest Statement
The authors declared no potential conflicts of interest with respect to the research, authorship, and/or publication of this article.