
Abstract
Neutrosophic fuzzy (NF) sets provide a powerful mathematical framework for modeling uncertainty, indeterminacy, and inconsistency features that are inherent in many real-world decision-making and data analysis problems. This study introduces two novel, axiomatically validated distance measures designed to improve analysis within NF environments. Existing distance measures often struggle with high indeterminacy and lack critical axiomatic properties, leading to unreliable outcomes in decision-making and pattern recognition. We benchmark their performance against state-of-the-art alternatives using a new NF pattern recognition algorithm. To demonstrate practical utility, the measures were integrated into the NF-TOPSIS method for multi-criteria decision-making and the NF-CLUSTER algorithm for data clustering, tested on both synthetic and real-world datasets. Experimental results confirm our measures consistently outperform existing ones, producing more discernible rankings and more cohesive clusters with an improved validity index. These findings establish a robust and effective framework for quantifying dissimilarity between NF sets, significantly advancing applications under high uncertainty and indeterminacy.
Keywords
Introduction
Effectively modeling the pervasive uncertainty inherent in real-world systems presents a significant challenge, frequently surpassing the descriptive power of classical set theory's binary logic. Zadeh introduced the concept of fuzzy sets in a foundational effort to address this limitation. These sets utilize graded membership values to quantify degrees of partial belonging, thereby accommodating vagueness and imprecision within system representations (Zadeh, 1965). Building upon this paradigm, Atanassov (1999) proposed intuitionistic fuzzy sets, which incorporate both a degree of membership and a distinct degree of non-membership. The sum of these two degrees is constrained not to exceed unity, implicitly defining a margin for hesitation or indeterminacy (Atanassov, 1999). Subsequently, to explicitly manage situations involving indeterminate and inconsistent information, Smarandache developed neutrosophic sets. These are characterized by three independent components representing degrees of truth, indeterminacy, and falsity (Smarandache, 2005). For enhanced practical applicability and computational manageability, Wang et al. later introduced single-valued neutrosophic sets. This formulation restricts the domains of the truth, indeterminacy, and falsity components to a standard numerical interval, thereby providing a more tractable tool for many applications grappling with complex uncertainties (Wang et al., 2010). This evolutionary trajectory underscores the continuous refinement of mathematical frameworks designed to represent increasingly sophisticated manifestations of uncertainty encountered across diverse scientific and engineering disciplines. Further exemplifying this trend, practical implementations of single-valued neutrosophic formalisms, such as those discussed by Das et al. under the term neutrosophic fuzzy (NF) sets and single-valued neutrosophic fuzzy sets, also adopt this standardized numerical constraint for their truth, indeterminacy, and falsity components, facilitating their application (Das et al., 2020).
The distinctive capacity of NF sets to address vagueness, inconsistency, and indeterminacy simultaneously has fueled their adoption across diverse scientific and engineering disciplines. Their enhanced representational power is particularly valuable in decision-making, notably within multi-criteria (MCDM) and multi-attribute group decision-making (MAGDM) (Das et al., 2020; Nafei et al., 2024). Exemplary applications include optimizing supplier selection under ambiguous criteria (Saeed & Rahman, 2021), selecting industrial machinery with imprecise specifications (Nafei et al., 2024), and analyzing efficiencies in complex systems like water treatment (Majumder et al., 2023). In medicine, they aid diagnosis, with tools like Hausdorff distance facilitating comparisons of uncertain patient data (Mathews et al., 2024). Their descriptive power also benefits pattern recognition and data clustering (DalKılıç & Demirtaş, 2025), and in finance for modeling asset returns and portfolio optimization, incorporating market indeterminacy through concepts like neutrosophic covariance (Boloș et al., 2023). Moreover, NF sets integrate with other theoretical frameworks, including soft set theory (Khalil et al., 2020) and hypersoft set structures for scenarios involving attributes with sub-attributes, as seen in IoT healthcare monitoring (Khalaf et al., 2025; Saeed & Rahman, 2021). These varied applications underscore NF sets’ growing importance and adaptability for tackling multifaceted real-world problems characterized by complex uncertainties. A vast array of tools has been developed, including adaptations of classical MCDM methods like TOPSIS and VIKOR, various aggregation operators to synthesize information, and numerous distance, similarity, and cross-entropy measures to quantify relationships between NF sets (DalKılıç & Demirtaş, 2025; Das et al., 2020). These tools provide a robust foundation for structured decision-making under complex neutrosophic uncertainty.
However, despite the proliferation of these methods, a critical analysis reveals several persistent challenges. While foundational tools like aggregation operators and decision-making frameworks have their own limitations, such as sensitivity to unreliable data, a particularly pressing issue lies within the core task of quantifying the difference between NF sets. Many existing distance and similarity measures, while valuable, suffer from significant weaknesses. They often produce counter-intuitive results in specific edge cases, such as when sets are highly dissimilar or contain conflicting information. Furthermore, they can be insensitive to subtle variations across the truth, indeterminacy, and falsity components, and may fail to satisfy all desirable mathematical properties under rigorous scrutiny. These deficiencies compromise the reliability, accuracy, and robustness of any NF set-based methodology, leading to ambiguous scores and potentially flawed outcomes in applications like medical diagnosis and decision-making (Abed et al., 2023). These shortcomings highlight a clear and urgent need for more theoretically sound, flexible, and intuitive measures.
Motivated by these challenges, this paper aims to address these limitations by introducing a novel approach to NF information processing. The main contributions of this study are as follows:
Proposing two novel distance measures for NF sets, rigorously validated through axiomatic analysis and comprehensively compared with state-of-the-art (SOTA) measures. Developing a new pattern recognition algorithm in the NF context to evaluate the reliability of the proposed distances, with comparative analysis against SOTA distances. Demonstrating the practical effectiveness of the proposed distances by integrating them into the NF-TOPSIS method for MCDM. Validating the applicability of the proposed distances through their implementation in the NF-CLUSTER algorithm, with benchmarking against SOTA alternatives.
The rest of this paper is structured to systematically address the research problem. We begin in Section 2 by reviewing the fundamental concepts of NF sets and their application in decision-making and clustering. Building upon this foundation, Section 3 introduces our novel distance measure, along with a rigorous demonstration of its metric properties. To validate its effectiveness, Section 4 conducts a comprehensive comparative analysis, evaluating our measure against SOTA distances through TOPSIS and Clustering methodologies. The paper concludes in Section 5 with a summary of our contributions and a discussion of future research directions.
(Das et al., 2020) An NF set K over X is defined by
In this paper, let
(Bui et al., 2023)
(Nafei et al., 2024) Let
(Bui et al., 2023) The distance measure between K and L is a function
(Bui et al., 2023) For all

Without loss of generality, the SOTA measures between NF sets are provided through mathematical formulas in Table 1.
The SOTA Measures in NF Context.

In today's world, every problem is highly complex and involves multiple factors. To address these problems, we must propose solutions and select the optimal one. However, finding an appropriate solution in a complex environment can be challenging. MCDM in an NF environment is the approach to solving problems characterized by complexity and uncertainty. The application of the TOPSIS method to MCDM problems in an NF environment is widespread in various fields, including supply chain management, financial management, engineering and production, and human resource management. The TOPSIS method selects a solution closest to the positive ideal solution and farthest from the negative ideal solution. It offers high accuracy in decision-making, the ability to process multiple criteria simultaneously, flexibility, ease of application, and time efficiency. Therefore, MCDM in an NF environment using TOPSIS (NF-TOPSIS) is optimal for handling complex decision problems (Nafei et al., 2024). The NF-TOPSIS method is presented in detail in Algorithm 1.

Clustering analysis is a foundational data mining method to group similar observations, thereby uncovering hidden patterns and underlying structures within data (Bui et al., 2021; Ejegwa et al., 2024; Guo & Sengur, 2015; Xu et al., 2008). Its diverse applications span pattern recognition, image analysis, bioinformatics, and machine learning (Hu et al., 2022; Khan et al., 2020). However, traditional algorithms like k-means struggle significantly with uncertain or imprecise datasets. To overcome these limitations, fuzzy clustering techniques were developed (Ciaramella et al., 2020; Zhang & Cai, 2021). These methods generally fall into two categories. Objective function-based approaches, such as the widely used Fuzzy C-means, aim to optimize a mathematical function reflecting clustering criteria, like minimizing intra-cluster distances (Bezdek, 1981; Ciaramella et al., 2020; Dunn, 1973; Zhang & Cai, 2021). Alternatively, relational matrix-based methods evaluate pairwise similarities or dissimilarities between data points (using measures like correlation coefficients Saeed & Rahman, 2021 or similarity metrics Ruspini et al., 2019; Ye, 2017), creating a matrix that is then partitioned into fuzzy clusters (Ciaramella et al., 2020; Zhang & Cai, 2021). While enhancing clustering in uncertain environments, these fuzzy approaches still face challenges when dealing with data containing inconsistencies and indeterminacy.
The NF clustering (NFC) problem is an important research area in the NF set theory, which focuses on clustering objects that are fuzzy and uncertain. Prominent methods for this task include neutrosophic C-means, neutrosophic K-means, and Hierarchical neutrosophic clustering. These methods extend traditional clustering techniques by incorporating the four components of the NF sets, allowing for a more comprehensive and accurate representation of complex and uncertain data. The importance of these methods lies in their ability to improve the accuracy and efficiency of clustering, especially in applications such as pattern recognition, image processing, and data analysis, where uncertainty and ambiguity play an essential role. Bui et al. (Bui et al., 2025) introduced a distance-measure-based algorithm using a relational matrix approach for clustering in the NF environment, which is presented in detail in Algorithm 2.

This section introduces two novel distances for NF sets. These new measures are demonstrated to be well-defined, and their properties are validated through mathematical reasoning. Let
The real functions 

For
For Obviously If If Moreover,
So,
Let 
The measures between K and L are presented in Table 2.
The Measures Between K and L in Example 3.1.

Let 


The Measures Between

Let
A key advantage of the proposed measures is their robustness under extreme conditions. Specifically, they maintain their validity by ensuring the distance value remains within the
In scenarios of maximal dissimilarity, where one entity possesses optimal attributes while another possesses the worst, the calculated distance correctly approaches 1. This behavior is not only intuitive but also confirms that the measure is well-behaved, consistently adhering to the
Let 


Table 4 provides a comparison of the distances between set K and the other sets, contrasting the results from our proposed measure with those from established SOTA techniques.
The measures Between A and the Other Sets in Example 3.4.

In Example 3.4, set A is considered a fixed reference, against which sets
The identical results produced by our two proposed measures in Example 3.4 are not coincidental but rather an intentional demonstration of their behavior under the specific symmetric conditions of the T, I, and F components. This scenario was deliberately constructed to illustrate this theoretical property. Crucially, this response to symmetry distinguishes our measures from other SOTA distances; under the same conditions, the Hamming (
For
For all 


Hence, 
In which,
Hence,
For
The Results are Directly Deduced from the Definitions 2.2, 2.4 and 3.1. The Results are Directly Deduced from the Definitions 2.2, 2.4, 3.1 and the Following lemma: for any Real Numbers
The proof of (3) is similar to that of (1).
Two measures
With the SOTA measures in Table 1 (Definition 2.5),
For For all We have: Thus, On the other hand,


Through numerical calculations, we get Through numerical calculations, we get:


The results are directly deduced from ideals (1) and (2). Let
Let If
in which
The results are directly deduced from the Definitions 2.2 (3), 3.1 and Proposition 3.2.
For p
The results are directly deduced from the Definition 2.5 and Proposition 3.1.
To empirically validate the effectiveness and applicability of our proposed distance measures, we conduct a comprehensive evaluation across three key tasks: pattern recognition, MCDM, and clustering. The evaluation employs a new custom-designed pattern recognition algorithm. Furthermore, we also apply the NF-TOPSIS method for the MCDM problem, and the NF-CLUSTER algorithm for the clustering task. These experiments are benchmarked on two well-established datasets from the literature: Machine Selection in (Nafei et al., 2024) and Educational Support in (Bui et al., 2023).
4.1. Pattern Recognition with NF-PATTERN
Pattern recognition stands as a cornerstone in numerous information processing systems, particularly those grappling with ambiguity, vagueness, and incomplete information inherent in real-world data. In such contexts, the ability to accurately classify an unknown pattern by comparing it against a set of predefined prototypes is paramount. Distance or similarity measures serve as the fundamental mathematical tools for quantifying the degree of resemblance or dissimilarity between patterns. The advent of neutrosophic sets and subsequently NF-sets as an extension has provided a sophisticated framework for representing complex patterns. NF-sets are particularly adept at capturing nuanced information by explicitly modeling truth, indeterminacy, and falsity components associated with pattern characteristics, along with a membership grade in the universe of discourse. This enriched representation necessitates the development and application of robust distance measures tailored for the NF-set domain to enhance the precision and reliability of pattern recognition tasks.
4.1.1. Proposed Algorithm
The proposed algorithm builds upon well-established pattern recognition techniques from fuzzy (Yawei et al., 2005), intuitionistic fuzzy (Hatzimichailidis A et al., 2012) and NF domains (Luo et al., 2022). This algorithm provides a structured approach to classify an unknown pattern by evaluating its proximity to a collection of known patterns. The detailed procedural steps of this algorithm are delineated in Algorithm 3.

The proposed NF-PATTERN algorithm consists of the following three stages:
- Distance Computation in Step 1: At first, a vector of distances is computed by applying a distance measure between the input dataset and each dataset in the reference set. Each element in this vector represents the dissimilarity of the input to a specific reference class.
- Classification via Minimum Distance in Step 2: The classification is performed by identifying the reference dataset corresponding to the minimum distance,
- Reliability Assessment in Step 3: For each successful classification, we quantify its confidence using a Degree of Confidence (DOC) index. The DOC is calculated as the sum of absolute differences between all computed distances and the uniquely identified
4.1.2. Illustration and Comparison
The NF-PATTERN algorithm is versatile and can be implemented with any suitable distance measure defined for NF-sets. In the subsequent sections, we will illustrate its application using the newly proposed distances (
The primary objective of this section is to empirically demonstrate the operational behavior of the NF-PATTERN algorithm and, more significantly, to undertake a comparative assessment of the proposed distances (
The Examples 4.1 and 4.2 are designed to create scenarios where the nuanced characteristics of
Let
be NF sets over
where


The pattern results based on Algorithm 3 are presented in Table 5.
The Pattern Results for C in Example 4.1.

Let
be NF sets over
where


.
The pattern results based on Algorithm 3 are presented in Table 6.
The Pattern Results for C in Example 4.2.

The evidence presented in Tables 5 and 6 reveals that the proposed measures,
and
, exhibit the highest DOCs, indicating their superior reliability and effectiveness. This advantage is further corroborated by Examples 3.3, 4.1, and 4.2, which illustrate
‘s capacity to surpass current SOTA measures by addressing their limitations. These improvements directly translate to enhanced accuracy in multi-criteria decision-making and more robust clustering in neutrosophic fuzzy environments, especially under significant complexity and uncertainty conditions.
A key contribution of our proposed measures,
, lies in their enhanced robustness for pattern recognition under uncertainty. Our experiments reveal that both measures consistently outperform traditional methods, yielding higher classification accuracy in two critical situations: (1) separating classes with closely related characteristics, and (2) analyzing datasets with significant fuzziness or incomplete information. This enhanced performance is crucial because it demonstrates the measures’ practical viability for real-world applications where data is rarely perfect. Ultimately, these results establish that
not only advance the SOTA in terms of accuracy but also make neutrosophic fuzzy models more reliable and applicable to complex, uncertain environments.
The Pattern Results for C in Example 4.1.
The Pattern Results for C in Example 4.2.
A key contribution of our proposed measures,
Our experimental methodology adopts the standard NF-TOPSIS framework. To specifically isolate and evaluate the impact of the distance measure, the central focus of this study, we introduce only one modification to the original procedure. The core change occurs in Step 4, where the standard distance calculation is replaced by our proposed formulas and, for benchmarking purposes, by several SOTA measures. All other components of the algorithm, including the procedural logic of Steps 1–3 and 5 and the parameter settings, are maintained in strict accordance with the original source publications. This approach ensures that any observed differences in performance can be directly attributed to the choice of distance measure.
4.2.1. Machine Selection Scenario
The strategic selection and prioritization of manufacturing equipment constitute a pivotal decision-making process for optimizing operational performance and resource allocation within industrial enterprises. This investigation addresses such a scenario, focusing on a manufacturing facility equipped with four distinct production units: Machine 1 Efficiency: Measures the machine's overall productivity and resource utilization. Key factors include processing speed, output capacity, product yield, material waste, and its direct contribution to profitability. Flexibility: Evaluates the machine's capacity to adapt to operational changes. This encompasses its ability to switch between different products, workflows, or batch sizes, a critical factor for responding to dynamic market demands and maintaining a competitive edge. Reliability: Quantifies the consistency and dependability of the machine's performance. It is technically defined as the probability of failure-free operation for a specified duration under given conditions, directly impacting maintenance costs and production uptime.
The decision-making process involves a panel of three experts, EX1, EX2 and EX3, who are tasked with assessing the machines to determine the most preferable option. The input data for this MCDM problem includes individual evaluation matrices provided by each expert and a set of weights assigned to the aforementioned performance attributes. The relative influence of the decision-makers in the aggregation of judgments is defined by weights of
Decision Values from Expert 1, 2, 3 and Weight for Attributes (Nafei et al., 2024).

Decision Values from Expert 1, 2, 3 and Weight for Attributes (Nafei et al., 2024).
The evaluation data from the three experts (EX1, EX2, and EX3) are compiled into the decision matrices shown in Table 7. Within each matrix, the four machine alternatives (M1–M4) are evaluated against the three key criteria. Each assessment is captured as a neutrosophic fuzzy number to effectively model the inherent uncertainty and imprecision in the experts’ judgments. To account for the subjective nature of expert evaluations, the table also incorporates the distinct attribute weights assigned by each expert (EX1, EX2, and EX3). These weights explicitly capture each expert's individual priorities, reflecting their differing views on the relative importance of the criteria.
The empirical dataset, as meticulously detailed in Table 7, served as the primary input for applying the NF-TOPSIS. The procedural framework for this application is formally described in Algorithm 1. In the initial analytical phase, the NF-TOPSIS methodology was executed utilizing the specifically proposed distance
The Steps of NF-TOPSIS 1 by Applying Proposed Distance

*Symbol “–” indicates the corresponding step/result was skipped in this situation.
The NF-TOPSIS framework was subsequently applied using SOTA, and distance measures were proposed to investigate the model's behavior further and for comparative assessment. This extension allowed for a broader examination of the solution space under varied computational assumptions. The comprehensive results derived from these supplementary applications are thoroughly documented in Tables 9 and 10, with salient trends and comparative performance visualized in Figure 1.
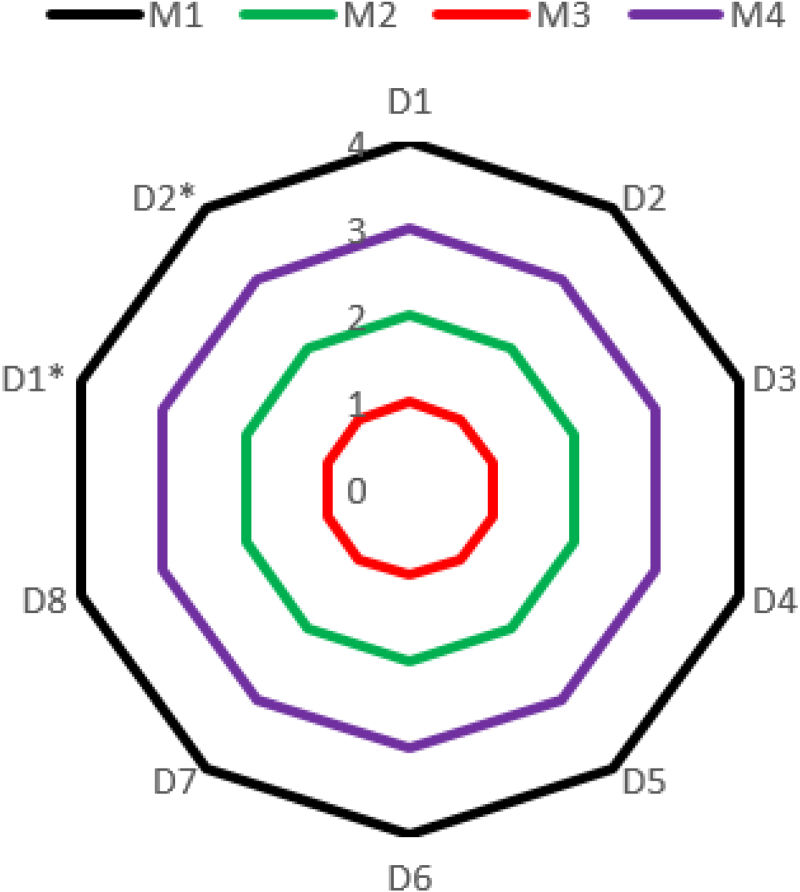
Classify Groups Based on Table 7 Using NF-TOPSIS With Measures.
Results with NF-TOPSIS When Applying SOTA and Proposed Distances.

Rank with SOTA and Proposed Distances Based on Table 7.

4.2.2. Education Decision-Making Scenario
The 2021 Vietnamese National High School Graduation Examination (NHSGE) required students to take three compulsory subjects (Mathematics, Literature, and English) and select one of two elective streams: Natural Sciences (Physics, Chemistry, Biology) or Social Sciences (History, Geography, Civic Education). Passing this examination was a prerequisite for high school graduation. Subsequently, for university admission, candidates select specific subject combinations, known as admission groups, which are aligned with their intended fields of study. These groups include Group A (Math, Physics, Chemistry), Group A1 (Math, Physics, English), Group B (Biology, Math, Chemistry), Group C (Literature, History, Geography), and Group D (Math, Literature, English).
Upper secondary education, typically three years comprising six semesters, provides the framework where each semester is an assessment criterion. End-of-semester evaluation reflect student cognitive development, effort, and diligence. These assessments aim to identify the optimal university admission subject combination (exam group) for students using a MCDM approach based on performance across all six semesters. In this context, the set of potential university admission subject combinations is defined as the alternatives, denoted by
This case study, adapted from (Bui et al., 2023), addresses the MCDM problem of selecting the optimal high school graduation exam subject group for an illustrative student, P. The relevant performance data is structured into a decision matrix in Table 11. In this matrix, the alternatives are the five available subject groups (A, A1, B, C, D), represented by the rows. The evaluation is based on six criteria (S1–S6), shown in the columns, which are formulated based on the student's historical academic scores. Each cell value quantifies the student's aptitude for an alternative against a specific criterion, represented as an NF number to model the ambiguities and inconsistencies inherent in academic performance.
The P's Learning Outcome Assessment Data Over 6 Semesters (Bui et al., 2023).

Based on data in Table 11, the NF-TOPSIS methodology utilized the SOTA and proposed distances. The results are presented in Tables 12, 13 and Figure 2. Significantly, evaluations conducted using the NF-TOPSIS across SOTA and proposed distances yielded results that were largely consistent with student P's actual performance in the 2021 NHSGE (Table 11).
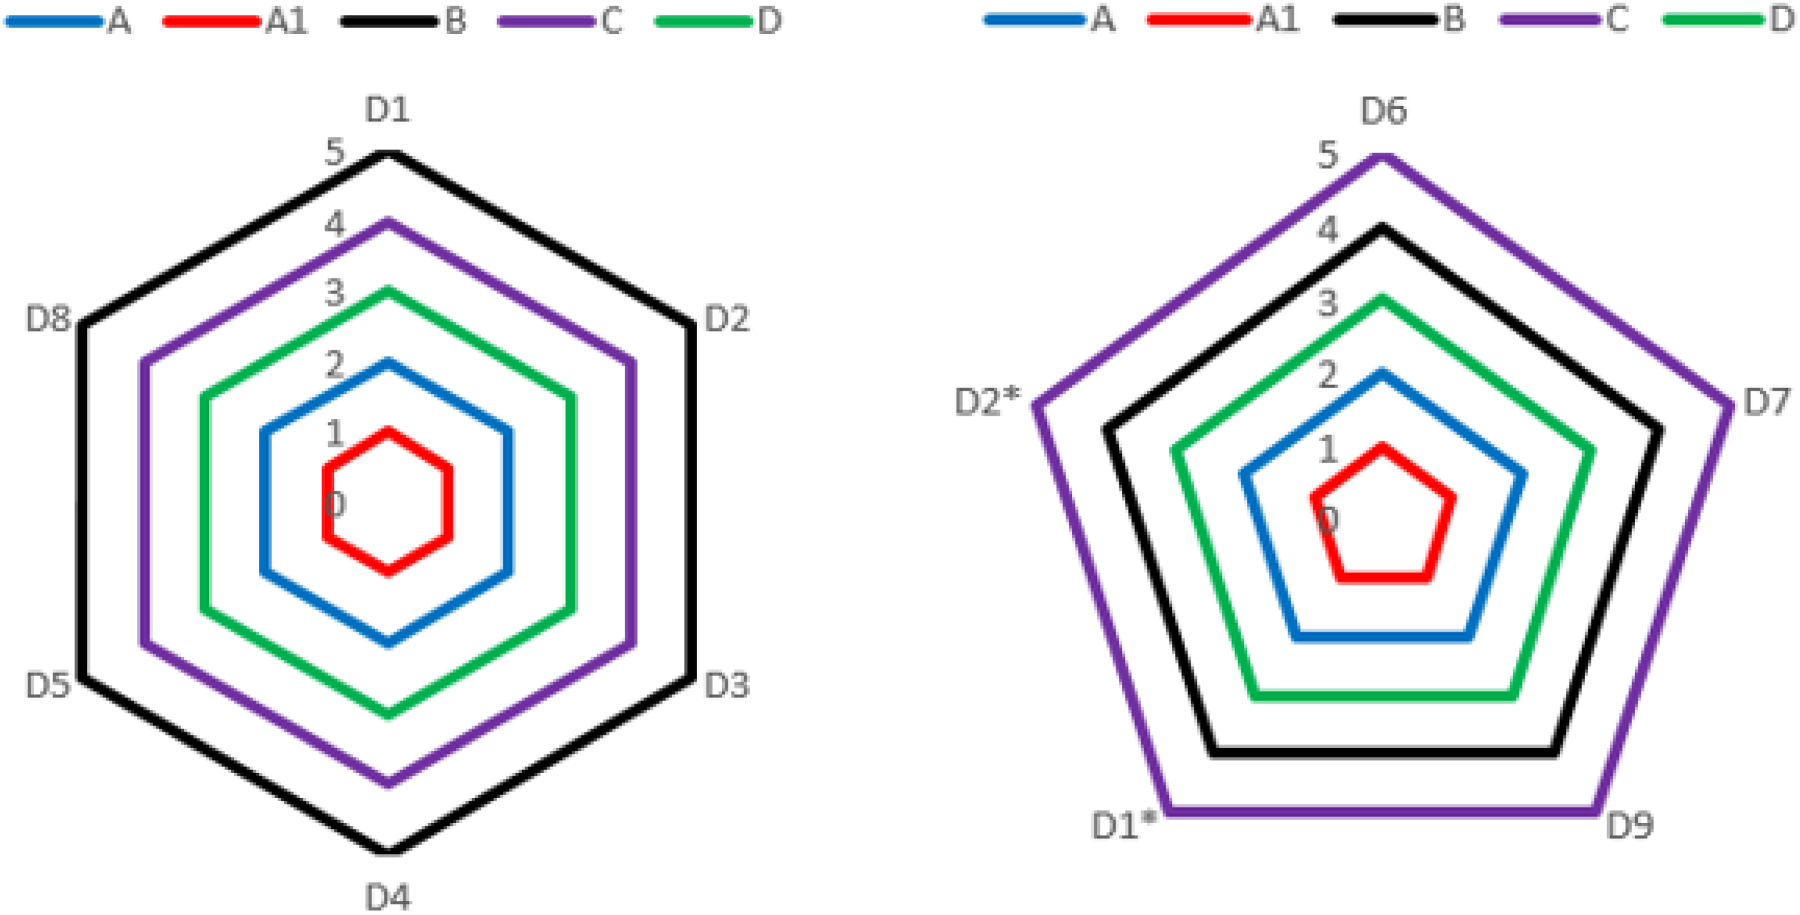
Classify Groups Based on Table 11 Using NF-TOPSIS With Measures.
Experimental Results with NF-TOPSIS Using SOTA and Proposed Distances.

Rank Results with SOTA and Proposed Distances Based on Table 11.

4.2.3. Discussions
Based on the experimental results in Tables 9, 12, 10, 13, it can be seen that the proposed distances, when applied in the NF-TOPSIS, still maintain the ranking order of the alternatives. This indicates that the proposed distance measures do not distort the evaluation results compared to SOTA measures, while ensuring stability and reliability in decision-making. However, when comparing the instrumental values of the measures (Tables 10, 13), the new ones show a more precise separation between the alternatives, especially between the choice types such as D, B and C, which tend to be close to each other in traditional measures. This increase in resolution improves the evaluation capability in scenarios with high competition or closely ranked priorities.
Therefore, the proposed distances not only preserve the correctness of the ranking order but also improve the analytical efficiency and practical applicability in multicriteria decision-making models under the neutrosophic fuzzy set environment.
The results affirm that the proposed new distance formulas have achieved two key objectives. First, these measures preserve consistency with existing methods, ensuring that the priority order of the alternatives is not arbitrarily altered. Second, the new measures enhance the ability to distinguish between alternatives, particularly in situations where the distances between them are very small. This improvement is significant in practical contexts, where alternatives have nearly equivalent priority levels, making the identification of the optimal alternative clearer and more convincing. The development of these new measures aims to address the limitations of existing SOTA measures, which sometimes lack sensitivity in distinguishing closely related alternatives while maintaining reliability and stability in ranking results. By combining both accuracy and stability, the proposed distance formulas provide high application value in MCDM problems under a neutrosophic fuzzy environment, assisting analysts and managers in making more informed choices in conditions of uncertainty and complexity.
4.3. Data Clustering with NF-CLUSTER
The next experiment uses a real dataset randomly selected from 20 high school students who graduated in the 2020–2021 academic year in My Tho City, Tien Giang Province, Vietnam (Bui et al., 2023). Before the NHSGE, a MCDM method was required to rapidly identify appropriate subject groups for these 20 students, utilizing the collected data. When considering the dataset comprising these 20 students, applying the NF-TOPSIS would likely involve a considerable computational duration for processing and deriving conclusions. Consequently, within this section, we opt to employ the NF-CLUSTER, to achieve more rapid result generation. This methodological choice also holds the potential for effective extension to manage and process substantially larger datasets with greater efficiency.
The dataset consists of 20 students, with academic performance recorded over 3 school years. In each year, the performance is assessed across 8 subjects, namely Mathematics (M), Physics (P), Chemistry (C), English (E), Biology (B), Literature (L), History (H), and Geography (G). Each cell in the table is represented in the form of a neutrosophic fuzzy number, reflecting the student's evaluation outcome in the corresponding subject.
Our experimental methodology for clustering utilizes the standard NF-CLUSTER framework. To specifically isolate and evaluate the performance of different distance measures, we introduce a single, targeted modification to the original algorithm. The core change occurs in Step 1, where the standard distance calculation is substituted with our proposed formulas and, for benchmarking, several SOTA measures. All subsequent stages of the algorithm (Steps 2–4), as well as the parameter settings, are maintained in strict accordance with the source publication. This controlled approach ensures that any variations in clustering outcomes can be directly attributed to the specific distance measure being tested.
4.3.1. Results
Based on the data collected, the NF-CLUSTER methodology was executed utilizing the specifically proposed distance
Experimental Results with NF-CLUSTER When Applying Distance

The NF-CLUSTER framework was subsequently applied using proposed distances to further investigate the model's behavior and for comparative assessment,
Results with NF-CLUSTER When Applying Proposed Distances

Confidence Level

4.3.2. Discussions
From Table 14, it is observed that in scenario 19, only a single cluster is formed. Scenario 18, however, yields two clusters, with student 5 being isolated into a separate cluster. This process of cluster identification was extended through subsequent scenarios. For instance, scenario 9 reveals a more detailed partitioning into several student groups: students 3, 10, 12, 14, and 20; students 6 and 18; students 17 and 19; students 8 and 11; and students 4, 13, and 15. Scenario 8 presents a slightly less granular clustering, with groups comprising: students 3, 10, 12, 14, and 20; students 6 and 18; and students 4, 13, and 15. The analysis was iteratively performed until a configuration of 20 distinct clusters was achieved, where each student effectively constituted their cluster. Throughout this iterative analysis, specific student cohorts consistently emerged: Students 3, 10, 12, 14, and 20; students 6 and 18; students 17 and 19; students 8 and 11; and students 4, 13, and 15.
Analysis of actual scores from Table 17:
Student 1 achieved a highest score of 26.6, tying in both Group B and Group D, a unique pattern not seen in other students. Student 2's highest score was 22.65 in Group D, which is comparatively lower than the top scores of other students. The score differences between the primary and secondary choices for several students are as follows:
- Student 3 (Group B): Highest score of 27.05, with the next highest of 26.00 in Group D (a difference of 1.05). - Student 4 (Group A1): Highest score of 27.9, with the next highest of 27.4 in Group D (a difference of 0.5). - Student 5 (Group A): Highest score of 25.5, with the next highest of 25.05 in Group A1 (a difference of 0.5). - Student 6 (Group D): Highest score of 23.2, with the next highest of 22.7 in Group A1 (a difference of 0.5). Similarly, the score differences for other students include:
- Student 9 (Group D): Highest score of 26.8, with the next highest of 26.05 in Group A. The difference between their scores in Group D and Group A is 0.75. - Student 11 (Group B): Highest score of 27.6, with the next highest of 25.85 in Group A (a difference of 1.75). A notable pattern emerges for students whose secondary choice was Group C:
- Student 17 (Group D): Highest score of 26.85, followed by 23.5 in Group C (a difference of 3.35). - Student 18 (Group D): Highest score of 26.06, followed by 21.5 in Group C (a difference of 4.56). - Student 19 (Group D): Highest score of 26.5, followed by 23.25 in Group C (a difference of 3.25). Based on these observations, several student cohorts emerge: Students 5, 6, 7, 8, and 10; students 3, 4, 12, 13, and 15; students 3, 9, and 11; and students 14, 17, 18, 19, and 20.
Actual Scores of 20 Students from NHSGE in 2021 (Bui et al., 2023).

Based on Tables 14 and 17, we observe that Students 3 and 12 are grouped. Similarly, Students 17 and 19 form a distinct pairing, and Students 4, 13, and 15 constitute another group.
The two measures,
It is worth noting that although both
In addition, experimental data shows that as the number of clusters decreases, the degree of separation between the clusters increases. This indicates that the remaining clusters become clearer and more distinct. This can help improve the ability to classify and identify groups within the data, while also minimizing overlap between clusters. From the above analysis, it can be concluded that the pairs
Despite the promising results, this study is not without its limitations. Firstly, the validation was conducted on two specific, albeit established, datasets. While this ensures comparability, the performance of the proposed measures and algorithm on larger, more heterogeneous, or real-time streaming data has not yet been explored. Secondly, our work concentrates on single-valued neutrosophic sets. The direct applicability and performance of these distance measures on other NS variants, such as interval-valued or bipolar neutrosophic sets, remain an open question that requires further investigation. Finally, a formal analysis of the computational complexity of the NF-PATTERN algorithm, particularly in comparison to other pattern recognition techniques, was beyond the scope of this paper.
Overall, Table 18 synthesizes the performance of our measures against established benchmarks and ensuring the results are more transparent.
Comparison of the Proposed Measures and SOTA Measures.

Comparison of the Proposed Measures and SOTA Measures.
This research introduces two novel NF distance measures and the NF-PATTERN algorithm, significantly advancing the handling of uncertainty. The effectiveness of these contributions was validated through successful integration into NF-TOPSIS and NF-CLUSTER, with experimental results on benchmark datasets confirming their stability and reliability. Theoretically, this work enriches the mathematical toolkit for NF sets. Practically, it provides decision-makers with more robust analytical tools, improving the quality of outcomes in applications like MCDM and data clustering.
The practical advantages are tangible, enhancing applications such as supplier selection by providing more reliable analysis of indeterminate information. However, the study has clear limitations. Its validation used specific datasets, its scope was limited to single-valued neutrosophic sets, and it lacked a formal computational complexity analysis of the NF-PATTERN algorithm. These factors constrain its proven generalizability and scalability.
Building on these limitations, future research should focus on three key areas. First, the proposed measures should be extended to other NS variants, including interval-valued and bipolar sets, to broaden their applicability. Second, the scalability and performance of the NF-PATTERN algorithm must be tested on large-scale, real-world datasets from domains like finance or medicine. Finally, a promising direction is to integrate these methods into hybrid intelligent systems, such as combining them with deep learning models, to create more powerful and sophisticated predictive tools that can simultaneously manage data uncertainty and learn complex patterns.
Footnotes
Acknowledgements
The authors express their sincere gratitude to Tien Giang University (TGU) for their enthusiastic support and for providing a conducive and inspiring research environment.
Funding
The authors received no financial support for the research, authorship, and/or publication of this article.
Declaration of Conflicting Interests
The authors declared no potential conflicts of interest with respect to the research, authorship, and/or publication of this article.