



Abstract
Sickle Cell Disease (SCD) is a hereditary blood disorder characterized by abnormally shaped red blood cells, causing anemia, vascular blockages, and severe health complications. Early and accurate diagnosis is essential, but access to reliable diagnostic tools is often limited in resource-constrained settings. This study proposes an automated image segmentation and classification pipeline to improve SCD detection. Using the ErythrocytesIDB dataset, which contains labeled erythrocyte images classified as circular, elongated, or irregular, Gaussian Filter is applied for denoising, followed by OTSU thresholding for segmentation. Data augmentation techniques, including rotation, shifting, and flipping, enhance model robustness and generalization. A Convolutional Neural Network (CNN) integrated with an attention mechanism is developed for accurate erythrocyte classification, and five optimizers: ADAM, SGD, RMSPROP, ADAMAX, and NADAM are systematically evaluated. Validation via 5-fold cross-validation demonstrates that the proposed preprocessing and augmentation steps significantly improve performance. The CNN with attention optimized using NADAM achieves the highest test accuracy of 98.33%, outperforming baseline and recent state-of-the-art models. The proposed pipeline provides a reliable, efficient, and scalable solution for automated SCD detection, particularly suitable for regions with limited access to advanced medical diagnostics.
Keywords
Introduction
Sickle Cell Disease (SCD) is a critical public health problem, particularly prevalent among Indian tribal communities. In healthy individuals, fetal hemoglobin (HbF), the dominant form of hemoglobin during fetal development, is gradually replaced by adult hemoglobin (HbA) after birth. HbA is the normal oxygen-carrying form in red blood cells. In SCD, a point mutation in the
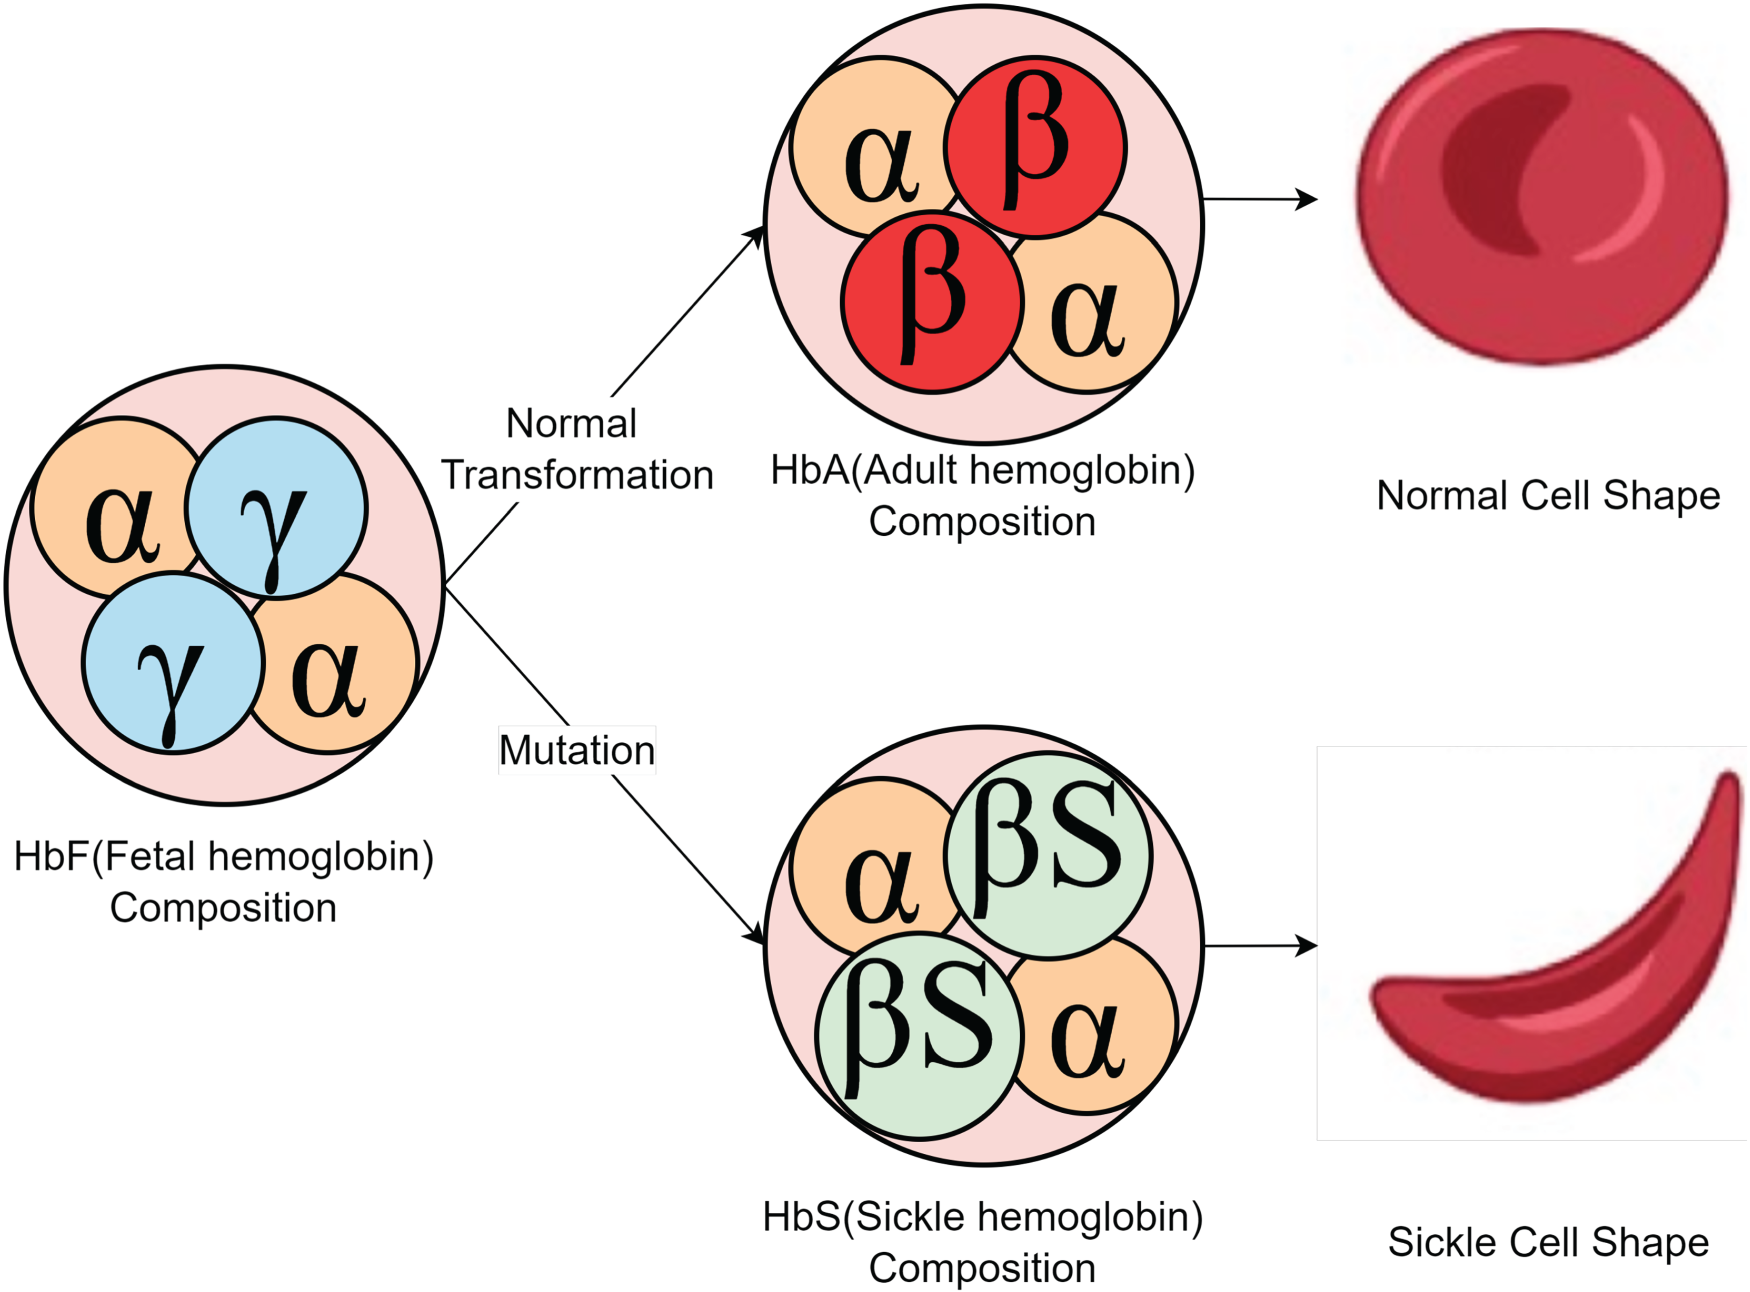
Normal (HbA) versus sickled (HbS) red blood cells.
The prevalence of sickle cell hemoglobin (Steinberg, 1999) varies significantly between different populations of the tribal and Scheduled caste in the sickle cell belt. Within the same tribe, there are notable variations in different regions. For example, in central India the Gond tribe in Chhindwara has a low prevalence rate of 4%, while in other areas it ranges from 15% to 25%. In contrast, the Bharia and Korku tribes in the same district show higher prevalence rates of 20% and 15%, respectively. The average prevalence rate for calculating the disease load is often assumed based on district-specific data, highlighting the need for localized assessments to ensure accuracy. Figure 2 depicts the regional distribution of SCD in India, emphasizing higher prevalence in central and tribal areas. The United Nations has agreed to implement a program to raise awareness about sickle cell anemia on June 19 each year. Since 1971, the American sickle cell disease association has supported people with sickle cell disease.
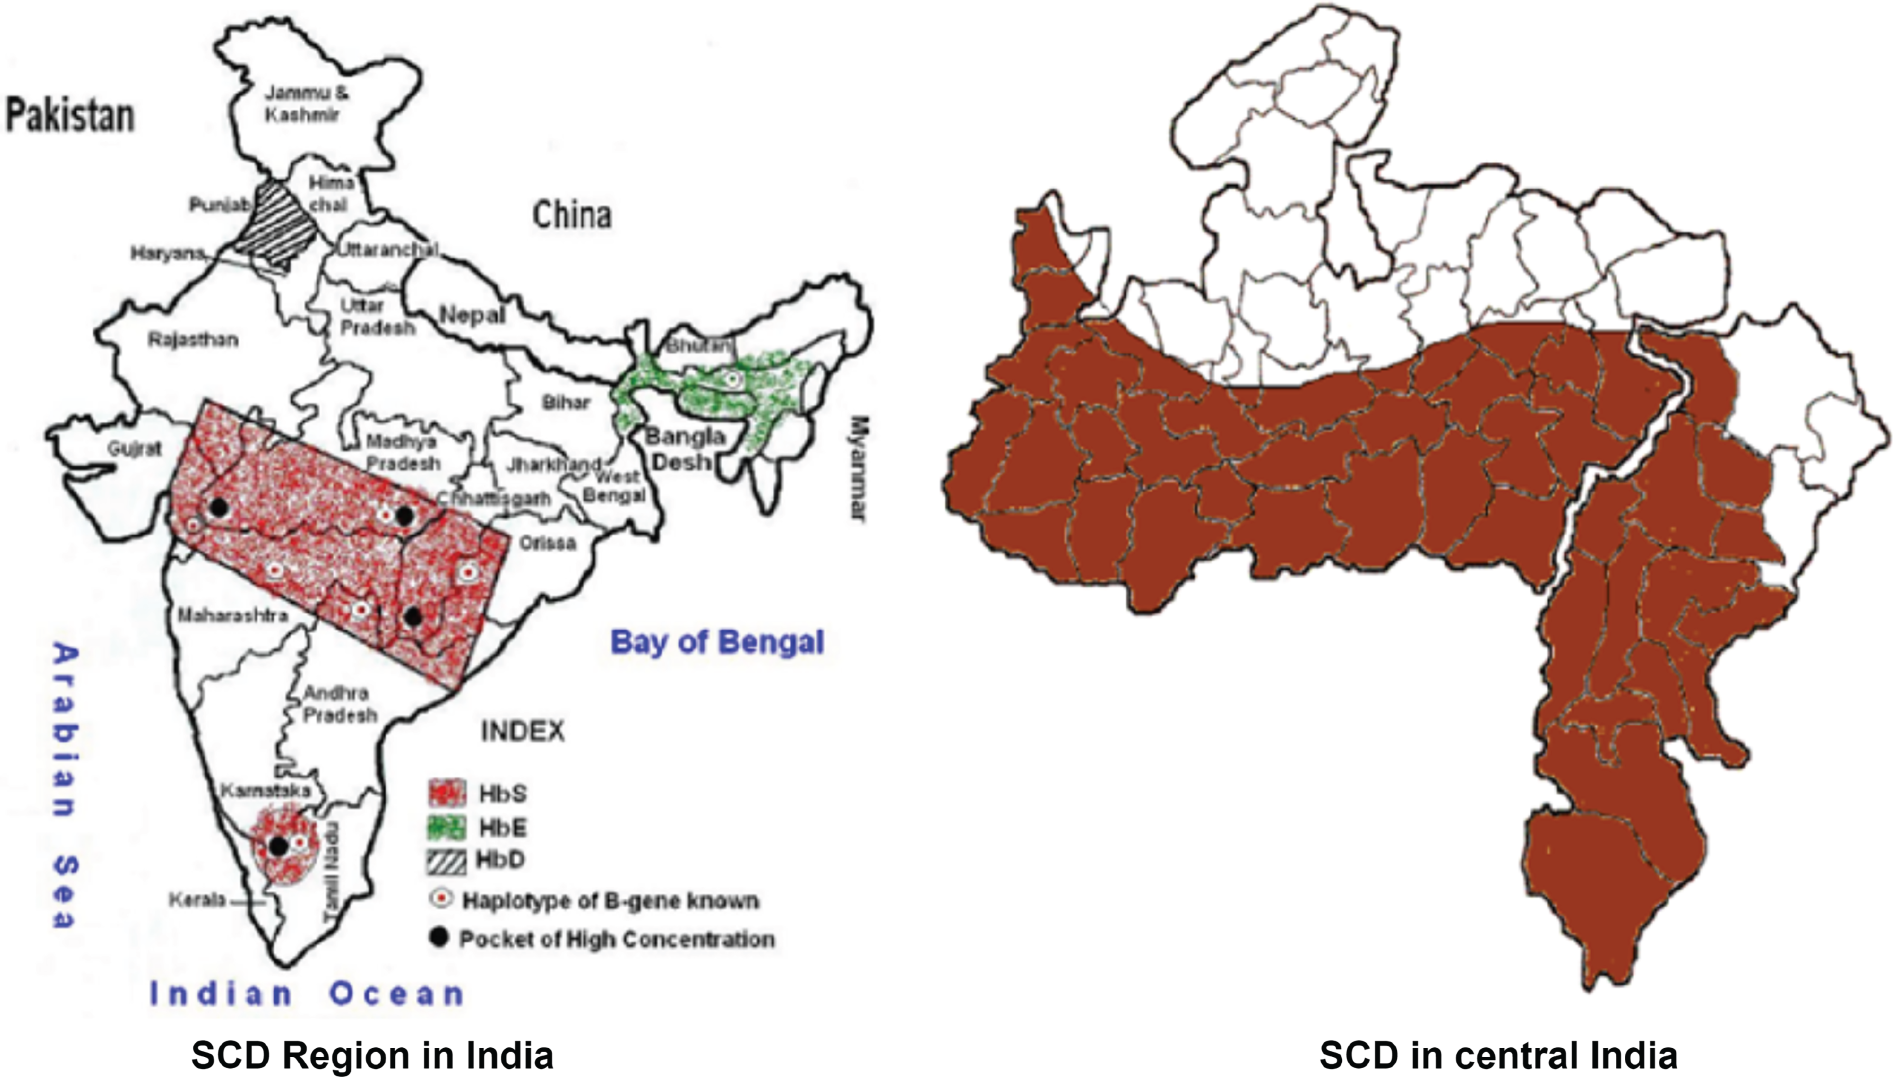
Regional distribution of SCD in India. The figure is adapted from epidemiological data reported in Gupta (2009) and used here for Academic and non-commercial purposes to illustrate regional disease distribution.
Deep learning is now an important dimension in medical imaging as it begins to be incorporated in the analysis of medical images. It helps in more efficient and precise disease detection of SCD (Hemavarshini & Arun, 2024; Summers et al., 2024). More particularly, convolutional neural networks, a class of deep learning theory, have attracted a great deal of interest in processing histopathological images of red blood cells in the diagnosis of disorders (Goswami et al., 2024). In this study, we present an advanced deep learning approach for segmenting and classifying sickle cell disease (SCD) images using the ErythrocytesIDB dataset. Our method integrates Gaussian Filter for noise reduction, OTSU thresholding for precise segmentation, and data augmentation to enhance model robustness. A custom CNN with an attention mechanism is trained with multiple optimizers, and finally, we have hypertuned the CNN with NADAM. This approach demonstrates the potential to improve SCD diagnosis, offering an efficient and automated solution to improve healthcare care, particularly in resource-constrained settings. The key highlights of this study are as follows. Developed a comprehensive pipeline for SCD diagnosis using the ErythrocytesIDB dataset with precise segmentation and robust preprocessing. Applied advanced pre-processing with Gaussian Filter and OTSU’s thresholding for effective segmentation Enhanced model robustness through comprehensive data augmentation, improving classification metrics significantly Proposed a novel hypertuned CNN architecture with an integrated attention mechanism for accurate classification of cell shapes. To test and validate the proposed methodology using various performance metrics, such as precision, precision (p), recall (r), F1 score, AUC, ensuring a comprehensive evaluation and robustness of the model.
The rest of the paper is organized into six sections. The first section provides an introduction, outlining the study’s objectives and significance. The second section presents a review of the literature and discusses previous research on SCD datasets. The third section details the materials and methods, elaborating on the dataset and the approaches used for preprocessing. The fourth section focuses on the Proposed System Architecture, followed by the fifth section, which includes results and discussion. The final section concludes the study and highlights potential directions for future work on sickle cell disease.
Sickle Cell Disease (SCD) is a hereditary blood disorder caused by a mutation in the beta-globin gene (HBB) located on chromosome 11 (Bartolucci & Galactéros, 2012; Inusa et al., 2019). This genetic mutation results in the substitution of a single amino acid—glutamic acid with valine—at the sixth position of the beta-globin chain. This alteration leads to the formation of abnormal, sickle-shaped red blood cells, which can obstruct blood flow and cause severe complications. SCD manifests in different forms depending on genetic inheritance. The homozygous form (HbSS) is referred to as Sickle Cell Disease (SCD), while the heterozygous form (HbAS) is known as Sickle Cell Trait (SCT) (Sundd et al., 2019). Additionally, the co-occurrence of SCD with other hemoglobin disorders results in a spectrum of clinical manifestations, with some cases requiring frequent medical attention and hospitalizations (ter Maaten & Arogundade, 2010). The prevalence and distribution of SCD have been significantly influenced by factors such as global migration, consanguineous marriages, and the historical association of SCD with malaria-endemic regions (Hockham et al., 2018). This complex interplay of genetics and environmental factors has contributed to variations in disease burden across different populations worldwide. Its prevalence is influenced by factors like global migration, consanguineous marriages, and malaria endemicity. Patients with SCD experience poor Quality of Life (QoL) due to recurrent pain, fatigue, anxiety, and the need for blood transfusions (Bhagat et al., 2014). Economic burdens such as wage loss, absenteeism, and difficulty performing daily activities worsen their condition. Comprehensive medical and socioeconomic support is crucial for improving patient outcomes (Holdford et al., 2021).
In recent years, there have been some studies that combine aspects of deep learning and sickle cell disease (SCD) diagnosis and classification; however, there are almost no studies that fit this category of research in current reviews of sickle cell disease. Most of the existing work is quite old and targets conventional computer vision approaches using image processing and feature extraction techniques and algorithms to achieve red blood cell, red blood cell, and sickle cell segmentation and classification. A research (Petrović et al., 2020) allowed us to select the most efficient classifiers of SCD by evaluating the classification characteristics and methods. This work used the erythrocytesIDB dataset, and instead of using embedding-based approaches, they used machine learning basics such as random forest and gradient boosting for classification. In addition, certain feature extraction and image processing techniques were performed such as noise removal and morphology opening on microscopic images to eliminate unnecessary objects and recognize edges. The experiments were carried out in three different ways, with Random Forest being the outperforming classifier due to the superior performance and cost effectiveness compared to Grad Boost. Regarding their results, it was also clear that excluding nonlinear PCA and LDA was not significant in terms of performance improvement. Despite the encouraging results, their attention has mainly focused on machine learning classifiers and therefore deep learning techniques have not been explored.
Khalaf et al. conducted another study. In a study conducted by Alzubaidi et al. (2021), machine learning was applied to the classification of medical data in patients with SCD to improve the treatment of therapy. Using time-series data in their analysis, they explored multiple machine learning-based models and found that Random Forest performs the best. However, their study was limited to a single set of architectures, preventing them from research in the more complex neural network models.
Kato et al. (2018) made a huge leap by proposing three deep learning models for the classification of RBCs with data enhancement to overcome the problem of a small data set. Their proposed models performed well and even outperformed some state-of-the-art methods, achieving a high accuracy of 99.54% on the erythrocyte dataset and an accuracy of 99.98% when combined with a support vector machine (SVM) classifier. In addition, recent research has highlighted the importance of hyperparameter optimization to improve deep learning performance. For instance, Li et al. (2025) proposed a Multi-Strategy Parrot Optimizer (MSPO) for medical image classification, showing that models with optimized hyperparameters significantly outperform non-optimized ones across metrics such as accuracy, precision, recall, and F1-score. Incorporating similar optimization strategies can potentially enhance the robustness and accuracy of SCD deep learning models.
Materials and Methods
Dataset and Data Preprocessing
In this paper, we have used ErythrocytesIDB developed by the Special Hematology Department of the General Hospital, Cuba. The ErythrocytesIDB dataset (Gonzalez-Hidalgo et al., 2014) consists of three subsets: ErythrocytesIDB1, ErythrocytesIDB2, and ErythrocytesIDB3, with this study focusing on ErythrocytesIDB1, which contains 629 individual cell images classified into circular (203), elongated (212), and other shapes (214). The sample of full-field source images is shown in Figure 3. To improve model performance, data augmentation techniques such as rotation, flipping, scaling, and translation were applied, increasing dataset size and variability for better generalization. The preprocessing pipeline involves two key steps: noise removal and segmentation. Gaussian Filter is used to smooth the images while preserving critical structural details, ensuring minimal high-frequency noise interference. Following this, OTSU’s thresholding is applied for segmentation by determining an optimal threshold to separate foreground regions of interest from the background, making it highly effective for grayscale images. This workflow improves dataset quality, enabling more accurate and reliable classification of sickle cell disease images.

Full-field source sample images from dataset.
In this study, we evaluate five optimization techniques: ADAM, SGD, RMSPROP, ADAMAX, and NADAM within our attention-based CNN model for SCD classification. After preliminary experiments, NADAM was selected as the final optimizer for the reported results due to its superior performance in convergence speed and accuracy. Each optimizer adjusts the model weights to minimize the loss function





To remove noise from the images, we applied a Gaussian filter, which performs a convolution between the image and a Gaussian kernel defined by a Gaussian function (Qu et al., 2024). This method smooths the image by reducing high-frequency noise while preserving important structural details such as edges. The 2D Gaussian function is expressed as:

The Gaussian filter is applied to an image

This convolution operation produces a smoothed image by averaging neighboring pixel values according to the Gaussian distribution, effectively reducing noise while preserving essential structures.
In this paper, we have applied OTSU’s thresholding after Noise Removal to Segment Cell Images (Mostafa et al., 2024). It is a popular image segmentation technique that automatically calculates the optimal threshold value to separate the foreground and background of an image. It is useful for grayscale images where the histogram shows a clear bimodal distribution (two peaks, one for the background and one for the foreground) and helps determine the optimal threshold to separate the foreground and background. Objects are minimized for intraclass variance (the variance within the foreground and background). It is achieved by evaluating the variance between classes for each possible threshold value



OTSU’s method searches for the threshold

By finding this optimal threshold
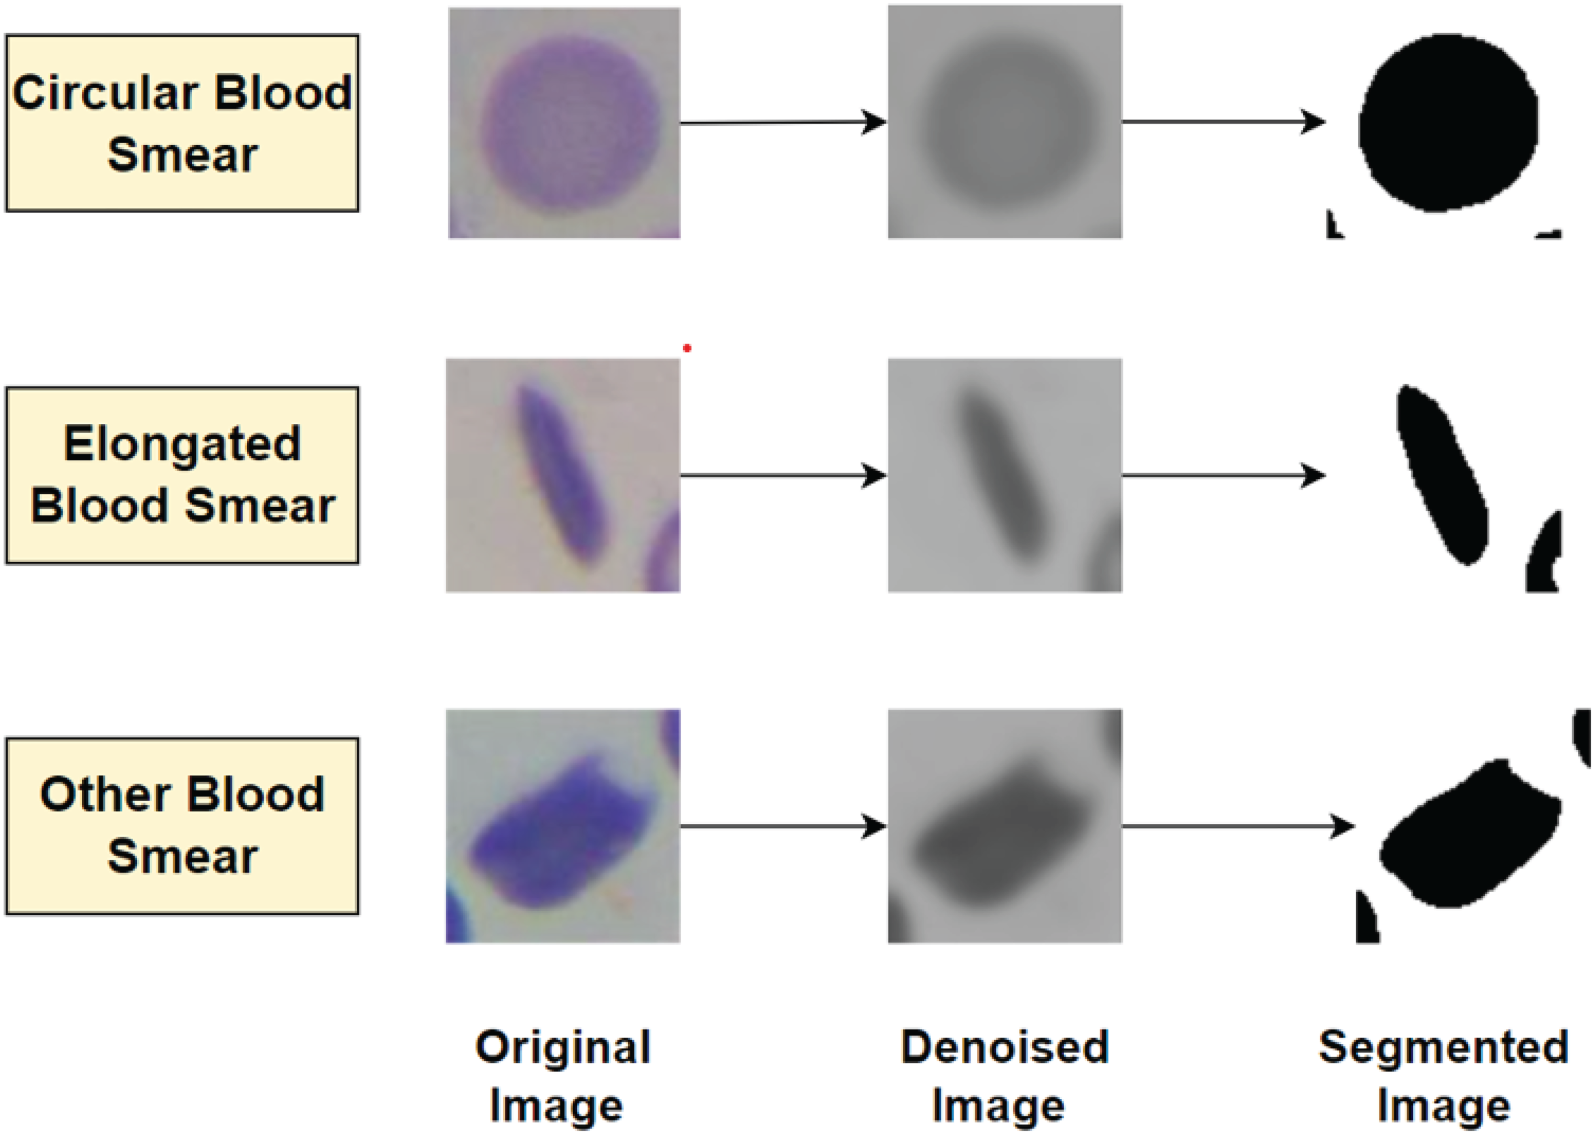
SCD segmentation using OTSU thresholding after Gaussian filter.
We have performed data augmentation to increase the number of instances and balance classes for efficient model training (Islam et al., 2024). The augmentation techniques include random rotations of up to 20 degrees, horizontal shifts of up to 10%, vertical shifts of up to 10%, shear transformations of up to 10%, zooming in or out by 10%, and horizontal flips. Each transformation was applied using a fixed random seed to ensure reproducibility. The ’nearest’ fill mode was used to handle any newly created pixels during these transformations. Table 1 shows the class-wise distribution before and after augmentation, demonstrating balanced class counts. After augmentation, an 80% training and 20% testing split was performed. 5-fold cross-validation was applied only on the training set to avoid overlap between training and testing data, ensuring consistent evaluation.
Class Distribution Before and After Augmentation.

Class Distribution Before and After Augmentation.
In this paper, Gaussian Filter has been applied for denoising to improve the robustness and accuracy of image processing. Sickle cell disease (SCD) images often contain noise due to variations in acquisition conditions and transmission artifacts. Gaussian Filter smooths the images, reducing high-frequency noise while preserving important structures. The segmented images obtained after Gaussian Filter and OTSU thresholding are then passed as input to the proposed CNN model. The proposed architecture consists of four convolutional blocks with increasing filter sizes (32, 64, 128, and 256), each followed by a ReLU activation and a
For image segmentation, OTSU thresholding is chosen due to its adaptive and automated nature, making it an optimal technique for medical image analysis. Since sickle cell images typically exhibit distinct intensity distributions between cell regions and the background, OTSU thresholding determines the best segmentation threshold dynamically, eliminating the need for manual intervention. This method improves reproducibility and reduces human bias. A hypertuned CNN model integrated with attention weights (as shown in Figure 5) enables the network to focus on the most relevant cell features, improving discrimination among the three cell categories. Five optimizers (ADAM, SGD, RMSPROP, ADAMAX, and NADAM) were tested to evaluate performance, with the NADAM optimizer providing the best results. The attention mechanism integrated into the proposed SCDNet 1.0 model enhances interpretability and feature prioritization. It operates by assigning learnable attention weights 
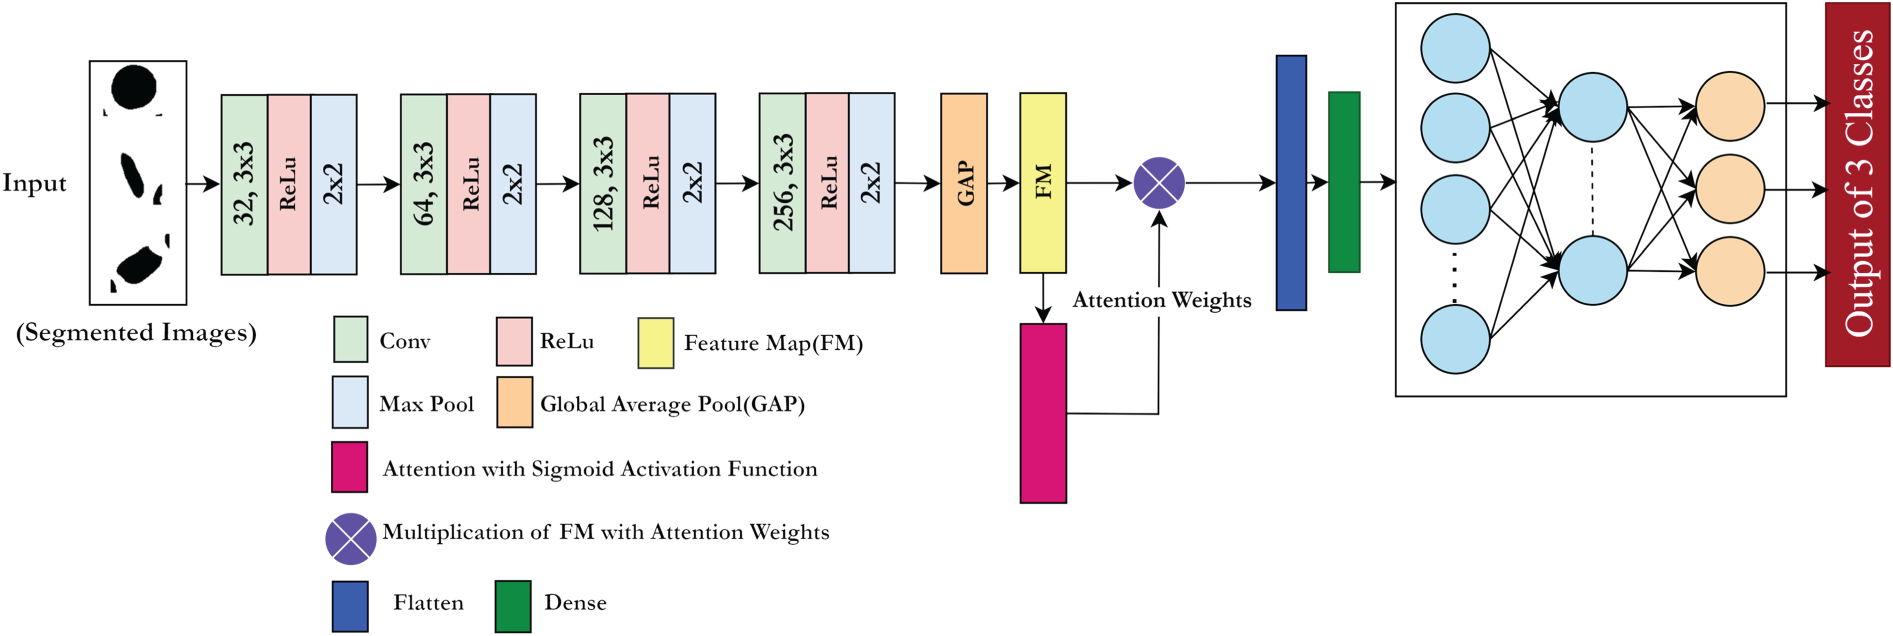
Proposed system Architecture (SCDNet 1.0 with attention mechanism).
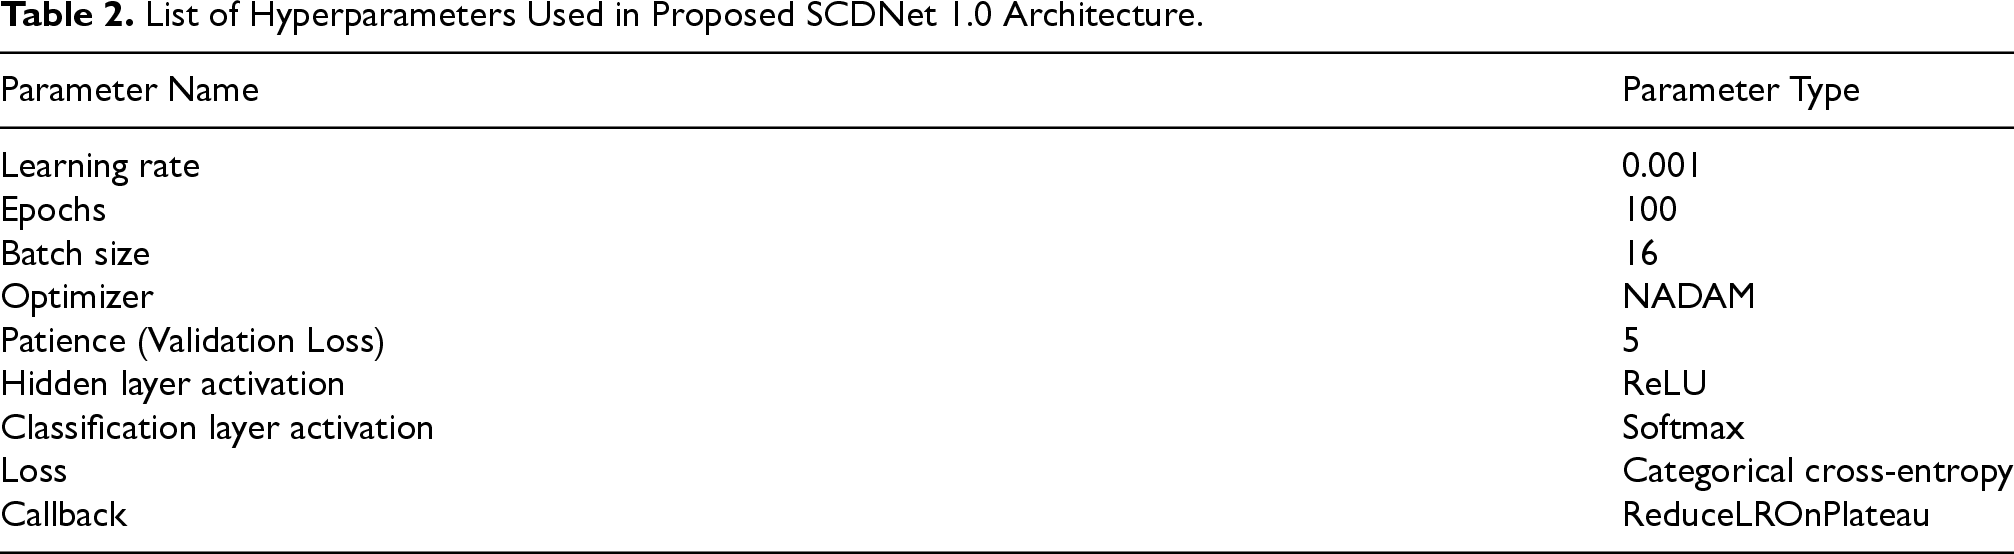
Figure 5 shows the proposed CNN architecture with attention weights for SCD, and Table 2 lists the hyperparameters used to train the model.
List of Hyperparameters Used in Proposed SCDNet 1.0 Architecture.
Experimental Setup
The proposed model is tested using NVIDIA RTX 4090 GPUs. The system has 1TB SSD and 32GB RAM for efficient processing. TensorFlow libraries are used for implementation. The model is trained for a maximum of 100 epochs with a learning rate starting at 0.001, adjusted using a learning rate scheduler based on validation loss. The selected learning rate (0.001) follows standard CNN optimization practices for small-to-moderate medical and agricultural datasets, ensuring stable and gradual convergence (Jennifer et al., 2023). A batch size of 16 is adopted to balance gradient stability with memory efficiency, considering the limited dataset size (629 base images). Early stopping with a patience of 5 epochs is employed to terminate training once the validation loss ceases to improve, effectively mitigating overfitting. The total number of trainable parameters in the model is 3,733,059, and the optimizer maintains 7,466,121 internal parameters.
To evaluate the model performance, the following metrics are used, with TP (True Positives), TN (True Negatives), FP (False Positives), and FN (False Negatives) denoting classification outcomes:




The performance of a basic Convolutional Neural Network (CNN) architecture was evaluated using different optimizers in four types of data: original, denoised, denoised + segmented, and Final Dataset (denoised + segmented + augmented). From the results shown in Table 3, the Adam optimizer achieved the best testing accuracies, ranging from 0.8306 in the original data to 0.8573 in the final dataset, which shows its consistency in the datasets. SGD showed significantly lower performance, with a maximum accuracy of 0.6605 in the Final Dataset, suggesting that it struggles without sufficient data manipulation. RMSPROP performed similarly to Adam on the original and denoised data but outperformed on Final Dataset data, achieving a peak testing accuracy of 0.8812. Adamax, although initially weaker, showed improvement with data preprocessing, reaching a testing accuracy of 0.8519 with Final Dataset data. Lastly, NADAM provided the best overall performance, particularly with the Final Dataset data, achieving the highest testing accuracy of 0.8866, demonstrating its strength in adapting to varied datasets. Figure 6 shows the accuracy com performance metrics in different datasets.

Accuracy comparison on original data, denoised data, Denoised + Segmented Data, Denoised + Segemented + Augmented Data.
Testing Accuracy of CNN with Different Optimizers Across Various Data Types.

Figure 7 shows the comparative ROC of 5 optimizers. The NADAM optimizer performed the best. It has recorded the highest ROC-AUC score of 0.98. This shows its ability to balance false positives and false negatives. RMSPROP followed closely, with a ROC-AUC score of 0.97. Adamax and SGD scored 0.96 and 0.92, respectively. The Adam and Adamax optimizer have also shown good results. It has achieved a 0.96 ROC-AUC score and high accuracy, especially for the circular class. These findings highlight the importance of choosing the right optimizer.

ROC curve on Denoised+Segmented+Augmented data for Adam, SGD, RMSPROP, Adamax, NADAM optimizers.
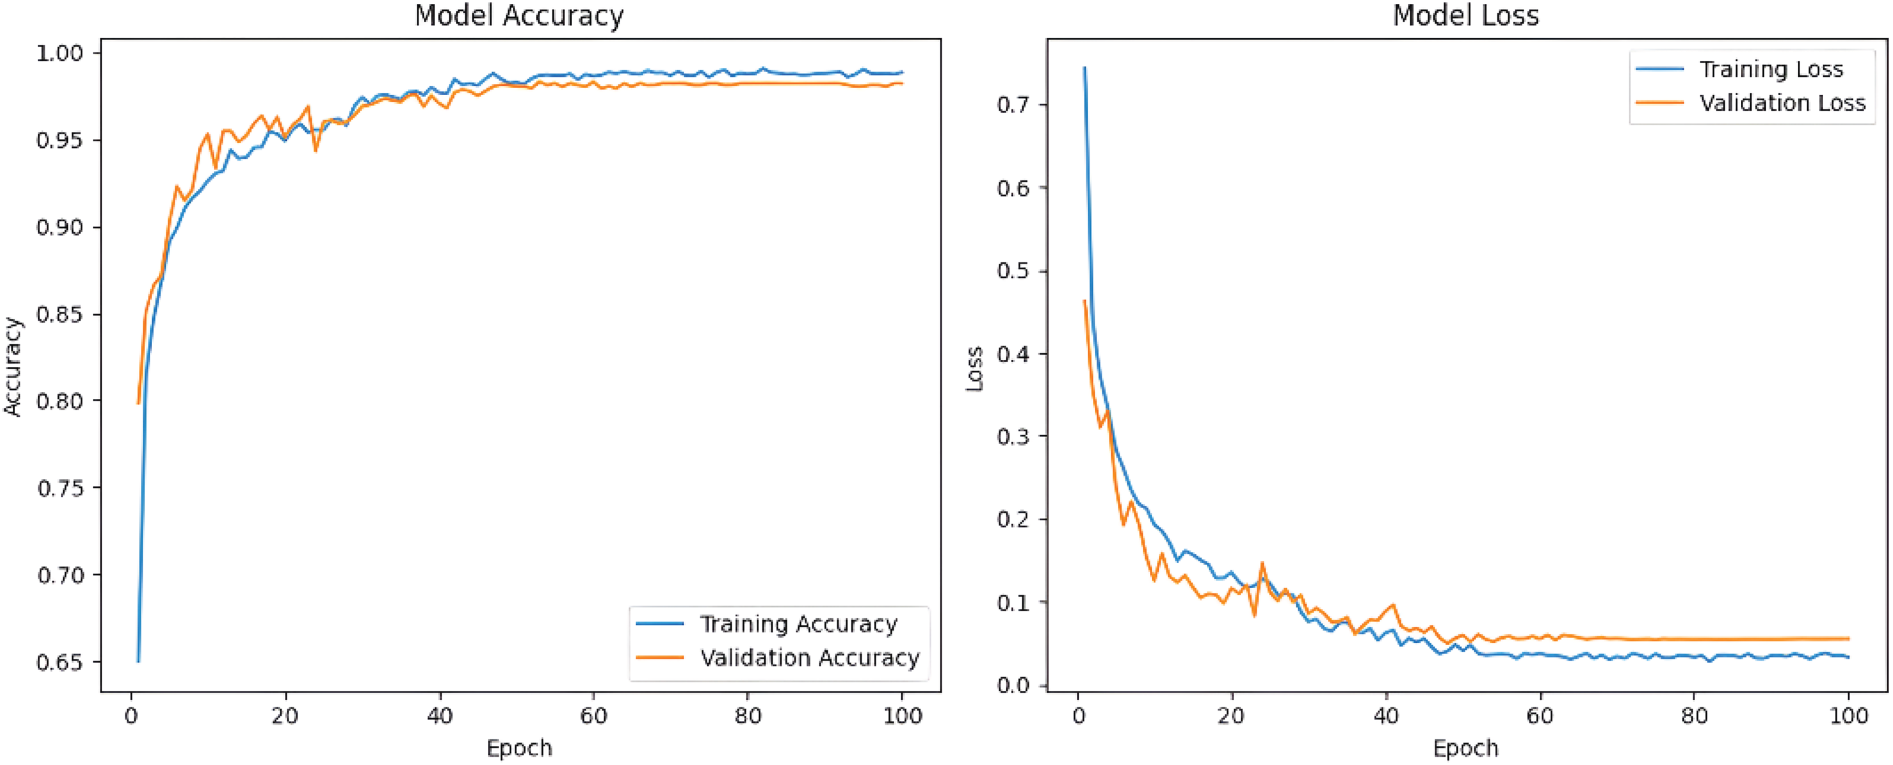
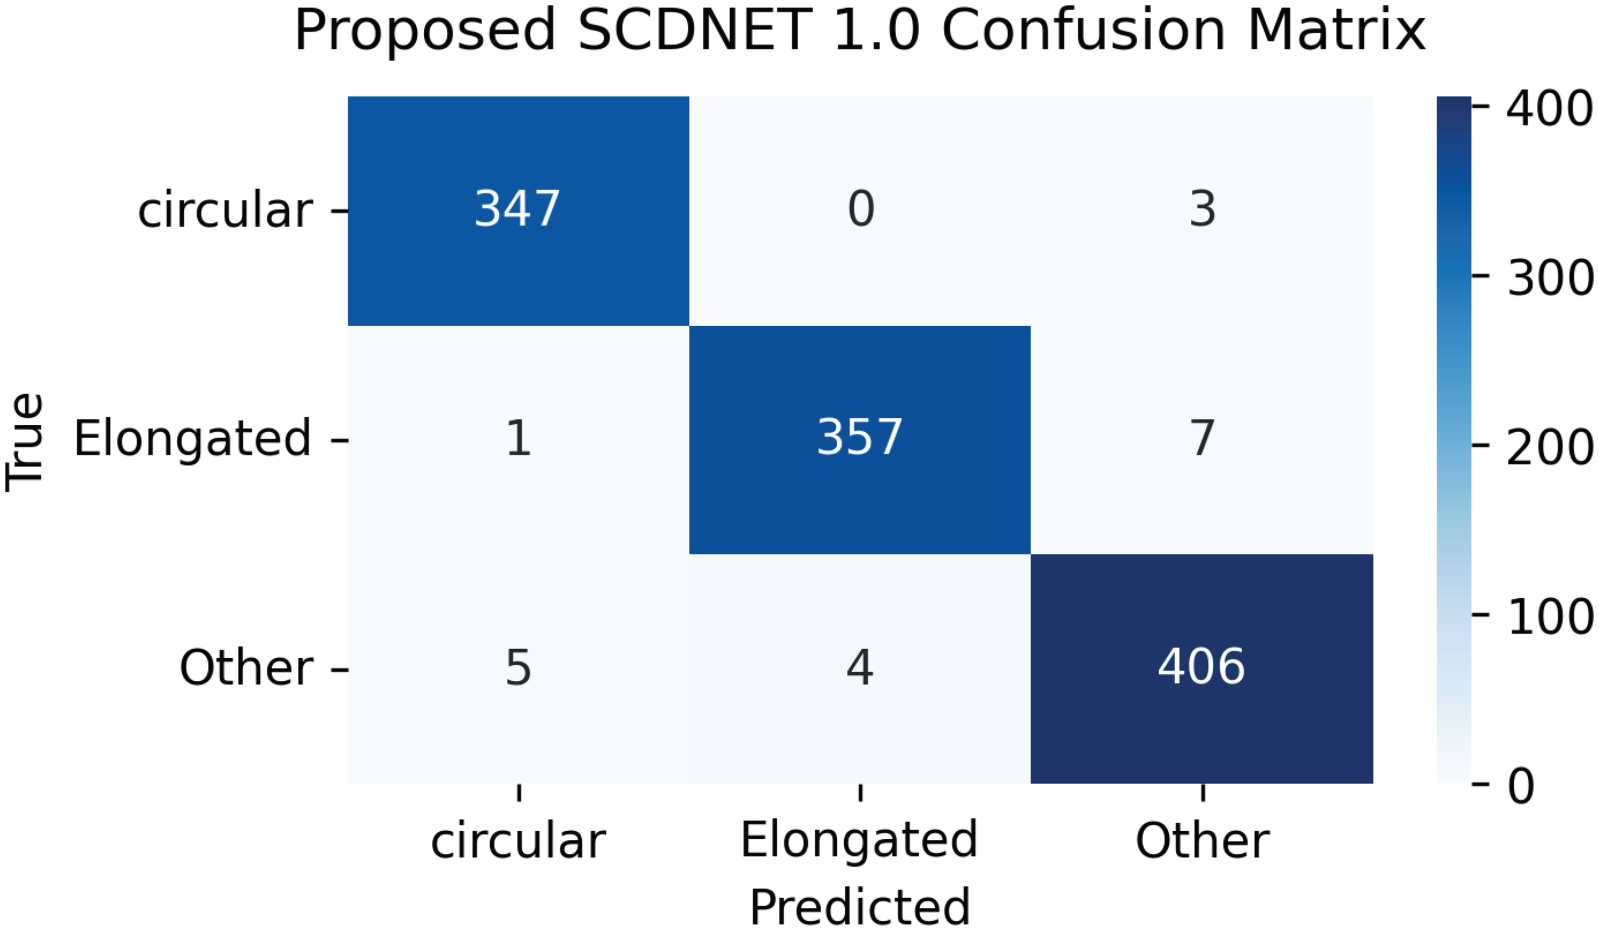
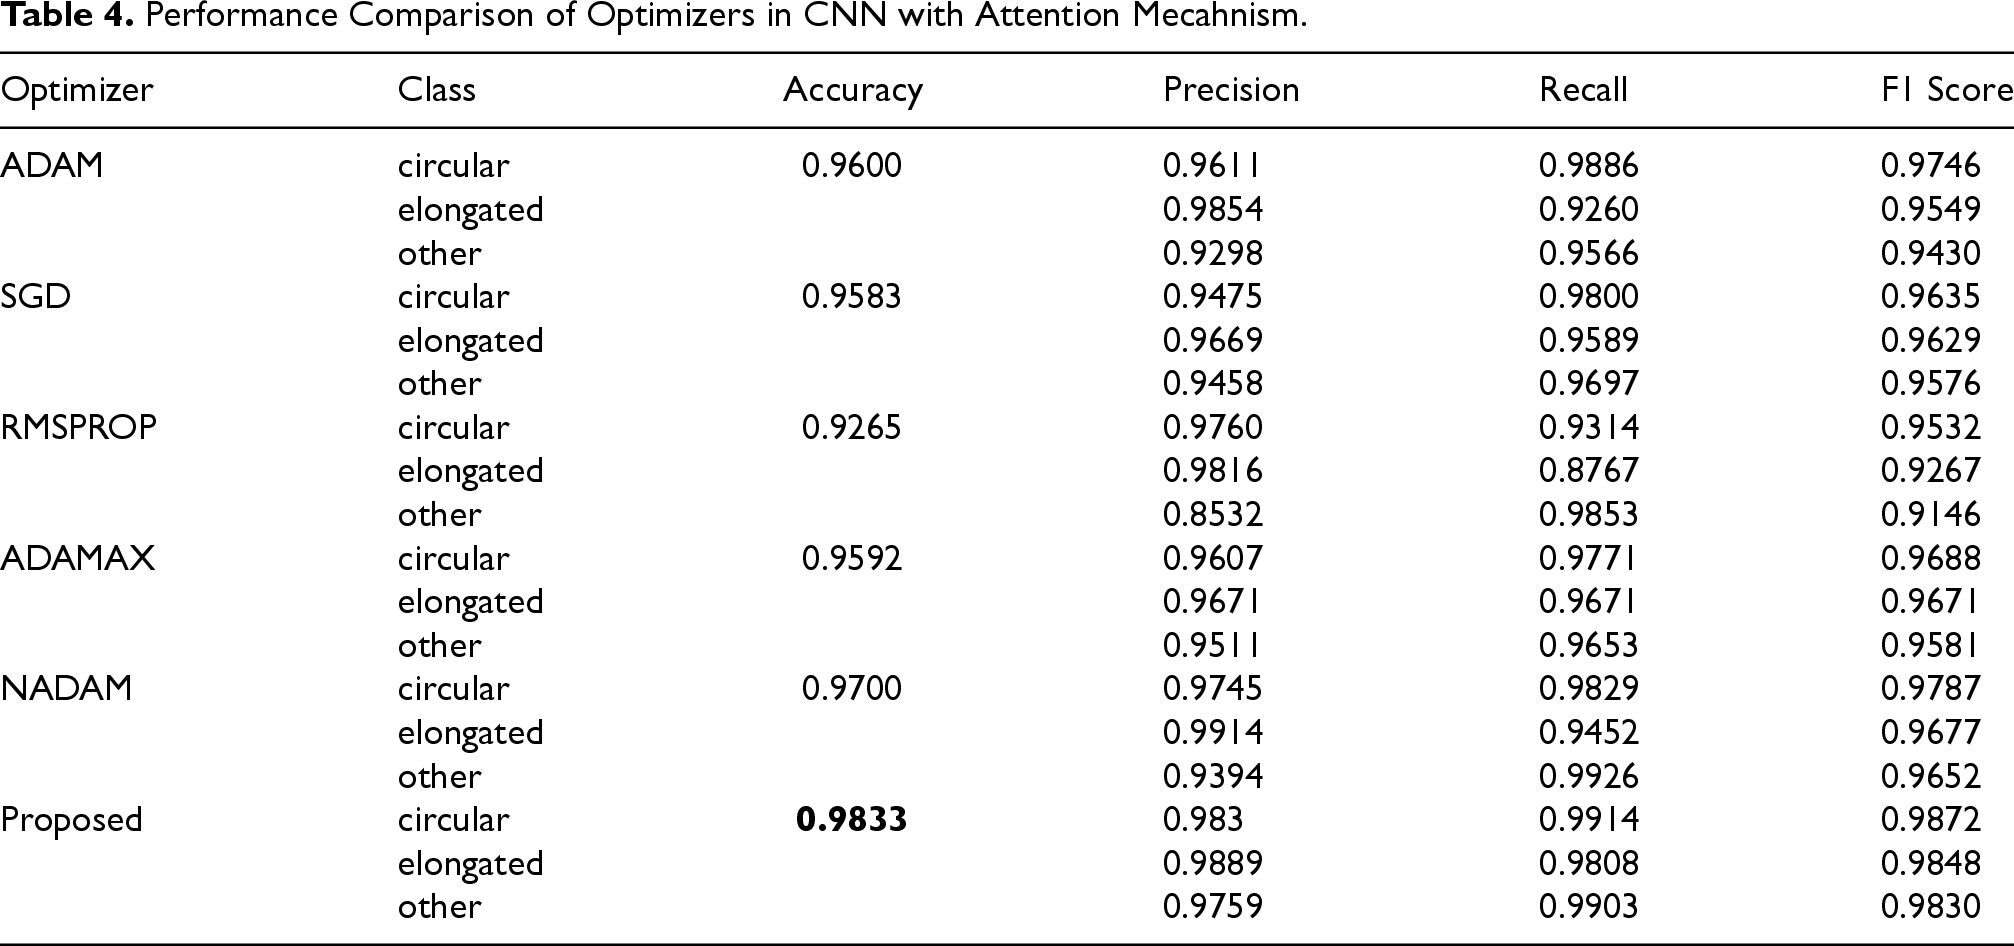
The results shown in Table 4 compare ADAM, SGD, RMSPROP, ADAMAX, and NADAM optimizers with an attention-based CNN to classify images into circular, elongated, and other classes. ADAM achieves 96% accuracy, excelling in the circular class with a recall of 0.9886, though its precision for the other class is slightly lower at 0.9298, indicating some misclassification. SGD achieves 95.83% accuracy, with a high precision of 0.9697 for the other class, reducing false positives while maintaining balanced performance across all classes. RMSPROP has the lowest accuracy at 92.65%, showing strong precision in the circular and elongated classes but lower recall values of 0.9314 and 0.8767, respectively, leading to more false negatives. The other class has high recall at 0.9853 but lower precision at 0.8532, resulting in misclassification. Adamax performs consistently with 95.92% accuracy, showing balanced precision and recall of 0.9671 for the elongated class. NADAM achieves 97% accuracy, excelling in the elongated class with the highest precision of 0.9914 but slightly lower recall of 0.9452. The proposed SCDNet 1.0 architecture outperforms all the others with 98.33% accuracy, improving precision, recall, and F1 scores in all classes. The circular class achieves a recall of 0.9914 and an F1 score of 0.9872, the elongated class has an F1 score of 0.9848, and the other class benefits from a recall of 0.9903. The results show that the proposed SCDNet 1.0 gives better results for all classes. Figures 8 and 9 show the confusion matrix and the Training / Loss curves per epoch on the proposed SCDNet 1.0 model.
Accuracy and loss per epoch curve for proposed model.
Confusion matrix of proposed model.
Performance Comparison of Optimizers in CNN with Attention Mecahnism.
All model configurations (M1–M5) were trained using the NADAM optimizer, which was selected for the proposed SCDNet model due to its adaptive momentum and faster convergence characteristics compared to conventional optimizers. To rigorously evaluate model performance and verify the statistical significance of improvements, a five-fold cross-validation strategy was applied. For each configuration, the mean and 95% confidence intervals (CI) were computed for Accuracy, Precision, Recall, and F1-score. Statistical significance of the proposed SCDNet (M5) over the preceding configurations (M1–M4) was assessed using paired t-tests with Holm correction to control the family-wise error rate. The summarized results are presented in Table 5.
Performance Comparison of Models Using NADAM Optimizer (Mean
95% CI Over 5-Folds).
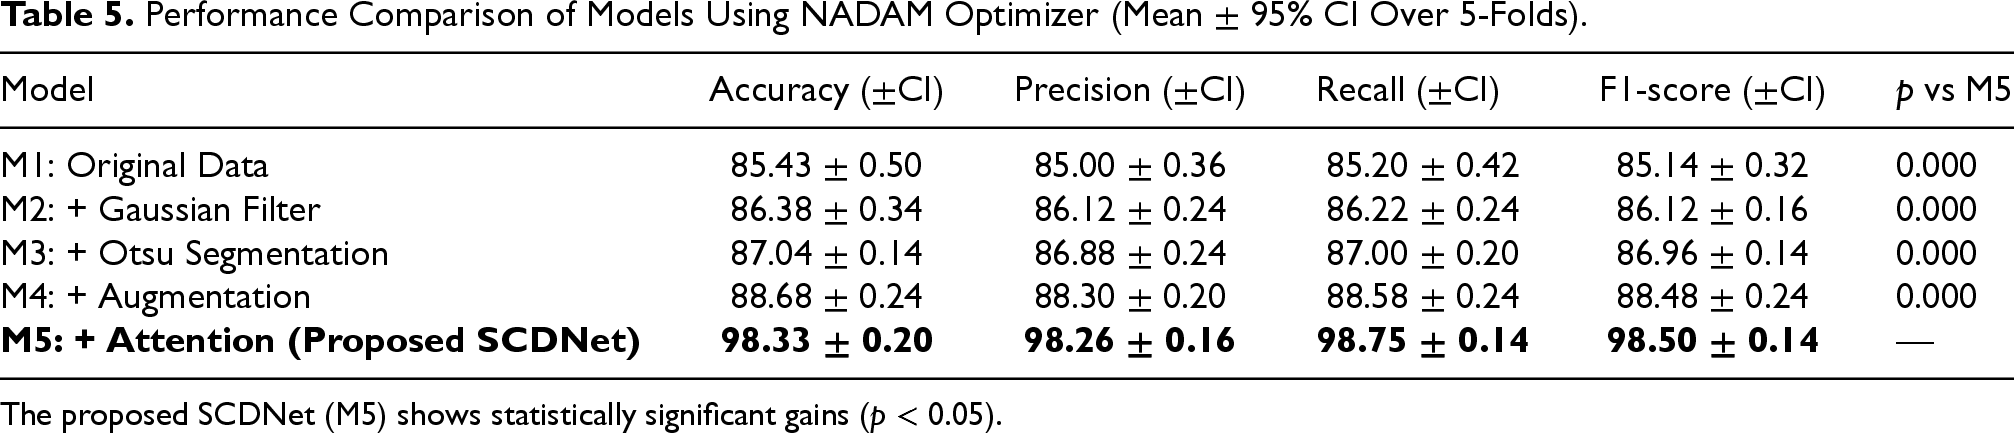
Performance Comparison of Models Using NADAM Optimizer (Mean
The proposed SCDNet (M5) shows statistically significant gains (
The findings indicate that the proposed SCDNet (M5) achieves a substantial and statistically significant improvement over all baseline configurations, reaching an average accuracy of 98.30
The benchmarking Table 6 compares the proposed model with current models. The proposed model achieved the highest mean accuracy of 98.33% using proposed SCDNet 1.0, outperforming other optimization methods. NADAM alone provided a mean accuracy of 97.00%, followed by ADAM at 96.00% and ADAMAX at 95.92%. SGD achieved 95.83%, while RMSPROP had the lowest at 92.65%. Among existing models, the best proposed model has achieved 3.93% better than the decision tree-based model, 2.27% better than the state-of-the-art model based on random forests.
Comparison of Proposed Model with State-of-the-Art Models.
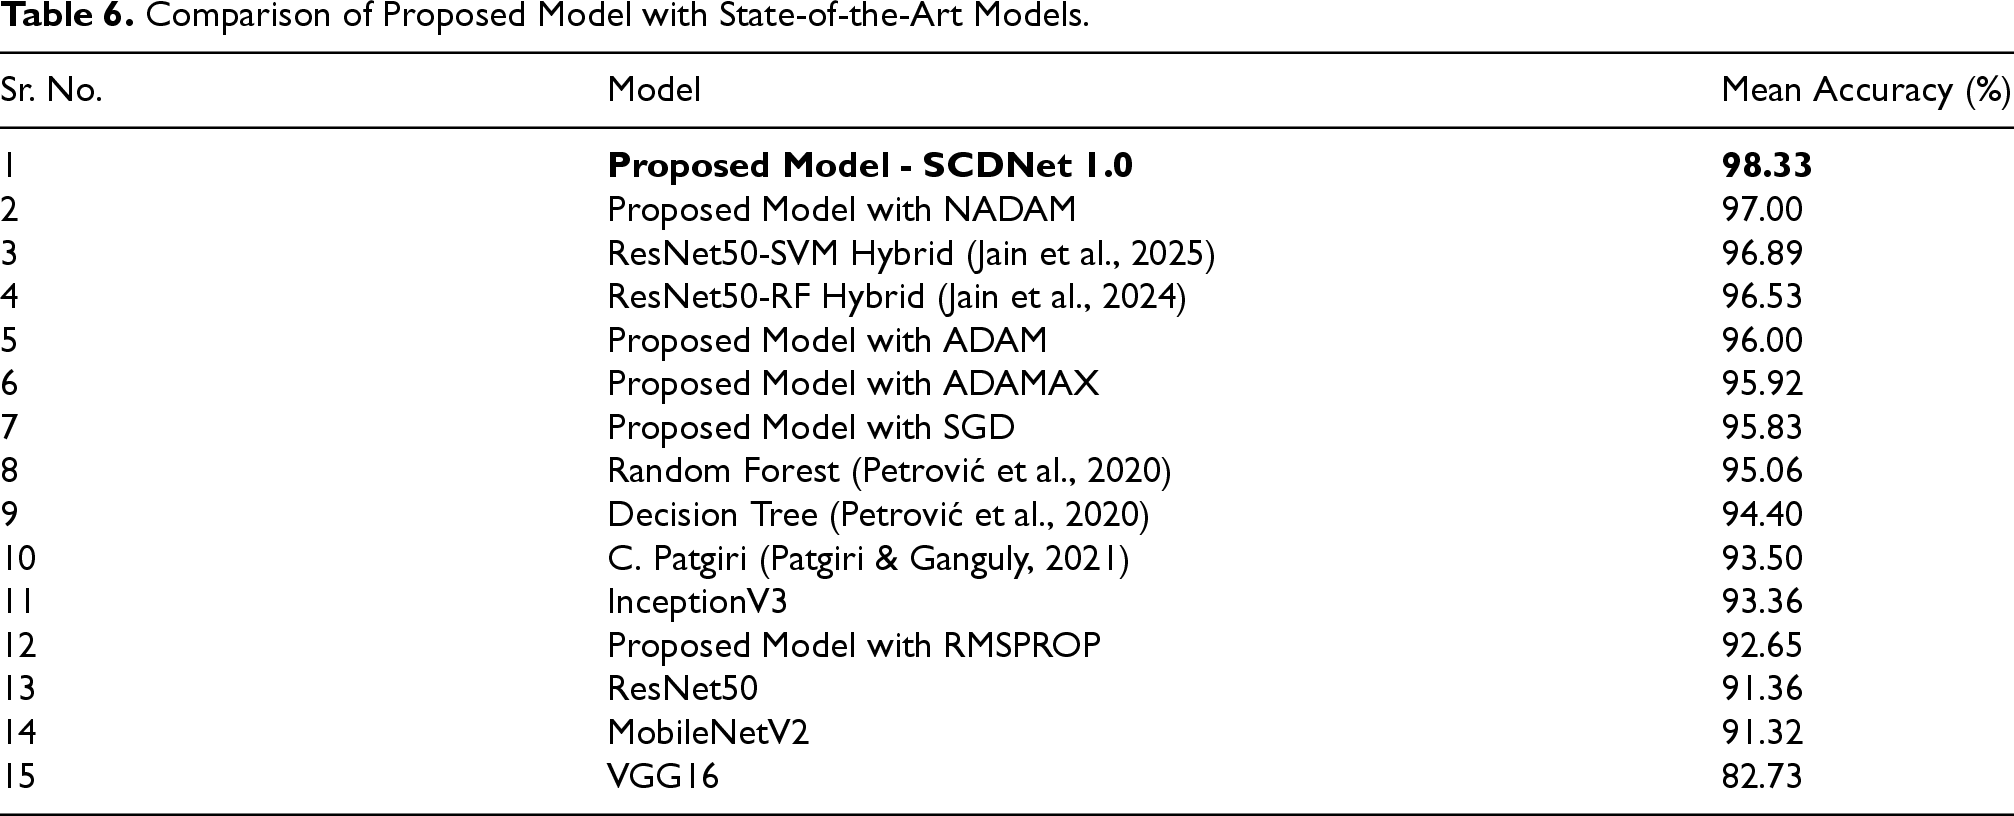
Comparison of Proposed Model with State-of-the-Art Models.
This study highlights the potential of attention-based CNN models for the classification of sickle cell disease (SCD) using histopathological images. Using advanced optimizers and extensive evaluation metrics, the research emphasizes the critical role of optimization in enhancing classification performance. Among the optimizers tested, NADAM emerged as the most effective, achieving exceptional accuracy, precision, recall, and F1 scores in the circular, elongated, and other classes, demonstrating its ability to effectively balance false positives and false negatives. The Adam optimizer also delivered competitive results, particularly for the circular class, showcasing its efficiency in correctly identifying specific SCD subtypes. Although Adam exhibited slightly reduced performance compared to NADAM in other classes, it remains a robust alternative. These findings underscore the importance of optimizer selection in deep learning models for medical image analysis. The proposed methodology, with its attention-enhanced CNN framework and rigorous evaluation, contributes to the advancement of automated SCD classification, paving the way for improved diagnostic tools in clinical settings.
Future work may explore additional model architectures and optimization strategies to further refine performance and generalizability. In addition, future research will focus on incorporating visual explainability techniques such as Grad-CAM and Score-CAM to generate attention map overlays that highlight the key morphological regions influencing classification outcomes. These visualizations will be analyzed for both true-positive and false-positive cases to evaluate the plausibility and interpretability of model decisions. Such explainable AI approaches can improve transparency and clinical trust, making the system more practical for real-world deployment, especially in low-resource diagnostic environments. Furthermore, stress testing of the model under challenging imaging conditions, including motion blur, compression artifacts, and varying illumination, will be performed to quantify performance degradation and identify potential mitigation strategies such as adaptive pre-processing and augmentation pipelines. This will help to ensure the robustness and reliability of the proposed model in various real-world scenarios.
Footnotes
Acknowledgment
This project is supported by the Institute of Eminence of the University of Delhi under the ‘Faculty Research Program Grant - IoE’.

Ethical Approval
Not applicable.
Consent to Participate
Not applicable.
Consent to Publish
All authors give their consent for the publication of this manuscript in the journal.
Authors’ Contributions
All authors contributed to the study’s conception and design. Data preprocessing, modeling, and analysis were performed by the lead author. All authors read and approved the final manuscript.
Funding
The author(s) received no financial support for the research, authorship, and/or publication of this article.
Conflicts of Interest/Competing Interests
The author(s) declared no potential conflicts of interest with respect to the research, authorship, and/or publication of this article.
Availability of Data and Material
In this paper, we have used the ErythrocytesIDB dataset developed by the Special Hematology Department of the General Hospital, Cuba. The ErythrocytesIDB dataset is used and referenced as [8] in the manuscript.
Code Availability
The code used in this study is available from the corresponding author upon reasonable request.