



Abstract
Revascularization remains a challenge for regenerative medicine strategies. Extensive research has been done to identify key moments of the dynamic wound healing cascade where targeted therapies can elicit a proregenerative response. However, the influence of oxygenation, temperature, and their temporal variation during healing are often challenging to promote tissue regeneration. This study investigated the effects of temporally varied oxygenation and temperature conditions on angiogenesis using an in vitro model of rat-derived, intact microvascular fragments in a collagen type-I hydrogel. By generating culture conditions that are similar to the accepted wound healing time course, the angiogenic response depended critically on both the timing of stimulus initiation and the magnitude of deviation from model conditions. Dynamic stimuli activated distinct biological pathways, as evidenced by qPCR analysis, revealing mechanistic links between environmental perturbations and the angiogenic response. This work emphasizes the need for regenerative medicine strategies to consider varying environmental stimuli to improve revascularization outcomes.
Impact Statement
This work demonstrated the impact of time-varying oxygenation and temperature conditions on self-assembling three-dimensional microvascular networks in vitro that mimic the physiological time course of wound healing. These findings suggest an important temporal relationship in angiogenesis where unresolved oxygen and temperature environments inhibit vascular network formation, cellular viability, proliferation, and environment-specific transcriptional factors.
Introduction
Revascularization is a critical, time-dependent process for tissue regeneration following injury. This has led to extensive research into the factors that regulate angiogenesis, the formation of new capillaries from preexisting blood vessels.1,2 In wound healing, angiogenesis occurs in parallel to inflammation, immune cell infiltration, granulation tissue formation, and deposition of sacrificial extracellular matrix (ECM), followed by remodeling and functional regeneration of the tissue.3–6 Robust vascular network formation has been a primary limiting factor in regenerative medicine strategies seeking to promote endogenous healing processes.2,7 It follows that therapies targeting angiogenesis be informed by the evolving time course of the regenerative environment that stimulates distinct cell types, extracellular substrates, and upregulation of signaling pathways. 8 Recent work has demonstrated that angiogenesis can be inhibited by compressive mechanical loading, but only at the early onset of stimulation. 9 Additionally, others have found bulk tissue stiffness changes along the angiogenic timeline, correlating directly with cell-derived, proteolytic enzyme activity. 10 These dynamics occur alongside the regulatory role of the vasculature, locally regulating oxygenation and temperature in the tissue. In the context of tissue injury and healing, the impact of fluctuating oxygenation and temperature environments remains understudied for the process of angiogenesis. This knowledge is essential for developing effective regenerative medicine strategies that optimize the conditions necessary for revascularization.
The levels of oxygen and temperature can vary spatially across tissues11,12 and with injury, changing with the severity of the wound.13,14 Oxygenation levels during acute muscle injury exhibit a brief period of hypoxia (<5% O2) that can last a few hours to days,15,16 and return to the physoxic (5–8% O2) range corresponding to revascularization and tissue healing.17–19 In addition, skin wound temperature can get as low as 28°C upon the application of fresh bandages, 20 which can take up to 12 h to resolve through thermoregulation.21–24 These environmental disruptions, if unresolved, can result in delayed healing, incomplete regeneration, or tissue necrosis, depending on the duration of exposure.25–27 While it is accepted that there is an early hypoxic phase in wound healing, we lack a detailed temporal and spatial understanding of how oxygen and temperature levels relate to cellular responses, let alone how these changes in the environment direct angiogenic outcomes in vivo. 28
To help bridge this gap, various platforms have been developed to explore the impact oxygen and temperature profiles have on angiogenesis in vitro. Hsu et al. found oxygen gradients significantly influence sprouting angiogenesis in a microfluidic environment, where lower oxygen magnitudes enhanced the sprouting length of human umbilical vein endothelial cells (HUVECs). 29 Roca et al. demonstrated supernormothermic temperatures inhibited HUVECs capillary tube formation in Matrigel when exposed to temperatures between 39°C and 45°C for 1 h. 30 Laschke et al. found subnormothermic temperatures (20°C) increase the vascularization capacity when cultivated for the first 24 h at this temperature, 31 using intact microvascular fragments (MVFs). Collectively, these studies used oxygenation and temperature conditioning to manipulate angiogenic network formation using environmental extremes. Additional work has explored the molecular mechanisms underlying these processes and has shown potential roles for plasminogen activator inhibitor-1 (Serpine1), hypoxia inducible factor-1 alpha (Hif1α), and thrombospondin-1 (Thbs1) in regulating the cellular response to these environmental stresses.30,32–34 Hif1α has been a key regulator in angiogenesis and responds to oxygen stress, while Serpine1 and Thbs1 have been shown to respond to temperature stress in angiogenesis. However, the impact of temporal changes to oxygen and temperature on cellular mechanisms, as occurs during physiological conditions of vascular disruption and thermal conditioning, remains understudied.
In this study, we assessed the influence of temporal variation in environmental conditions on angiogenesis. We characterized vascular network length, branching, viability, and proliferation during continuous and temporal variations of oxygen and temperature levels. Hypoxic stress durations (first 48 h of culture and 8 h daily hypoxic exposure) reflected clinical vascular disruption post injury, where reoxygenation occurs as blood flow is restored, 35 and compartment syndrome, where fascia pressure causes intermittent hypoxia in tissue.36,37 Temperature cycling mimicked postinjury thermoregulatory extremes, including the 12-h shell-temperature recovery period observed after procedural cooling, like in freshly applied wound dressing.20,22,38 Endpoint measures at days 3 and 7 align with critical angiogenic phases. Day 3 captures early angiogenesis potential from prior studies, 39 while day 7 marks the transition from proliferation to remodeling in the intact MVF model, mirroring in vivo neovascularization peaks and tissue maturation. 9 We hypothesized that the impact of temperature and oxygenation on MVF vascular growth, viability, and proliferation would depend on the temporal pattern, where early hypoxic stress and subnormothermic regulation would elicit the greatest increase. Additionally, we explored the genetic expression of thermal stress (Serpine1, Thbs1), oxygen stress (Hif1α), and vascular growth (Vegfa) genes to mechanistically understand the effects of environmental conditioning, hypothesizing that these genes would correspond with the duration and magnitude of stimulus.
Materials and Methods
Intact microvascular fragment model
Intact MVFs reconstituted in type-I collagen hydrogel comprised the model, as previously described. 9 Briefly, epidydimal fat pads were harvested from Lewis male retired breeder rats (Charles River Laboratories, Wilmington, MA) as approved by the University of Oregon’s Institutional Animal Care and Use Committee. Tissue was minced and digested with collagenase type I (Worthington, Freehold, New Jersey; CLS-1, Lot#: 41M21742) and DNase I (Roche, Switzerland; Ref#: 11284932001). Sequential filtration using 20 µm (McMaster-Carr, Elmhurst, IL; Ref#: 9318T51) and 200 µm (pluriSelect, Leipzig, Germany; SKU 43-50200-03) meshes isolated MVFs between 20 and 200 µm. MVFs were suspended at 20 K/mL in 3 mg/mL collagen type I (Corning, Corning, NY), buffered with 1X Dulbecco's Modified Eagle Medium (DMEM) at the final concentration and 0 − 2 µL of NaOH to reach ∼7.45 pH. Cell-hydrogel solution was cast at a volume of 150 µL in 96-well plates (Corning Costar, Corning, NY), and allowed to polymerize for 20 min at 37°C. Constructs were cultured in serum-free media (1:1 DMEM/F-12, Cytiva, Marlborough, MA; Cat#: SH30271.01) supplemented with Sato components 40 and recombinant human vascular endothelial growth factor (rhVEGF-A, 10 ng/mL; R&D Systems, Minneapolis, MN; Cat#: 293-VE-010). Prior to media changes, fresh media was incubated for 30 min in the environment pertaining to each experimental group, respectively, to ensure adequate environmental acclimation.41,42 For cyclic stress groups, the media were preconditioned in the unstressed environment and changed immediately before transitioning to the stress conditions.
Oxygenation and temperature modulation of in vitro culture
MVF-seeded 96-well constructs were placed into Heracell™ VIOS 160i Tri-Gas CO2 Incubators (Thermo Fisher Scientific, Waltham, MA) supplied with nitrogen to reach the following experimental conditions: superoxia (20% O2, standard incubation environment), physoxia (8% O2), and hypoxia (1% O2). Fyrite kits (Bacharach, New Kensington, PA) were used as a secondary measurement to validate oxygen levels. Continuous oxygenation groups were maintained at either control (20% O2), physoxic (8% O2), or hypoxic (1% O2) levels (Fig. 1A). Time-varying oxygen groups were transferred from superoxia to hypoxia under an early hypoxic condition for the first 48 h of culture or a cyclic hypoxic condition for 8-h daily bouts before returning to standard incubation (Fig. 1B). Continuous oxygenation exposure groups (Fig. 1A) were fixed on day 7, while control and time-varied groups (Fig. 1B) were fixed on days 3 and 7 to capture the time-varying effects. Constructs were fixed in 4% paraformaldehyde (Electron Microscopy Sciences, Hatfield, PA; Cat#: 15710) for 20 min at room temperature and washed three times in 1X phosphate buffered saline (PBS) for all groups (n = 6/group).

Experimental outline and protocol of oxygenation and temperature conditioning depicting continuous conditions
The temperature experiments comprised four levels of 28°C, 33°C, 37°C (control), and 39°C. Baseline angiogenesis (Fig. 1C) was assessed at continuous temperatures in separate incubators that were set to the target temperature overnight prior to the experiment. Constructs were left in each condition for 7 days interrupted only for preacclimated media changes. Additionally, time-varying experimentation assessed the impact of daily 12-h bouts in either subnormothermic (cyclic 33°C) or supernormothermic (cyclic 39°C) exposure on MVF network formation (Fig. 1D). Identical controls were used across baseline characterization of continuous and time-varied conditions. Constructs were fixed on day 7 in 4% paraformaldehyde for 20 min at room temperature and washed in 1X PBS three times for all groups (n = 5–6/group).
Immunofluorescence staining of MVFs
Assessment of vascular network parameters and proliferation were calculated from immunofluorescent images. Twenty-four hours prior to fixation, constructs were incubated with EdU (5-ethynyl-2′-deoxyuridine, 10 µM), and days 3 and 7 endpoint media changes were skipped to preserve labeling continuity. After fixation, constructs were permeabilized for 30 min using 0.1% Triton X-100 (Sigma-Aldrich, St. Louis, MO) and incubated at room temperature for 30 min with the Click-iT EdU reaction cocktail per the manufacturer’s instructions (Thermo Fisher Scientific). Samples were blocked for 2 h in 0.1% Triton X-100 with 5% w/v bovine serum albumin (BSA, Sigma-Aldrich, St. Louis, MO; Cat#: A3294), and then stained with rhodamine-labeled Griffonia Simplicifolia (GS-1) lectin (Vector Labs, 15 µg/mL) and DAPI (4′,6-Diamidino-2-Phenylindole, Dilactate, BioLegend, 1:1000 dilution) with 1% w/v BSA overnight at 4°C. Gels were washed in 1X PBS three times and imaged at three randomly selected fields using a spinning disk confocal microscope (Nikon, Japan; SoRa) at 10X (Nikon; Plan Apo, NA = 0.45) to generate 250 µm z-stacks with 5 µm step size.
Vascular network morphometric quantification
Morphological analysis of the volumetric images was performed using AMIRA (Thermo Fisher Scientific) to measure branching and total network length, as previously described. 43 Briefly, z-stacks were three-dimensional (3D) median filtered, deconvolved, and multithresholded to generate segmented volumes of MVFs. Voxel clusters under 60 voxels were excluded by island removal, and a centerline tree algorithm was used to measure network length and branching. Further, connected components below 200 µm in length were excluded, in order to examine the network formation beyond the initial MVF seeding lengths of 20–200 µm.
Cellular proliferation quantification
Maximum intensity projections of immunofluorescent z-stack images were used to quantify the percent proliferating (EdU+) nuclei (DAPI+) via the Coloc 2 function (ImageJ) and Mander’s coefficient of overlap (M2).
44
This proportional metric evaluates the fraction of DAPI+ nuclei actively proliferating, calculated as follows:

The three randomly selected, nonoverlapping fields were averaged for each biological replicate.
Cellular viability assessment
Cellular viability was determined using Cyto3D live/dead assay (The Well Bioscience) on day 7 for each group (n = 3) per the manufacturer’s guidelines. Hoechst (HO) 33342 (Thermo Fisher Scientific) was added at a 1:1000 dilution to stain all nuclei. Constructs were incubated for 15 min and immediately imaged at three randomly selected fields using a spinning disk confocal microscope (Nikon SoRa) at 10X, acquiring 250 µm z-stack at 5 µm step size. Images were processed by selection of a subset of the z-stack (25 µm thick) that contained MVFs, applying maximum intensity projection, a median filter, and then a threshold. Viability reflects the proportion of propidium iodide (PI) negative (membrane-intact) nuclei calculated using Mander’s coefficient of overlap (M2 from Coloc2, ImageJ)
44
:

Gene expression via real-time quantitative polymerase chain reaction
Changes in gene expression due to environmental conditions were examined using real-time quantitative polymerase chain reaction (RT-qPCR). RNA extraction and purification were conducted as previously described. 9 Briefly, constructs were lysed with TRIzol (Thermo Fisher Scientific), homogenized via an 18-gauge needle, and phase separated with chloroform and centrifugation (12,000 g for 5 min). Constructs exposed to oxygenation stress were maintained at their endpoint oxygenation level in a Nexus glove box (Vacuum Atmospheres, Hawthorne, CA) during TRIzol lysis. The aqueous phase was extracted and subsequently purified with a Purelink RNA spin column kit (Thermo Fisher Scientific). RNA concentration was determined by NanoDrop spectrophotometer (Thermo Fisher Scientific), and complementary DNA (cDNA) was synthesized using qScript cDNA SuperMix (QuantaBio, Beverly, MA) in a Mastercycler (Eppendorf, Hamburg, Germany) per manufacturer’s instructions. Final cDNA concentrations were confirmed as equivalent with a NanoDrop spectrophotometer. TaqMan probes were used to assess gene expression targeting Hif1α, Serpine1, Vegfa, and Thbs1 (Supplementary Table S1). Gene expression was quantified using QuantStudio5 real-time PCR (Thermo Fisher Scientific). Rat universal cDNA (Biochain Institute Inc., C4434567) and ultrapure water were used as positive and negative controls, respectively. Data were normalized to Hprt1 housekeeping gene expression, as it did not have significantly different levels of relative expression across groups using the ΔCt method.45,46
Statistical analyses
Datasets were first analyzed for normality and equality of variance using the Shapiro−Wilks and Bartlett’s tests, respectively. Statistical significance was determined via one-way analysis of variance (ANOVA) with Tukey’s multiple comparisons test for single endpoint experiments; a Welch ANOVA with Dunnett’s T3 multiple comparisons test was used in cases where the variances significantly differed among groups. A two-way ANOVA for network parameters measured on day 3 and day 7 was used to account for experimental group and time. Post hoc tests were done using Tukey’s multiple comparisons test (GraphPad Prism 10) with α = 0.05. Outliers were identified using the Robust regression and Outlier removal (ROUT) method (Q = 1%), and data are shown as mean ± standard deviation.
Results
The impact of continuous oxygenation levels demonstrated reduced angiogenic potential with decreasing oxygen concentrations. The control group (20% O2) resulted in more robust angiogenesis compared with lower oxygen levels, as evidenced by visual inspection of the vascular network (Fig. 2A–C). This contrasted with significantly lower network length and branching under physoxic (8% O2) and hypoxic (1% O2) groups (Fig. 2D, E). Cellular proliferation and viability similarly demonstrated a reduction across groups, with lower oxygenation levels resulting in lower cellular viability and proliferative capacity (Fig. 2F, G). This inhibition was magnitude-dependent, with more severe reductions in network length observed as oxygen levels decreased. However, there was no difference in branching between physoxic and hypoxic groups (Fig. 2E), suggesting sprouting angiogenesis may have been inhibited in these lower oxygenation levels. These results underscore the critical role of oxygenation in supporting vascular network formation, with lower levels of oxygenation exerting a negative impact on angiogenesis in vitro.

MVF growth under continuous oxygenation conditions. Representative maximum intensity z-projections of lectin (red), DAPI (blue), and EdU (green) stained MVFs at day 7 in control
The time-varying oxygenation conditions were compared with controlled 20% O2 continuous oxygenation, showing early hypoxia was more proangiogenic than cyclic bouts. MVF-seeded constructs were temporally exposed to either cyclic hypoxic with daily 8 h exposure, or early hypoxic where only the first 48 h of culture was in hypoxia. All groups showed an increase in total network length, number of branches, and percentage of proliferating nuclei from day 3 to day 7, as lectin-stained networks emerged (Fig. 3A–F). However, by day 7, total network length was significantly lower in the cyclic hypoxic group compared with the early hypoxic group (Fig. 3G). Between day 3 and day 7, cyclic hypoxic increased network length by 3778 µm while early hypoxic increased network length by 7492 µm on average (Fig. 3G). This suggests cyclic hypoxic may disrupt and/or delay the angiogenic response. Conversely, early hypoxic did not adversely affect network formation, as there was no difference in network length or number of branches with the control group (Fig. 3G, H). There were no differences in proliferating nuclei (Fig. 3I), suggesting some exposure to a controlled (20% O2) environment maintains proliferative capacity of these angiogenic networks. Decreased cellular viability on day 7 provided further evidence of an inhibited angiogenic response to cyclic hypoxic (Fig. 3J). Interestingly, early hypoxic network formation occurred with similar cellular viability to the cyclic hypoxic group, which was significantly decreased from the control group (Fig. 3J). This implies an oxygen-sensitive nature of vessel sprouting and elongation, and cellular viability, while highlighting the detrimental effects of cyclic hypoxic stress on network formation and cellular viability.
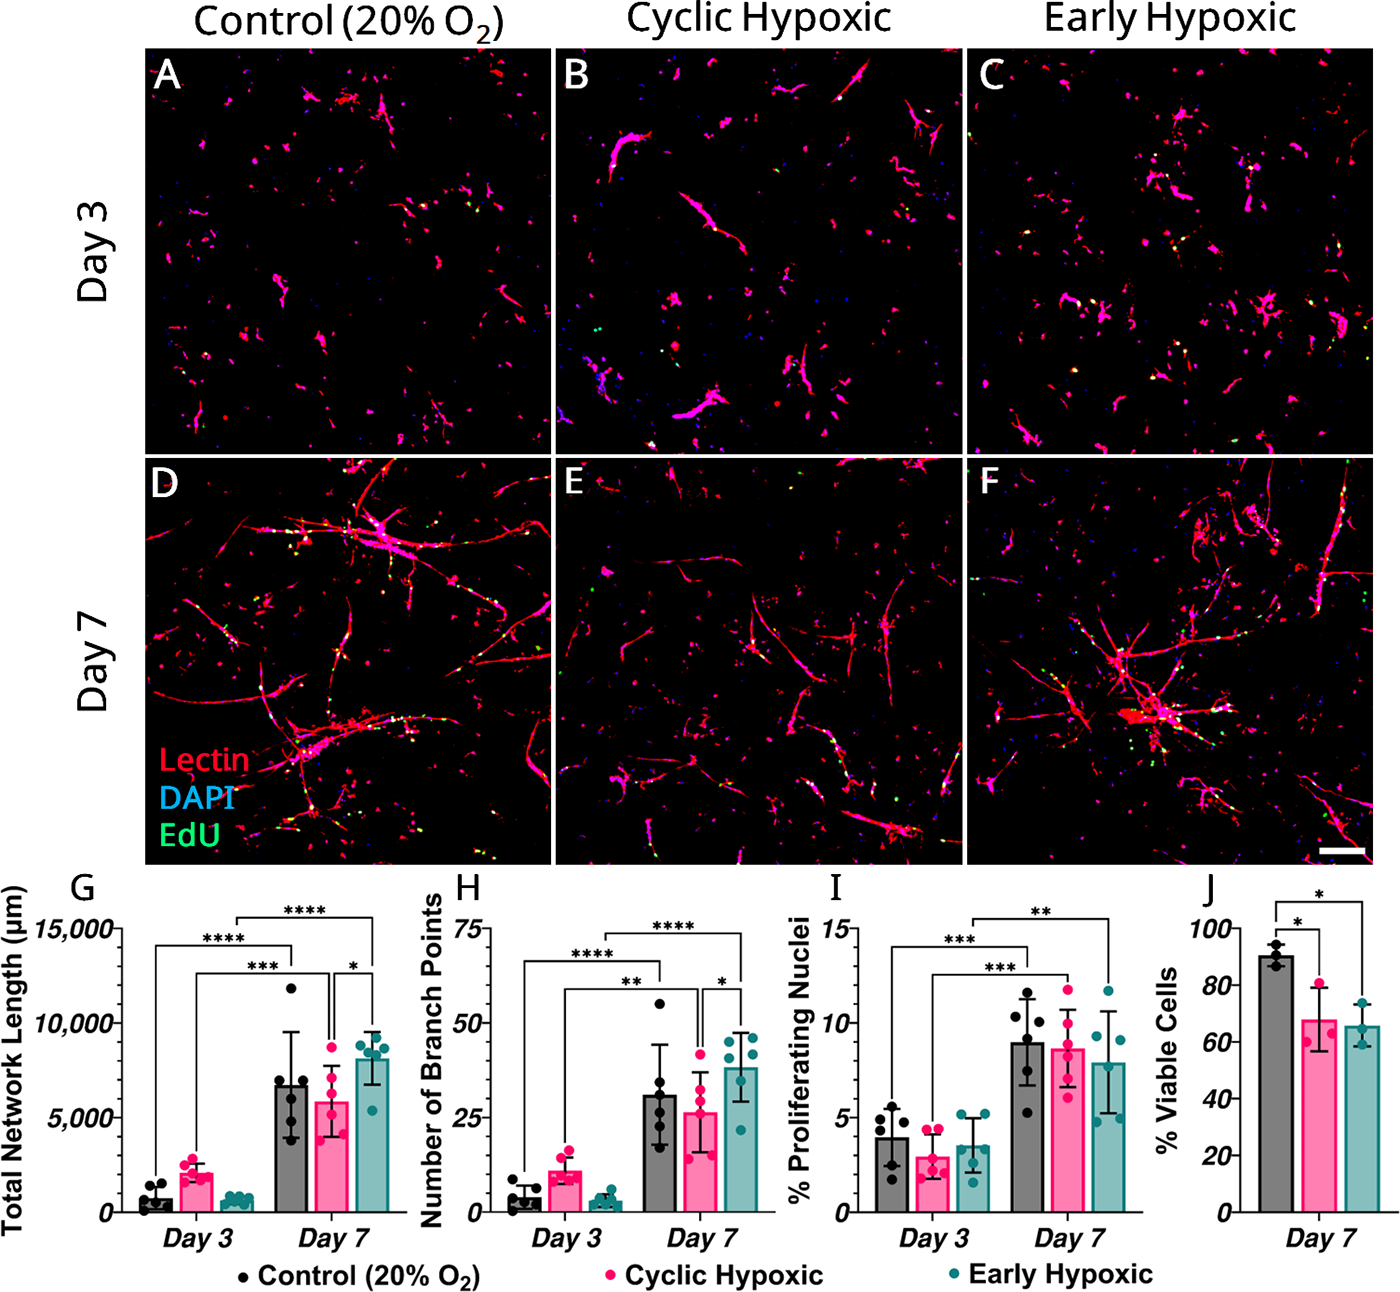
MVF growth under time-varying hypoxic exposure. Representative maximum intensity z-projections of lectin (red), DAPI (blue), and EdU (green) stained MVFs at days 3 and 7 in control
The baseline effects of continuous exposure to temperature levels on vascular network formation revealed subnormothermic conditions (28°C and 33°C groups) inhibited network formation compared with control (37°C) (Fig. 4A–D). There was a significant decrease in total network length, number of branch points, cellular proliferation, and viability in these groups compared with control (37°C) and supernomothermic (39°C) conditions (Fig. 4E–H). The detrimental impact of 28°C was also visually demonstrated by the dissociation of microvascular fragments (Fig. 4B, white arrow). Supernormothermic temperatures (39°C) resulted in a vascular network that did not differ from the control group in network length, number of branches, cellular viability, and proliferation (Fig. 4E–H). This suggests MVFs can tolerate slight increases in temperature without adverse effects on angiogenic development. Continuous exposure to these sub- and supernormothermic levels provides insight into the sensitivity of MVF network formation to temperature environments.
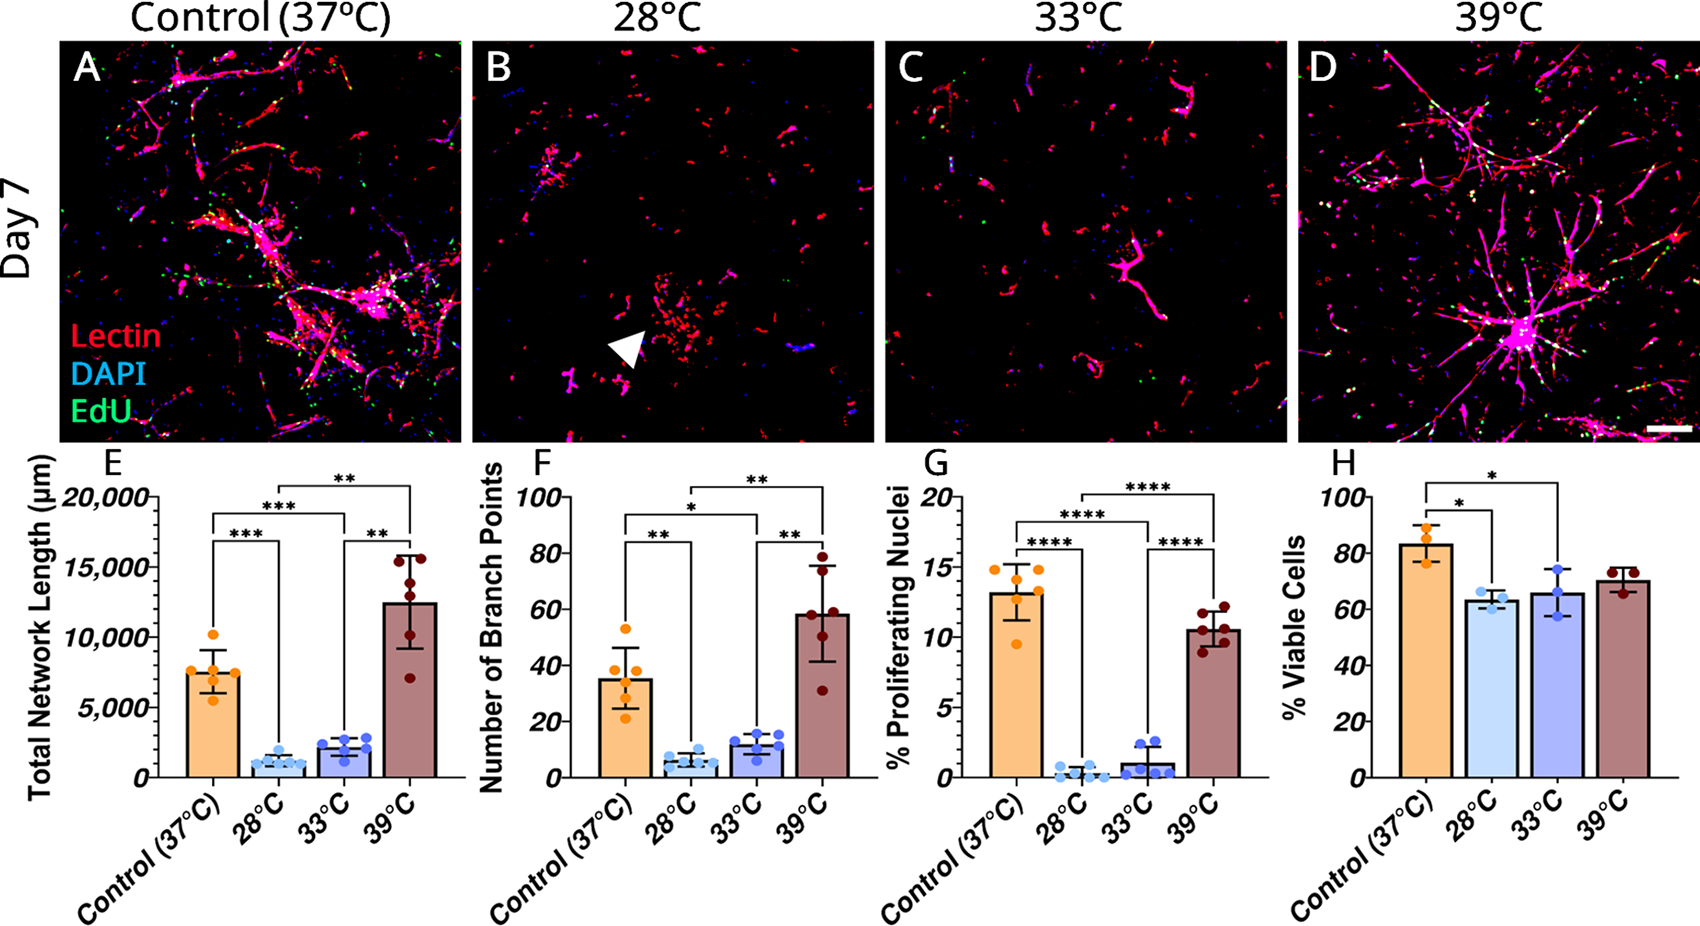
MVF growth under continuous temperature conditions. Representative maximum intensity z-projections of lectin (red), DAPI (blue), and EdU (green) stained MVFs at day 7 in control
Time-varied temperatures in 12-h cyclic bouts showed subnormothermic cyclic exposure (cyclic 33°C) inhibited MVF network formation (Fig. 5A–C). The cyclic 33°C group had a significant decrease in vascular network length and percentage of cells undergoing proliferation compared with control (37°C) and cyclic 39°C (Fig. 5D, F). The cyclic 33°C group had a significantly decreased number of branch points than the cyclic 39°C (Fig. 5E), and a significant decrease in cell viability compared with the control group (37°C) (Fig. 5G). These differences suggest MVFs have greater angiogenic capacity in the cyclic 39°C condition compared with the cyclic 33°C. These findings demonstrate a sensitivity to lower temperatures during the early phase of angiogenesis in vitro, indicating the importance of maintaining optimal thermal conditions to support effective vascular network formation. However, these data describe the tissue and cellular level response, while the underlying molecular mechanisms remain unclear.

MVF growth under cyclic temperature conditions. Representative maximum intensity z-projections of lectin (red), DAPI (blue), EdU (green) stained MVFs at day 7 in control
Gene expression analysis of the continuous oxygenation conditions revealed changes in Hif1α and Vegfa. The continuous exposure conditions showed the hypoxic (1% O2) group mean for Hif1α expression at day 7 was ∼20% lower than the control group mean (Fig. 6A; p = 0.0542). Conversely, Vegfa expression peaked in hypoxic conditions (1% O2) (Fig. 6B) despite poor network metrics (Fig. 2D, E). Moreover, time-varied oxygenation conditions at day 7 had elevated Hif1α and Vegfa expression in only the cyclic hypoxic condition (1% O2 8 h/day) (Fig. 6C, D) despite reduced network length and branching (Fig. 3G, H). This suggests continuous and intermittent oxygen deficiencies elicit stress-related transcriptional pathways yet disrupt vascular growth.
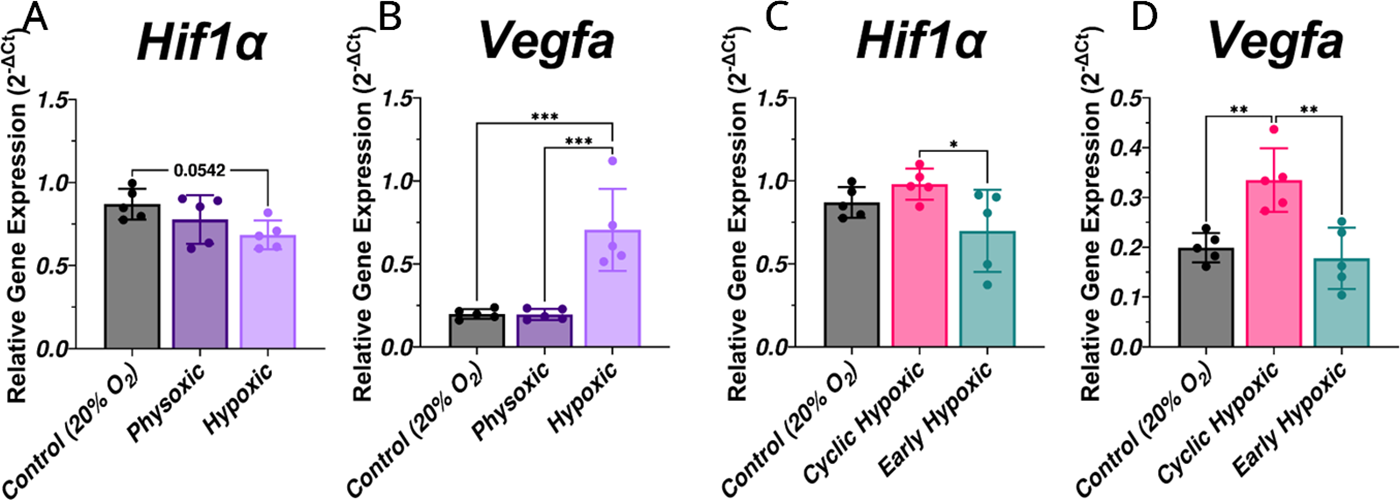
Day 7 MVF gene expression under different oxygen exposures. Relative gene expression of Hif1α and Vegfa in continuous
Gene expression analysis of the continuous temperature conditions revealed changes in Serpine1 and Vegfa. Continuous exposure to subnormothermic conditions (28°C and 33°C) decreased Serpine1 expression compared with 39°C (Fig. 7A), while only the 28°C decreased Vegfa expression (Fig. 7B). This downregulation aligns with the decreased network morphometric parameters from subnormothermic conditions (Fig. 4E, F). Further, the time-varied temperature exposure had similar downregulation from subnormothermic cycling. Serpine1 was downregulated in the cyclic 33°C group compared with the control group (Fig. 7C). Vegfa expression was upregulated in the cyclic 39°C group compared with the cyclic 33°C group (Fig. 7D). This suggests prolonged subnormothermic stress and its temporal presentation of the maximum thermoregulatory bout suppresses angiogenic regulators and impairs vascular growth.

Day 7 MVF gene expression under different thermal exposures. Relative gene expression of Serpine1 and Vegfa in continuous
Discussion
This study investigated the impact of varying oxygenation and temperature conditions on angiogenesis using an in vitro model composed of intact MVFs and was motivated by the need to understand how temporally changing environmental factors influence angiogenesis for tissue regeneration. Angiogenesis is a dynamic process that unfolds over time, with critical stages occurring at specific time points. 9 By day 3 in culture, MVFs begin to sprout and initiate the formation of a network. On day 7, MVF networks elongate and begin to stabilize. This temporal pattern of angiogenesis in vitro mimics the timeline in vivo, enabling the study of this multicellular coordinated process. 47 By mimicking the temporal patterns of oxygenation stress and thermoregulation observed in vivo, we sought to provide insights that could inform regenerative medicine strategies aimed at optimizing revascularization outcomes.
Our results demonstrated that continuous low oxygenation levels inhibited network formation, viability, and proliferation in a magnitude-dependent manner. The paradoxical downregulation of Hif1α and upregulation of Vegfa due to chronic exposure to hypoxia (Fig. 6A, B) highlights possible feedback loops that prevent overactivation of Hif1α while permitting Vegfa expression, similar to what has been described in severe hypoxia. 48 In addition, the continuous physoxic group had decreased network formation, viability, and proliferation (Fig. 2B, D–G) without a significant difference in gene expression of Hif1α or Vegfa compared with the control (Fig. 6A, B). Therefore, the angiogenic effects appear to be independent of the Hif1α and Vegfa pathways at the physoxic level. Inhibited MVF network formation was accompanied by measurable decreases in cellular viability and proliferation, emphasizing the importance of cellular survival for effective revascularization strategies.
Temporally varied hypoxic conditioning also impacted network formation. Cyclic hypoxic produced a detrimental effect on network length, branching, and viability on day 7 (Fig. 3G–J). In contrast, early hypoxic exposure, an equivalent hypoxic duration of 1% O2 applied for the first 2 days of culture, produced robust network formation similar to controls despite a drop in viability. Cyclic hypoxia and early hypoxia decreased cell viability, whereas proliferation was consistent with the control group, suggesting acute oxygenation stress reduced cell survival without impairing division rates. However, the cells that survived daily bouts of cyclic hypoxic formed less robust vessel networks. This coincides with an increase in Hif1α and Vegfa expression (Fig. 6C, D), suggesting the activated Hif1α and Vegfa signaling pathways from cyclic hypoxic exposure impede angiogenesis in vitro.49,50 Furthermore, there were no differences in Hif1α or Vegfa expression at day 3 across all groups (Supplementary Fig. S1A, B). This suggests Hif1α and Vegfa transcriptional changes may have accumulated over time.
Taken together, chronic continuous hypoxic exposure inhibits network morphology via impeded cellular viability and proliferation with dysregulated Hif1α and Vegfa gene expression. This is consistent with the response of cyclic hypoxic exposure that disrupts the angiogenic cascade in our in vitro model. However, a transient period (48 h) of early hypoxia followed by return to the 20% oxygen level promotes robust vascular network formation that is consistent with the control group. These findings highlight the potential benefits of restricted oxygenation therapy that targets specific temporal windows along the healing trajectory to assist in wound hypoxic regulation.
In addition to oxygenation, prolonged exposure to subnormothermic temperatures (28°C, 33°C) inhibited network formation, viability, and proliferation, while the supernormothermic (39°C) group remained similar to the control (Fig. 4E–H). These vascular network characteristics corresponded with decreased Serpine1 expression compared with 39°C (Fig. 7A). However, Vegfa expression was downregulated in the 28°C group and not the 33°C group compared with control (Fig. 7B), indicating a possible threshold effect for temperature-induced suppression of this key angiogenic factor. The absence of Vegfa downregulation at 33°C suggests this moderate cooling does not cross the threshold required to suppress Vegfa transcription. Although angiogenic growth was limited at day 7, it is possible that extended culture durations might form vessel networks in 33°C environments.
Dynamic, time-varied, temperature environments revealed similar trends, as 12-h subnormothermic (cyclic 33°C) exposure inhibited network formation, cellular viability, and proliferation (Fig. 5D–G). This corresponded with downregulation of Serpine1 and Vegfa, without affecting Thbs1 (Fig. 7C, D, and Supplementary Fig. S1D). This suggests time-varied cold, but not warm, temperatures shift transcriptional pathways toward matrix remodeling with decreased angiogenic growth factor production.51,52 By contrast, supernormothermic cyclic conditions did not cause a drop in the network parameters or the cellular viability and proliferation (Fig. 5D–G). This implies that MVFs may be resilient to supernormothermic stress, while subnormothermic conditions at the maximum exposure for thermoregulation disrupt angiogenesis in vitro.
While our in vitro model provides valuable insights, it does not fully replicate the complex in vivo environment of angiogenesis. Limitations include the lack of blood perfusion that occurs in situ and the lack of an inflammatory cascade with a systemic immune response that is concomitant with injury. Further, the different angiogenic responses between temperature and oxygen conditions could be due to differences in the rate of diffusion between oxygen, a soluble gas, the thermal heat transfer, and the oxygen concentration within the media, physical measurements that were not measured in these experiments. The in vitro model was comprised of MVFs isolated from separate, pooled donor tissue to minimize biological variability. Another potential limitation is supplementing exogenous rhVEGF-A in the culture media, which may impact the endogenous expression under our imposed environmental conditions. However, rhVEGF-A supplementation was consistent across all conditions to isolate the effect of environmental variables from potential endogenous variability of VEGF-A production. Future work could determine if the environmental response is dependent on levels of rhVEGF-A supplementation. The network morphological data represented by total network length and number of branch points is limited to early sprouting events and further work is needed to establish these results in the context of complex network formation, such as in vivo. Despite these limitations, our study offers novel insights into the effects of temporal variations in oxygenation and temperature impacting angiogenesis on the morphological, cellular, and gene expression levels. These experimental parameters were designed to closely parallel the physiological and pathological timelines of wound healing and tissue regeneration, with recent work suggesting that oxygen dynamics in the tissue injury are more variable and context-dependent than previously recognized. 53 The environmental dynamics explored here supports the utility of the in vitro system for gaining insight into the complex angiogenic response and remodeling dynamics in living tissues.
These findings highlight the remarkable sensitivity of angiogenic networks to environmental fluctuations, as evidenced by pronounced changes in morphology via network length and branching and the cellular viability and proliferation. The condition-specific transcriptional shifts observed here align with changes in vascular morphology providing a mechanistic link to potential targets impacted by the environmental stimuli that fundamentally reshape vascular adaptation. Future research should focus on physiologically relevant stimuli to enhance our understanding of angiogenesis and improve clinical strategies for tissue regeneration. Advancing in vitro models to better mimic in vivo conditions could involve technologies such as microfluidic systems and 3D bioprinting to help bridge the spatiotemporal relationship in complex living tissue with relevant environmental stimuli. Additionally, physiologically relevant stimuli coincide with motion and dynamic loading of tissue. Thus, implementing loading conditions that mimic tissue movement would enhance our understanding of how the cellular response from environmental stresses couple with mechanical stimuli. These advancements would enable the next generation of microphysiological systems that assess the effects of environmental stimuli on angiogenesis.
Authors’ Contributions
S.N.: Conceptualization (equal), investigation (lead), formal analysis (lead), methodology (lead), resources (equal), software (lead), visualization (lead), writing—original draft (lead), and writing—review and editing (equal). A.R.: Methodology (supporting), supervision (equal), writing—original draft (supporting), and writing—review and editing (equal). A.B.: Investigation (supporting), formal analysis (supporting), visualization (supporting), and writing—review and editing (equal). E.D.: Software (supporting) and writing—review and editing (equal). K.A.J.: Conceptualization (equal), resources (equal), supervision (equal), and writing—review and editing (equal). G.E.R.: Conceptualization (equal), methodology (supporting), and writing—review and editing (equal). K.L.: Conceptualization (equal), methodology (supporting), resources (equal), and writing—review and editing (equal). A.S.P.L.: Conceptualization (equal), Supervision (equal), and writing—review and editing (equal). R.E.G.: Conceptualization (equal), funding acquisition (lead), supervision (equal), and writing—review and editing (equal).
Footnotes
Acknowledgments
The authors wish to acknowledge Adam Fries at UO’s GC3F core for image acquisition support, and collaborators at the Phil and Penny Knight Campus for Accelerating Scientific Impact: Gabriella Lindberg for glove box access and RNA extraction support, Danielle Benoit for thermal cycler access, Phillip Hernandez and Ken Weekes for gene expression training, and Calin Plesa and Sam Hinton for RT-qPCR support.
Funding Information
This manuscript is the result of funding in whole or in part by the National Institutes of Health (NIH). It is subject to the NIH Public Access Policy. Through acceptance of this federal funding, NIH has been given a right to make this manuscript publicly available in PubMed Central upon the official date of publication, as defined by NIH. This research was supported by NIH-NIDCR: R01DE029553 and the Wu Tsai Human Performance Alliance at the University of Oregon.
Disclosure Statement
The authors declare that they have no competing interests.
Supplemental Material
References
Supplementary Material
Please find the following supplemental material available below.
For Open Access articles published under a Creative Commons License, all supplemental material carries the same license as the article it is associated with.
For non-Open Access articles published, all supplemental material carries a non-exclusive license, and permission requests for re-use of supplemental material or any part of supplemental material shall be sent directly to the copyright owner as specified in the copyright notice associated with the article.
