
Abstract
Objective:
To address prolonged lengths of stay (LOS) in a Level 1 trauma center, we examined the impact of implementing two data-driven strategies with a focus on the physical environment.
Background:
Crowding in emergency departments (EDs) is a widely reported problem leading to increased service times and patients leaving without being seen.
Methods:
Using ED historical data and expert estimates, we created a discrete-event simulation model. We analyzed the likely impact of initiating care and boarding patients in the hallway (hallway care) instead of the exam rooms and adding a dedicated triage space for patients who arrive by emergency medical services (EMS triage) to decrease hallway congestion. The scenarios were compared in terms of LOS, time spent in exam rooms and hallway spaces, service time, blocked time, and utilization rate.
Results:
The hallway care scenario resulted in significantly lower LOS and exam room time only for EMS patients but when implemented along with the EMS triage scenario, a significantly lower LOS and exam room time was observed for all patients (EMS and walk-in). The combination of two simulated scenarios resulted in significant improvements in other flow metrics as well.
Conclusions:
Our findings discourage boarding of admitted patients in ED exam rooms. If space limitations require that admitted patients be placed in ED hallways, designers and planners should consider enabling hallway spaces with features recommended in this article. Alternative locations for boarding should be prioritized in or out of the ED. Our findings also encourage establishing a triage area dedicated to EMS patients in the ED.
Keywords
Introduction
Emergency department (ED) crowding continues to be a major issue in healthcare systems across the United States (U.S.). It leads to increased service times and patients leaving without being seen. A growing body of evidence suggests that ED crowding is linked to adverse quality of care, such as medication errors, patient dissatisfaction, and staff burnout (Crane et al., 2014; Handel et al., 2014; Scott et al., 2014), and unfavorable patient outcomes and higher mortality rates (M. Chan et al., 2017; Woodworth, 2020). ED crowding may be due to several factors including reduction in the number of EDs, overall growth in the demand for ambulatory care, shortage in ED medical and nursing staff, and use of ED services by patients seeking care for nonurgent problems (Hoot & Aronsky, 2008; Robert Wood Johnson Foundation, 2013). Studies have shown that some strategies such as bedside registration, priority admission triage programs, enhanced communication with medical departments, additional personnel, higher inpatient bed availability, referring nonacute patients to nonemergency care settings (i.e., urgent care centers, primary care facilities, family physician offices), and establishing observation or fast-track units may lead to improvements in ED patient flow (H. Chan et al., 2014; Hoot & Aronsky, 2008). As a modeling analysis tool, discrete-event simulation (DES) is being used to explore the impact of implementing different strategies and their impacts on patient flow outcomes for both existing and new EDs. DES also helps administrators make informed facility design decisions before actual investments are made for renovations and new projects.
With a focus on the physical environment, we identified strategies that can be implemented to improve patient flow in an ED faced with crowding and long wait times and examined these strategies using DES. Specifically, we examined the impact of (1) using hallway spaces instead of exam rooms for boarding patients and (2) establishing an emergency medical services (EMS) triage area dedicated to the patients being delivered by EMS services on several patient flow metrics. The patient flow metrics of interest in this study were length of stay (LOS) in ED, exam room and hallway time, service time, blocked time, and utilization rate.
Alternative Strategies
Using hallway spaces for boarding
One of the major factors causing ED crowding is hospitals’ inability to move patients upon the completion of the examination and treatment from ED beds to inpatient beds. Several studies have shown that holding admitted patients in the ED until an inpatient bed becomes available, commonly referred to as “boarding,” negatively impacts quality of care and increases potential for adverse events (Stone & Winger, 2017). In some cases, door-to-floor time—the time required to move a patient through ED to an appropriate inpatient bed—is reported to exceed 21 hr (Derlet & Richards, 2008). Although the bottleneck of boarding admitted patients in the ED is a part of the output process, it has consequences for the entire system, including the throughput of patients who are never admitted. The negative effects of this bottleneck on different operational and process flow metrics are recorded by some studies. Boarding inpatients in the ED resulted in a significant increase in discharged patient’s LOS (White et al., 2013) and door-to-provider time for both boarded patients and other ED patients (Napoli et al., 2020). Several solutions have been investigated in the literature, including increasing bed capacity of inpatient units, establishing an admission holding unit for admitted ED patients, using inpatient hallways for boarding, and using ED hallways for boarding (Derlet & Richards, 2008; Schreyer & Martin, 2017). In some cases, strategies that are advocated as being effective, such as ED bed expansion, have failed to reduce extended boarding times of admitted patients in EDs (Mumma et al., 2014). Adding more ED beds may not be effective when the intensive care and medical–surgical units are underbedded or underprojected. In hospitals with limited hospital bed capacity, a frequent boarding of patients in the ED is reported which reduces the availability of treatment spaces for new acute care patients (Mercer et al., 2019). It has been suggested that by allocating sufficient inpatient beds (e.g., beds in medical–surgical units) for the expected number of ED admissions per day, crowding might be reduced in those EDs that are chronically holding inpatient admissions (Henneman et al., 2009). One study found that inpatient bed management policies to ensure that EDs have reduced boarding times could potentially increase hospital revenues (Pines et al., 2011). However, ED beds are still being used for boarding. The ultimate aim is to free up ED rooms by moving admitted patients more quickly to make the room capacity available for other patients.
Establishing EMS triage/intake area
It was also shown that boarding in ED was one of the leading causes of ambulance diversion (Pines et al., 2011). Patients arriving by EMS usually undergo an expedited registration and triage process. In most EDs, after registration and a quick triage in an EMS intake area (usually up against a nurse station), the patients are moved to an exam room. If there is no available exam room capacity, they continue receiving care in ED hallways which are fraught with suboptimal nursing support and lack of privacy (Richards et al., 2014). Patients arriving via EMS tend to be of higher acuity and, unlike walk-in patients, they cannot be placed in the waiting room when there are no ED exam rooms available. Yet cases of walk-in patients have been studied more broadly to date (Broadbent et al., 2014; Pati et al., 2014). For this reason, an EMS triage area is recommended by Huddy (2016). He suggests adding a row of cubicles at the ambulance entry point equipped with medical gases to initiate care upon arrival.
Method
Setting
ED of interest was an in-hospital Level 1 trauma center for adults with an annual census of over 65,000 patients. It was 37,000 sq. ft. Two of its three main cores comprised a total of 29 private exam rooms and the third core was comprised of 14 cubicles separated by curtains without monitors. Cores were care zones or care modules, including groups of (1) exam rooms/cubicles, (2) clinical workstations and designated staff, and (3) support spaces. The trauma center was comprised of six rooms, including two resuscitation rooms. Figure 1 shows a simplified floor plan. In a typical day, the ED was staffed with three attending (supervising) physicians, 18–20 nurses, and six to nine residents. The ED had an integrated electronic medical record system that used Epic© interface.
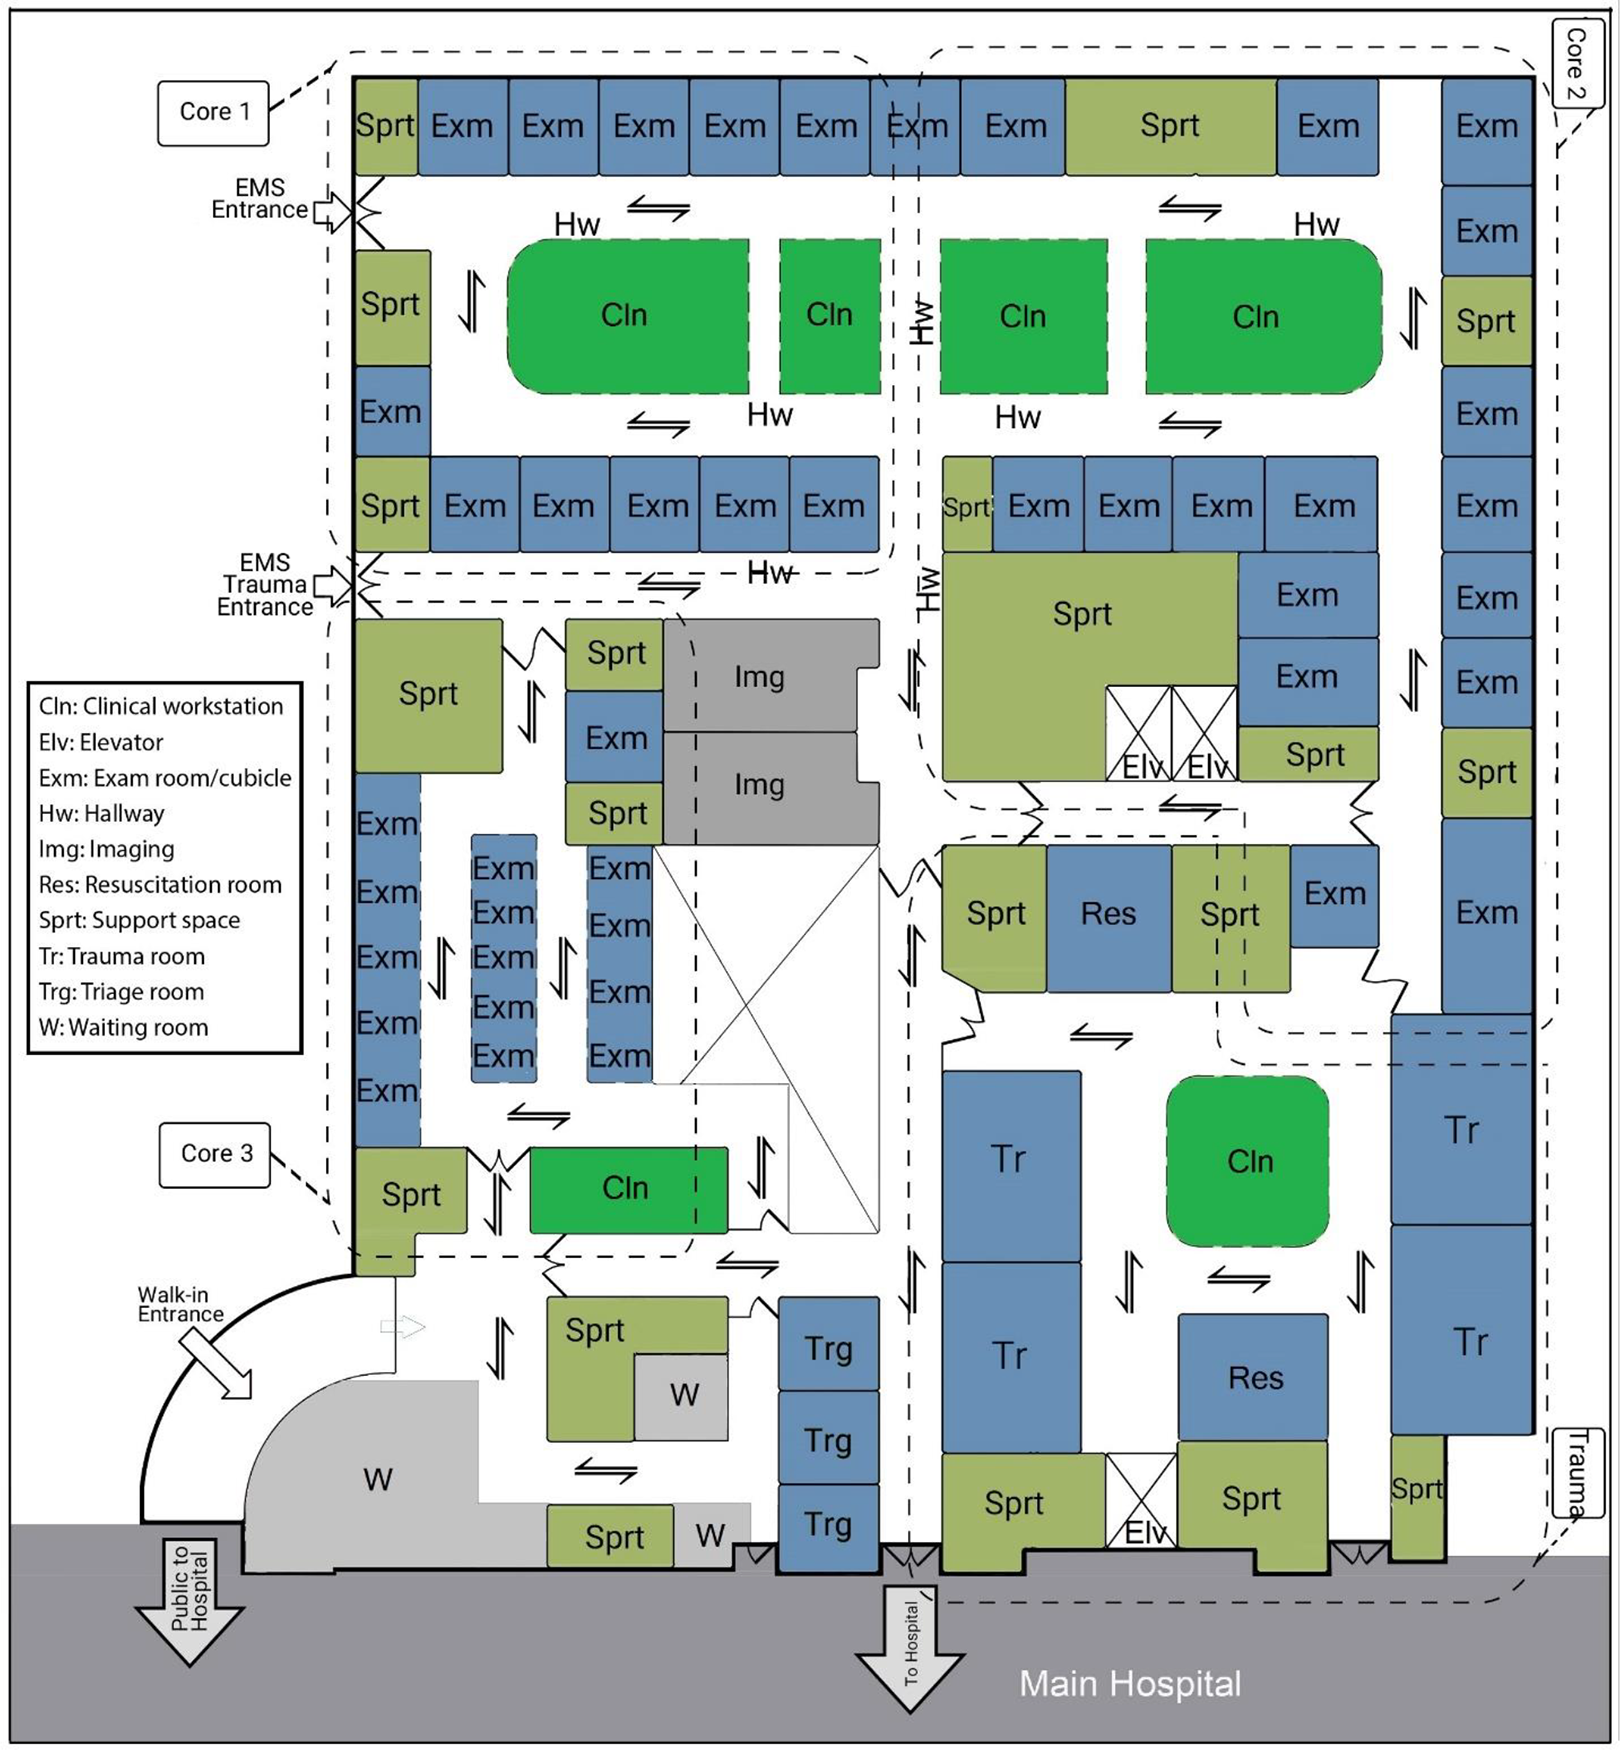
Emergency department floor plan diagram.
Patient arrival occurred via walk-in, ground EMS, or air EMS. A typical patient flow through the system included a quick triage, triage, treatment, and discharge or admission to the hospital. A summary of the most common patient flow through the ED is shown in Figure 2. As shown, patients with minor illnesses were kept vertical in subwaiting area where chairs and recliners were provided for rapid treatment. Like many hospitals in the United States, this ED was confronted with crowding and long wait times. Using this setting as an example, we explored the impact of alternatives on patient flow metrics. The study protocol was approved by the institutional review board.
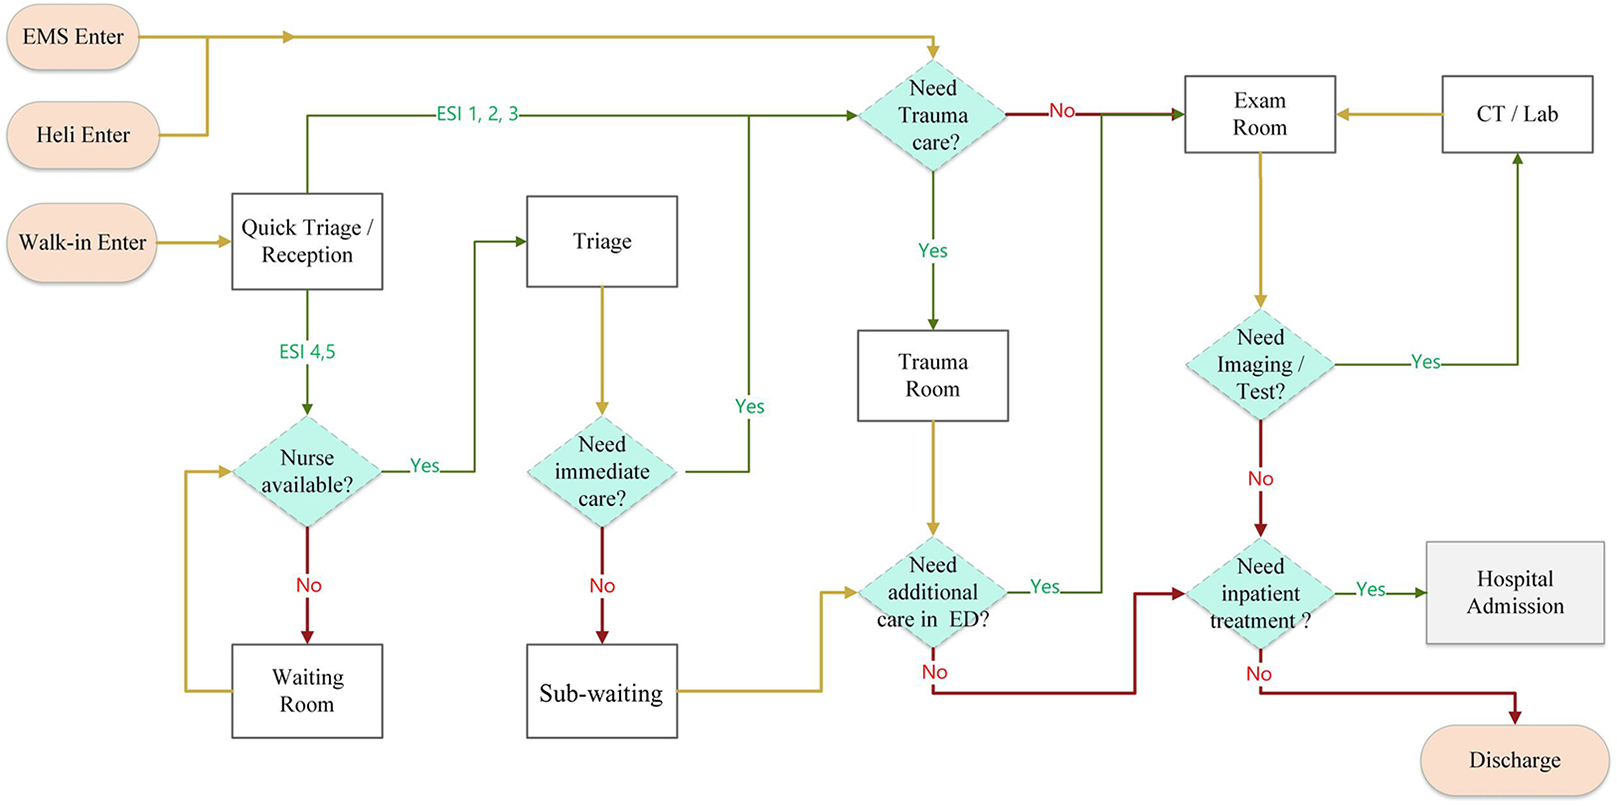
Schematic view of patient flow in the emergency department.
Patient Flow Metrics
The patient flow metrics in this study are defined in Table 1.
Definition of Patient Flow Metrics Examined as Study Outcomes.
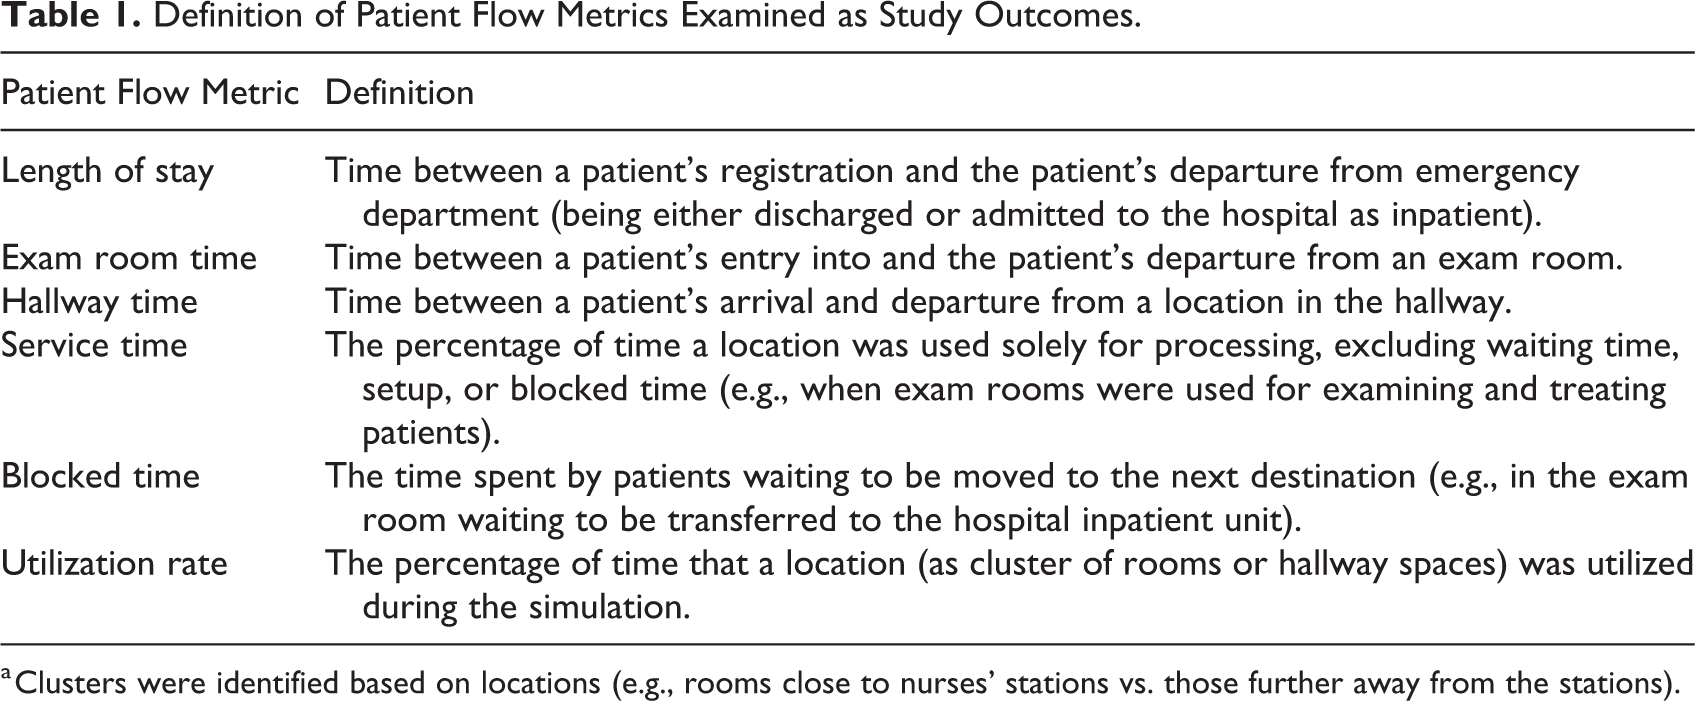
a Clusters were identified based on locations (e.g., rooms close to nurses’ stations vs. those further away from the stations).
Data Collection
The main source of data was historical electronic data from the in-house database of the hospital. Complementary data were also collected manually to track the process of patient flow, including staffing, the location of events (e.g., registration, triage, treatment, admission, discharge), circulation paths, function of spaces on the floor plan, and average time for moving between spaces. Several meetings were held with ED staff to fully understand the process. The following data items were obtained for a total of 2,000 patients from 2 weeks of a summer month, and 1,900 of the records were used after a rigorous data cleaning: (1) patient emergency severity index (ESI), (2) arrival time, (3) mode of arrival (e.g., walk-in, ground EMS, air EMS), (4) event times (e.g., triage, first provider assigned, lab tests), (5) event location (room numbers), (6) discharge time, and (7) mode of discharge (e.g., admit as inpatient, direct discharge from ED). Patient data were excluded if (1) data for any of the three core variables of patient ESI, arrival time, or discharge time were missing, (2) there was an obvious data entry error (e.g., negative value for LOS or LOS of longer than 100 days in ED), and (3) data were identified as outlier. A total of eight patients were identified as outliers based on their LOS values using the robust regression and outlier (ROUT) detection method (Motulsky & Brown, 2006) with a ROUT coefficient of 1%.
A list of critical events that were included in the model is provided in Supplementary File 1. Events were included in the model based on their potential impact on patient flow metrics. In order to reduce the level of complexity, we excluded small time intervals and those within another critical time interval. For example, our model did not account for separate time intervals of inpatient bed assigned and inpatient bed ready for admission. These time intervals were within the boarding time. Another example was combining the waiting time after registration and the triage time because these separate time intervals were not related to our scenarios.
From data, the following parameters were calculated: (a) occupancy rates of each exam room/cubicle and each hallway space as the percentage of time that a single space (an exam room or a hallway space) was occupied, (b) utilization rates of different clusters of exam rooms and clusters of hallway spaces, (c) LOS and exam room time for walk-in and EMS patients, (d) exam room time of patients who were discharged and those who were admitted to the hospital, and (e) average number of patients who took different paths (described under Scenarios).
Patient data were used in two stages. We used data from the first 900 patients (denoted hereafter as calibration data set) to develop a model. Next, we used a combination of the calibration data set and 1,000 consecutive patients (data from these 1,900 patients are denoted hereafter as validation data set) to validate our model. This strategy helped us improve the generalizability of the model, despite the small size of our data set. We were able to implement this strategy because by comparing patient data from 2 consecutive weeks, we did not detect significant differences in terms of distribution, volume, and composition. The two stages are described in detail in the next two sections.
Model Development
A DES model was developed using MedModel (ProModel, Orem, UT, v. 2018). Using the calibration data set, information from staff, and department layout, we developed a model consisting of arrival rates of patients, number of available resources (i.e., personnel), locations, path networks, and processes. To develop the simulation model, several assumptions were made. First, the movement characteristics of the patients and personnel were assumed to be the same in the model. Specifically, we assumed that both the patients and personnel (1) moved at the same constant speed and (2) took the shortest path throughout the ED system. Based on observation data, the average walking speed was set to 2 ft per second. A network of paths with realistic distances was used in the model to illustrate movement routs on the floor plan. Also, we assumed a constant processing time for the cleaning of the exam rooms. We did not model patient death in the ED. Although Core 3 was composed of smaller care areas, all three cores in our model were treated in the same way. We simulated the system for 2 weeks (i.e., 14 days). The system was started empty and idle, and the data collected from the first 2 days were eliminated for warm-up. In our preliminary experimentation, the sample average did not change significantly after 50 replications. Therefore, 50 replications were made to evaluate the performance measures of interest summarized in Table 1. Indices were calculated based on outputs from the 3rd to the 12th day to avoid the period that takes the system to reach the steady state.
Verification and Validation
Upon verification of the model, an animation of the simulated model was presented to a team of ED personnel to solicit expert opinion to further refine the model. The team included the director of emergency services, an ED physician, and the clinical leader. Next, we adopted a cross-validation approach to make sure the model behaved as was intended and reflected the system accurately. Historical data from 900 patients (calibration data set) were used to fine-tune the model parameters. After adjustment, the parameters were locked and were not changed during the next step to ensure an unbiased validation. We then compared simulation outputs and data from calibration data set and validation data set. While the objective of the first step (using calibration data set) was to assure the accuracy of the simulation architecture and parameters (verification), the second step (using validation data set) aimed to test the predictability of the model (validation). Specifically, LOS in ED and the time between a patient’s entry into and the patient’s departure from an exam room were examined for both EMS and walk-in patients. To validate the simulation model, we first used t tests to compare the means of historical and simulated data sets. Multiple t tests were done instead of a one-way analysis of variance (ANOVA) because our objective was to compare actual and simulated times from distinct populations (i.e., walk-in vs. EMS patients). These data were also derived from separate data sets (i.e., calibration and validation data sets). In the case of model validation, t test is a more conservative test compared to ANOVA followed by post hoc analysis, because the chance of detecting any difference between actual data and simulated data is higher when using t tests. Figures 3 and 4 present the results of six t tests. Except for one comparison condition, it can be seen that there were no statistically significant differences between the means of the historical and simulated data neither when the calibration data set nor when the validation data set was used. The only significant difference was observed between exam room time when the validation data set was used. For further validation of the simulation model, we also examined the utilization rates of exam rooms and hallway spaces. Figure 5 illustrates the utilization rates generated by the simulation model and those obtained by the analysis of the validation data set. It can be seen that the rates were within an acceptable range of 4%–15% difference for exam rooms. Therefore, the simulation model was assumed to be an accurate representation of the real system under consideration and was used to evaluate the impact of the proposed strategies. These test results are also provided in Supplementary File 2 in table format.
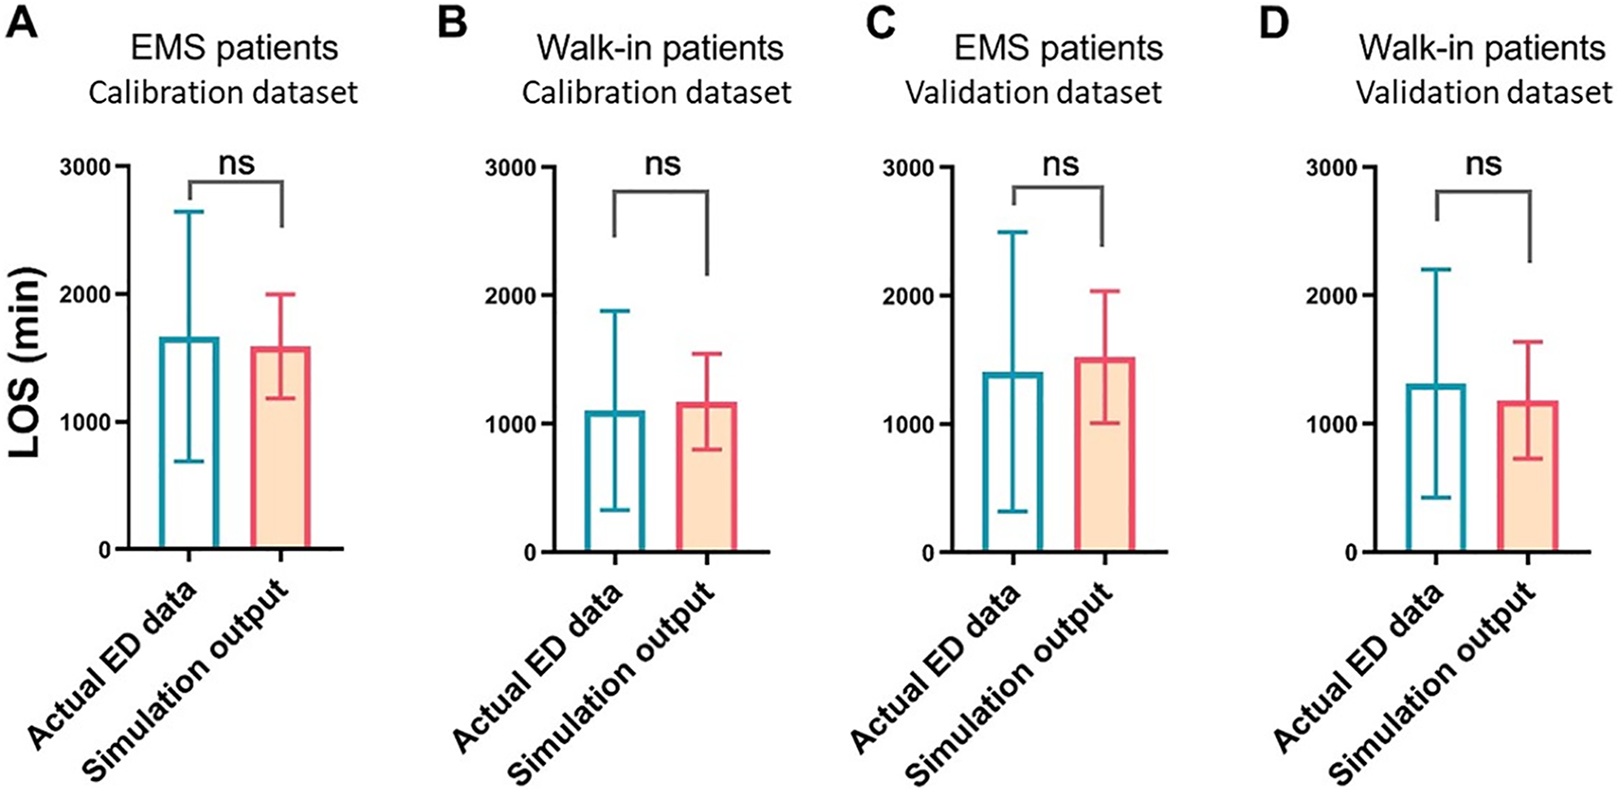
Comparison of simulated and actual patient length of stay (LOS) data for two categories of patients (emergency medical service (EMS) and walk-in) using calibration and validation data sets.
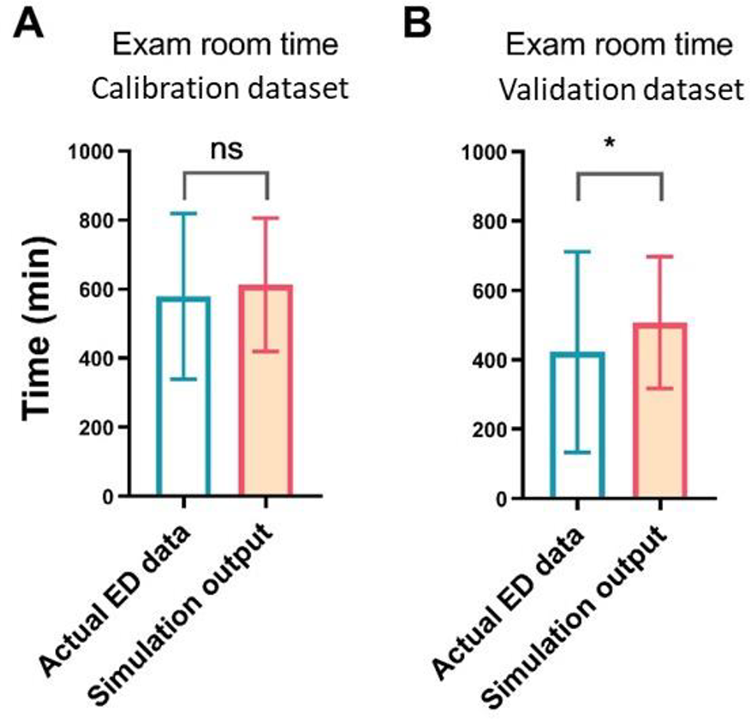
Comparison of simulated and actual patient exam room time data for all patients using calibration and validation data sets.
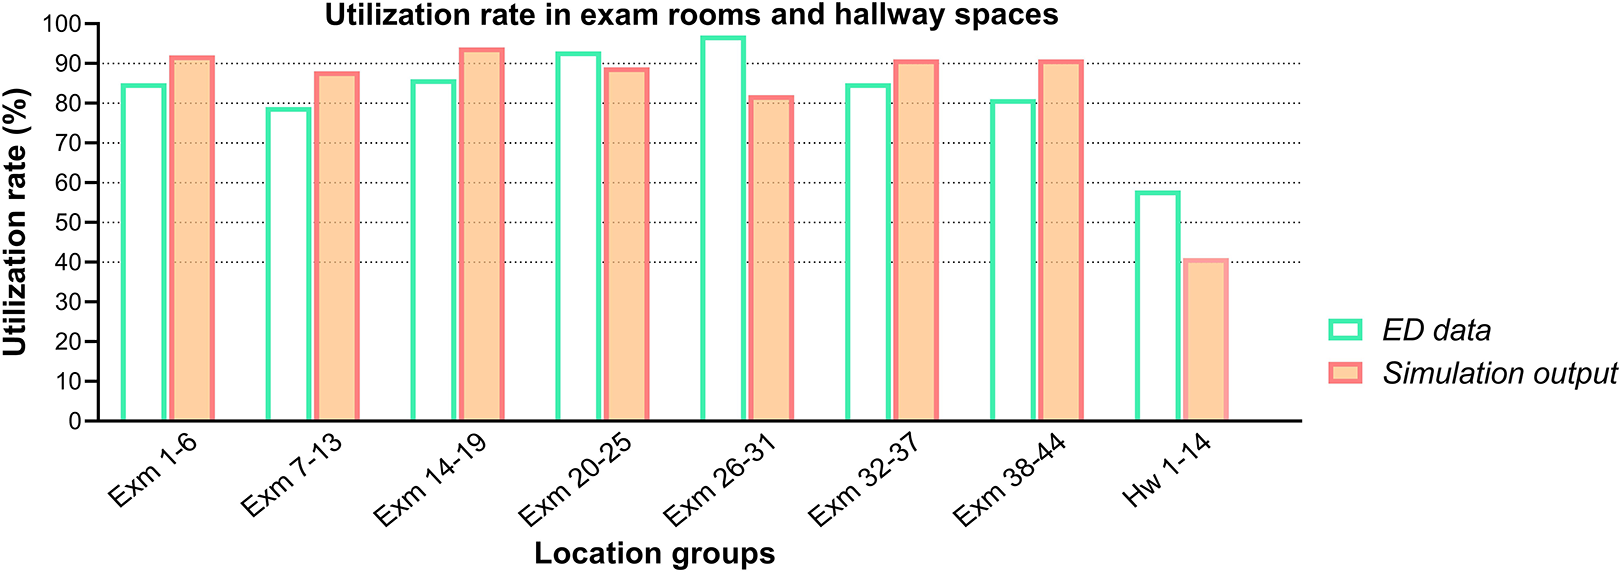
Comparison of the utilization rate of exam rooms and hallway spaces using the validation data set.
Scenario Development
Based on our interviews with the nurse manager and the unit assistant to the nurse manager, it can be noted that EMS patients were registered and assessed at an intake desk in the hallway. If no immediate capacity (i.e., available exam room capacity) existed, ongoing care was provided in the hallway, which could obstruct the circulation path. On-site observations revealed that a line of ambulances sometimes waited outside the building for patient registration. Some preliminary experiments conducted for the verification and validation of the simulation model also revealed that the patients who were held in ED exam rooms (after their hospital admission orders are placed) blocked the overall flow and contributed to long waiting hours in ED waiting rooms. Therefore, boarding in ED rooms not only contributed to extended waiting time and consequently affected LOS and exam room time for walk-in patients but also caused delays for EMS patients waiting for vacant rooms.
To explore potential scenarios to counter the factors that created boarding issues, we first carefully tracked all patients before and after entering exam rooms. Historical data showed that once a room was assigned to a patient, there were four possible flow paths that the patient followed: (1) Patient was moved to the assigned room right away. Initial care began, treatment was completed, and patient was discharged from the room (55.2% of patients); (2) Patient was moved to the hallway and initial care began there (pre-treatment). Once a room was available, the patient moved to the room for treatment and boarding (2.6% of patients); (3) The patient was moved to the assigned room right away. Initial care began, treatment was completed, and the patient received admission order. Then the patient was moved to the hallway for boarding (3.9% of patients); (4) The patient was moved to the assigned room right away. Initial care began, treatment was completed, and the patient received admission order. The patient remained in the room until an inpatient bed was ready to receive them (36.1% of patients). Pre-treatment procedures could include obtaining vital signs or recording pain scores. Post-treatment procedures usually included completing the discharge paperwork (see Figure 6, top part, for a visual abstract). Based on the collected historical data, among boarders in the hallway, around 4% were from trauma room. There were also a very small number of patients who took a modified or combined version of the paths shown in Figure 6. As each such path was taken by less than 1% of patients, we did not include them in these categories.
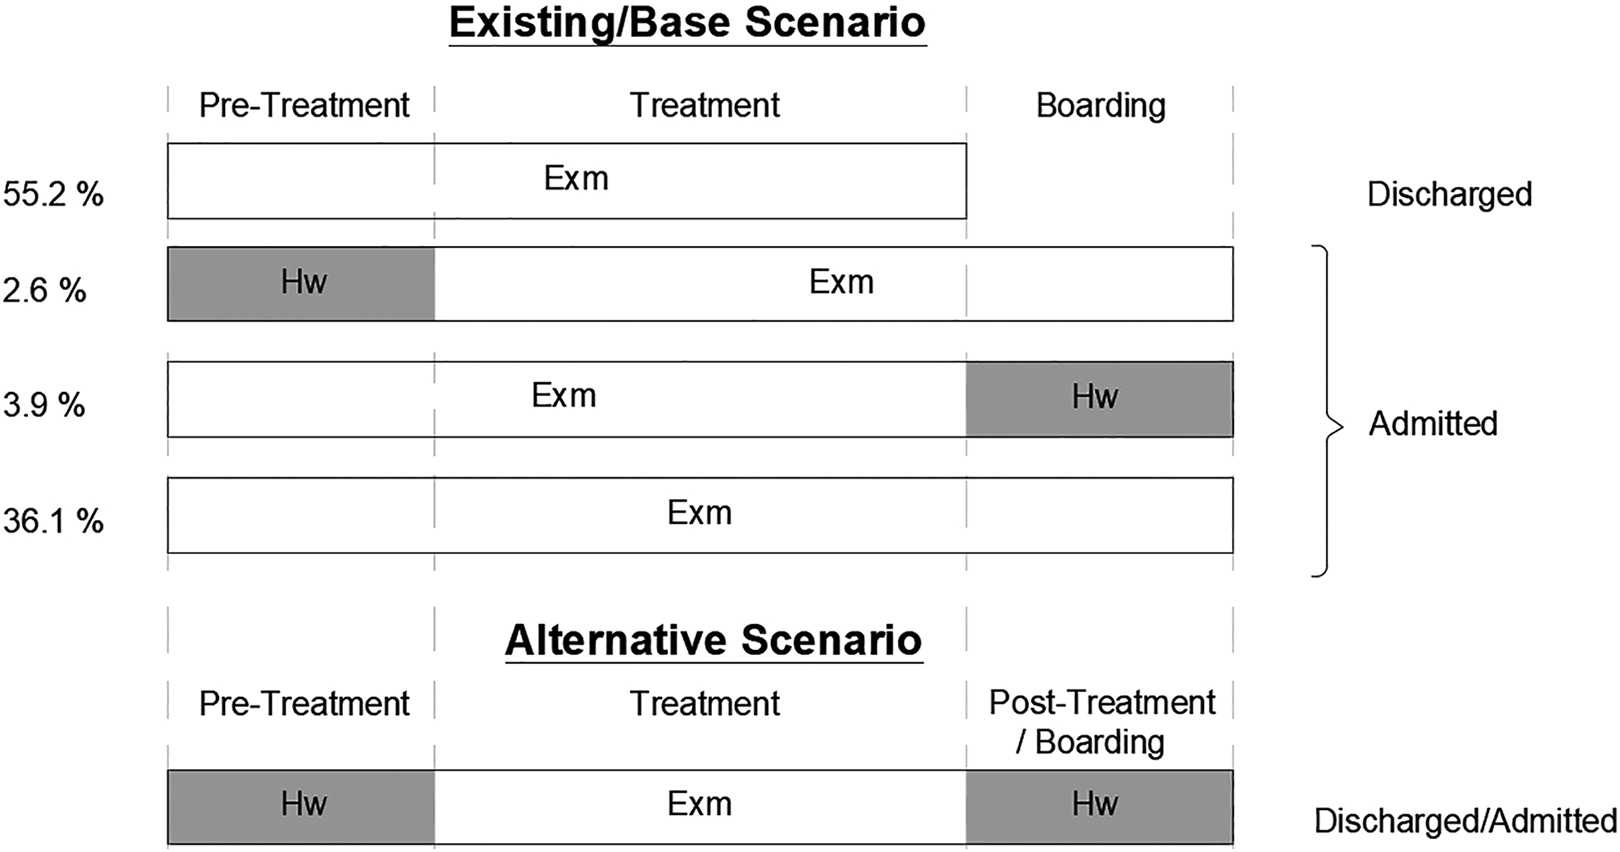
The visual abstract of main paths taken by patients once they are assigned to a room in the existing/base scenario (top) and alternatives (bottom).
The first scenario of interest was to move admitted patients from exam rooms to hallways and determine the impact of this change on patient flow metrics. By examining historical data, we also found that patients who stopped at hallway spaces either before or after receiving treatment in an exam room (i.e., take the second or third path) spent less time in the exam room for treatment (see Supplementary File 3). Therefore, we decided to test a scenario, denoted hereafter as hallway care scenario (HCS), in which (1) before moving to the exam rooms, all patients were taken to the hallway for pre-treatment and (2) after receiving the order for admission, patients were immediately transferred to the hallway for boarding or posttreatment if needed (see Figure 6, bottom part). Our hypothesis was that although with this scenario, hallway spaces would be taken for boarding instead of circulation, they would make the exam rooms available faster. This would lead to a faster transition from waiting room to care zone for walk-in patients and a faster transition from the ambulance to the exam room for EMS patients who might require higher levels of care and staffing. This alternative scenario alone (results provided in the following section), however, did not lead to a significant decrease in LOS and exam room time for all patients. We then examined a second alternative, denoted hereafter as EMS triage scenario (HCS + ETS), in which in addition to hallway care, a dedicated triage space for EMS patients is added to the model. Our objective was to not only free up more hallway spaces to accommodate pre-treatment and post-treatment but also speed up the process of intaking EMS patients and minimize the possibility of ambulances lining up outside the building as was found during observations. The results are presented and discussed in the following sections.
Results
We first simulated a base scenario in which patient flow was set up so patients can take one of the existing four paths previously described. Next, we examined the impact of applying hallway care scenario (HCS) and EMS triage scenario (HCS + ETS). The results of one-way ANOVA tests are provided in Supplementary File 4. Figures 7 –9 also compare the flow metrics for HCS and HCS + ETS against the base model in bar chart forms. As illustrated in Figure 7 (Graphs A and B), HCS resulted in significantly lower LOS for EMS patients but significantly higher LOS for walk-in patients. The reason for this result might be that compared with the path taken by EMS patients, a bigger change was made in walk-in patients’ path. Walk-in patients who had to stop in the hallway for pre-treatment created a longer waiting time in the waiting rooms. However, since the triage priority assignment was not changed, EMS patients were still prioritized and they could occupy the more-available rooms immediately after their intake. In the next step, when the EMS triage area was added (HCS + ETS), LOS was reduced in both groups (significantly among EMS patients). HCS + ETS provided not only more available exam rooms for EMS patients but also more hallway spots for walk-in patients. The results can also be explained by a similar trend observed in blocked time for the two patient groups (Figure 7, Graphs C and D). Therefore, a combination of HCS and ETS facilitated shorter LOS for all ED patients.
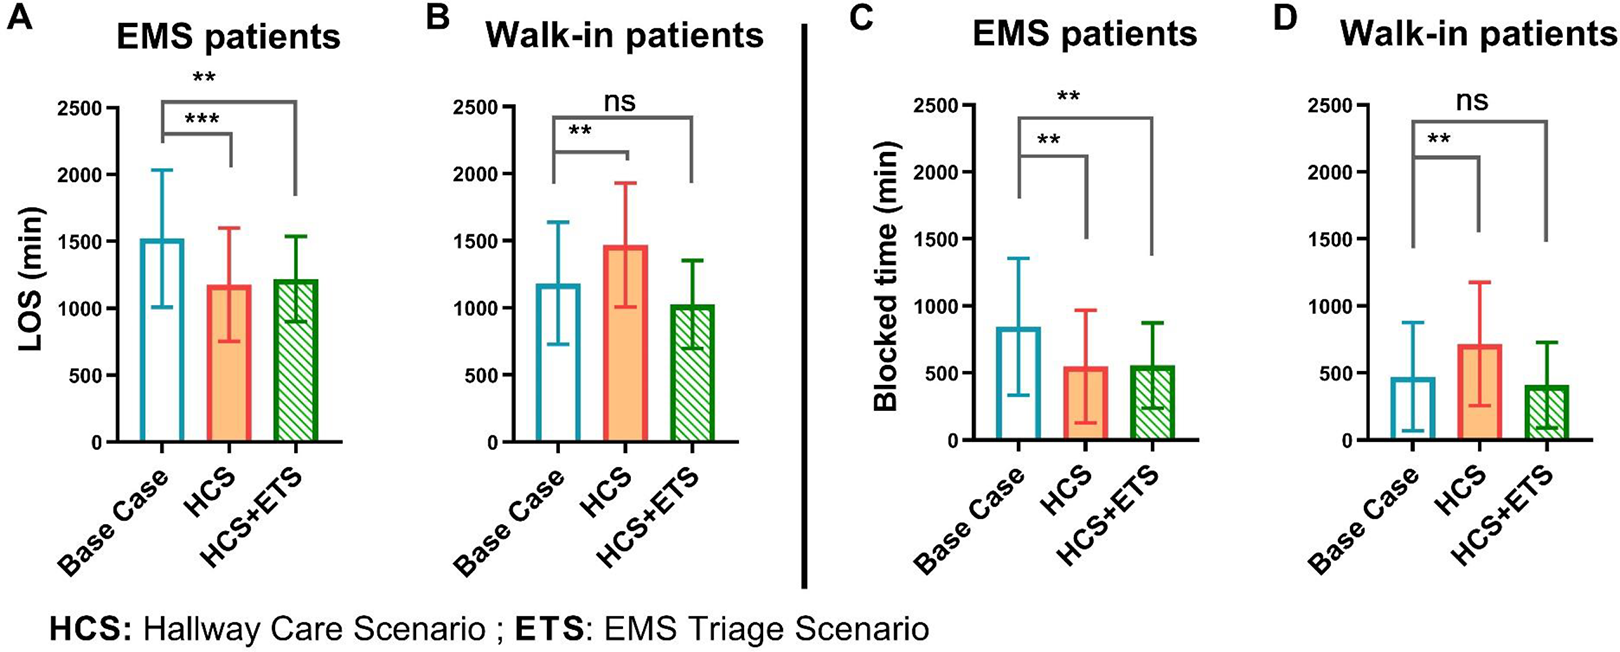
A comparison of the impact of alternatives on length of stay (Graph A for emergency medical service [EMS] patients and Graph B for walk-in patients) and blocked time (Graph C for EMS patients and Graph D for walk-in patients) for base case (white), hallway care scenario (HCS; shaded), and EMS triage scenario (HCS+ETS; hatched).
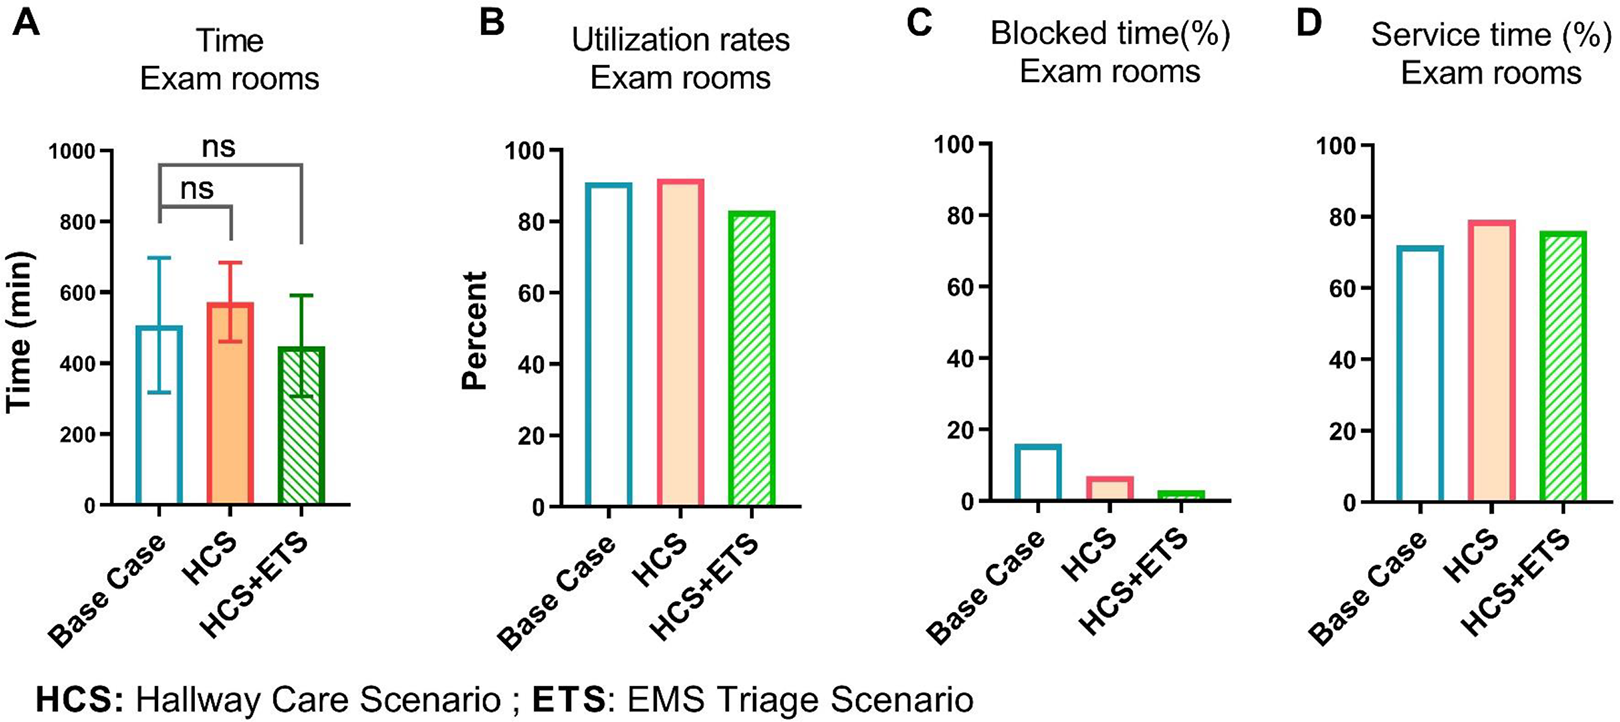
A comparison of the impact of alternatives on the average time between (A) patients’ entry and departures from exam rooms, (B) the utilization rate of all exam rooms (as a cluster), (C) blocked time, and (D) service time for base case (white), hallway care scenario (HCS; shaded), and EMS triage scenario (HCS+ETS; hatched).
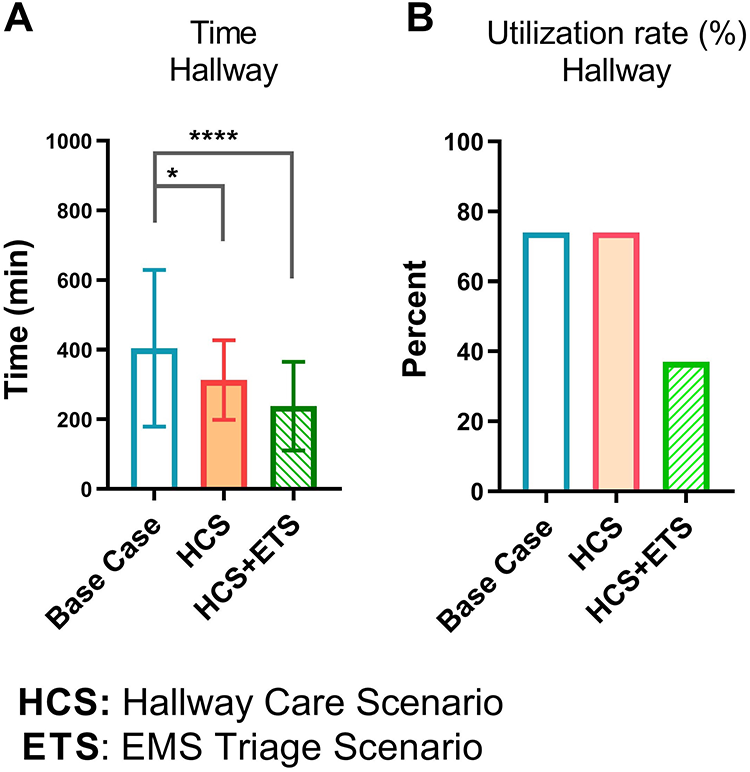
A comparison of the impact of alternatives on the average time between (A) patients’ arrival and departure from locations in the hallway and (B) the utilization rate of all hallway spaces (as a cluster) for base case (white), hallway care scenario (HCS; shaded), and EMS triage scenario (HCS+ETS; hatched).
The base and two alternatives were also compared in terms of room-specific metrics (Figure 8). Although not statistically significant, exam room time was surprisingly increased by the first scenario and decreased by the second scenario (Figure 8, Graph A). The reason for the increased time in exam rooms for Scenario 1 might be due to the crowding of hallways, which led to keeping admitted patients in rooms for a longer period of time. The utilization rate of exam rooms also increased by the first and declined by the second scenario (Figure 8, Graph B). A similar trend was observed for the percentage of time that exam rooms were in operation (service time; Figure 8, Graph D). Finally, blocked time was reduced in both scenarios (Figure 8, Graph C) with a greater decrease by the second scenario. This result was not surprising because the main purpose of developing the two scenarios was to move patients out of exam rooms immediately after completing the treatment, hence decreasing the blocked time. The reason for the greater decrease in blocked time by the second scenario could be the increased capacity of hallway in HCS + ETS as a result of adding EMS triage space. Therefore, the positive impact of a combination of hallway care and added EMS triage area (HCS + ETS) was higher than only hallway care (HCS).
The last group of comparisons was made in terms of the metrics in hallway care locations (Figure 9). While both alternatives significantly decreased time spent in hallway spaces, the impact of (HCS + ETS) was higher (Figure 9, Graph A). The utilization rate of all hallway care areas (as a block) also dropped when HCS + ETS was applied but it was not affected by HCS (Graph B). This might be due to the fact that in the first scenario, although each patient spent less time in the hallway (Graph A, shaded bar), a larger number of patients were served in the hallway compared with the base case. These two opposing factors could have kept the hallway utilization rate constant in HCS (Graph B, shaded bars). On the other hand, in the second scenario, not only the hallway time was decreased compared with the base case and HCS (Graph A, hatched bar) but also the capacity of hallway was increased through added EMS triage space. The combination of these factors could have led to a lower hallway utilization rate in HCS + ETS. A reduction in the utilization rate was a desired outcome because it provided more space for the next patient in line. Therefore, this observation further confirms more effectiveness of HCS + ETS compared to the base case and HCS only.
Discussion
We conducted this study to identify and test strategies that can be implemented to improve patient flow in an ED with a focus on the physical environment. DES of our single ED showed that using hallway spaces for pre-treatment and post-treatment (e.g., care initiation, discharge procedure, boarding), when implemented simultaneously with intaking EMS patients through a dedicated triage area, can provide substantial benefits to patient flow. To our knowledge, this is the first study using DES modeling to examine the impact of adding an EMS triage area. While DES modeling is used in many ED studies to perform what-if scenarios and test operational changes (Bedoya-Valencia & Kirac, 2016; Hung et al., 2007; Konrad et al., 2013), scant attention has been paid to environmental changes (Cai & Jia, 2019; Easter et al., 2019) or the interaction between these two.
Hallway Care to Reduce Boarding Time in ED Rooms
Although boarding of admitted patients in EDs is a major cause of crowding, it is common in most hospitals. The solution that a given ED may put forward cannot rely on a single change. It depends on both internal and external factors on which the ED may have no or partial control. Boarding admitted patients in the ED is a hospital-level problem and requires hospital-level solutions. The degree to which hospitals experience crowding or ED boarding may be determined by different reasons, including but not limited to their size, location, academic affiliation, certifications (e.g., cardiac, trauma), demographics of patient population, and engagement of leadership (Stone & Winger, 2017). Therefore, hospital administration needs to identify the list of contributing factors to ED crowding and boarding and then suggest possible solutions within their own constraints. In this study, to identify potential scenarios to address the boarding issue, we conducted a comprehensive analysis of data from 1,900 registrations. We started with understanding the obstacles and complexities of patient flow. We did not have any control over the hospital-level factors. Therefore, we could not test out-of-ED scenarios, such as boarding admitted patients in inpatient units. We tested moving patients from ED exam rooms to ED hallways once they were admitted to an inpatient ward. This scenario also included using hallway spaces for initiating and completing the care process when an exam room was not necessary. Compared with the base scenario, we found that this strategy alone may not lead to an improved flow of patients and a decreased LOS for all patients.
Obviously, holding patients in the hallway (either in ED or inpatient units) is not the most desirable solution for hospitals due to lack of privacy and safety (Richards et al., 2014). ED hallway care may violate fire department codes by obstructing the means of egress (emergency fire exits; NFPA, 2018). However, most hospitals have to use their existing capacity to manage surge capacity. Full-capacity protocols are shown to be effective in reducing the left-without-being-seen rate and ambulance diversion while allowing for increased patient volume in the ED and increased hospital admission rates (Willard et al., 2017). When patients are placed in hallways, some EDs provide central monitoring, call bells, privacy screens, and designated bathrooms in the hallway to increase comfort and communication (Herod et al., 2018; A. Viccellio et al., 2009). If there is no way to use any other location of the hospital for boarding, facility designers may consider a third place (not in ED and not in inpatient floors) to locate admitted patients once they receive the admission order. If they have to use ED for boarding, they may consider a space separate from but adjacent to the exam rooms with required equipment to monitor patients. Those spaces could be parallel to the hallway in a way that do not hinder the circulation and bed movement. Other examples could be built-in alcoves in the hallway or flexible folding partitions for quick setups when needed. The Facility Guidelines Institute (FGI) has also suggested pop-up treatment alcoves hidden behind panel doors to address capacity needs (Langlands et al., 2018).
Since in-house data showed that boarding was a major contributor to long wait times in this ED, other strategies such as boarding in inpatient hallways (P. Viccellio et al., 2013) or a hospital-wide tracking system to constantly monitor inpatient and ED bed status (Patel et al., 2014) might have been effective. However, those strategies were beyond the control of ED and required a hospital-level effort for implementation. The results of our study supported the effort to move admitted and discharged patients out of ED exam rooms in a timely fashion. Depending on available resources and hospital priorities, admitted patients may be moved immediately to a short-stay boarding area, or to inpatient hallways, or if there are no other areas available to ED hallways.
Establishing an EMS Triage Area to Facilitate Hallway Care
If ED hallway spaces are to be used for boarding, it can be helpful to minimize their use for other purposes and keep hallway traffic and clutter to a minimum. These efforts will free up space for patients awaiting transfer to an inpatient bed and help with staffing because it decreases the level of care complexity in the hallway and eventually helps with relieving crowding. We tested the effect of adding a hypothetical triage area for EMS patients so that stretchers did not add to the hallway traffic. A combination of this strategy and hallway care for walk-in patients led to an improvement in flow metrics, including LOS, exam room time, utilization rate of exam rooms, and full utilization rate of the hallway.
The proposed EMS triage area is different from an EMS handoff area, where quick sorting occurs, and from a disaster staging area, which is outside the ED building and usually outside the main ambulance entrance for rapid assessment of injuries during mass casualty incidents (Valipoor et al., 2020). The EMS triage area is suggested as a private area (with at least three walls), equipped with gases, adjacent to the EMS entry vestibule, and visible to staff to locate two to 12 (depending on ED annual visits) EMS patients (Huddy, 2016). Some hospitals have implemented this solution (Grady, 2016) and their performances are yet to be examined. Establishing this area may not be effective in some EDs, however. When designing the hospital, there might not be enough space to allocate to such a staging area. In addition, depending on the level of equipment provided for this area, it might be categorized as a patient care station in some jurisdictions (Huddy, 2016), meaning that it must meet the minimum requirements for a care station, such as area, bed clearance, and adjacency to hand-washing stations (FGI, 2018). In that case, at peak capacity, the EMS triage area may be repurposed as a group of exam rooms. Smaller EDs with lower EMS volumes and a lower potential for ambulance queuing can also support repurposing. In normal operations, smaller EDs can use their EMS triage areas as exam rooms and, depending on the provided utilities, may assign any walk-in patient in the line to these rooms.
Application to Surge Capacity in Times of Disasters
This study was conducted before the COVID-19 outbreak. During the pandemic, many EDs have been running beyond their capacity levels. Hospitals have had to convert common spaces to treatment rooms and fill hallways with patient beds. The solutions suggested in this article may be tested for increasing hospitals’ ability to surge during a crisis. If a separate boarding area is established, it can be used for both treatment and boarding or may be repurposed to a negative pressure unit during a crisis, depending on the type of the crisis as well as the location and size of the boarding area. If a dedicated EMS triage space is established, it may be used either for the same purpose or as an extended care zone during a catastrophic event. It can also function as an extended decontamination area or a filter zone between contaminated and noncontaminated spaces (Paganini et al., 2020).
Limitations
The simulation model in this study was derived and validated using data from a single Level 1 trauma center, which limits generalizability of the results. Our inputs and assumptions were based on historical data and expert opinion, which may not be valid in other settings. To develop the model, we made simplifications and generalizations to the actual ED experience, as in any other simulation study. For example, there is usually a time gap between documenting the first provider assignment and the time the provider is actually at the bedside. Our model did not take these time gaps into account. Although simulated models do not exactly reflect the real system, they are a good approximation and if carefully developed and validated, allow for examining the effect of alternatives.
Although recent developments have enabled the use of DES for day-to-day operational planning in some manufacturing and service contexts, we believe that the underlying complexities of ED operations limit such use. In our work, we used DES as a tool to assess the impact of alternative physical environmental design strategies on ED performance. A successful DES study relies on the (1) development of a thorough understanding of the system to model it accurately, (2) availability of historical data to populate and validate the model, and (3) correct analysis and interpretation of the outputs of the experimentation. In our study, we were able to work closely with a clinical team that helped us understand the processes within their system. Also, we were able to obtain the data needed to construct a comprehensive model. In addition, we had collective expertise on the team to ensure that the output data were correctly analyzed and interpreted. One challenge we encountered was the need for data cleaning. Substantial effort was made for data cleaning and consolidation. The most important pitfall to avoid when using DES is including too much detail to model the system as realistically as possible. This approach may lead to unnecessarily complex and complicated simulation models, making model development, verification, and validation challenging as well as the computational requirements to run the simulation experiments excessively high. System details that are not critical to the hypothesis being tested can be left out.
If we were to tackle this ED again, we could consider expanding the system boundaries to consider additional environmental alternatives that could further reduce patient boarding in the ED (e.g., the existence of a temporary boarding area outside of the ED prior to hospital admission).
Conclusion
In summary, this study supports the need to consider facility design strategies that discourage boarding of admitted patients in ED exam rooms and demonstrates the potential value of establishing an EMS triage area. In our ED, these strategies resulted in improvements in the flow of patients and also achieved beneficial results for staff, with decreased blocked rates and crowding. Obviously, these solutions may not be applicable to some EDs, but our study illustrates one way of evaluating similar scenarios. This study also underscores the importance of deriving potential solutions for ED performance challenges from hospital-specific data. Considering the complex nature of EDs and the multifaceted characteristics of ED crowding, a collection of solutions based on the specific operation of each ED is needed to mitigate the negative impacts of crowding. More research is needed to examine patient flow in EDs with a special attention to the critical interplay between operational strategies related to the physical environment. Future studies may also use DES models to identify opportunities in EDs to test other scenarios related to the physical environment. This may reshape the focus of hospital design based on simulated models of EDs in the future.
Implications for Practice
This study provided a detailed description of a case study that used DES to test two data-driven scenarios to address crowding in a Level 1 trauma center. Designers, planners, and hospital administrators can employ DES as a decision-making tool in design or renovation phases of healthcare projects. When developing ED floor plans, if there is no way to use other spaces of the hospital for boarding, designers may consider a third place (not in the ED and not in inpatient floors) to locate admitted patients to avoid boarding in ED rooms. Designating an EMS triage area close to the ambulance entry point can facilitate care initiation upon arrival and improve patient flow.
Supplemental Material
Supplemental Material, sj-pdf-1-her-10.1177_1937586720969933 - Data-Driven Design Strategies to Address Crowding and Boarding in an Emergency Department: A Discrete-Event Simulation Study
Supplemental Material, sj-pdf-1-her-10.1177_1937586720969933 for Data-Driven Design Strategies to Address Crowding and Boarding in an Emergency Department: A Discrete-Event Simulation Study by Shabboo Valipoor, Mohsen Hatami, Hesamedin Hakimjavadi, Elif Akçalı, Wendy A. Swan and Giuliano De Portu in HERD: Health Environments Research & Design Journal
Supplemental Material
Supplemental Material, sj-pdf-2-her-10.1177_1937586720969933 - Data-Driven Design Strategies to Address Crowding and Boarding in an Emergency Department: A Discrete-Event Simulation Study
Supplemental Material, sj-pdf-2-her-10.1177_1937586720969933 for Data-Driven Design Strategies to Address Crowding and Boarding in an Emergency Department: A Discrete-Event Simulation Study by Shabboo Valipoor, Mohsen Hatami, Hesamedin Hakimjavadi, Elif Akçalı, Wendy A. Swan and Giuliano De Portu in HERD: Health Environments Research & Design Journal
Supplemental Material
Supplemental Material, sj-pdf-3-her-10.1177_1937586720969933 - Data-Driven Design Strategies to Address Crowding and Boarding in an Emergency Department: A Discrete-Event Simulation Study
Supplemental Material, sj-pdf-3-her-10.1177_1937586720969933 for Data-Driven Design Strategies to Address Crowding and Boarding in an Emergency Department: A Discrete-Event Simulation Study by Shabboo Valipoor, Mohsen Hatami, Hesamedin Hakimjavadi, Elif Akçalı, Wendy A. Swan and Giuliano De Portu in HERD: Health Environments Research & Design Journal
Supplemental Material
Supplemental Material, sj-pdf-4-her-10.1177_1937586720969933 - Data-Driven Design Strategies to Address Crowding and Boarding in an Emergency Department: A Discrete-Event Simulation Study
Supplemental Material, sj-pdf-4-her-10.1177_1937586720969933 for Data-Driven Design Strategies to Address Crowding and Boarding in an Emergency Department: A Discrete-Event Simulation Study by Shabboo Valipoor, Mohsen Hatami, Hesamedin Hakimjavadi, Elif Akçalı, Wendy A. Swan and Giuliano De Portu in HERD: Health Environments Research & Design Journal
Supplemental Material
Supplemental Material, sj-pdf-5-her-10.1177_1937586720969933 - Data-Driven Design Strategies to Address Crowding and Boarding in an Emergency Department: A Discrete-Event Simulation Study
Supplemental Material, sj-pdf-5-her-10.1177_1937586720969933 for Data-Driven Design Strategies to Address Crowding and Boarding in an Emergency Department: A Discrete-Event Simulation Study by Shabboo Valipoor, Mohsen Hatami, Hesamedin Hakimjavadi, Elif Akçalı, Wendy A. Swan and Giuliano De Portu in HERD: Health Environments Research & Design Journal
Supplemental Material
Supplemental Material, sj-pdf-6-her-10.1177_1937586720969933 - Data-Driven Design Strategies to Address Crowding and Boarding in an Emergency Department: A Discrete-Event Simulation Study
Supplemental Material, sj-pdf-6-her-10.1177_1937586720969933 for Data-Driven Design Strategies to Address Crowding and Boarding in an Emergency Department: A Discrete-Event Simulation Study by Shabboo Valipoor, Mohsen Hatami, Hesamedin Hakimjavadi, Elif Akçalı, Wendy A. Swan and Giuliano De Portu in HERD: Health Environments Research & Design Journal
Supplemental Material
Supplemental Material, sj-pdf-7-her-10.1177_1937586720969933 - Data-Driven Design Strategies to Address Crowding and Boarding in an Emergency Department: A Discrete-Event Simulation Study
Supplemental Material, sj-pdf-7-her-10.1177_1937586720969933 for Data-Driven Design Strategies to Address Crowding and Boarding in an Emergency Department: A Discrete-Event Simulation Study by Shabboo Valipoor, Mohsen Hatami, Hesamedin Hakimjavadi, Elif Akçalı, Wendy A. Swan and Giuliano De Portu in HERD: Health Environments Research & Design Journal
Footnotes
Acknowledgments
The authors would like to thank ProModel Corporation for generously providing the team with a professional version of MedModel and for their consultation and technical support during the project. The authors would also like to acknowledge the contributions of Dr. Ian Flood, Ms. LaKesha Cotton, and Mr. Daniel Stallings.
Declaration of Conflicting Interests
The author(s) declare no potential conflicts of interest with respect to the research, authorship, and publication of this article.
Funding
The author(s) disclosed receipt of the following financial support for the research,authorship, and/or publication of this article: This work was supported by a 2018-19 faculty seed grant from the College of Design, Construction and Planning at the University of Florida.
Supplemental Material
The supplemental material for this article is available online.
References
Supplementary Material
Please find the following supplemental material available below.
For Open Access articles published under a Creative Commons License, all supplemental material carries the same license as the article it is associated with.
For non-Open Access articles published, all supplemental material carries a non-exclusive license, and permission requests for re-use of supplemental material or any part of supplemental material shall be sent directly to the copyright owner as specified in the copyright notice associated with the article.