
Abstract
Environmental justice mapping tools are an important resource for helping identify communities at risk for environmental injustice and helping to guide decision making for policymakers, researchers, and communities. They typically include indicators related to environmental risks (e.g., air quality), socioeconomic factors (e.g., demographic data), and physical health (e.g., disease morbidity and mortality). Recent reviews have found that only two existing tools incorporate indicators related to infectious disease, despite the intrinsic relationship between environmental conditions and infectious disease transmission. This article provides a comprehensive framework for incorporating infectious disease indicators into environmental justice screening and mapping tools. The framework for indicator selection includes four key dimensions: relevance to environmental justice, data quality and availability, spatial–temporal characteristics, and practical utility for decision making. Indicators can be categorized into three types: direct disease measures (e.g., morbidity and mortality), vulnerability indicators (e.g., vaccination rates), and environmental risk factors (e.g., vector habitats). Some of the challenges to incorporating infectious disease indicators include temporal variability (e.g., seasonality) and the availability of spatially meaningful direct measures that align with other indicators. However, methodological approaches could overcome these challenges—for example, incorporating dynamic disease surveillance data using rolling averages for endemic diseases. Integrating infectious disease indicators into environmental justice mapping tools is a complex challenge but a vital step in advancing environmental health equity.
Keywords
BACKGROUND
Environmental justice, defined as the fair treatment and meaningful involvement of all people regardless of race, color, national origin, or income with respect to environmental policies and their implementation, is a complex issue with significant geographic variability. 1 Environmental justice communities often face disproportionate exposure to environmental hazards while having fewer resources to address these challenges. 2 In response to an increasing need to understand and address these disparities, state and national organizations have developed mapping tools to model and visualize environmental justice.3,4,5,6 These tools, often developed with community involvement, map characteristics related to human and environmental health, helping identify communities at risk for environmental injustice and guiding decision making for policymakers, researchers, and communities. 7
Environmental justice mapping tools are interactive, publicly available geographic information system-based digital maps that display environmental justice data and are maintained by government agencies, academic institutions, or nonprofit organizations. 8 Unlike single-domain surveillance dashboards that track specific health metrics in isolation, environmental justice mapping tools uniquely facilitate cross-domain analysis by overlaying multiple indicators from diverse sources, enabling the visualization of cumulative impacts and previously unrecognized spatial correlations between environmental conditions and health outcomes. Measuring these cumulative impacts is essential for understanding the impact of multidimensional risk factors on community health. Environmental justice mapping tools typically include indicators related to environmental risks (e.g., air quality, water quality, climate vulnerabilities, natural hazards, other pollutants), socioeconomic factors (e.g., demographic data), and physical health, as well as other visual layers providing contextual information about a community (e.g., transit access, housing conditions). 9 These indicators can be overlaid, or in some tools, calculated into scores or indices to summarize the compounding and cumulative burdens of environmental, economic, and health injustices. 10 The integration of multiple indicators is particularly crucial as environmental justice communities often face intersecting challenges that can amplify health risks. For example, communities with poor air quality may also experience higher rates of respiratory infections, 11 whereas areas with inadequate infrastructure may face increased risks of both waterborne diseases and chemical exposures.12,13
Recent reviews of existing tools found that only half included indicators related to physical health, 14 and remarkably, only two tools incorporated infectious disease metrics. 15 This gap is particularly concerning given the intrinsic relationship between environmental conditions and infectious disease transmission, which is often amplified in environmental justice communities. Environmental factors affecting disease transmission include agricultural practices, antimicrobial use, urbanization, disasters, and climate change 16 —all of which are also fundamental environmental justice concerns. 17 The COVID-19 pandemic has further highlighted these connections, as communities with higher environmental burdens often experienced disproportionate infection rates and mortality, underscoring the need for integrated approaches to environmental justice and infectious disease surveillance. 18
Despite these clear relationships, infectious disease indicators remain largely overlooked in environmental justice mapping. This oversight could be due to various factors such as lack of prioritization by the community, limited data availability, or the desire to create a more focused tool. Although noncommunicable diseases drive most disease burden, environmental justice tools should provide a more comprehensive view of community health, including both chronic conditions and infectious diseases. The multidirectional relationship between infectious diseases, the environment, social determinants of health, and climate change makes them an important consideration in environmental justice mapping.
This article addresses this critical gap in environmental justice mapping by providing the first comprehensive framework for considering infectious disease indicators into environmental justice screening and mapping tools. We describe current uses of infectious disease indicators, propose additional metrics, identify data sources, and discuss opportunities and challenges. Our work provides practical guidance for tool developers while advancing the theoretical understanding of how infectious disease surveillance can enhance environmental justice assessment and intervention planning. This integration is particularly timely given the increasing recognition of how environmental changes and social inequities influence disease transmission and outcomes.
INFECTIOUS DISEASE AND ENVIRONMENTAL JUSTICE
The historical divergence between environmental health and infectious disease fields during the 20th century has contributed to their current separation in environmental justice frameworks. This separation emerged following the widespread adoption of the germ theory, which emphasized biological mechanisms of pathogens causing disease, often at the expense of understanding environmental circumstances and social determinants that facilitate both exposure and susceptibility to infectious diseases.19,20 This artificial division persists in contemporary environmental justice mapping tools, despite extensive research demonstrating the intricate relationships between environmental disruptions, environmental racism, social determinants of health, and infectious disease patterns.
Infectious diseases manifest through multiple environmental pathways, each reflecting distinct aspects of environmental justice concerns. Respiratory infections, including COVID-19, tuberculosis, and influenza, are exacerbated by poor air quality, housing density, and inadequate ventilation—conditions disproportionately affecting environmental justice communities. 21 During the COVID-19 pandemic, communities with higher levels of particulate matter 2.5 (PM2.5) exposure experienced 8% higher mortality rates, with racial and ethnic minorities bearing the greatest burden. 22 These disparities were further amplified by occupational exposures in essential industries, combined with poor indoor air quality in aging housing stock, creating compounding risks for respiratory infections. 23
Vector-borne diseases present another critical intersection with environmental justice. West Nile virus and other mosquito-borne diseases show higher prevalence in areas with abandoned buildings and poor infrastructure—often the legacy of historically racist housing policies. 24 Climate change is expanding the geographic range of disease vectors, with low-income communities lacking resources for vector control. 25 Similarly, tick-borne diseases like Lyme disease are increasingly found in urban areas where green space access intersects with environmental justice concerns. 26
Waterborne and foodborne infections further highlight these disparities. Enteric diseases cluster around concentrated animal feeding operations, which are disproportionately located in low-income communities.27,28,29 Poor water infrastructure and well water contamination contribute to higher rates of waterborne illness in rural environmental justice communities. 30 These risks are amplified by climate change-induced flooding events, particularly in communities with aging water infrastructure. 31
The integration of infectious disease indicators into environmental justice mapping tools could significantly enhance their utility by providing early warning signals of environmental degradation, capturing acute health impacts that complement chronic disease indicators, highlighting infrastructure needs affecting both environmental quality and disease transmission, documenting compound effects of multiple environmental stressors on community health, and supporting emergency preparedness planning for environmental justice communities.
Climate change further amplifies these relationships through multiple pathways. Rising temperatures extend transmission seasons for vector-borne diseases, 32 whereas increased frequency of extreme weather events disrupts sanitation infrastructure. 33 Ecosystem disruption releases novel pathogens into human populations, with environmental justice communities often serving as interface zones. Additionally, displacement and migration due to climate events concentrate vulnerable populations in areas with poor infrastructure. 34
The COVID-19 pandemic has provided compelling evidence for the importance of including infectious disease metrics in environmental justice frameworks. Communities with higher cumulative environmental burden scores experienced earlier onset of community transmission, higher case rates and mortality, reduced access to testing and health care resources, greater economic impacts from public health measures, and slower vaccination uptake due to infrastructure limitations.35,36,37 These disparities clearly demonstrate how preexisting environmental injustices can amplify infectious disease impacts, creating a cycle of increasing vulnerability.
This comprehensive relationship between infectious diseases and environmental justice underscores the need for integrated mapping approaches. By incorporating infectious disease indicators, environmental justice tools can better capture the full spectrum of health impacts in vulnerable communities and support more effective interventions (Fig. 1). Furthermore, they can improve our understanding of the relationship between infectious disease transmission and environmental conditions, such as the relationship between air quality and acute respiratory infection or rural well water use and waterborne infections. The dynamic nature of infectious diseases also provides opportunities for near-real-time monitoring of environmental justice impacts, potentially allowing for more rapid and targeted responses to emerging environmental health threats.
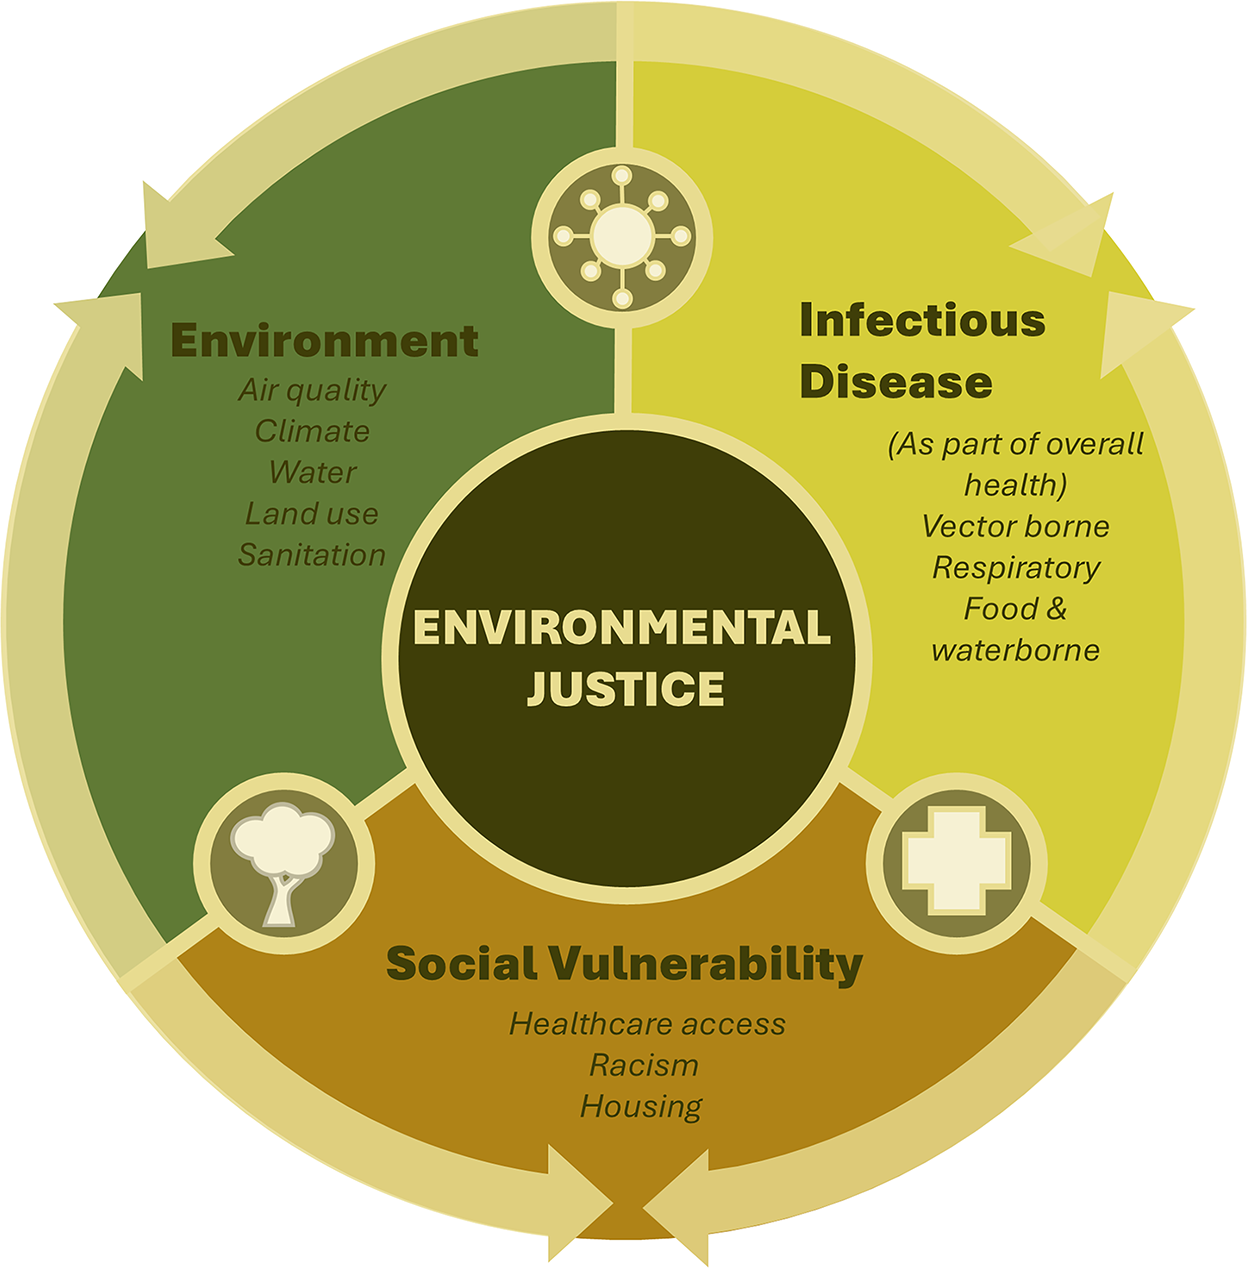
Conceptual diagram of the relationship between environmental factors, social vulnerability, and infectious disease.
CUMULATIVE IMPACTS AND INFECTIOUS DISEASE DYNAMICS
The concept of cumulative impacts has become central to environmental justice assessment, recognizing that communities face multiple, overlapping environmental and social stressors that combine to affect health outcomes. 38 Traditional cumulative impact frameworks typically emphasize persistent environmental exposures and their associated chronic health conditions, which align well with the dominant burden of noncommunicable diseases in many communities. However, this approach may inadvertently overlook the unique temporal and spatial dynamics of infectious diseases, creating potential blind spots in environmental justice assessment.
Although chronic diseases often reflect long-term exposures and persistent inequities, infectious diseases can emerge rapidly and exhibit significant temporal variability. For example, seasonal influenza, vector-borne diseases, and emerging pathogens like COVID-19 may create acute burdens that are difficult to capture in traditional cumulative impact metrics. This temporal disconnect is particularly significant when tools rely on annual or multiyear averaged data to assess community vulnerability.
The transmission dynamics of infectious diseases create spatial patterns that may not align with the geographic boundaries typically used in environmental justice mapping. Disease clusters can cross administrative boundaries, and transmission networks may connect seemingly disparate communities through social and environmental links. This spatial complexity is further complicated by the role of population mobility and social networks in disease spread, factors that are rarely captured in current cumulative impact frameworks.
The interactive effects between infectious diseases and other environmental stressors suggest the need for more dynamic cumulative impact frameworks. Environmental exposures can increase susceptibility to infections, whereas infectious diseases can exacerbate the health impacts of environmental pollutants (Fig. 1). The COVID-19 pandemic illustrated this interaction, as communities with higher cumulative environmental burdens experienced more severe outcomes, likely due to the combined effects of preexisting health conditions, environmental exposures, and social vulnerabilities.39,40
Addressing these challenges requires rethinking how cumulative impact frameworks can better incorporate the temporal and spatial dynamics of infectious diseases. This might include developing more flexible metrics that can capture both acute and chronic health impacts, implementing rolling averages or temporal weighting schemes, and creating hybrid approaches that combine stable environmental indicators with more dynamic infectious disease metrics. Such innovations could help bridge the current gap between environmental justice assessment and infectious disease surveillance while providing a more comprehensive understanding of community health burdens.
INFECTIOUS DISEASE INDICATORS: CURRENT TOOLS AND RECOMMENDATIONS
Framework for indicator selection
To effectively select infectious disease indicators for environmental justice mapping, a systematic approach that balances multiple considerations is crucial. We propose a robust framework for indicator selection that evaluates potential metrics across key dimensions, including:
Community input: Ensuring that indicators reflect community-identified health priorities and concerns. Practical utility for decision making: Demonstrating how indicators can inform targeted interventions and policy changes. Cumulative effects: Aligning infectious disease indicators with other environmental and social vulnerability factors to capture the complex interplay of health determinants. Data accessibility: Evaluating the availability and quality of data at appropriate spatial and temporal scales. Spatial–temporal characteristics: Accounting for the dynamic nature of infectious diseases and their spatial patterns.
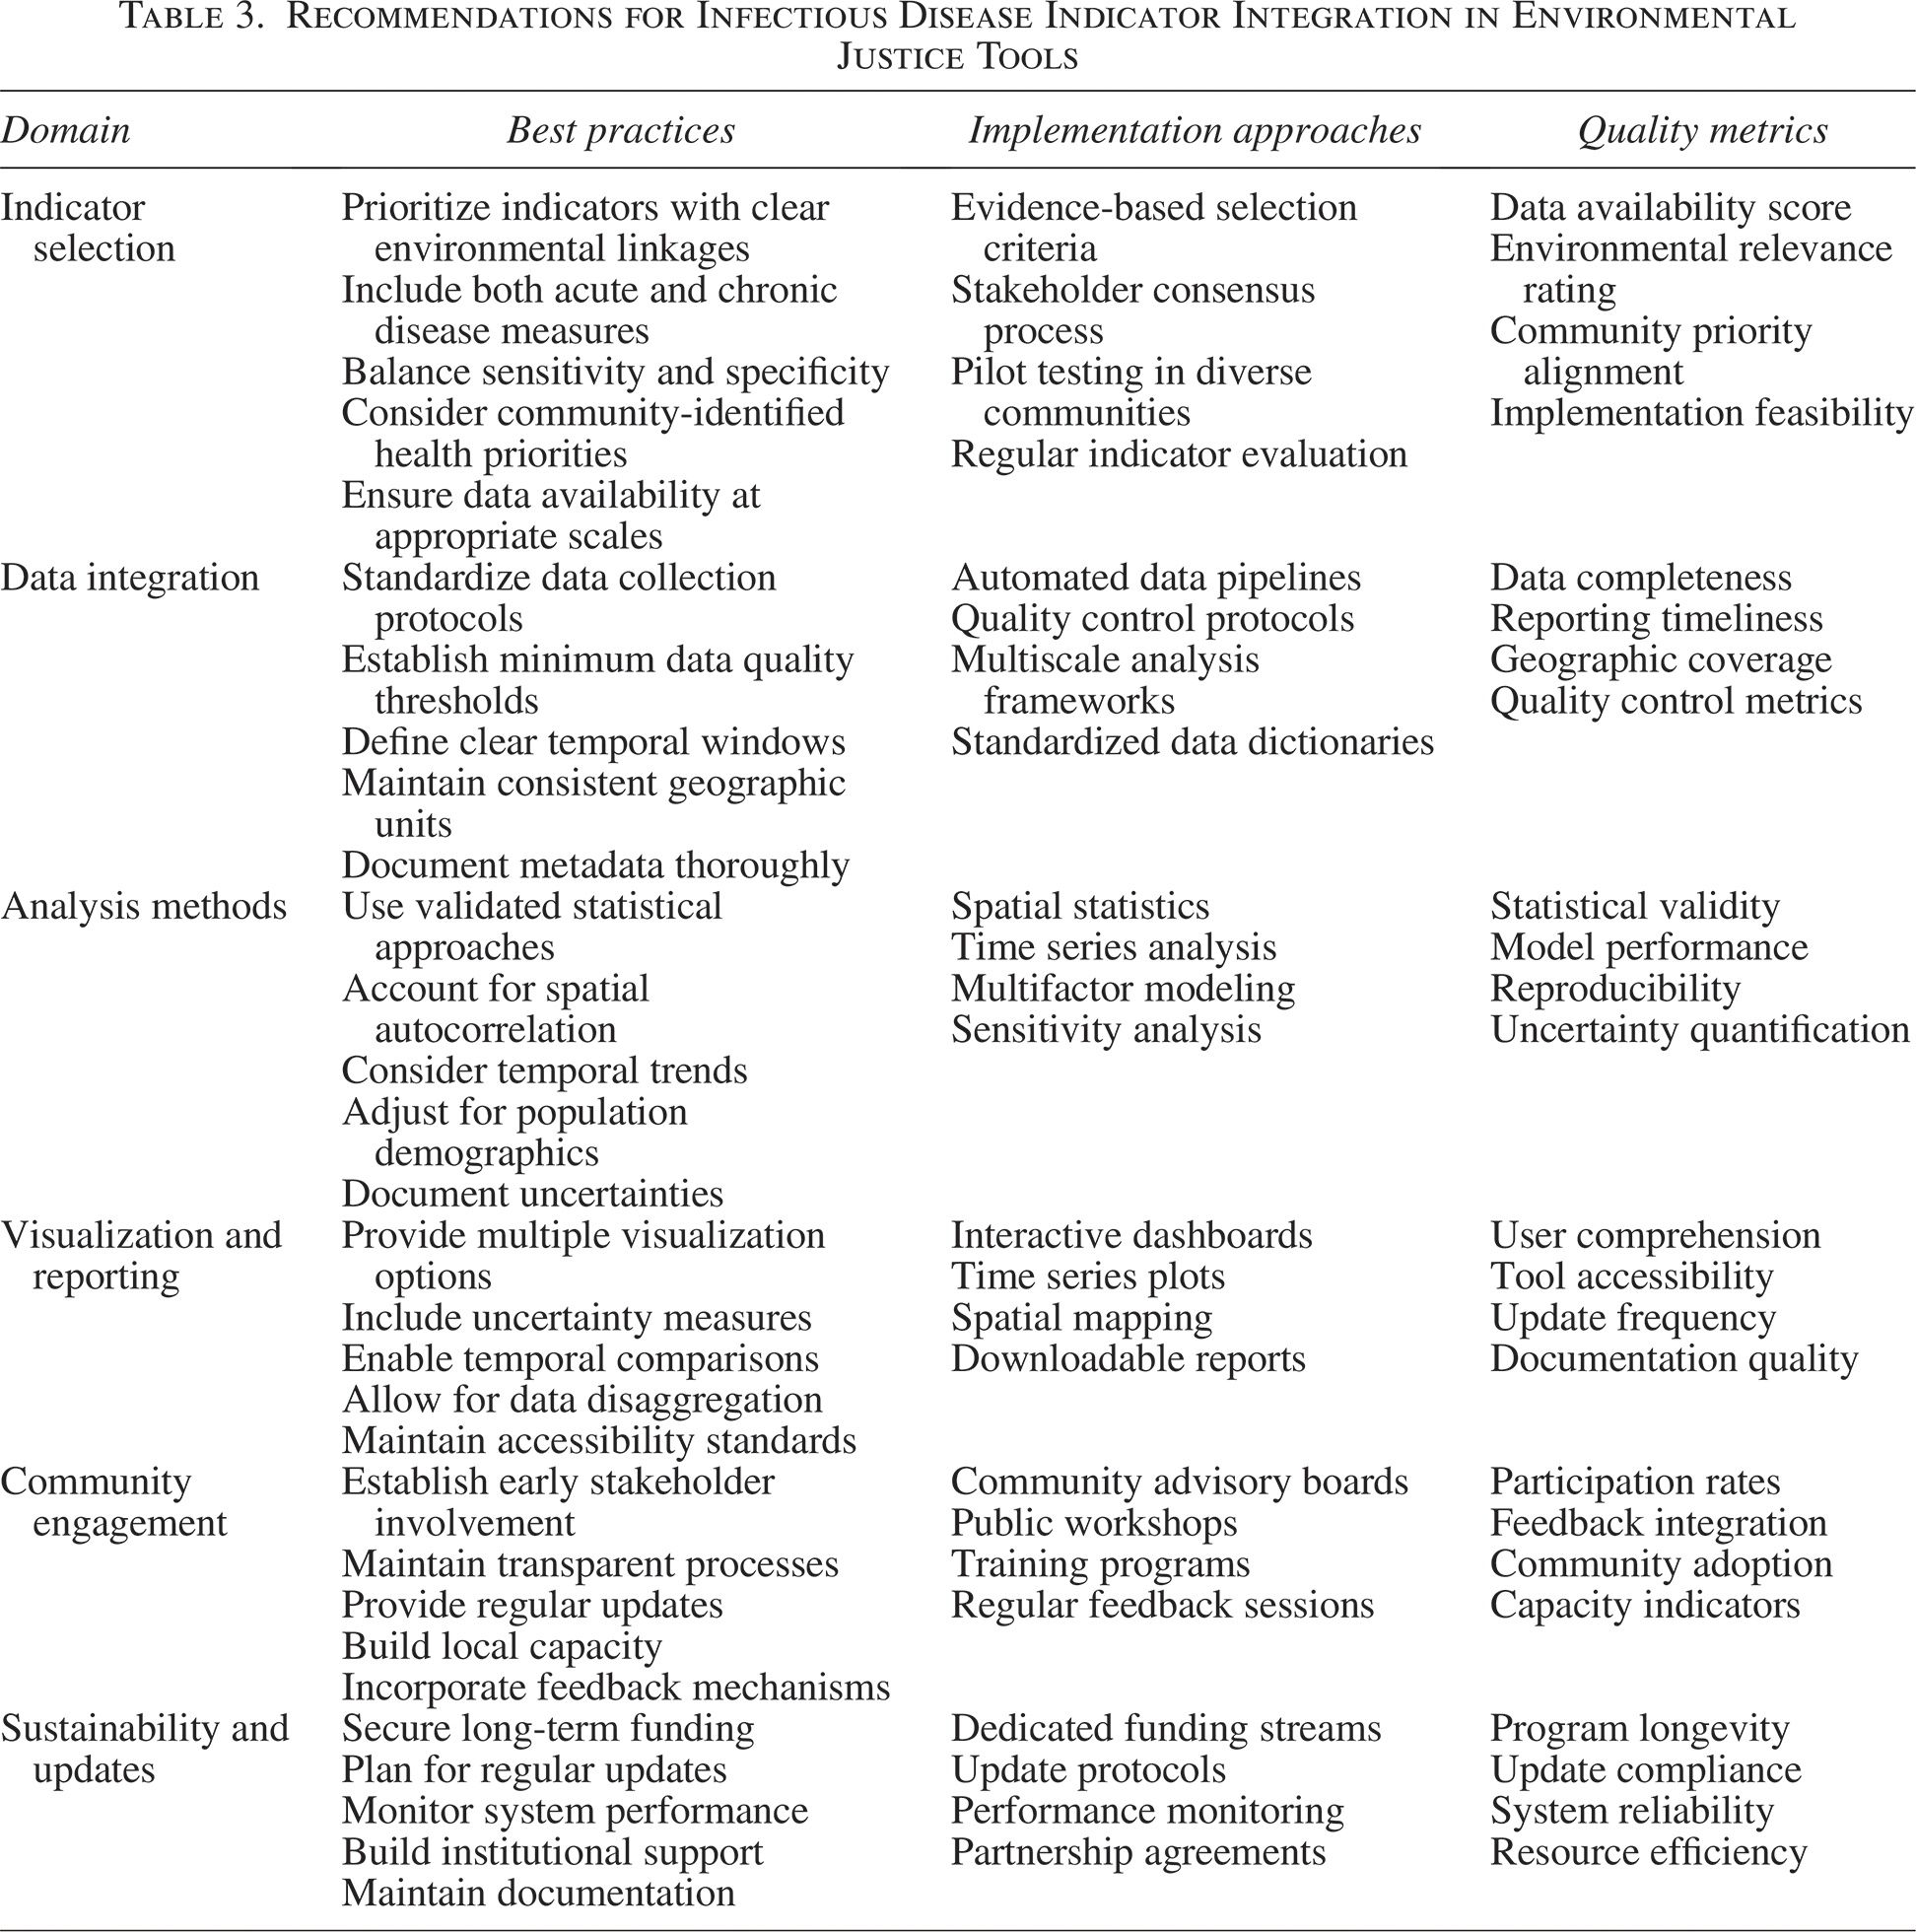
We include a checklist for selecting and integrating infectious disease indicators (Table 1), which provides a practical implementation guide for tool developers following our theoretical framework. This checklist addresses key considerations across planning, data acquisition, and implementation phases to ensure meaningful integration. Each potential indicator should demonstrate clear links to environmental conditions or social vulnerabilities while maintaining sufficient data quality to support reliable analysis and interpretation (see Tables 1, 2, and 3 for further details).
Checklist for Selecting and Integrating Infectious Disease Indicators in Environmental Justice Tools

Examples of Data Sources and Infectious Disease Indicators for Environmental Justice Mapping Tools
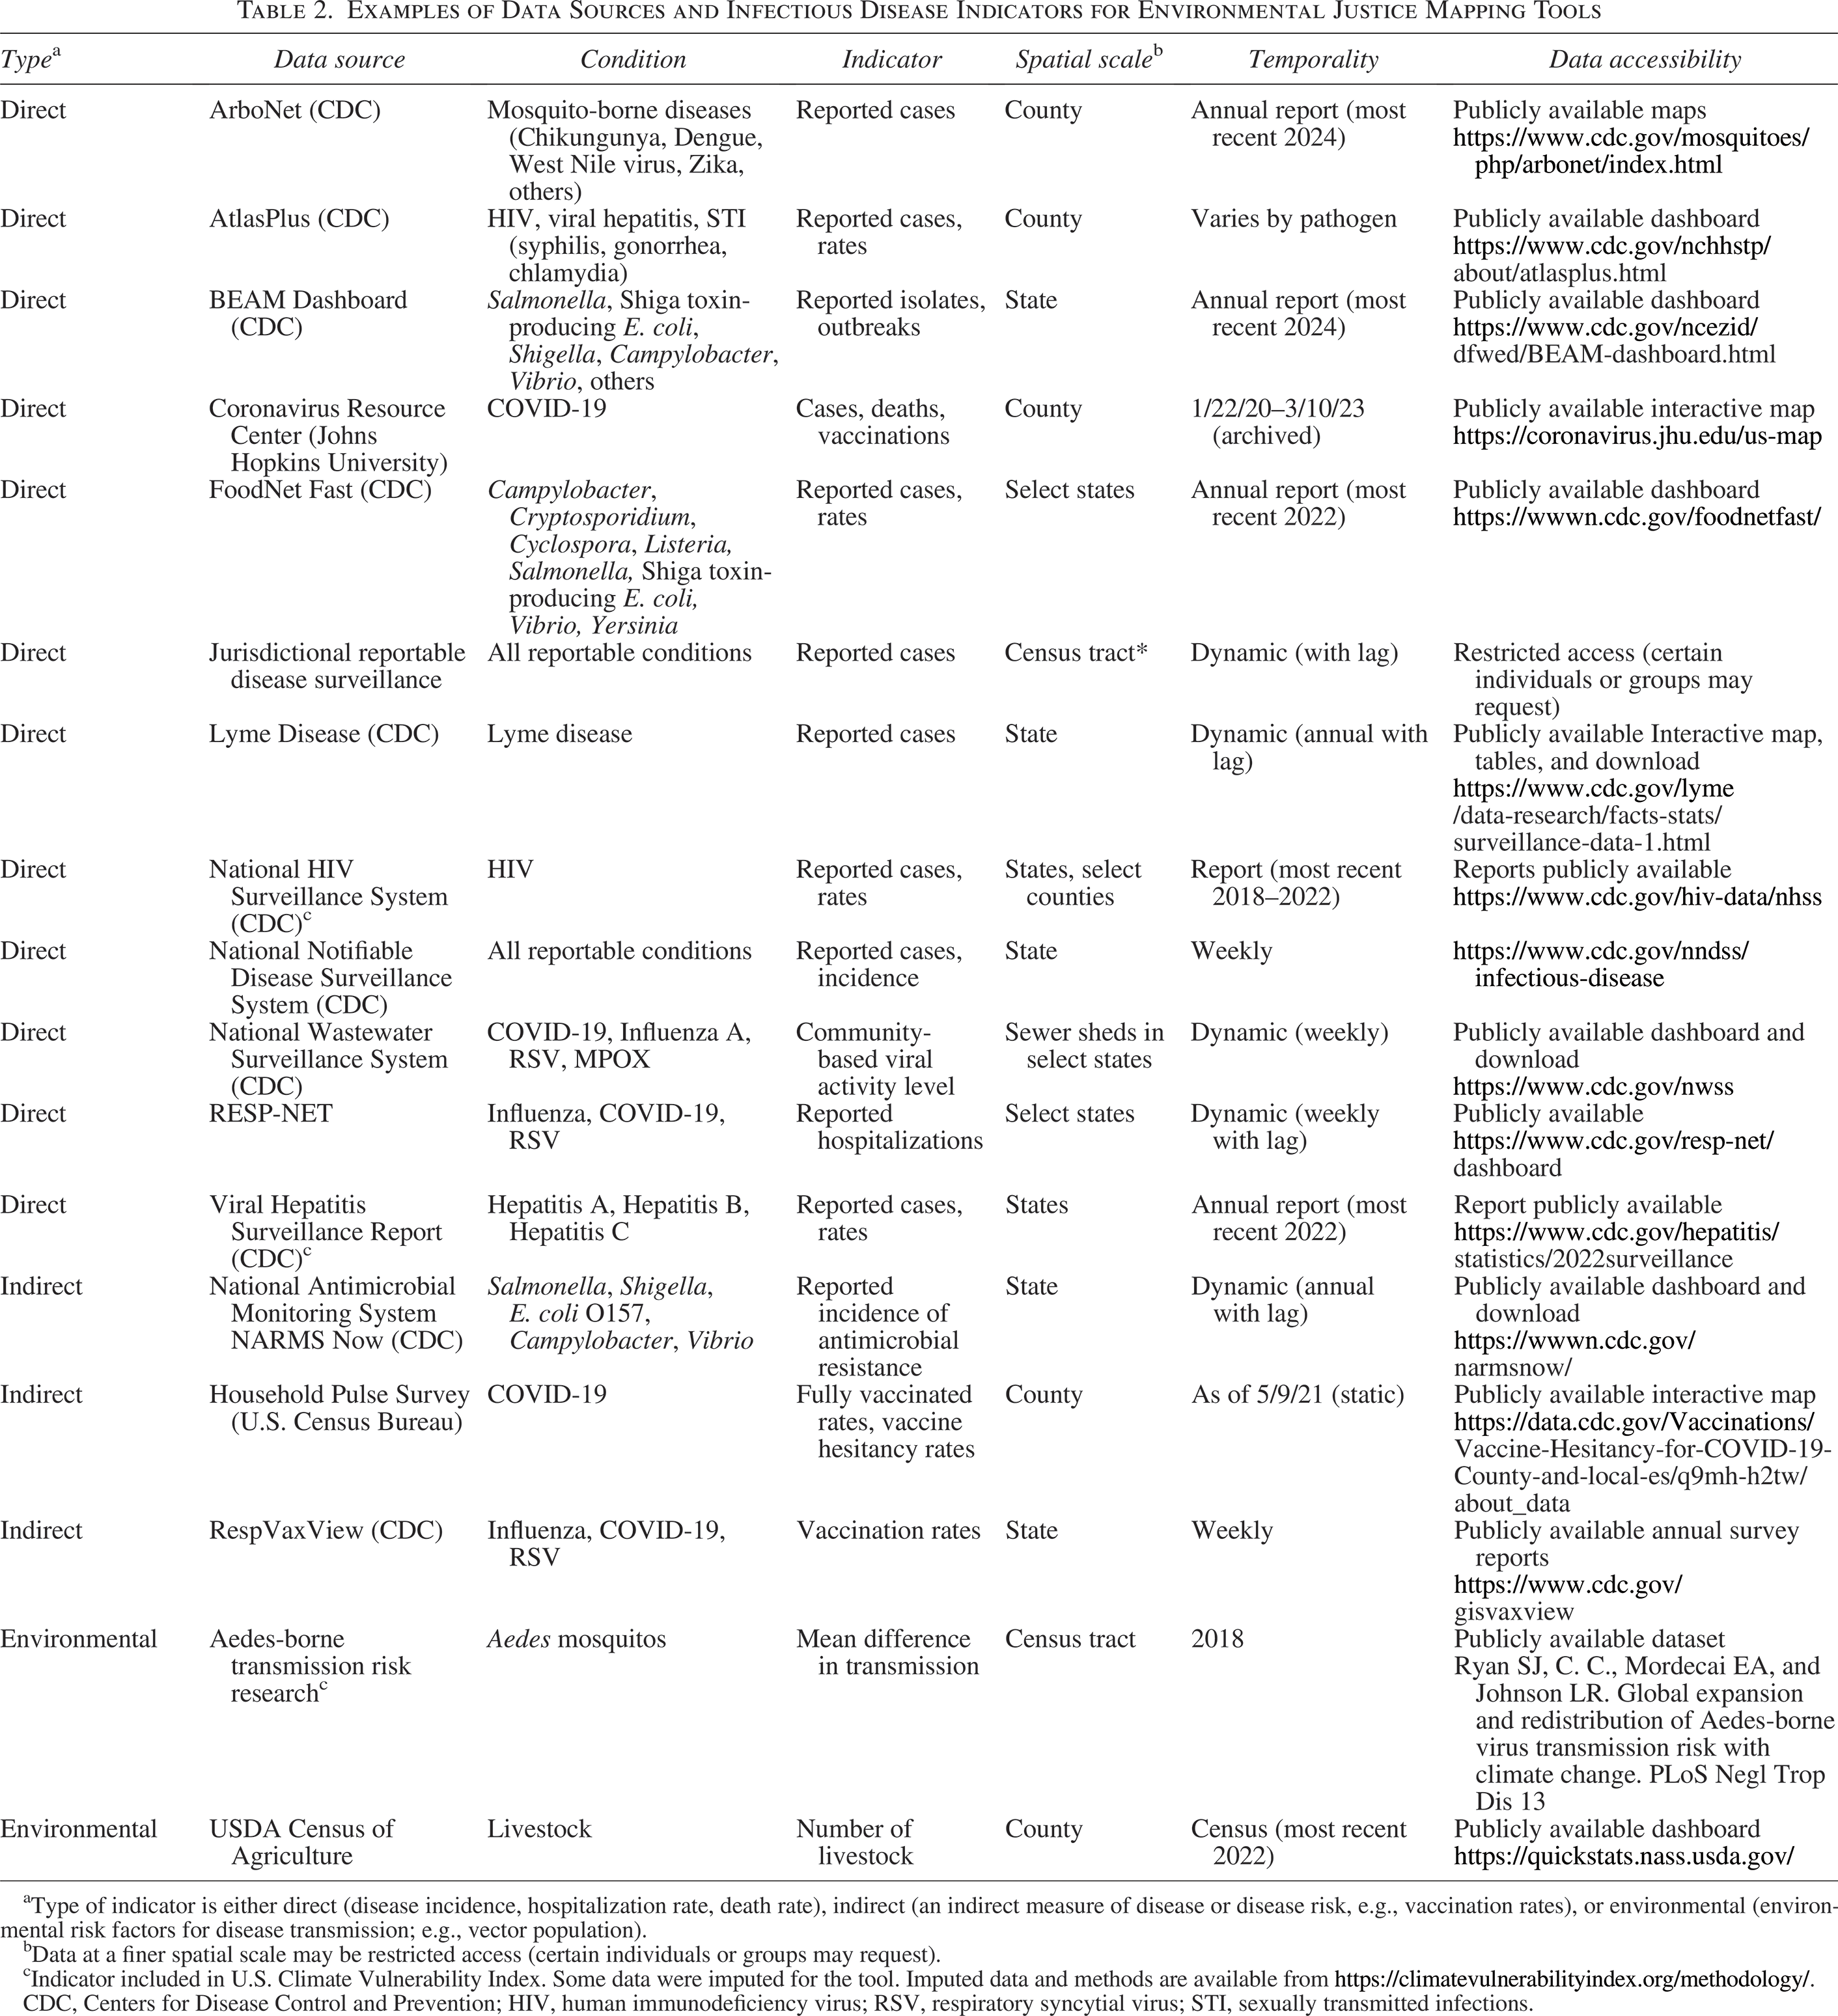
Type of indicator is either direct (disease incidence, hospitalization rate, death rate), indirect (an indirect measure of disease or disease risk, e.g., vaccination rates), or environmental (environmental risk factors for disease transmission; e.g., vector population).
Data at a finer spatial scale may be restricted access (certain individuals or groups may request).
Indicator included in U.S. Climate Vulnerability Index. Some data were imputed for the tool. Imputed data and methods are available from https://climatevulnerabilityindex.org/methodology/.
CDC, Centers for Disease Control and Prevention; HIV, human immunodeficiency virus; RSV, respiratory syncytial virus; STI, sexually transmitted infections.
Recommendations for Infectious Disease Indicator Integration in Environmental Justice Tools
Types of infectious disease indicators
Infectious disease indicators can be broadly categorized into three types: (1) direct disease measures, (2) indirect (or vulnerability) indicators, and (3) environmental transmission factors. Direct disease measures directly capture disease burden and include incidence rates, prevalence, mortality, and outbreak rates. These indicators may be limited to conditions that are reported to public health and therefore subject to the biases (e.g., selection bias) inherent to public health reporting. In addition, these indicators may be more variable over time. Indirect, or vulnerability, indicators include factors that influence disease susceptibility and transmission, such as vaccination rates, health care access, and population density. These tend to be more stable over time but may serve as indirect proxies for disease risk. Environmental transmission factors include measures of environmental conditions that facilitate disease spread, such as vector habitats, water quality indicators, and air pollution levels. These indicators often bridge the gap between environmental justice and infectious disease surveillance.
Example data sources for indicators are shown in Table 2, along with recommendations in Table 3. The primary source available for direct indicators is public health surveillance data available at the national or jurisdictional (state, region, or territorial) level. The Centers for Disease Control and Prevention (CDC) manages surveillance for reportable conditions nationally through the National Notifiable Disease Surveillance System, with programs maintaining publicly available dashboards or routine reports. The time frame available and update frequency vary by condition, as does the spatial scale. Most indicators are available at the state-level only by publicly available surveillance. Depending on the decision making goals and spatial scale of a tool and other indicators, direct measures of infectious disease at a finer resolution (i.e., county or census tract) may be more meaningful. These data are typically restricted access due to privacy concerns and the potentially identifiable nature of the data. For this access, tool developers should collaborate with communicable disease programs at state or territorial public health agencies to evaluate the feasibility of incorporating infectious disease indicators at the desired spatial scale and facilitate data requests. Indirect and environmental indicators may also be available through public health surveillance data (e.g., vaccine rates) or by other surveys, reports, or research (Table 2).
Spatial and temporal considerations
The dynamic nature of infectious diseases presents unique challenges for environmental justice mapping. Different diseases require different spatial scales for meaningful analysis, depending on the incidence and transmission patterns of the disease. Disease transmission often crosses administrative boundaries, and risk factors may operate differently at local versus regional scales. Privacy concerns often necessitate data aggregation, potentially masking local patterns or misaligning with other indicators, which would limit the interpretation of cumulative effects.
Temporal considerations include seasonal variations in disease transmission and lag times between environmental changes and disease outcomes. Some disease patterns follow a more long-term trend (e.g., endemic disease), whereas others are more acute (e.g., outbreaks). Update frequencies and reporting delays should also be considered with surveillance data. Most environmental justice tools are not updated in real-time but rather use published data from other sources that have an inherent reporting lag. As such, the lag associated with state reporting to surveillance systems should not hinder the use of infectious disease surveillance data in environmental justice tools. However, selecting a relevant and meaningful time period over which to average infectious disease indicators is important and should be done with consideration of pathogen-specific trends, including major outbreaks or disease trends (e.g., the COVID-19 pandemic). When incorporating infectious disease indicators, timeframes should be strategically selected to align with update cycles of other environmental justice indicators, typically by using multiyear averages that smooth seasonal variations while maintaining compatibility with the refresh rate of complementary datasets in the tool.
Current tools and implementation
We analyzed several recent reviews of environmental justice tools and found limited incorporation of infectious disease indicators. Among the tools reviewed, only the U.S. Climate Vulnerability Index and New Mexico’s OpenEnviroMap include specific infectious disease metrics. The U.S. Climate Vulnerability Index incorporates seven infectious disease indicators, focusing primarily on reportable diseases such as HIV, hepatitis, and sexually transmitted infections, while also including climate-sensitive diseases like dengue. New Mexico’s tool uniquely includes COVID-19 wastewater surveillance data, demonstrating innovative approaches to disease monitoring.
The limited inclusion of infectious disease indicators in current tools can be attributed to several factors, including a historical emphasis on chemical exposures and chronic diseases in environmental justice frameworks; challenges in accessing surveillance data at appropriate geographic scales; complexity in interpreting temporal variations in disease patterns; and resource constraints in data collection and tool maintenance. The integration of COVID-19 data with environmental justice indicators during the pandemic demonstrated the unique value of this approach. When COVID-19 case rates were overlaid with air pollution burden and socioeconomic vulnerability in several metropolitan areas, researchers identified communities experiencing compounding risks that were not apparent when examining disease surveillance data alone.
Strengths and limitations of current approaches
Current approaches demonstrate both promising innovations and significant limitations. Some of the strengths include integration of multiple data sources (e.g., surveillance, environmental monitoring), recognition of climate-sensitive diseases (e.g., vector-borne diseases), novel data sources (e.g., wastewater surveillance), and the ability to capture acute health impacts. Limitations of current approaches include insufficient temporal resolution for outbreak detection, limited geographic coverage, incomplete integration with other environmental justice metrics, lack of standardization across jurisdictions, and inadequate consideration of disease transmission dynamics.
A comparative analysis of current tools reveals varying approaches to indicator selection, data visualization, and integration with other environmental justice metrics. Although some tools emphasize static disease burden measures, others attempt to capture more dynamic aspects of disease transmission. This diversity in approaches reflects both the complexity of the challenge and the need for more standardized frameworks for incorporating infectious disease indicators into environmental justice mapping.
FUTURE INTEGRATION OF INFECTIOUS DISEASE INDICATORS IN ENVIRONMENTAL JUSTICE TOOLS
The integration of infectious disease indicators into environmental justice mapping tools requires systematic approaches across multiple domains. Our analysis suggests several critical pathways for advancement, supported by evidence from existing tools and public health surveillance systems.
First, the development of standardized frameworks for infectious disease data integration must build upon existing environmental justice mapping infrastructures while acknowledging the unique temporal and spatial characteristics of infectious diseases. This requires moving beyond traditional static indicators to incorporate dynamic disease surveillance data. For example, tools could implement rolling averages for endemic diseases while maintaining capabilities for acute outbreak visualization, similar to approaches used in modern public health surveillance systems.
Second, strengthening the connection between environmental monitoring and infectious disease surveillance requires institutional collaboration and data standardization. Evidence from successful programs, such as the integration of COVID-19 wastewater surveillance in environmental justice assessments, demonstrates the feasibility and value of such connections. However, these efforts must be expanded to include a broader range of diseases and environmental factors.
Third, the enhancement of spatial analysis capabilities is essential for capturing the complex relationships between environmental conditions and disease transmission. This includes developing methods to analyze cross-boundary disease spread while maintaining appropriate geographic resolution for environmental justice assessment. Such approaches should incorporate advances in spatial epidemiology while remaining accessible to diverse stakeholders.
Fourth, sustainable funding mechanisms and institutional frameworks must support ongoing data collection and tool maintenance. This requires recognition of infectious disease surveillance as a core component of environmental justice assessment, rather than an optional addition. Evidence from existing programs suggests that integrated approaches can be cost-effective when properly resourced and maintained.
Finally, meaningful community engagement must guide the selection and implementation of infectious disease indicators. This ensures that tools reflect community priorities and experiences while maintaining scientific validity. The successful implementation of these approaches requires ongoing evaluation and adaptation. Future research should focus on developing validated metrics for assessing the effectiveness of integrated tools, examining the impact of different implementation strategies, and identifying best practices for maintaining robust surveillance systems in environmental justice communities. Additionally, investigations into novel data sources and analytical methods could further enhance our ability to capture the complex relationships between environmental conditions and infectious disease patterns.
The evolution of environmental justice mapping tools to include infectious disease indicators represents a significant advancement in our ability to understand and address environmental health disparities. As these tools continue to develop, maintaining scientific rigor while ensuring practical utility will be essential for their successful application in environmental justice assessment and decision making.
CONCLUSION
The integration of infectious disease indicators into environmental justice mapping tools represents both a significant opportunity and a complex challenge for advancing environmental health equity. Our analysis reveals several key insights that warrant consideration as the field moves forward.
First, the historical separation between infectious disease surveillance and environmental justice assessment has created significant gaps in our understanding of cumulative impacts in vulnerable communities. The COVID-19 pandemic has starkly illustrated these gaps, demonstrating how environmental burdens can amplify infectious disease outcomes and highlighting the urgent need for integrated approaches to community health assessment.41,42
Second, although technical challenges exist in incorporating dynamic disease patterns into traditionally static environmental justice metrics, emerging surveillance systems and analytical methods offer promising solutions. Innovations in real-time data collection, spatial analysis, and visualization techniques can help bridge this divide, though careful attention must be paid to data quality, temporal resolution, and geographic scale.
Third, the selection and implementation of infectious disease indicators must balance multiple competing demands. Tools must be comprehensive enough to capture complex health-environment interactions while remaining practical for routine use. They must maintain scientific validity while being accessible to diverse stakeholders. They must be standardized enough for cross-jurisdiction comparison while remaining flexible enough to address local concerns.
The path forward requires recognition that infectious diseases are not merely additional health metrics to be added to existing tools, but rather dynamic indicators that can reveal emerging environmental justice concerns and guide rapid response efforts. This perspective suggests the need for a fundamental shift in how we conceptualize and measure cumulative impacts, moving from static assessments toward more dynamic, integrated approaches to environmental justice mapping.
Future research directions should focus on several key areas:
Developing validated methods for integrating acute and chronic health impacts in cumulative impact assessments Examining the effectiveness of different indicator selection and implementation strategies Investigating novel data sources and analytical approaches for capturing disease–environment interactions Evaluating the impact of integrated tools on policy decisions and community outcomes
As environmental justice tools continue to evolve, the inclusion of infectious disease indicators will become increasingly important for understanding and addressing health disparities in vulnerable communities. The inclusion of infectious disease indicators also highlights the need for improved indicators related to environmental conditions and infrastructure; for example, rural well water use remains largely unmonitored despite the potential impact of water quality on environmental justice communities. Success in this endeavor requires sustained commitment to data quality, stakeholder engagement, and continuous improvement of analytical methods. By bridging the gap between infectious disease surveillance and environmental justice assessment, we can create more comprehensive and responsive tools for advancing environmental health equity.
The complexity of this challenge should not deter efforts toward integration. Rather, it should motivate innovative approaches to tool development and implementation. As climate change and environmental degradation continue to influence disease patterns, the need for integrated approaches to environmental justice assessment becomes increasingly urgent. The future effectiveness of environmental justice mapping tools will depend largely on their ability to capture these dynamic health–environment interactions while maintaining their utility for decision making and community advocacy.
AUTHORS’ CONTRIBUTIONS
A.E.W.: Conceptualization, investigation, visualization, and writing—original draft. D.R.-R.: Conceptualization, supervision, and writing—review and editing.
Footnotes
AUTHOR DISCLOSURE STATEMENT
The authors do not have any conflicts of interest to disclose.
FUNDING INFORMATION
This work did not receive any specific grant or funding.