




Abstract
The gender-science stereotype of associating males, rather than females, with science is pervasive and influential. The present study challenged the common-sense assumption that it is environment that leads to the gender-science stereotype by conducting a genetically informative study. A total of 304 pairs of twins (152 monozygotic [MZ] and 152 dizygotic [DZ]) completed explicit and implicit gender-science stereotype measures twice across 2 years. Results showed that both explicit and implicit gender-science stereotypes were heritable, with significant nonshared environmental influence. Moreover, genetic and nonshared environmental factors influencing the explicit gender-science stereotype also affected the implicit gender-science stereotype to some extent. These findings have important implications for understanding the nature of the gender-science stereotype and implicit social cognition.
Introduction
It is well known that statistically fewer females than males excel in mathematics and science in primary and middle school (Provasnik et al., 2012); pursue bachelor and doctor of philosophy degrees in science, technology, engineering, and math (STEM; Beede et al., 2011; Ceci & Williams, 2011); hold jobs in STEM fields (Beede et al., 2011; Ceci & Williams, 2011); and stand out as scientists (Sugimoto, Lariviere, Ni, Gingras, & Cronin, 2013). In tandem with this reality, the common belief that men are more talented and interested in STEM has manifested the so-called “gender-science stereotype.” To date, numerous studies have been done on the gender-science stereotype. Little, however, is known about its intrinsic origins. In this study, we examined whether the gender-science stereotype has any genetic bases.
The gender-science stereotype is prevalent. Pronounced gender-science stereotype has been found regardless of gender, age, ethnicity, and culture (Cvencek, Meltzoff, & Greenwald, 2011;Cvencek, Meltzoff, & Kapur, 2014; Hyde & Linn, 2006; Nosek et al., 2007; Nosek et al., 2009; Spencer, Steele, & Quinn, 1999). The gender-science stereotype is also consequential. Previous studies have established that increased salience of the gender-science stereotype may actually impair females’ performance in STEM areas (Inzlicht & Ben-Zeev, 2000; Spencer et al., 1999; Steele, 1997) and endorsing the gender-science stereotype may further predict academic performance in STEM areas (Hyde & Linn, 2006). Besides, the gender-science stereotype also manifests substantial variations across individuals (Nosek et al., 2007). These facts about the gender-science stereotype drive the question of how this stereotype has formed.
The coexistence of the gender gap in STEM domains and the widely held stereotype of associating males rather than females with science has led to the common conclusion that the gender-science stereotype is learned either from culture or from personal experiences, which indeed is well supported by empirical evidence (e.g., Dasgupta, 2013; Eagly & Steffen, 1984). Moreover, researchers have also suggested that some cognitive (e.g., psychological essentialism; Rothbart & Taylor, 1992) and affective (or motivational) factors (e.g., self-enhancement; Tajfel & Turner, 1979) may play a role in the formation of the gender-science stereotype. Even so, little is known as to whether or not genetic factors contribute to individual differences in the gender-science stereotype and even stereotypes in general, which is what we are going to address in this work.
Traditionally, stereotypes have been mostly assessed by self-report measures. Since people may not always be willing to or able to report their thoughts (Greenwald & Banaji, 1995), in recent decades, implicit measures have received increasing attention and even manifested advantage over its explicit counterparts in some circumstances (e.g., Nosek et al., 2009). In this study, besides self-report measure, we also employed the most popular implicit measure, the implicit association test (IAT; Greenwald, McGhee, & Schwartz, 1998) to gauge the gender-science stereotype. In the gender-science IAT, participants need to categorize males and science stimuli (vs. females and humanities) together in one block but to categorize females and science stimuli (vs. males and humanities) together in another block as soon as possible. The differential ease was taken as the index of the strength of automatic association between male and science. In this case, what IAT taps is assumed to be the implicit gender-science stereotype because participants do not need to report their conscious beliefs about gender and science. By using the IAT, research has shown that the implicit gender-science stereotype emerges in early childhood (Cvencek et al., 2011), is developmentally stable (Cvencek et al., 2011; Nosek et al., 2009), ubiquitous (Nosek et al., 2007), substantially variable across individuals (Nosek et al., 2007), and predictive of gender difference in performance of math and science (Kiefer & Sekaquaptewa, 2007; Nosek, Banaji, & Greenwald, 2002; Nosek et al., 2009). Besides, a modest but significant correlation between the explicit and implicit gender-science stereotypes has been found (Cvencek et al., 2011; Nosek et al., 2002; Nosek et al., 2007).
We aimed to examine the genetic bases of the explicit and implicit gender-stereotypes as well as their relationship. To achieve these goals, we conducted a longitudinal twin study in China. MZ twins share 100% of their genes, but DZ twins only share 50% of their genes on average. The comparison of resemblance between MZ and DZ twins allows us to estimate genetic and environmental influences on the gender-science stereotype.
Method
Participants
We recruited twins from the Beijing Twin Study (BeTwiSt), Beijing, China. Twins in the BeTwiSt are sociodemographically representative of Beijing adolescents (Chen et al., 2013). To ensure the measures were accessible to all participants, we only invited twins who had finished middle school at the time of the first wave. This resulted in a total of 304 twin pairs agreeing to participate in the study (56% female; age: M = 18.3, SD = 2.0), among which 152 pairs were MZ and the other 152 pairs were DZ (94 same sex and 58 opposite sex). A subset (232 twin pairs) agreed to participate in the retest 2 years later. The retest sample included 117 MZ pairs, 68 same-sex DZ pairs, and 47 opposite-sex DZ pairs (57% female; age: M = 20.3, SD = 1.9). The zygosity of 95% of the twin pairs was determined via DNA testing and for the remaining pairs, zygosity was decided by a combination of parent reports and children’s self-reports about co-twin physical similarity and frequency of confusion (Chen et al., 2013). The ethics committee of the Institute of Psychology, Chinese Academy of Sciences provided approval for the study. Additionally, we obtained written informed consent from all participants and their parents prior to commencing the test. In the first test, the data on one sibling of a DZ pair were missing, so the participant was excluded from all analyses.
Procedure
Participants privately completed the following measures, along with other irrelevant measures, on personal computers in quiet rooms. In the first wave, all twins completed a 2-item explicit measure and a Brief IAT (BIAT; Sriram & Greenwald, 2009). In the second wave, along with the same explicit measure and BIAT, participants also completed a regular IAT, which used the same stimuli as in the BIAT. On the first test occasion, the order between explicit and implicit measures, which were separated by some irrelevant measures, was counterbalanced across participants but was kept the same for the two members of every twin pair. In the second test, in order to keep the counterbalance design manageable, the IAT always came first, then the BIAT and the explicit measure last, with some irrelevant measures in between.
Measures
The explicit gender-science stereotype was examined by two 7-point Likert-type scales (1 = strongly female, 4 = neither male nor female, and 7 = strongly male; Nosek et al., 2009). One item assessed the extent to which participants associated science with males or females, while the other item assessed the extent to which they associated humanities with males or females. The score for the humanities item was reversed first, so that a higher score meant a stronger gender-science stereotype and then the scores of the two items were averaged to form an index of the explicit gender-science stereotype.
The implicit gender-science stereotype was gauged by the BIAT in both waves and by the regular IAT in the second wave. The regular IAT included seven blocks, among which two types of combined blocks were critical: in the male + science (vs. female + humanities) blocks, participants were instructed to map male (man, boy, father, and husband) and science (biology, physics, chemistry, and math) words onto one computer key, and female (women, girl, mother, and wife) and humanities (philosophy, literature, English, and history) words to another key (20 practice trials and 40 test trials); in the female + science (vs. male + humanities) blocks, participants were asked to map female and science words onto one computer key, and male and humanity words to another key (20 practice trials and 40 test trials). BIAT is a brief version of IAT, which only comprised two combined blocks: male + science (vs. female + humanities) and female + science (vs. male + humanities). In each block, participants were instructed to pay attention to exemplars of one pair of categories (e.g., male and science) but ignore other stimuli and respond to focal stimuli with one key but respond to other stimuli with another key. Each block consisted of 24 trials with the first 4 trials used as practice and thus excluded from the analysis. For both the IAT and BIAT, the two critical blocks were counterbalanced across participants but were kept the same for the two members of every twin pair. For all blocks, participants were asked to respond rapidly and accurately, with a few errors allowed. If the initial response to a stimulus was incorrect, a red “X” would appear and remain on the screen until the correct response was made and latency was recorded in occurrence with the correct response.
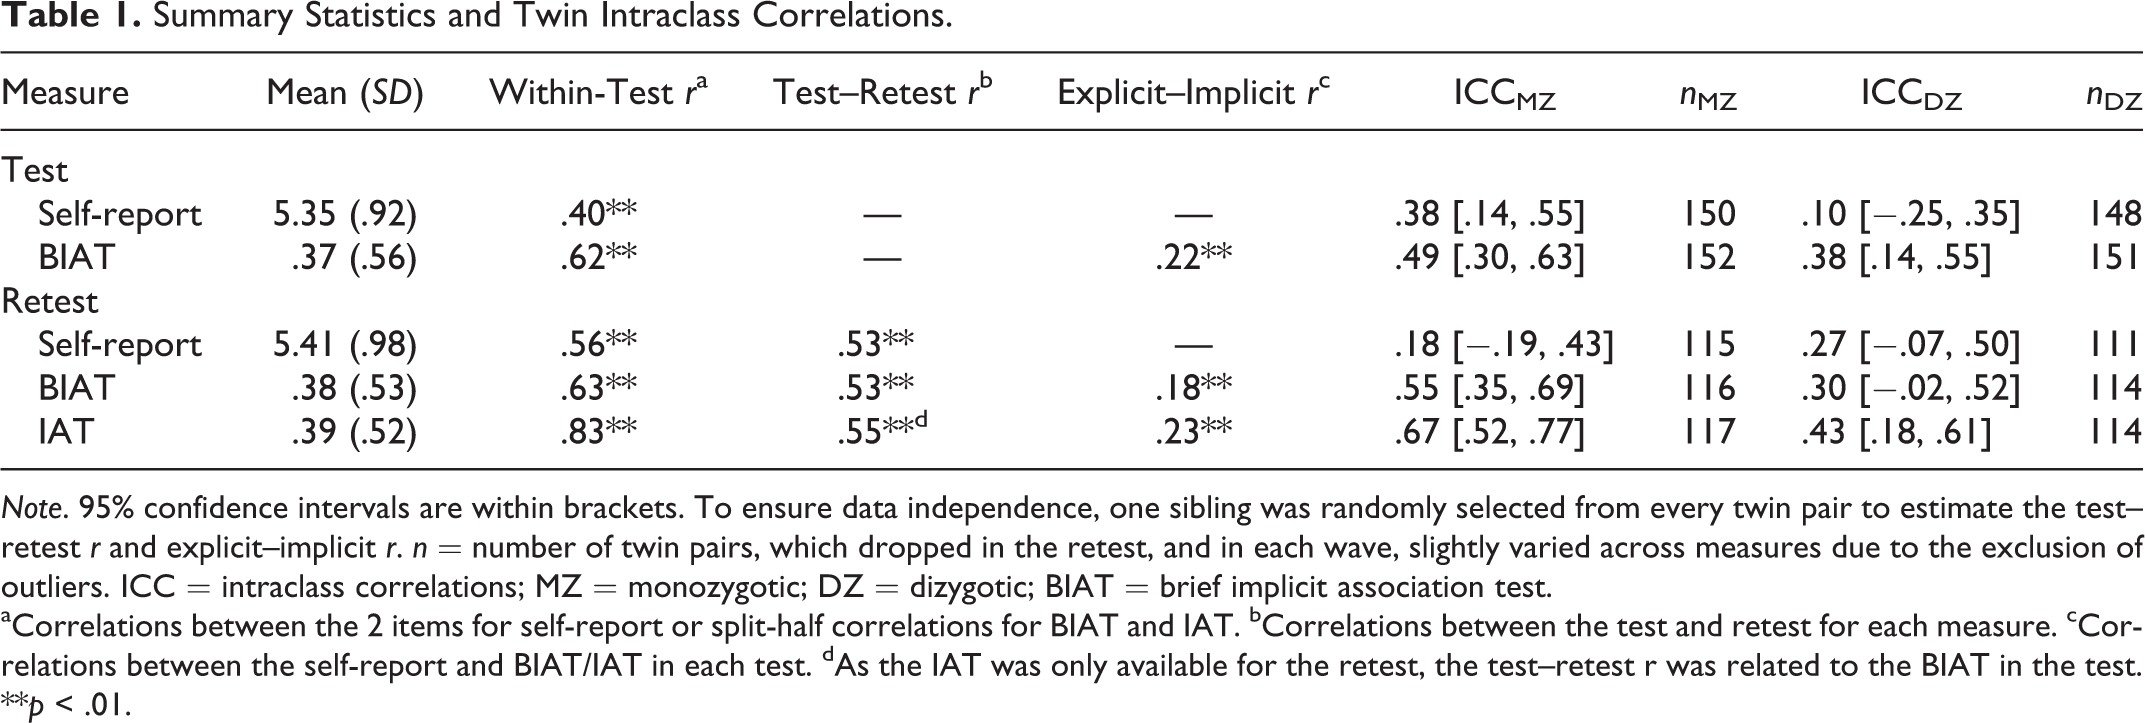
Following previous studies (Greenwald, Nosek, & Banaji, 2003), we used the improved D score as the index for the implicit gender-science stereotype. In computing D, we first discarded the warm-up trials in the two critical blocks (the first two trials for IAT and the first four trials for BIAT) and those trials with latency greater than 10,000 ms and smaller than 300 ms. The mean latencies for the male + science and female + science blocks were calculated based on all remaining trials for IAT and BIAT, respectively. A pooled standard deviation was computed using latency from all remaining trials of two combined blocks. Finally, the D was obtained by dividing the mean latency difference between the two types of critical blocks by the pooled standard deviation; the higher the score, the stronger the implicit gender-science stereotype. The split-half reliability was comparable to previous findings (Table 1; Greenwald et al., 2003; Sriram & Greenwald, 2009).
Summary Statistics and Twin Intraclass Correlations.
Note. 95% confidence intervals are within brackets. To ensure data independence, one sibling was randomly selected from every twin pair to estimate the test–retest r and explicit–implicit r. n = number of twin pairs, which dropped in the retest, and in each wave, slightly varied across measures due to the exclusion of outliers. ICC = intraclass correlations; MZ = monozygotic; DZ = dizygotic; BIAT = brief implicit association test.
aCorrelations between the 2 items for self-report or split-half correlations for BIAT and IAT. bCorrelations between the test and retest for each measure. cCorrelations between the self-report and BIAT/IAT in each test. dAs the IAT was only available for the retest, the test–retest r was related to the BIAT in the test.
**p < .01.
Genetic Analyses
As twins are perfectly correlated for age and same-sex twins are perfectly correlated for their sex, the variation associated with age or sex would inflate the correlation between twins. Following the standard procedure, all measures were corrected for age and sex effects via regression (McGue & Bouchard, 1984). The standardized residuals were saved for genetic analyses. Based on the standardized residuals, participants whose scores were 3 SDs away from the mean value of the whole sample were excluded from further analyses (see Table 1 for valid sample size for each measure). Little’s missing completely at random test implemented in SPSS (Version 20) suggested that the data were missing at random (χ2 = 87.236, df = 72, p = .107). Thus, in the following genetic analyses, all available data were included, even those of twin pairs not pairwise.
By employing quantitative genetic modeling, we decomposed phenotypic variance within a trait or covariance between traits into additive genetic effect (A), shared environmental effect (C), and nonshared environmental effect (E) as well as influence from the measurement error/unreliability (U) when the data of multiple waves are available. A significant A suggests that the trait is heritable or genetic factors significantly contribute to the variation of the trait. While shared environment contributes to the similarity of twins growing up in the same family, nonshared environment is unique to each individual.
First, to examine the heritability of implicit and explicit gender-science stereotypes, we used univariate models implemented in the OpenMx package for R (Boker et al., 2012). We examined the full ACEU model first (Figure 1). Submodels (AEU, CEU, and EU models) nested within the full model were then tested by systematically removing one or two components of variance.

Univariate genetic model fitting. A, ACEU model for explicit measures. B, ACEU model for implicit measures. Exp = explicit; Imp = implicit; BIAT = brief implicit association test; imp1 = BIAT; imp2 = IAT. Measured variables are depicted in rectangles. Latent factors are presented in circles. Reliable genetic and environmental variance is identified by equating pathways from A, C, and E to data from multiple test occasions. U is unshared between the two tests but represents an equal amount of variance for each variable on each test occasion and therefore is equated across test occasions. Correlations between co-twins for A and C are fixed at Mendelian expectations. A = additive genetic effect; C = shared environmental effect, E = nonshared environmental effect; U = error/unreliability.
Next, for the bivariate modeling of implicit and explicit gender-science stereotypes, we used a correlated factor model based on Cholesky decomposition (Loehlin, 1996). In this model, each measure is separately decomposed into its genetic, shared environmental, nonshared environmental, and measurement error/unreliability components; meanwhile, the correlations of ACE components across variables are estimated (Figure 2). 1 The ACE correlations (i.e., r g, r c, and r e) indicate the extent to which two measures are jointly influenced by certain genetic, shared environmental, and nonshared environmental factors, respectively. Based on the three correlations and the correlated factors model (Figure 2), we can further estimate how much genes, shared, and nonshared environments contribute to the phenotypic correlation between implicit and explicit stereotypes, respectively. For instance, the portion of genetic contribution is (a1 × r g × a2)/r phenotype. Similar to the univariate analysis, the full ACEU model and all the submodels were systematically tested.
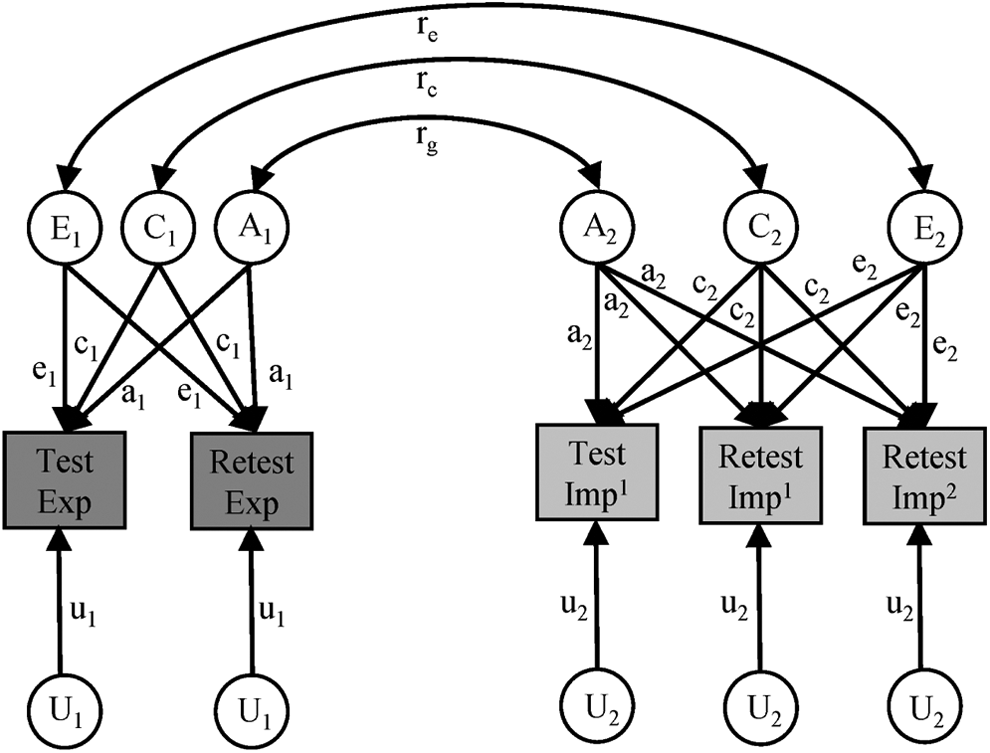
Bivariate genetic model fitting. r g, r c,, and r e are genetic, shared environmental, and nonshared environmental correlations, respectively. Due to space limitations, the diagram for a single member of a twin pair is presented.
We gauged the model fitness based on any changes in χ2 and the Akaike information criterion (AIC; Akaike, 1987). A significant χ2difference between the full model and a submodel suggested that the nested model fits significantly worse than the full model and the full model should be chosen; otherwise, the nested model with fewer parameters should be considered in terms of parsimony (Kline, 1998). A lower AIC value indicates better fit.
Results
Table 1 presents the descriptive statistics of all measures. We discovered that significant gender-science stereotyping existed (vs. neutral position: ts > 15.00, ps < .001; Table 1). The magnitude of the gender-science stereotype was stable across test sessions for both explicit and implicit measures, implicit: F(1, 463) = .90, p = .343; explicit: t(463) = −1.01, p = .313. The test–retest correlations were considerable for both explicit and implicit measures. Within each wave, the correlations between implicit and explicit measures were modest but significant.
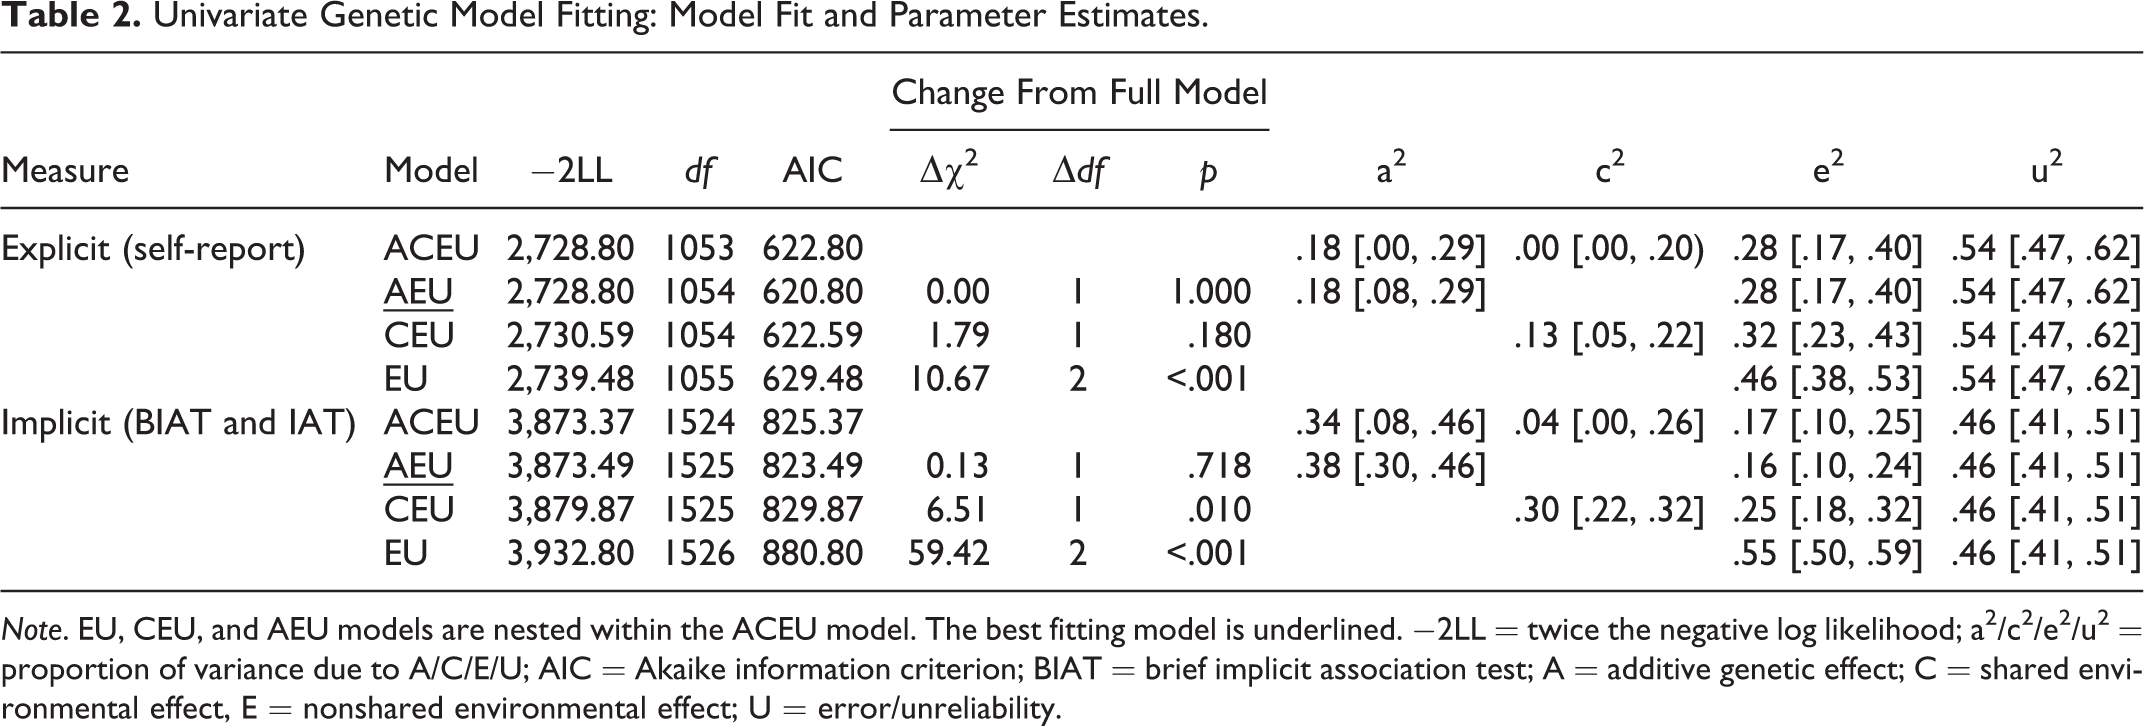
Regarding the explicit gender-science stereotype (Table 1, Figure 3), MZ twins resembled each other more than DZ twins did in the first wave (Fisher’s z test, one tailed, z = 2.57, p = .005), suggesting that the explicit gender-science stereotype was heritable, though MZ twins were no more similar than DZ twins in the second wave (Fisher’s z test, one-tailed, z = −.73, p = .233). To estimate the additive genetic (A), shared environmental (C), and nonshared environmental (E) contributions as well as measurement error/unreliability (U; Figure 1.A), we fitted an ACEU model to two wave’s data simultaneously. Compared to the full ACEU model (Table 2), the AEU model was chosen for being both parsimonious and fittest (as indicated by the smallest AIC value; Akaike, 1987). The AEU model identified 18% and 28% of individual differences in the explicit gender-science stereotype that were attributable to genetic and nonshared environmental influences, respectively, with the remaining 54% variation accounted for by measurement error/unreliability.
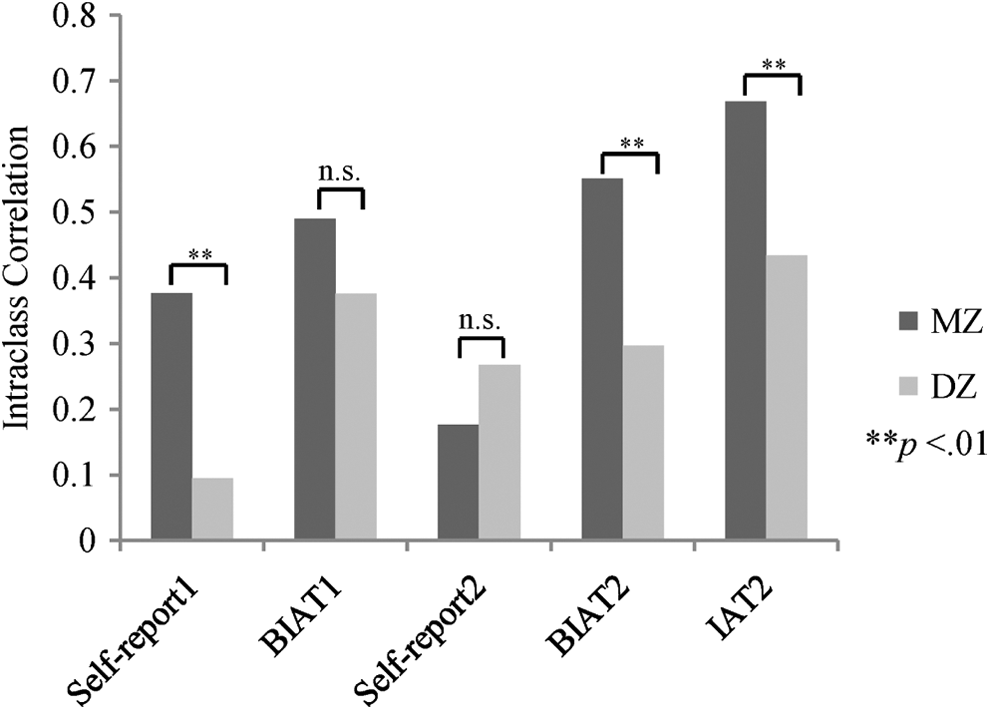
Twin resemblance in gender-science stereotypes. Test and retest are denoted as 1 and 2, respectively.
Univariate Genetic Model Fitting: Model Fit and Parameter Estimates.
Note. EU, CEU, and AEU models are nested within the ACEU model. The best fitting model is underlined. −2LL = twice the negative log likelihood; a2/c2/e2/u2 = proportion of variance due to A/C/E/U; AIC = Akaike information criterion; BIAT = brief implicit association test; A = additive genetic effect; C = shared environmental effect, E = nonshared environmental effect; U = error/unreliability.
Likewise, we examined the implicit gender-science stereotype. For all three assessments of the implicit gender-science stereotype (two BIATs and one IAT; Table 1, Figure 3), MZ twin correlations were higher than those of the DZ twins. The difference was significant for both the BIAT and IAT in the second wave (Fisher’s z test, one-tailed; BIAT: z = 2.35, p = .009; IAT: z = 2.57, p = .005), although not significant for the BIAT in the first wave (Fisher’s z test, one-tailed, z = 1.21, p = .113). These results indicated the heritability of the implicit gender-science stereotype. Since the three implicit measures were highly correlated with each other, we concurrently included them in the genetic model fitting. Again, we used the ACEU model to partition individual differences in the implicit gender-science stereotype (Figure 1.B). The comparisons between the full ACEU model and the submodels indicated that (Table 2) (1) the shared environmental influence was trivial because the removal of the shared environmental component in the AEU model did not decrease the model fit (p = .718) and (2) the genetic influence was important because the model fit dropped significantly after excluding the genetic factor (CEU model, p = .010). Therefore, according to the parsimony principle (Kline, 1998), the AEU model was chosen. According to the AEU model, genetic and nonshared environmental factors accounted for 38% and 16%, respectively, of the individual differences in the implicit gender-science stereotype, with measurement error/unreliability explaining the remaining 46% variation.
As both explicit and implicit gender-science stereotypes are heritable, are there any genetic factors influencing them simultaneously? To address this, we tested a correlated factor model (Figure 2). We fitted the data with the full ACEU model first and the AEU, CEU, and EU models subsequently (Table 3). Compared to the full model, the AEU model fitted the data well, but the CEU and EU models proved significantly worse (ps < .05). Based on the AEU model, the genetic factors that affected the implicit gender-science stereotype also moderately influenced the explicit stereotype (r g = .36 and 95% confidence interval [CI] [.08, .66]) and so did the nonshared environments (r e = .29 and 95% CI [.00, .58]). In addition, 60% (95% CI [.14, 1.00]) and 40% (95% CI [.00, .86]) of the phenotypic correlation between implicit and explicit stereotypes were attributed to genetic effects and nonshared environmental effects, respectively.
Bivariate Genetic Model Fitting.

Note. EU, CEU, and AEU models are nested within the ACEU model. The best fitting model is underlined. −2LL = twice the negative log likelihood; AIC = Akaike information criterion; A = additive genetic effect; C = shared environmental effect, E = nonshared environmental effect; U = error/unreliability.
Discussion
The gender-science stereotype is widespread and detrimental. By conducting a longitudinal twins study, we found that the gender-science stereotype, either reported directly or tapped indirectly by reaction time–based measures, is moderately heritable, although impacts of nonshared environments are also substantial. Moreover, we found that genetic factors also partly facilitate the correlation between explicit and implicit gender-science stereotypes.
The heritability of the gender-science stereotype, echoing a previous finding that genetic factors influence attitudes toward separate roles for men and women (Eaves, Eysenck, & Martin, 1989), indicates that the gender-science stereotype is not totally determined by culture and personal experiences. Genetic factors may influence the gender-science stereotype in multiple ways. First, genes may affect the gender-science stereotype by influencing and interacting with environments, manifesting as gene–environment correlation and gene–environment interaction, respectively (Plomin, DeFries, McCleann, & McGuffin, 2008). For instance, an intrinsically biased person may purposely seek and create stereotype-consistent environment and then the stereotype-consistent environment reversely strengthens his or her stereotype; meanwhile, a person who is intrinsically sensitive to stereotyped environment may be more responsive to stereotype information than one who is intrinsically less sensitive (Plomin, DeFries, & Loehlin, 1977). Second, some of the cognitive and affective (or motivational) causes of stereotypes may have genetic bases. For instance, as a motivational cause behind stereotypes, self-enhancement has evolutionary significance and a genetic basis (Neiss, Sedikides, & Stevenson, 2002). Finally, genes may influence the gender-science stereotype by modulating relevant neurological activities. Numerous studies have examined neural underpinnings of stereotype. While research showed that at the micro-level, single-cell activities are responsive to the formation of association memory, which constitutes the basic representation of stereotype (Naya & Suzuki, 2010), at the macro-level, research also revealed that stereotype, as a kind of special semantic knowledge, has special neural substrates (Contreras, Banaji, & Mitchell, 2012). Specifically, the implicit gender stereotype was found to be associated with brain activities in areas such as the ventromedial prefrontal and ventrolateral prefrontal cortexes (Gozzi, Raymont, Solomon, Koenigs, & Grafman, 2009; Milne & Grafman, 2001). More relevantly, a study provides direct evidence that genes may influence both explicit and implicit gender stereotypes (Forbes et al., 2012). In this study, it is shown that brain-derived neurotrophic factor gene could influence people’s implicit and explicit gender stereotypes by modulating plasticity within orbitofrontal cortex and dorsolateral prefrontal cortex, respectively (Forbes et al., 2012).
Particularly fascinating is the heritability of the implicit gender-science stereotype. Implicit social cognition has been extensively studied in past decades and substantial progresses have been made in understanding the nature of implicit attitudes, prejudice, and stereotypes (Gawronski & Payne, 2010). Heretofore, it has been widely assumed that implicit social cognition, including the implicit gender-science stereotype, is a kind of learned experience and is determined by environment (Dasgupta, 2013; Gawronski & Sritharan, 2010; Greenwald & Banaji, 1995). Our findings suggest that this is not true: about 38% of the variation in the implicit gender-science stereotype can be accounted for by genetic factors, which may partially explain why the gender-science stereotype is still persistent in cultures where females actually outperform males in science, such as in Singapore (Cvencek et al., 2014). The heritability of the IAT (including BIAT) effect also indicated that IAT taps personalized beliefs rather than mere extrapersonal associations (Karpinski & Hilton, 2001; M. A. Olson & Fazio, 2004).
Although the gender-science stereotype is heritable, environmental influences are still pronounced. Notably, it is nonshared environments that explain the remaining variations in the gender-science stereotype. These findings are consistent with the negligible shared environmental effect revealed in previous twin studies in social and personality psychology (Eaves et al., 1989; J. M. Olson, Vernon, Harris, & Jang, 2001) and highlight the importance of the way to experience and cope with environment. These findings also suggest that we should not discourage those who strive to reduce gender stereotyping. Indeed, both microenvironment (Dasgupta, 2013) and macroculture matter (Hyde & Mertz, 2009).
Consistent with previous findings (Cvencek et al., 2011; Nosek et al., 2009), we observed a modest but significant correlation between explicit and implicit gender-science stereotypes. Moreover, this modest phenotypic correlation has a genetic base: some common genetic factors influence explicit and implicit gender-science stereotypes simultaneously, upholding the fundamental nature of the explicit–implicit link. Meanwhile, this link is also environmentally determined, that is, some nonshared environments affect implicit gender-science stereotype also affect the explicit gender-science stereotype. Yet, the moderate magnitude of genetic and nonshared environmental correlations indicates that genetic and nonshared environmental factors that influence implicit and explicit gender-science stereotypes are not completely identical. Together, explicit and implicit gender-science stereotypes are etiologically related but also etiologically distinct, dovetailing with the model that distinct neural substrates underlie explicit and implicit processes on the one hand, and on the other hand, they interact with each other (Forbes & Grafman, 2013; Lieberman, 2007).
Past twin studies showed that genes and nonshared environments, but not shared environments, could exert substantial influences on various attitudes (J. M. Olson, Vernon, Harris, & Jang, 2001). Our findings about genetic and environmental influences on explicit and implicit stereotypes are consistent with this established pattern, suggesting certain similarity about the sources of distinct forms of social cognition. As the first behavioral genetic study about stereotype and implicit social cognition, the findings that both explicit and implicit gender-science stereotypes are heritable, are primary and carry important implications, which, however, does not imply that our study is immune to limitations. Actually, the sample we used is relatively small and the reliabilities of the measures are moderate, which might have reduced the possibility to detect any genetic effects. Fortunately, we have assessed the twins twice with multiple measures, which allowed us to control for error caused by measurement unreliability as well as possible construct instability across 2 years and consequently boosted the power of genetic analyses. Nevertheless, the CIs of the estimates in both univariate and bivariate genetic models are still relatively large, which might also be due to the moderate sample size and measurement reliabilities. Therefore, future replications with larger sample and more sophisticated design are desirable.
Footnotes
Acknowledgments
The authors gratefully acknowledge the contributions of the children and parents in the Beijing Twin Study (BeTwiSt).
Declaration of Conflicting Interests
The author(s) declared no potential conflicts of interest with respect to the research, authorship, and/or publication of this article.
Funding
The author(s) disclosed receipt of the following financial support for the research, authorship, and/or publication of this article: This work was supported by National Natural Science Foundation of China [31300871, 31571148].