
Abstract
A large literature has provided evidence that intergroup biases are common in facial recognition. In investigations of faces of different races, research has repeatedly demonstrated an Own Race Bias in which people are more accurate in recognizing racial ingroup compared to outgroup members. The primary goal of this research was to investigate whether participants from typically underrepresented populations in social psychological research (i.e., Blacks, South Asians, and East Asians) show biases in recognition accuracy when presented with ingroup faces and minority and majority outgroup faces. Not surprisingly, across three experiments, participants demonstrated superior recognition for faces of members of their own compared to other races. Although minority participants also demonstrated greater recognition accuracy for majority compared to minority outgroup faces, these effects were much smaller and typically nonsignificant. The implications of these findings for our understanding of basic processes in face perception, and intergroup relations, are discussed.
Understanding how faces are processed and factors that influence facial memory is vital to our knowledge of how we form impressions (Willis & Todorov, 2006; Zebrowitz, 2006). Being able to recognize others facilitates social interactions and interpersonal success. The importance of this ability becomes evident when we are unable to accurately recognize faces. Consequences of misidentification of faces can range from feelings of embarrassment in not remembering a person from a previous meeting, to not recognizing a colleague at a conference, to limited memory of a job candidate in a hiring situation, and to faulty eyewitness identification. In the latter case, such errors can result in wrongly incarcerating innocent individuals and creating distrust in our judicial systems (Sporer, 2001).
A large literature has provided evidence that biases are common in facial recognition. In particular, research has repeatedly demonstrated across a wide variety of social groups that people are more accurate in recognizing ingroup compared to outgroup faces (Hugenberg et al., 2010; Meissner & Brigham, 2001). For example, biases have been found for categories related to sex (Cross et al., 1971), age (Rodin, 1987), sexual orientation (Rule et al., 2007), university affiliation (Hehman et al., 2010; Hugenberg et al., 2013), and personality type (Bernstein et al., 2007; Young et al., 2010). By far, the most widely investigated recognition biases have been associated with race (Hugenberg et al., 2010; Meissner & Brigham, 2001). This Own Race Bias (ORB) literature indicates that people are better at recognizing members of their own compared to other races. For example, White participants typically show better recognition for White compared to Black faces, and Black participants show better recognition for Black compared to White faces (Brigham et al., 2007).
Importantly, ORB research has focused on recognition accuracy for members of groups to which we belong, ingroups, compared to members of groups to which we do not belong, outgroups. Researchers have yet to examine, however, how recognition may vary when comparing two outgroups. Are we more accurate in recognizing certain outgroups compared to other outgroups? For example, are East Asians more accurate in recognizing White compared to Black faces? If facial recognition is vital to impression formation processes and social interactions, it is important to not only understand how people differ in their recognition of ingroup and outgroup faces, but whether differences also exist when comparing faces from two outgroups. Notably, the cost of misidentifying members of other races may be especially prevalent and severe. Recent studies by the Innocence Project and other organizations indicate that approximately one third of wrongful convictions in the United States, Canada, and the United Kingdom involve errors in cross-race identification (Scheck et al., 2000; Smith et al., 2004). Understanding biases in recognition accuracy beyond ingroup compared to outgroup members therefore has important implications (Brigham & Malpass, 1985; Sporer, 2001; Wilson et al., 2013).
The primary goal of this research was to investigate whether participants from typically underrepresented populations in empirical social psychological research (i.e., Blacks, South Asians, and East Asians) show biases in recognition accuracy when presented with White majority faces compared to own and other minority ingroup and outgroup faces. These studies will provide information on a novel research question related to the processing of racial outgroup faces.
The potential knowledge from these types of studies becomes increasingly important as the ethnic/racial composition of countries and cities change. Around the world, there are more international migrants today than ever before, and these numbers are expected to rise (Koser, 2016). For example, recent data from Statistics Canada (2016) indicate that Toronto is a majority–minority city with 52% of the population being visible minorities. While the largest proportion of the population is White (48%), other groups such as Blacks (e.g., Ethiopia, Caribbean Islands, United States, 9%), South Asians (e.g., India, Pakistan, Bangladesh, 13%), and East Asians (e.g., China, Japan, Korea, 13%) are also relatively sizable. In a large multicultural city, recognition accuracy for a variety of different racial groups is important. In three experiments, we therefore investigated recognition of minority and majority outgroup faces. Next, we discuss the possibility of better recognition of outgroup majority versus outgroup minority faces.
Better Recognition of Faces From Majority Compared to Minority Outgroups
ORB researchers predict that people will be more accurate in recognizing members of own compared to other groups. Two primary reasons have been provided for this bias. One reason, related to visual experience, suggests that because people within a racial group interact more often and have more visual experience with ingroup members, it leads to better defined prototypes of faces of their own compared to other races (Hills & Lewis, 2006; Maurer et al., 2002; Michel et al., 2006; Rhodes et al., 1989; Valentine, 2001). Other theorists have argued for a more motivated account of the ORB related to categorization processes. Specifically, this explanation proposes that once a face has been identified as belonging to an ingroup or outgroup category, participants are impelled to process ingroup members in an individuated manner and to process outgroup members in a more categorical manner (Bernstein et al., 2007; Levin, 1996; 2000; MacLin & Malpass, 2001). Furthermore, these theorists suggest that this social goal can lead to an attentional focus on characteristics that can differentiate ingroup members and on characteristics that are prototypic of outgroup members (Hugenberg & Sacco, 2008; Pauker et al., 2009; Rhodes et al., 2009). For example, White participants focus more on the eyes of White relative to Black targets, resulting in better recognition of own- than other-race faces (Arizpe et al., 2016; Kawakami et al., 2014; Nguyen & Pezdek, 2017; Wang et al., 2015).
Notably, greater contact and experience, and motivated individuation of own-race faces, may work together to impact not only ingroup face recognition (Hugenberg et al., 2010) but superior recognition of majority compared to minority outgroup faces. In particular, although many large cities in North America may soon be majority–minority environments, the largest population remains White (Frey, 2018). Therefore, for many racial minorities, outside of the ingroup, their most frequent contact may be with members of the White majority. This factor would result in greater visual experience with majority than minority outgroups. Furthermore, members of minorities may perceive the White majority group to be more relevant (Fiske & Neuberg, 1990; Hugenberg et al., 2010). In particular, if members of the majority group wield more power, have higher status, and minority group members are more outcome dependent on the majority, then members of this group are likely to be individuated. In accordance with this theorizing, Shriver et al. (2008) found that participants showed higher recognition accuracy for wealthy compared to impoverished targets. Likewise, when White participants were outcome dependent on Black targets (i.e., they were paid to process them as individuals), their recognition of these targets increased and the ORB decreased (Kawakami et al., 2014). Together these findings suggest that people may be more accurate in recognizing majority compared to minority outgroup targets.
Better Recognition of Faces From Minority Compared to Majority Outgroups
An alternative possibility, however, is that people may be better at recognizing minority compared to majority outgroup faces. Although minority outgroups may be motivated to individuate majority outgroup members because they hold more power and status, it is possible that other minority outgroups may be more relevant to minorities. Specifically, minorities may individuate minority outgroup members because they believe that they share a history of discrimination and have similar experiences related to being disadvantaged (Ho et al., 2017). These common links associated with social exclusion may lead to perceived similarities, which can result in processing minority racial outgroup members more as individuals than category members (Chen & Ratliff, 2018; Gaither et al., 2016). Although it is possible that minority groups could interact more with members of minority rather than majority outgroups, we find this possibility unlikely. It is more likely that the greatest visual experience outside of the ingroup would be with the majority outgroup.
Overview of Experiments
The primary goal of this research was to investigate recognition biases related to members of one’s own category from other categories but also between two outgroup categories. In Experiment 1, White, Black, and South Asian participants were presented with a face recognition task related to White and Black targets. In Experiment 2, White, East Asian, and Black participants were presented with a face recognition task related to White and East Asian targets. In Experiment 3, East Asian participants were presented with a face recognition task related to East Asian and White targets, East Asian and Black targets, or Black and White targets.
In accordance with the ORB literature, in all experiments, we examined recognition of own- and other-race faces. Our main interest, however, was whether minority groups demonstrated a difference in recognition of White majority and other minority outgroup faces. We expected that recognition of ingroupp compared to outgroup faces, the ORB, will always be larger than recognition differences for outgroups. Of particular importance, however, was whether recognition accuracy was superior for majority compared to minority outgroup faces or the reverse, and the relative size of the effect.
Experiment 1
To initially investigate whether minority groups differ in their recognition of majority and minority outgroup faces, White, Black, and South Asian participants were presented in Experiment 1 with a face recognition task related to White and Black targets. In accordance with the ORB literature, we expected that White participants would show better recognition for White than Black targets and that Black participants would show better recognition for Black than White targets. Of primary interest, however, was whether South Asian participants would demonstrate better or worse recognition for White majority than Black minority targets.
Method
Participants and Design
To maximize power, we used a 2 Target Race (White and Black) × 3 Participant Race (White, Black, and South Asian) mixed design, with target race as a within-subjects factor. Fifty-four White (46 female), 45 Black (41 female), and 42 South Asian (30 female) undergraduates participated for course credit.
1
A sensitivity analysis using G*Power 3.1 (Faul et al., 2007) found that our final sample could detect effects of f = .13 (
Procedure
Participants were seated in individual cubicles in front of a computer workstation and presented with a face recognition task. In the learning phase of the task, participants were informed that they would be shown a series of faces and to pay close attention because there would be a subsequent memory test. In this phase, 48 faces—24 White (half female) and 24 Black (half female)—were presented individually and in a random order. To standardize the images and focus attention on internal facial features, Adobe Photoshop (San Jose, CA) was used to create images that excluded the target’s hair, were grey-scaled, cropped to the same size (360 × 450 pixels), and the mean luminance and contrast were set within a restricted range (136.20–146.96 pixels per intensity level), see Figure 1. Each trial consisted of a fixation cross (1,500 ms), a face centered vertically and horizontally (5,000 ms), and an intertrial interval (2,000 ms). In total, there were two blocks of 24 trials with a self-paced break between blocks.
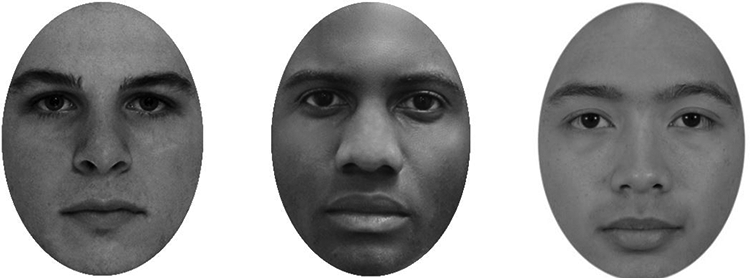
Examples of White (Experiments 1–3), Black (Experiments 1 and 3), and East Asian (Experiments 2 and 3) faces.
In a subsequent recognition phase, participants were presented with 96 faces that included the 48 faces previously shown in the first phase (old) and 48 faces that had not previously been shown (new). The new images were matched with the old images on gender, race, mean luminance, and contrast. Faces were presented individually and in a random order in the center of the computer screen. On each trial, participants were instructed to identify the image as either old or new using one of two computer keys. To ensure that participants attended to each face, the image was presented for 400 ms before the response options appeared on screen, which remained on screen until the participant responded. The next image was then immediately presented. Participants completed four blocks of 24 trials with self-paced breaks between each block.
Results and Discussion
To investigate the impact of participant race on accuracy in recognizing White and Black target faces, a signal detection measure of discriminability (d′) was used to assess the ability to distinguish between previously seen and new faces. Specifically, z scores related to the proportion of hits (correct identification of old faces) and false alarms (incorrect identification of new faces) for each racial target group were calculated and subtracted such that higher d′ scores indicated better recognition. Hit rates of 0 and 1 were replaced, respectively, with 0.5(n) and 1–0.5(n), where n was 48, the number of signal trials (Stanislaw & Todorov, 1999). Next, a Target Race (White vs. Black) × Participant Race (White vs. Black vs. South Asian) analysis of variance with the first factor within-subjects was performed on the d′ scores. Only the Target Race × Participant Race interaction was significant, F(2, 138) = 10.00, p < .001,

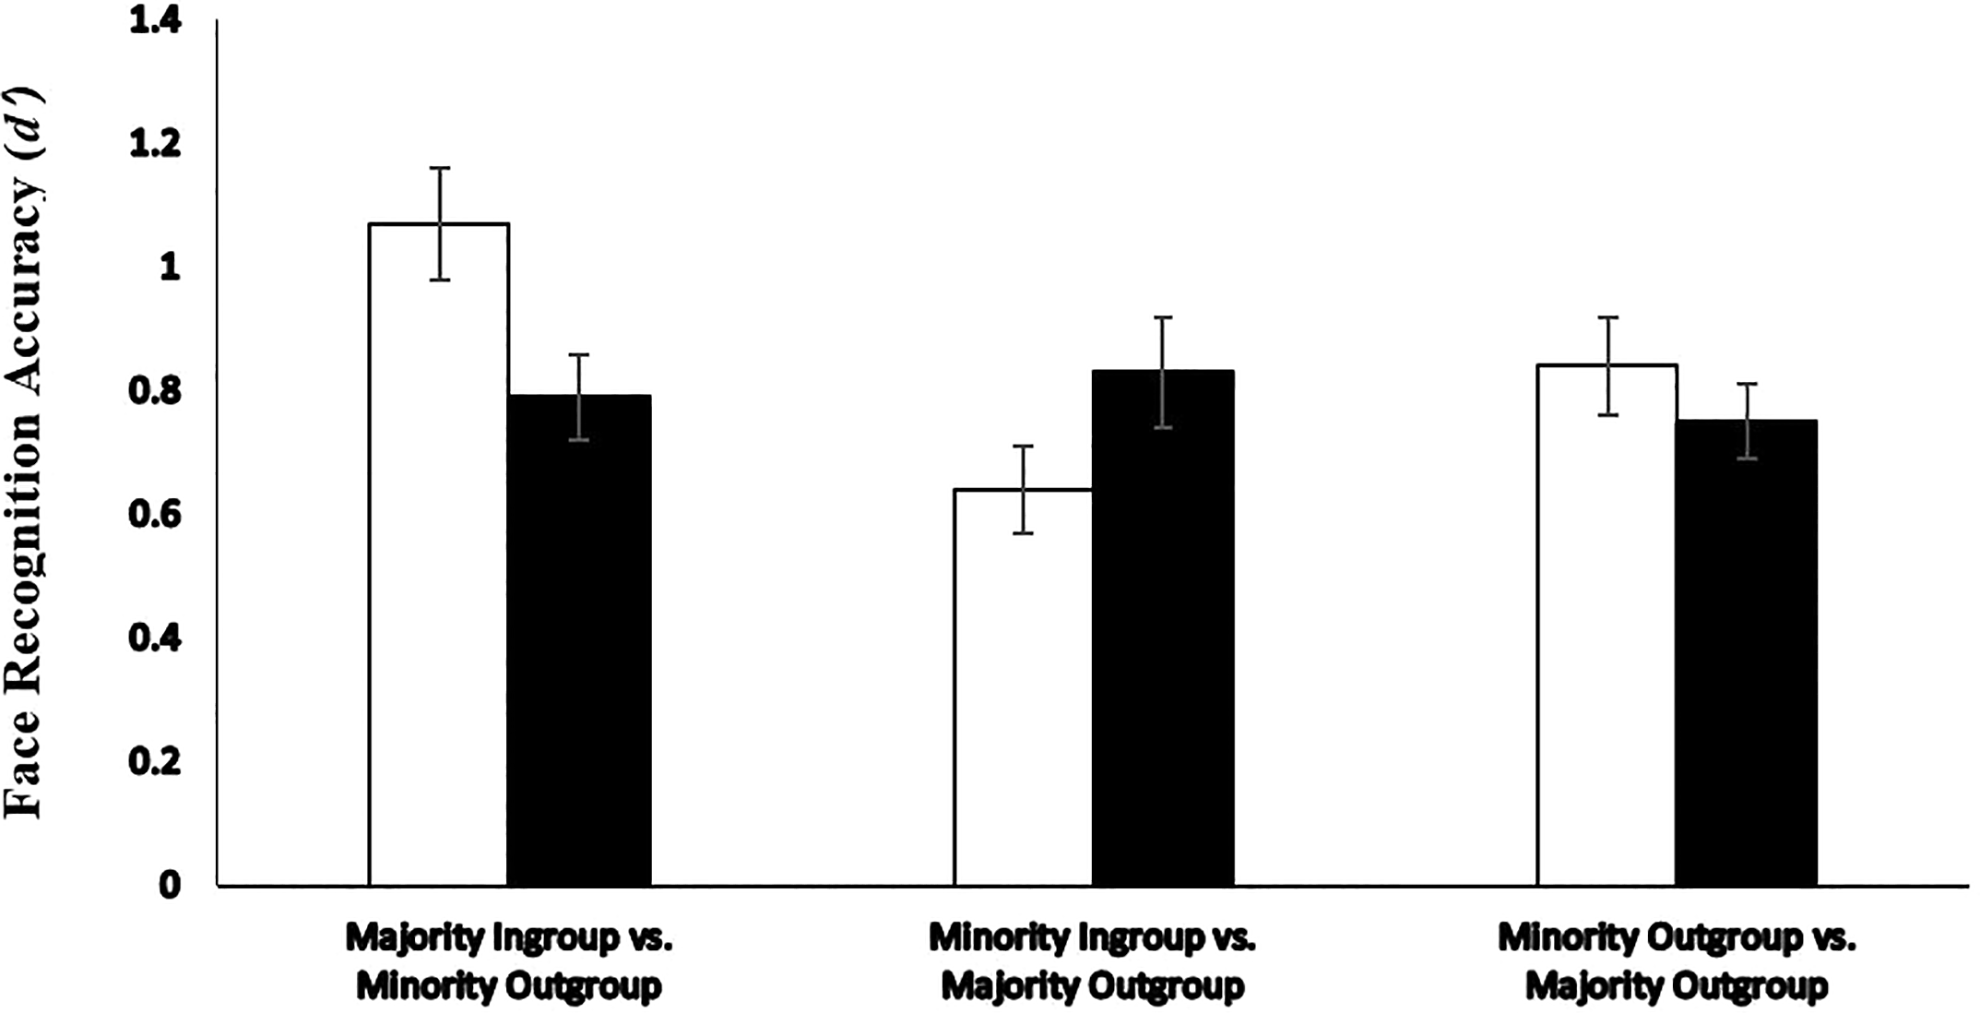
Recognition of White majority and Black minority faces by White, Black, and South Asian participants in Experiment 1.
Simple effects analyses demonstrated that White participants showed better recognition for White (M = 0.969, SD = .736) than Black (M = 0.763, SD = .543) faces, t(53) = 2.40, p = .020, d = .319, 95% confidence interval [CI] [.058, .579]. 2 Black participants, alternatively, showed better recognition for Black (M = 1.030, SD = .688) than White (M = 0.724, SD = .613) faces, t(44) = −3.50, p = .001, d = −.473, 95% CI [−.191, −.754]. Notably, South Asian participants showed no difference in the recognition of White (M = 0.739, SD = .531) and Black (M = 0.660, SD = .495) faces, t(41) = 1.01, p = .321, d = .154, 95% CI [−.147, .455].
The results from Experiment 1 provide further evidence for the ORB with White participants more accurately recognizing White majority ingroup than Black minority outgroup faces and Black participants more accurately recognizing Black minority ingroup than White majority outgroup faces. South Asian participants, who were not presented with their own racial category, did not differ in their recognition of White majority and Black minority outgroup faces, although accuracy means were numerically higher for White majority than Black minority outgroup faces.
Experiment 2
The primary goal of Experiment 2 was to conceptually replicate the results in Experiment 1 using different participant groups and target categories. Specifically, White, East Asian, and Black participants were presented with a face recognition task related to White and East Asian targets. In accordance with the ORB literature, we expected that White participants would show better recognition for White than East Asian targets and that East Asian participants would show better recognition for East Asian than White targets. Based on our initial findings, we also predicted that Black participants would demonstrate no difference in recognition accuracy for White majority and East Asian minority outgroup targets.
Method
Participants and Design
A 2 Target Race (White and East Asian) × 3 Participant Race (White, East Asian, and Black) mixed design was used, with target race as a within-subjects factor. Fifty-seven White (37 female), 59 East Asian (32 female), and 56 Black (35 female) undergraduates participated for course credit.
3
A sensitivity analysis using G*Power found that our final sample could detect effects of f = .14 (
Procedure
The procedure in Experiment 2 was similar to Experiment 1 except that East Asian rather than South Asian participants were recruited. Also, targets in the face presentation task were White and East Asian faces rather than White and Black faces. Specifically, in the initial learning phase, participants were presented with 48 faces—24 White (half female) and 24 East Asian (half female). In the recognition phase, participants were presented with 48 images previously shown in the first phase and 48 new images matched on gender, race, mean luminance, and contrast.
Results and Discussion
To investigate the impact of participant race on recognition of White and East Asian target faces, a measure of discriminability (d′) was calculated. Next, a Target Race (White vs. East Asian) × Participant Race (White vs. East Asian vs. Black) analysis of variance with the first factor within-subjects was performed on the d′ scores. Only the Target Race × Participant Race interaction was significant, F(2, 169) = 7.40, p < .001,
Recognition of White majority and East Asian minority faces by White, East Asian, and Black participants in Experiment 2.
Simple effects analyses demonstrated that White participants showed better recognition for White (M = 1.070, SD = .649) than East Asian (M = 0.789, SD = .517) faces, t(56) = 3.39, p = .001, d = .474, 95% CI [.190, .758]. East Asian participants, alternatively, showed better recognition for East Asian (M = 0.829, SD = .671) than White (M = 0.643, SD = .548) faces, t(58) = −2.04, p = .046, d = −.304, 95% CI [−.598, −.009]. Notably, Black participants showed no difference in recognition for White majority (M = 0.843, SD = .559) and East Asian minority (M = 0.753, SD = .467) outgroup faces, t(55) = 1.06, p = .292, d = .175, 95% CI [−.150, .499].
The results from Experiment 2 conceptually replicated the findings from Experiment 1 using different target and participant groups. Consistent evidence for the ORB was demonstrated, with White participants more accurately recognizing White majority ingroup than East Asian minority outgroup faces and East Asian participants more accurately recognizing East Asian minority ingroup than White majority outgroup faces. Furthermore, Black minority participants demonstrated no difference in the recognition of White majority over East Asian minority outgroup faces, although the means were numerically higher for recognizing White majority outgroup than Black minority outgroup faces.
Experiment 3
The primary goal of Experiment 3 was to conceptually replicate the previous results using different target categories within one study. This procedure allowed us to examine how members of the same minority group respond to the status of varying outgroups. Specifically, East Asian participants were randomly assigned to a condition in which the face recognition task was related to East Asian and White targets, East Asian and Black targets, or White and Black targets. In accordance with the ORB literature, we expected that East Asian participants would show superior recognition for East Asian than White or Black targets. Additionally, we predicted that East Asian participants would show no difference in recognition of White majority and Black minority outgroup targets.
Method
Participants and Design
East Asian participants were randomly assigned to one of three tasks in which the targets in the ORB task were varied. Specifically, 66 (41 female) undergraduates were presented with East Asian and White targets, 63 (38 female) undergraduates were presented with East Asian and Black targets, and 63 (32 female) undergraduates were presented with Black and White targets.
4
A sensitivity analysis using G*Power found that our sample could detect effects of f = .12 (
Procedure
The procedure in Experiment 3 was the same as the face presentation tasks used in the other experiments with the following target categories: East Asian versus White, East Asian versus Black, or Black versus White.
Results and Discussion
To investigate the impact of target identity on recognition, a measure of discriminability (d′) was calculated. A Target Race (Group 1 vs. Group 2) × Comparison (East Asian vs. White, East Asian vs. Black, and White vs. Black) analysis of variance with the first factor within-subjects was performed on the d′ scores. Although the main effect of target race was significant, F(1, 189) = 11.15, p = .001,
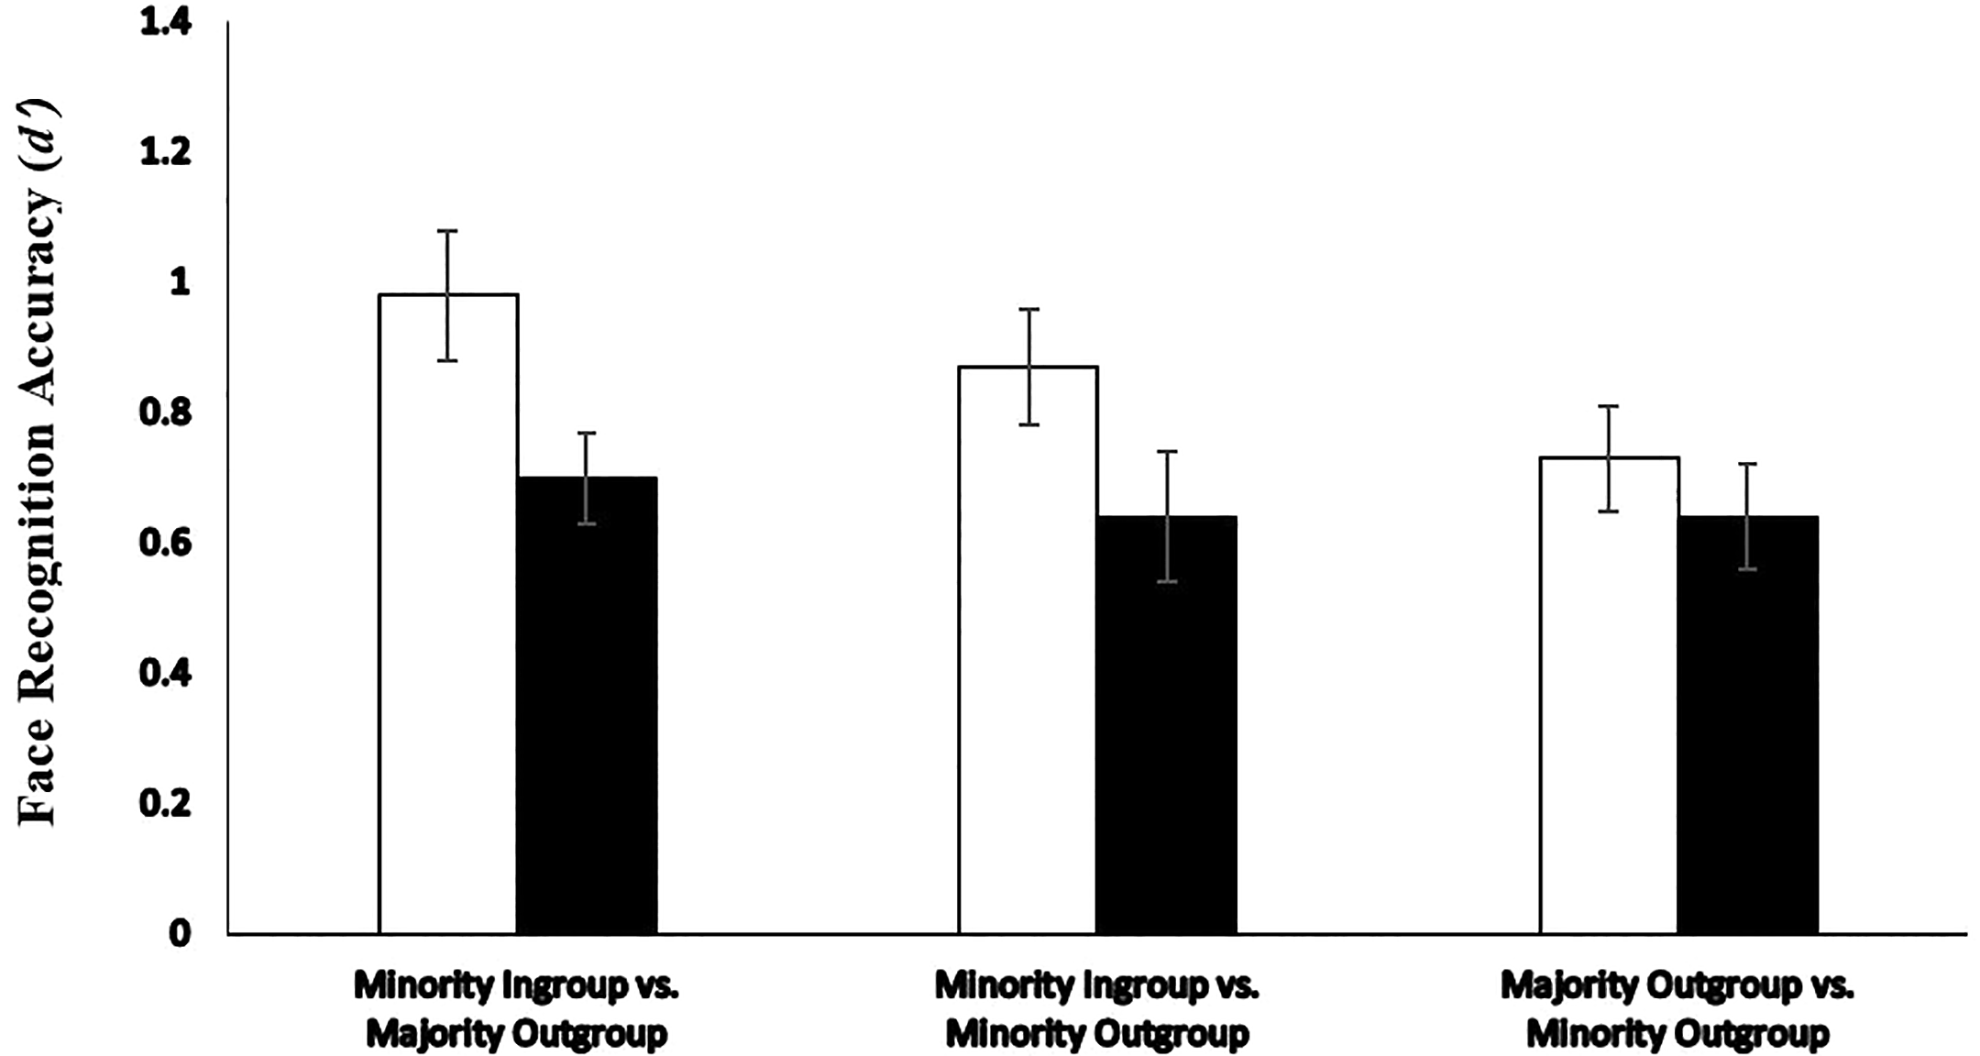
Recognition of White majority, Black minority, and East Asian minority faces by East Asian participants in Experiment 3.
Simple effects analyses demonstrated that East Asian participants showed better recognition for East Asian (M = 0.872, SD = .521) than Black (M = 0.641, SD = .592) faces, t(62) = 3.13, p = .003, d = .414, 95% CI [.146, .682], and better recognition for East Asian (M = 0.982, SD = .583) than White (M = 0.700, SD = .561) faces, t(65) = 3.88, p < .001, d = .493, 95% CI [.230, .755]. East Asian participants demonstrated no difference in recognizing White majority (M = 0.730, SD = .540) and Black minority (M = 0.639 SD = .521) outgroup faces, t(62) = −1.26, p = .211, d = .172, 95% CI [−.096, .439].
The results from Experiment 3 provide further evidence for the ORB, with better recognition for East Asian ingroup members compared to White majority or Black minority outgroup members. Consistent with Experiments 1 and 2, East Asian participants showed no difference in recognition accuracy for majority and minority outgroup faces, although the means were numerically higher for recognition of White majority over Black minority outgroup members.
Internal Meta-Analysis of Recognition Accuracy
Because there was a consistent, but nonsignificant, pattern of results across the three experiments indicating better recognition for majority than minority outgroup faces, as recommended (Maner, 2014; Vazire, 2016), we conducted an internal meta-analysis using standardized differences in means, see Table 1. Notably, the effect sizes, Cohen’s d, related to the ORBs, ranged from .39 to .41. Regardless of the participant group and target group, in all three experiments, participants demonstrated consistently superior recognition of own-race compared to other-race faces.
Fixed Effects Internal Meta-Analysis of Recognition Accuracy of Target Groups Across Experiments.
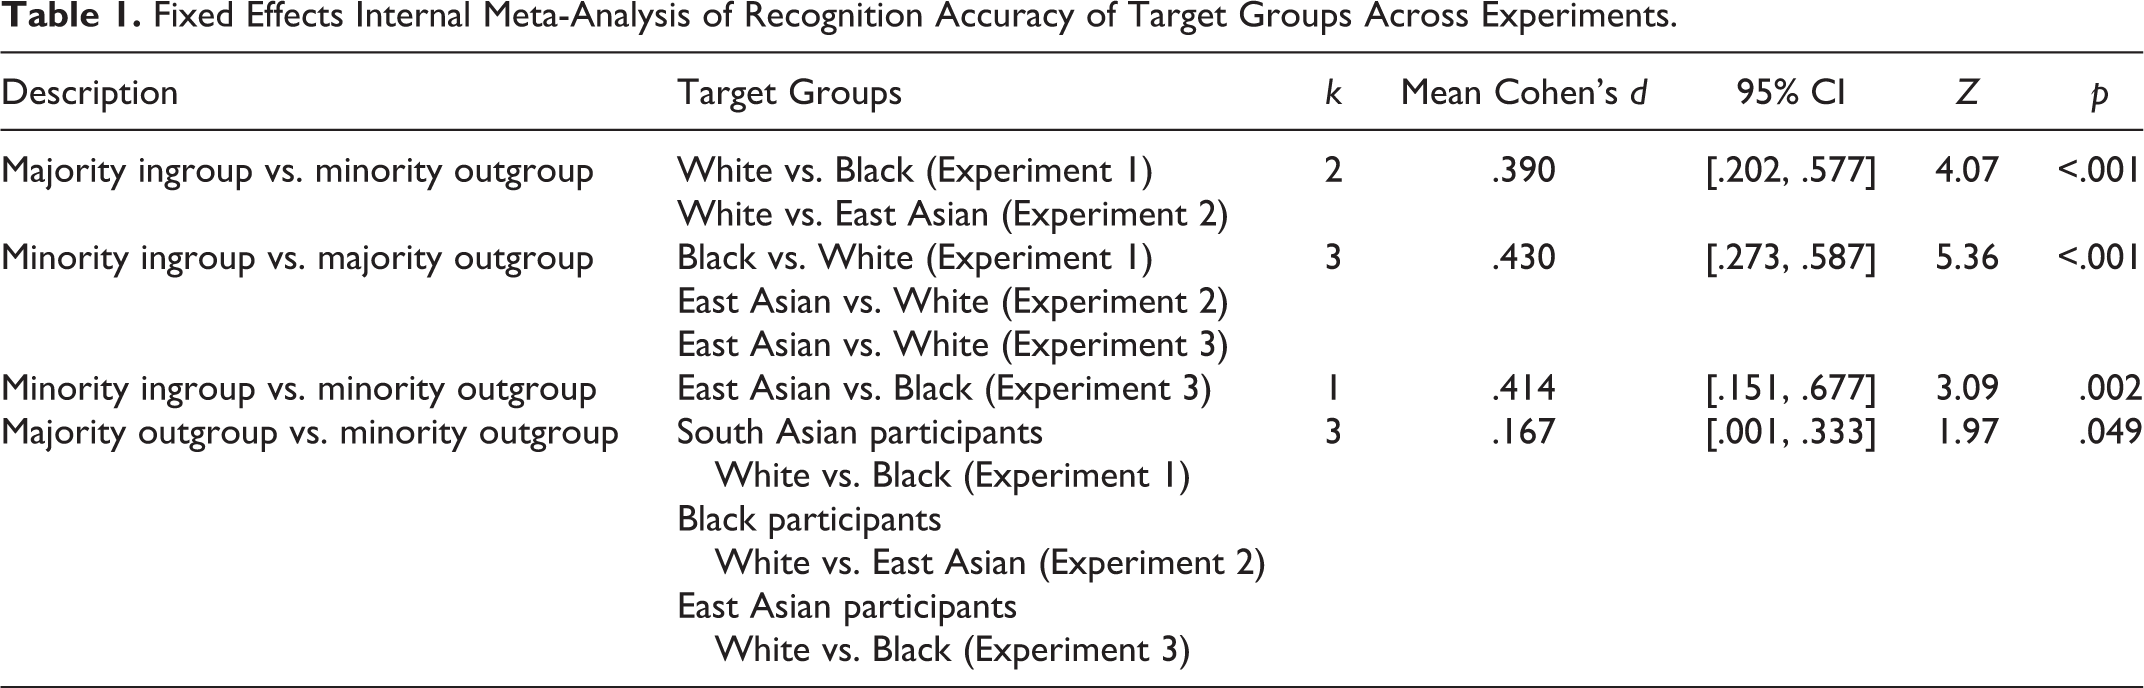
Furthermore, our findings suggest that when comparing recognition accuracy for outgroup faces, minority participants recognized White majority somewhat better than minority outgroup members. Although this effect was nonsignificant in each individual study, the direction of this comparison was consistent across studies and statistically significant when aggregated in the internal meta-analysis. In any case, the combined effect was small in magnitude and notably weaker than the ORB effects, as indicated by a significance test for heterogeneity comparing recognition accuracy for majority versus minority outgroups against the other three ORB effects, Q(1) = 5.89, p = .015.
General Discussion
In accordance with over a half of a century of research (Allport, 1954; Chance & Goldstein, 1996; Meissner & Brigham, 2001), our results provided strong and consistent evidence for the ORB. People are better at recognizing members of their own group compared to other groups, regardless of majority or minority status of these groups. Furthermore, although minority participants in all three experiments were better at recognizing majority compared to minority outgroup members, this difference was substantially smaller. While the effect size related to the ORB is considered a medium effect, Cohen’s d = .40, the effect size of bias toward majority compared to minority outgroups is considered small, Cohen’s d = .15 (Aarts et al., 2014; Cohen, 2004). However, given the potential impact of such biases (Brigham & Malpass, 1985; Sporer, 2001; Wilson, Hugenberg & Bernstein, 2013), even a small effect may have a significant interpersonal, intergroup, and societal impact (Greenwald et al., 2015; Rosenthal, 1990). For example, bias in the misidentification of any minorities that results in incarceration is a process that needs to be understood.
Although the ORB has been consistently measured and replicated, little work has examined how people perceive the faces of different outgroups. We set out to measure whether participants could better recognize minority or majority outgroups. We discussed two possible outcomes: (i) participants would better recognize minority than majority outgroup members or (ii) participants would better recognize majority than minority outgroup members. Our results did not provide strong support for the superior recognition of either outgroup. There was, however, a small but consistent trend toward a better recognition of majority outgroup faces.
Previous ORB theorists have proposed that in comparison to outgroups, members of ingroups through visual experience may have a more refined prototype in face space and be encoded in a more individuated manner (Hugenberg et al., 2010; Levin, 2000; Michel et al., 2006; Valentine, 2001). Although it is beyond the scope of the current research to disentangle how these two factors impact the recognition accuracy of members of different racial outgroups, both experiential and motivational factors may interact in the current context to impact recognition (Hugenberg et al., 2010). In particular, visual experience and motivation to individuate is assumed to be greatest with ingroups regardless of race, followed by decreasing visual experience and motivation with a White majority outgroup and the least visual experience and/or motivation with minority outgroups. Figure 3 is consistent with this pattern. Across the three face perception tasks, recognition was highest for ingroups followed by the majority and then minority outgroups.
Further research is needed to better understand the extent to which minority groups’ recognition of minority and majority outgroup faces changes with visual experience and motivation across the life span. It is conceivable that differences in identification with a host culture and differences in early and/or recent visual experience can influence recognition accuracy. If perceivers are initially raised in another culture in which the ingroup was the minority, it is possible that they may have less experience or motivation to differentially process majority compared to minority outgroup faces. For example, Asian-born schoolchildren who had been adopted into White European families before the age of 2 years recognized White and Asian faces equally well (De Heering et al., 2010). Additionally, Korean adults who had been adopted into White European families as children showed a reversal of the ORB and better recognized White than Asian faces (Sangrigoli et al., 2005).
Although these findings suggest that visual experience with majority outgroups may be necessary to shift recognition of outgroup faces (Sangriogoli et al., 2005; Tham et al., 2019; Wright et al., 2003), further research is necessary to test the extent to which early, recent, and ongoing visual experience, in addition to motivation to process these faces, influences the recognition of outgroup faces. For example, studies could explore the recognition of outgroup faces among minority children and adults at various points after immigration. Visual experience could be further manipulated in the lab with training studies. Likewise, motivations to individuate certain outgroups could be measured or manipulated (Kawakami et al., 2014; Pauker et al., 2009; Shriver et al., 2008). For example, further research using a minimal group paradigm, in which previous experience is not a factor and such important social dimensions as outcome dependency, power, and status can be manipulated, would be informative (Bernstein et al., 2007).
In this research, we focused on recognition accuracy by minority participants for members of majority compared to minority outgroups. We recommend that future research investigates recognition accuracy for two minority target outgroups by majority and/or minority perceivers. For example, it is possible that White participants and/or East Asian participants could show biases in recognition accuracy of South Asian and Black targets because certain minority groups may be relatively more prevalent in an environment, hold higher status, or be more relevant to certain perceiver groups.
In conclusion, although further research is clearly necessary to better understand the relationship between motivational and experiential factors and characteristics of the target and participant group, this research extends the ORB literature beyond comparisons of recognition accuracy of members of ingroups versus outgroups. By investigating the largely ignored “other-groups bias” effect and how underrepresented populations recognize majority compared to minority outgroups, these experiments provide initial evidence that participants show a small though consistent bias toward majority outgroups. Given the implications of understanding such biases, this is an important first step.
Footnotes
Declaration of Conflicting Interests
The author(s) declared no potential conflicts of interest with respect to the research, authorship, and/or publication of this article.
Funding
The author(s) disclosed receipt of the following financial support for the research, authorship, and/or publication of this article: This research was supported by a Social Sciences and Humanities Research Council of Canada (435-2018-0907) grant to Kerry Kawakami and a National Sciences and Engineering Research Council of Canada Postdoctoral Fellowship to Larissa Vingilis-Jaremko