
Abstract
We compare the relative contribution of grit and intelligence to educational and job-market success in a representative sample of the American population. We find that, in terms of ΔR 2, intelligence contributes 48–90 times more than grit to educational success and 13 times more to job-market success. Conscientiousness also contributes to success more than grit but only twice as much. We show that the reason our results differ from those of previous studies which showed that grit has a stronger effect on success is that these previous studies used nonrepresentative samples that were range restricted on intelligence. Our findings suggest that although grit has some effect on success, it is negligible compared to intelligence and perhaps also to other traditional predictors of success.
Advocates of grit, defined as “perseverance and passion for long-term goals,” argue that it is the most important predictor of educational and economic success, even comparable in importance to intelligence, which is considered the best individual difference predictor of success (Jensen, 1998; Schmidt & Hunter, 2004).
Grit research can be traced back to a 2005 article in Psychological Science (Duckworth and Seligman: “Self-discipline outdoes IQ in predicting academic performance of adolescents”) and a 2007 article in the Journal of Personality and Social Psychology (Duckworth, Peterson, Matthews, and Kelly; “Grit: Perseverance and passion for long-term goals”). These two papers, and others that followed, created the impression that to understand and promote educational and economic success, we should focus more on noncognitive individual differences, particularly grit (Duckworth & Yeager, 2015; Tough, 2012), rather than cognitive individual differences, particularly intelligence (Herrnstein & Murray, 1994; Nisbett, 2009).
Indeed, since the publication of Duckworth et al.’s (2007) article, the interest in the grit concept has soared. Data obtained from Google Scholar show that there were 76 papers published that contained the word “grit” in 2008, the year following Duckworth et al.’s publication and 1,650 papers in 2018. As Figure 1 shows, the interest in grit as an individual difference construct grew much faster than the interest in other constructs related to success. Interestingly enough, the interest in intelligence has not changed much since 2011. The interest in the grit concept, and the perception that it is the key to educational and economic success, penetrated the popular media as well. For example, in a popular educational website, Hanford (2012) wrote, “when it comes to high achievement, grit may be as essential as intelligence”; and in her popular TED talk, with more than 17 million views, Duckworth (2013) argued that grit is “as good or even a better predictor of success than cognitive ability.”Concepts similar to grit, and in particular conscientiousness, have already been suggested as predictors of academic as well as job-market success (e.g., Barrick & Mount, 1991; Porapat, 2009). Nevertheless, Duckworth et al. (2007) distinguished grit from conscientiousness by stating, for example, that “Grit is distinct from dependability aspects of conscientiousness, including self-control, in its specification of consistent goals and interests” (p. 1089), promoting it as the ultimate noncognitive predictor of success, the only noncognitive predictor comparable in importance to intelligence (Duckworth, 2017).
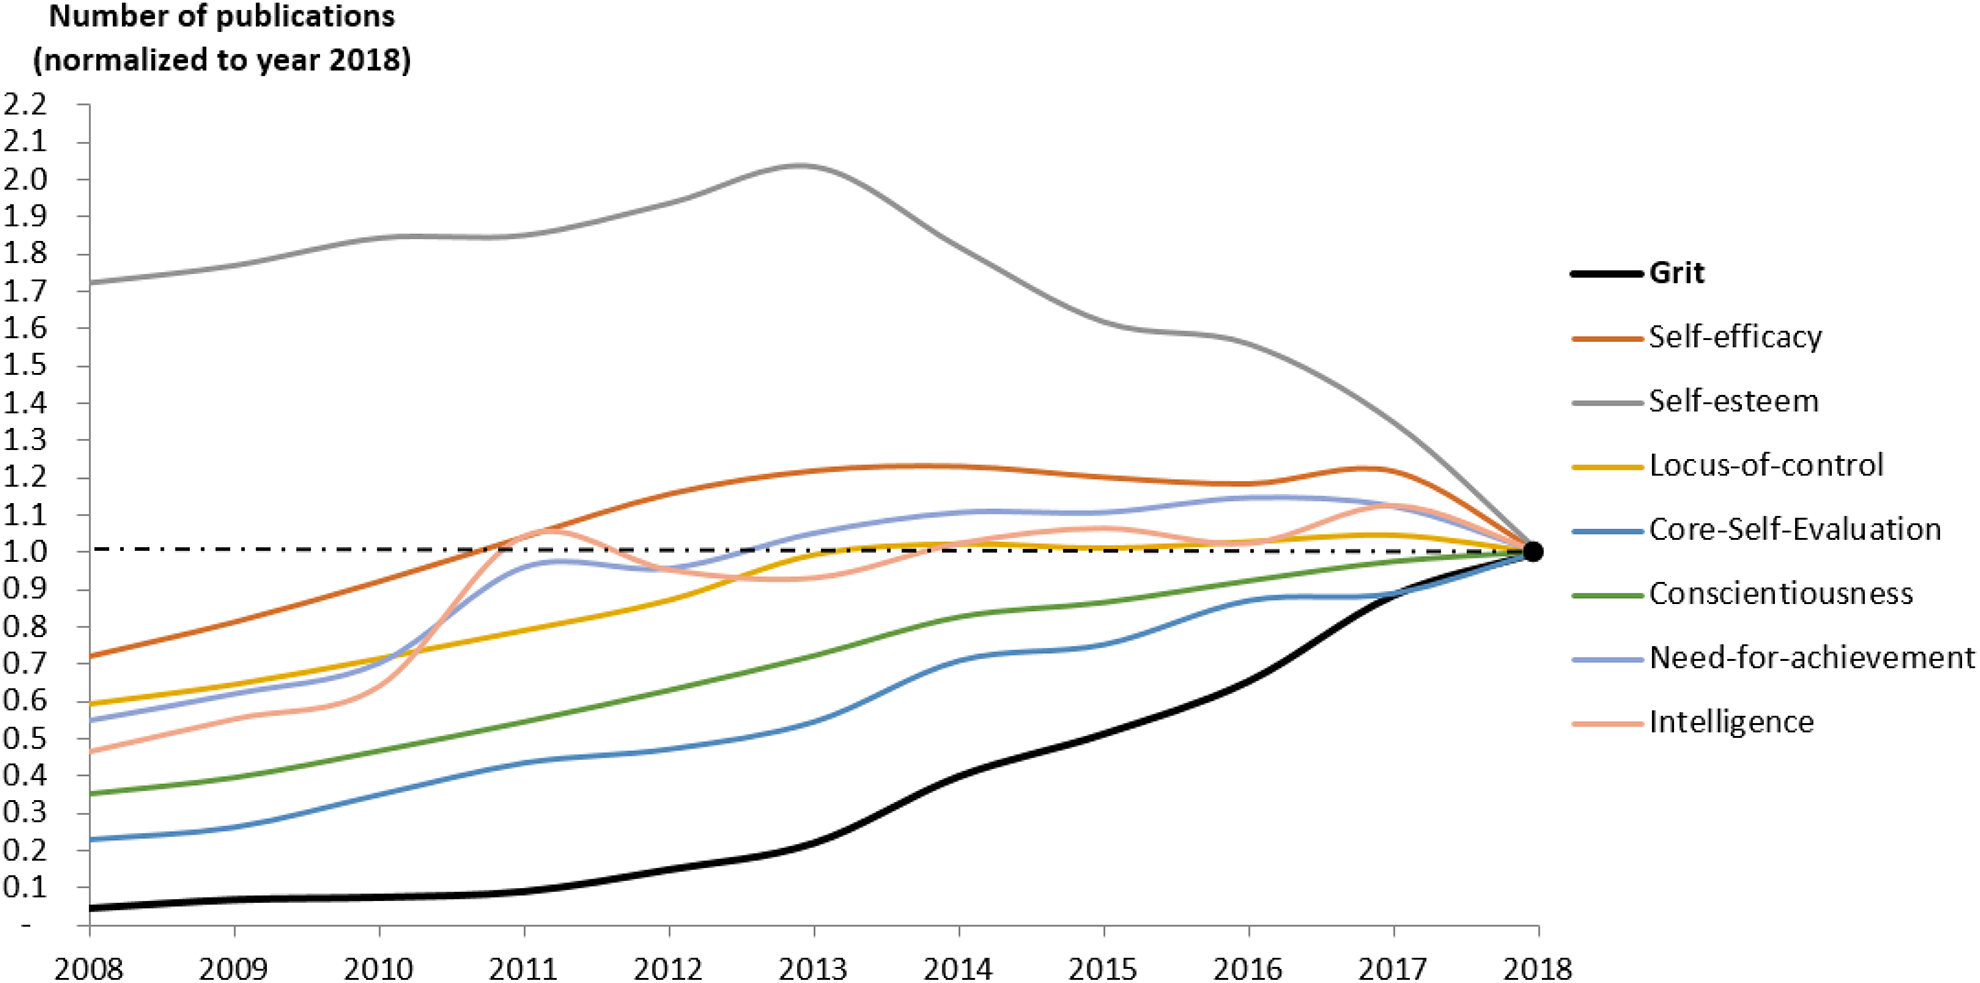
Publications’ trends of grit as compared to other major individual differences. Note. The graph indicates the number of academic publications in which the individual difference construct appeared in each of the study years divided by the number of these publications in 2018. For example, the number of academic publications that referred to the construct grit in the year 2018 was 1,650 compared to 76 in 2008; therefore, the normalized values for the year 2018 are 1 (=1,650/1,650) compared to 0.05 (=76/1,650) for 2008. For intelligence, the concept we used was “general mental ability” rather than “intelligence” because the word intelligence appears in publications that are unrelated to our topic (e.g., business intelligence, artificial intelligence).
Recently, however, some doubts about the importance of grit have appeared. In particular, in their meta-analysis, “Much ado about grit” (2017), Credé, Tynan, and Harms (2017) found that grit is only moderately correlated with academic performance (ρ = .17 between grit and high school grade point average [GPA]) and argued that other well-known predictors of academic success, and in particular intelligence and conscientiousness, are more effective predictors than grit. These findings are consistent with previous studies which emphasized the dominant role of conscientiousness and intelligence, especially intelligence, in predicting academic or job-market success. For example, Ivcevic and Brackett (2014) found a correlation of .30 between conscientiousness and high school GPA and an insignificant effect for grit; Sackett et al. (2012) reported ρ = .50 between intelligence and academic performance; Judge et al. (1999) reported a correlation of .41 and .53 in predicting job-market success, for conscientiousness and intelligence, respectively.
However, Credé et al.’s (2017) meta-analysis did not directly compare the effect of grit to the effect of intelligence and conscientiousness using the same data. Furthermore, so far the grit literature has focused primarily on the effect of grit on educational success, leaving questions regarding the effect of grit on job-market success largely unanswered. There have been a number of papers that did examine the effect of grit on job-market success (e.g., Danner et al., 2019), but these studies were based on small samples and neglected to compare the effect of grit to the effect of intelligence. In the current article, we address these two issues.
Finally, a major concern about the studies which argued that grit has a strong impact on success is that they were based on selected samples such as West Point cadets (Duckworth et al., 2007), employees in technology companies (Jachimowicz et al., 2018) or students in inner city schools (Eskreis-Winkler et al., 2014). These samples were drawn from institutions which are characterized by a homogeneous socioeconomic population (and perhaps even by population that are homogenous in their intelligence)—a characteristic which is likely to impose a range restriction on important predictors of success. In particular, since there is a strong relationship between socioeconomic background (SEB) and intelligence (Strenze, 2007), it is likely that in these samples, the effect of grit was found to be stronger than the effect of intelligence since the variance of intelligence in these samples was restricted. We see the lack of representativeness of the samples of previous studies as a key issue which jeopardizes the conclusions and generalizability derived from their results.
The current study makes three major contributions to the grit literature. First, we examine grit’s predictive validity of educational success using a representative sample of the general population. Second, we directly compare the effect of intelligence and grit using the same data set. Finally, we simultaneously test the effect of grit on educational and job-market success.
Method
Data
The data were extracted from the 1997 cohort of the National Longitudinal Study of Youth (NLSY97), a large-scale, nationally representative longitudinal project sponsored by the Bureau of Labor Statistics of the U.S. Department of Labor that follows the lives of a sample of 8,984 American youth born during 1980–1984; respondents were aged 12–17 when first interviewed in 1997. This ongoing cohort has been surveyed 17 times to date and is now interviewed biennially, with the overall retention rate for Round 17 being 79%. The measure of intelligence was taken from the 1999 wave, the measure of grit was taken from the 2013 wave, and the measures of success from the 2015 wave. Thus, intelligence was measured when the participants were aged 15–19, grit was measured when the participants were aged 29–34, and success was measured when they were aged 31–36.
The NLSY97 includes a supplemental sample of 2,236 respondents designed to oversample Hispanic or Latino and Black people living in the United States. To keep the representativeness of the sample intact, we did not include these subjects in the analyses. Our representative sample included 6,748 participants, of which 51% were male. The ethnic distribution was 69% White, 16% Black, 14% Hispanic, and 1% mixed. We used a list-wise deletion which resulted in 2,162–2,694 participants, depending on the success criteria. The average age was about 33, and the sex distribution was about even.
Measures
Grit
The Short Grit Scale (Duckworth & Quinn, 2009) was used as a measure of grit and was administered to most of the NLSY participants in 2013 (6,476 of the original sample of 8,984 in 1997). It consists of 8 items in total, 4 items for each grit facet—perseverance and consistency of interest. Sample items are “I am diligent” (perseverance) and “new ideas and projects sometimes distract me from previous ones” (consistency of interest). Answers are given on a scale from 1 (very much like me) to 5 (not like me at all). Grit scores were standardized to Z-scores, following a similar approach taken by the original studies (e.g., Duckworth et al., 2007) and then averaged across all items. The reliability of the scale in our data was .72, which is comparable to the reliability reported by Duckworth and Quinn (2009) and within the ranges reported in the meta-analysis of Credé et al. (2017).
Intelligence
The measure of intelligence was derived from participants’ test scores in the Armed Forces Qualifying Test (AFQT), the standard measure of intelligence used by the U.S. army. The test was taken in 1999; 7,098 participants completed the test. The AFQT score in the NLSY is the sum of the standardized scores of four tests: arithmetic reasoning, paragraph comprehension, word knowledge, and mathematics knowledge, and is expressed as a percentile score out of the general population. The AFQT was used previously by many studies as a valid measurement for intelligence (Ganzach & Pazy, 2014; J. Heckman & Carneriro, 2003; J. J. Heckman et al., 2006).
Personality
The Ten-Item Personality Inventory (TIPI) is a 10-item measure of the Big Five (or five-factor model) dimensions of personality: openness, conscientiousness, extroversion, agreeableness, and emotional stability (Gosling et al., 2003). Data were available in the survey year of 2008.
Control variables
Sex was coded as 0 for males and 1 for females.
Socioeconomic Background (SEB)
SEB is considered to be a powerful predictor of academic success (see, e.g., Sirin’s, 2005, meta-analysis). Since the NLSY does not include a direct measure socioeconomic status, our measure of SEB was composed of the income of the household in which the participant was raised and the average education of the parents with equal weight to these two components. Both household income and parents’ education were measured in, 1997, the first year of the survey.
Age was not added to the regression since all participants were born in 1980–1984 and were aged 31–35 in 2015 when educational/job-market success was measured (Indeed, additional analyses that we don’t report showed that it had nonsignificant effects).
Success
We used two educational success measures (degree attainment and high school GPA) and one job-market success measure (pay).
Degree attainment
The highest degree achieved till 2015. Data were available for 7,076 participants. Scale: 0 = none (9% out of total); 1 = general education diploma (13%); 2 = high school diploma (41%); 3 = associate/junior college (8%); 4 = bachelor’s degree (20%); 5 = master’s degree (7%); 6 = PhD (1%); 7 = professional degree, for example, MD (1%).
High school GPA score
This variable indicates high school grade point averages across all courses on a 4-point grading scale. Data were available for 6,232 participants. 1
Job-market success
Following much of the applied psychology literature (see, e.g., Ganzach & Pazy 2014; Seibert et al., 1999), we used pay as a measure of job-market success. Specifically, we used the log of the 2015 hourly rate of pay, calculated by the NLSY staff from information provided by the subjects.
Analyses
In general, we relied on the approach taken by Duckworth and her colleagues in previous studies of the predictive validity of grit. On the independent variable side, we compared the predictive validity of grit to the predictive validity of intelligence and the Big Five personality factors, particularly conscientiousness. On the dependent variable side, we used the main measures of educational success—high school GPA and degree attainment, adding job-market success (pay) as an additional dependent variable.
Results
Preliminary Analysis
Descriptive statistics and correlations are presented in Table 1. Consistent with previous findings (e.g., Strenze, 2007), we found a positive correlation between SEB and intelligence (r = .45, p < .01). The correlation between grit and intelligence was not significant (r = −.002, ns), as compared with Duckworth et al. (2007) who found a negative correlation (r = −.20, n = 139, p < .03).
Descriptive Statistics and Intercorrelations.
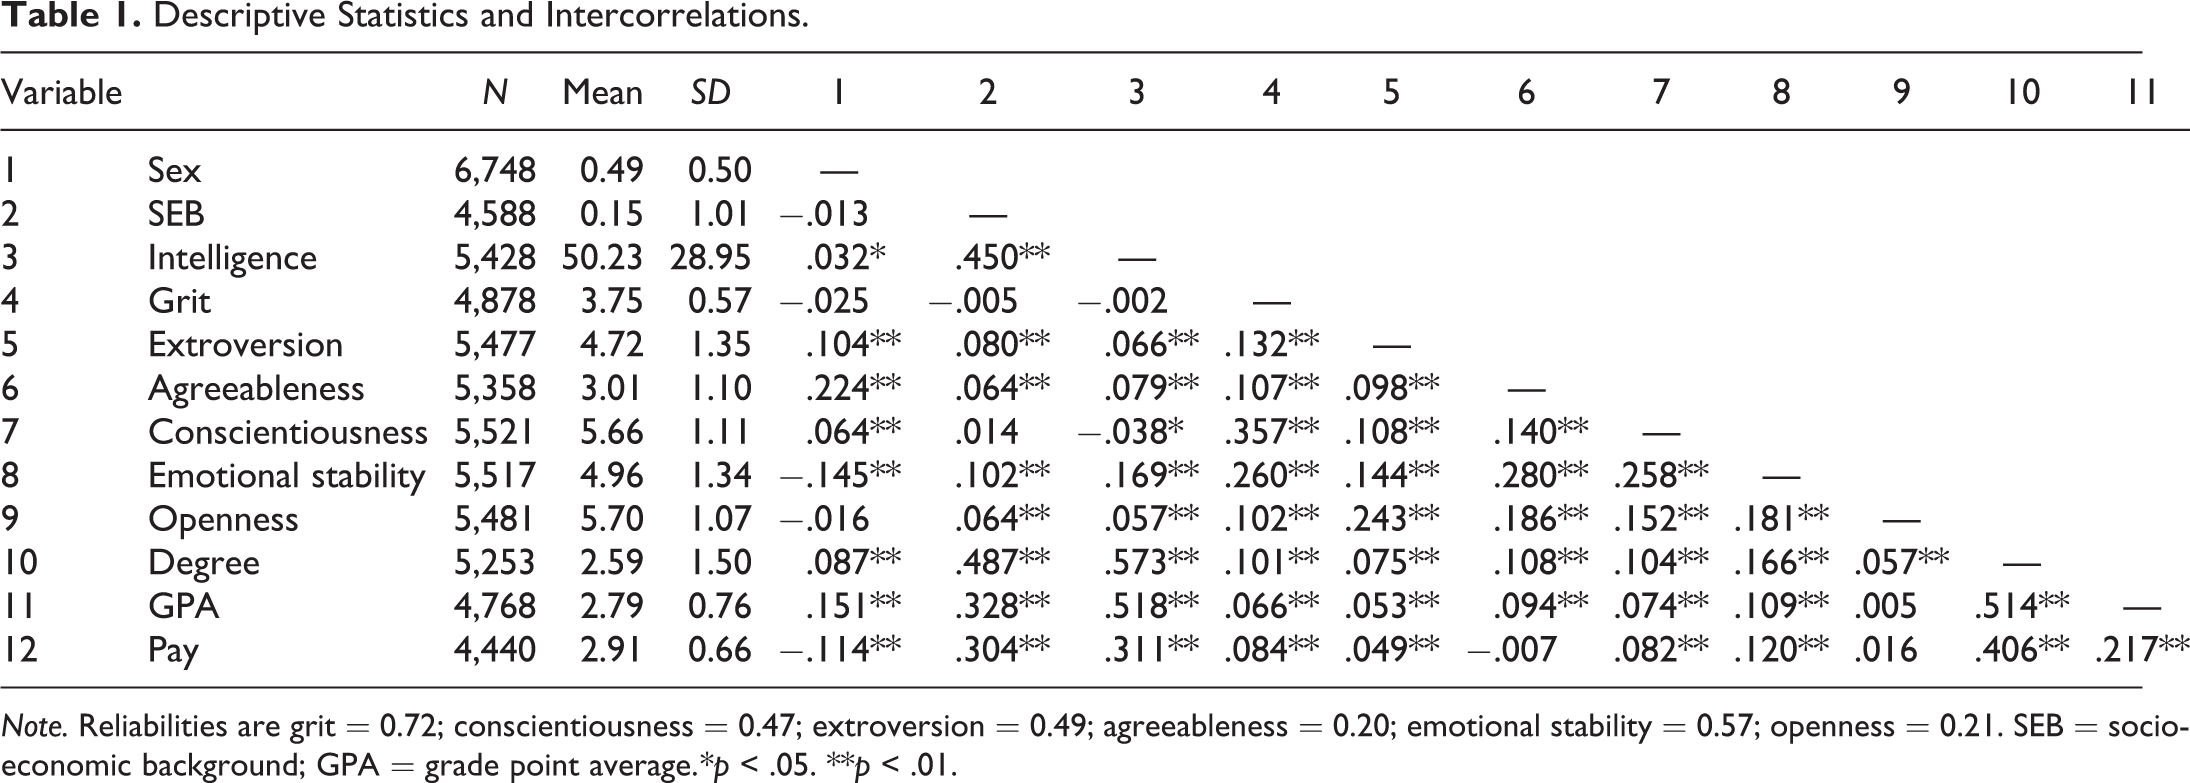
Note. Reliabilities are grit = 0.72; conscientiousness = 0.47; extroversion = 0.49; agreeableness = 0.20; emotional stability = 0.57; openness = 0.21. SEB = socioeconomic background; GPA = grade point average.*p < .05. **p < .01.
The zero-order correlation between grit and the three success criteria was .101, .066, and .084 for degree attainment, high school GPA, and pay, respectively. The correlations between intelligence and success were substantially higher at .573, .518, and .311 for degree attainment, high school GPA, and pay, respectively. Correction for reliability has only a small effect on these correlations (assuming reliability of .95 for the criteria, the correlations are .122, .079, and .101, respectively, for grit and .622, .563, and .338, for intelligence). But on the other hand, the overall pattern of these correlations is likely to overestimate the “true” effect of grit relative to intelligence because of the temporal proximity between the measurement of our success criteria and grit as opposed to the temporal distance between the measurement of intelligence and these criteria. When grit was measured in their early 30s, our participants already knew what their academic achievements were and were largely aware of their economic success. Thus, their report about grit may to a large extent represent retrospective reflection about their success. On the other hand, intelligence was measured when our participants were in their teens. Furthermore, we note that even a simultaneous measurement of intelligence and success is less likely to be associated with a reverse causation process than a simultaneous measurement of grit, since grit, but not intelligence, is susceptible to reflection about success.
Table 2 presents the results of regression analyses of our measures of success—degree attainment, high school GPA, and pay. For each measure, we estimated two models. Model 1 directly compares grit to intelligence. It includes only grit and intelligence as focal predictors, allowing grit to have a maximal explanatory power by being the only personality characteristic in the model. Model 2 also includes the Big Five, allowing a comparison between grit and conscientiousness as well. Both models include socioeconomic status and sex as control variables.
Regression Analysis Predicting Educational and Job-Market Success.
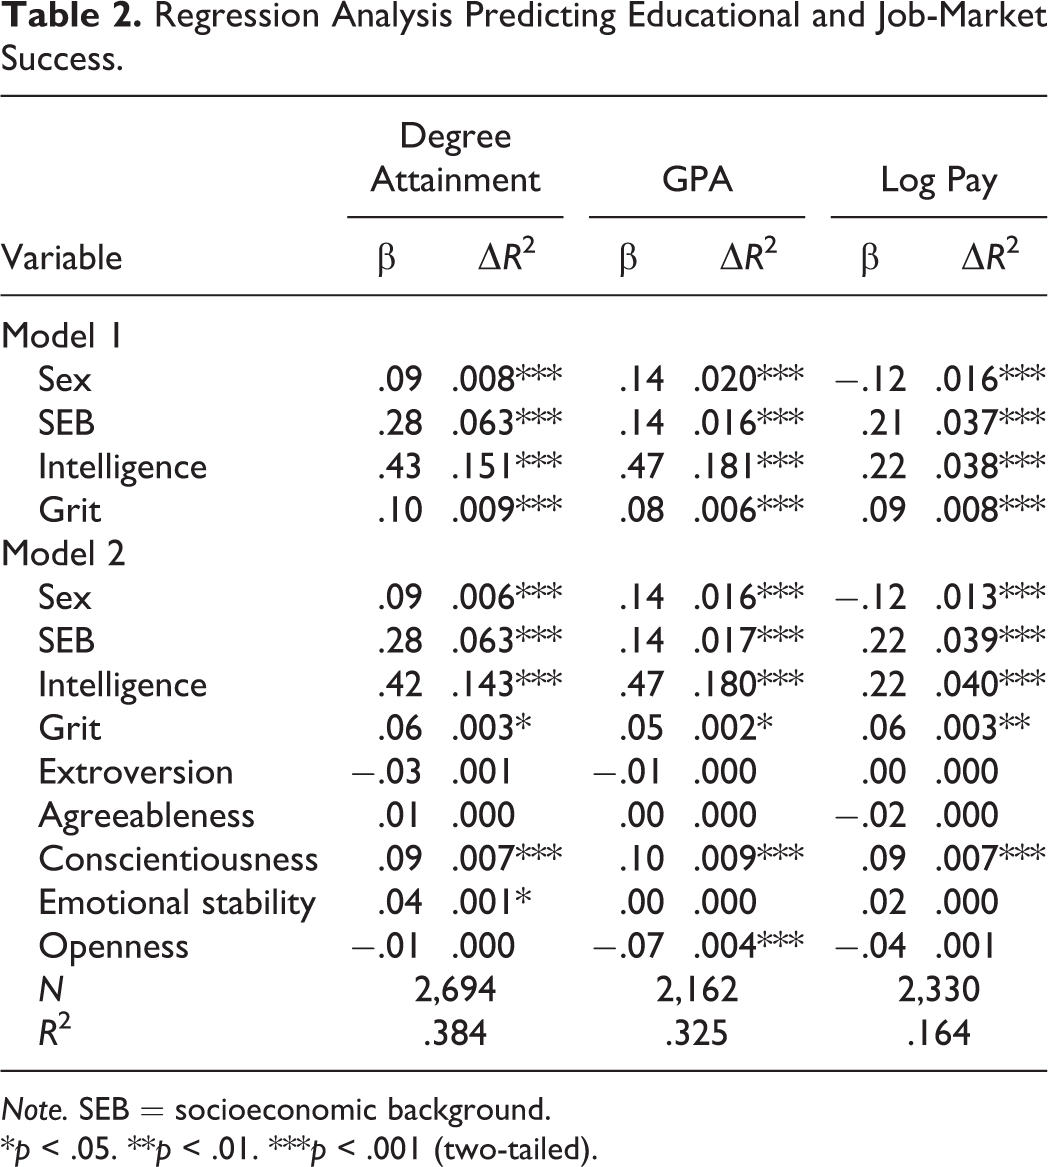
Note. SEB = socioeconomic background.
*p < .05. **p < .01. ***p < .001 (two-tailed).
The regressions that directly compare grit to intelligence show that although grit remained a significant predictor of success after controlling for the other predictors, its effect was far lower than the effect of intelligence. For educational success, the unique variance explained by intelligence was 16–30 times higher than the unique variance explained by grit (for degree attainment: ΔR 2 was .009 and .151 for grit and intelligence, respectively; for high school GPA: ΔR 2 was .006 and .181 for grit and intelligence, respectively). For pay, it was about 5 times as high (ΔR 2 was .008 and .038 for grit and intelligence, respectively).
This comparison between the effect of grit and intelligence underestimates the gap between the predictive validity of the two because grit is likely to capture some of the variance accounted for by other noncognitive individual differences. Thus, adding the Big Five to Model 2 had little effect on the ΔR 2 of intelligence, but a considerable effect on the ΔR 2 of grit, reducing it by approximately 65%. In this model, the unique variance of success explained by intelligence was 13–90 times higher than the unique variance explained by grit (for degree attainment: ΔR 2 was .003 and .143 for grit and intelligence, respectively; for high school GPA: ΔR 2 was .002 and .180 for grit and intelligence, respectively). For pay, it was about 13 times as high (ΔR 2 was .003 and .040 for grit and intelligence, respectively).
In addition, the effect of conscientiousness in Model 2 was more than double the effect of grit. For degree attainment: ΔR 2 was .003 and .007 for grit and conscientiousness, respectively; for high school GPA: ΔR 2 was .002 and .009 for grit and conscientiousness, respectively; and for pay: ΔR 2 was .003 and .007 for grit and conscientiousness, respectively. Given the NLSY 2-item measure of conscientiousness and the 8-item measure of grit, this comparison is likely to overestimate the effect of grit relative to conscientiousness (Crede et al., 2012 for the consequences of using short measures of the Big Five personality traits). In her studies, Duckworth et al. (2007) does not compare the strength of the effect of grit to that of conscientiousness. Indeed, unlike the robust strong effect of conscientiousness on indicators of success (see Porapat, 2009, and Richardson et al., 2012, for meta-analyses), to the best of our knowledge, the only study that found a relatively strong effect of grit on success was Strayhorn (2014). Other studies, primarily PhD dissertations (Chang, 2014; Cross, 2013; Davidson, 2014; Hogan, 2013; Sheehan, 2014), found very weak, if any, effect. These studies were not published, which may indicate a publication bias.
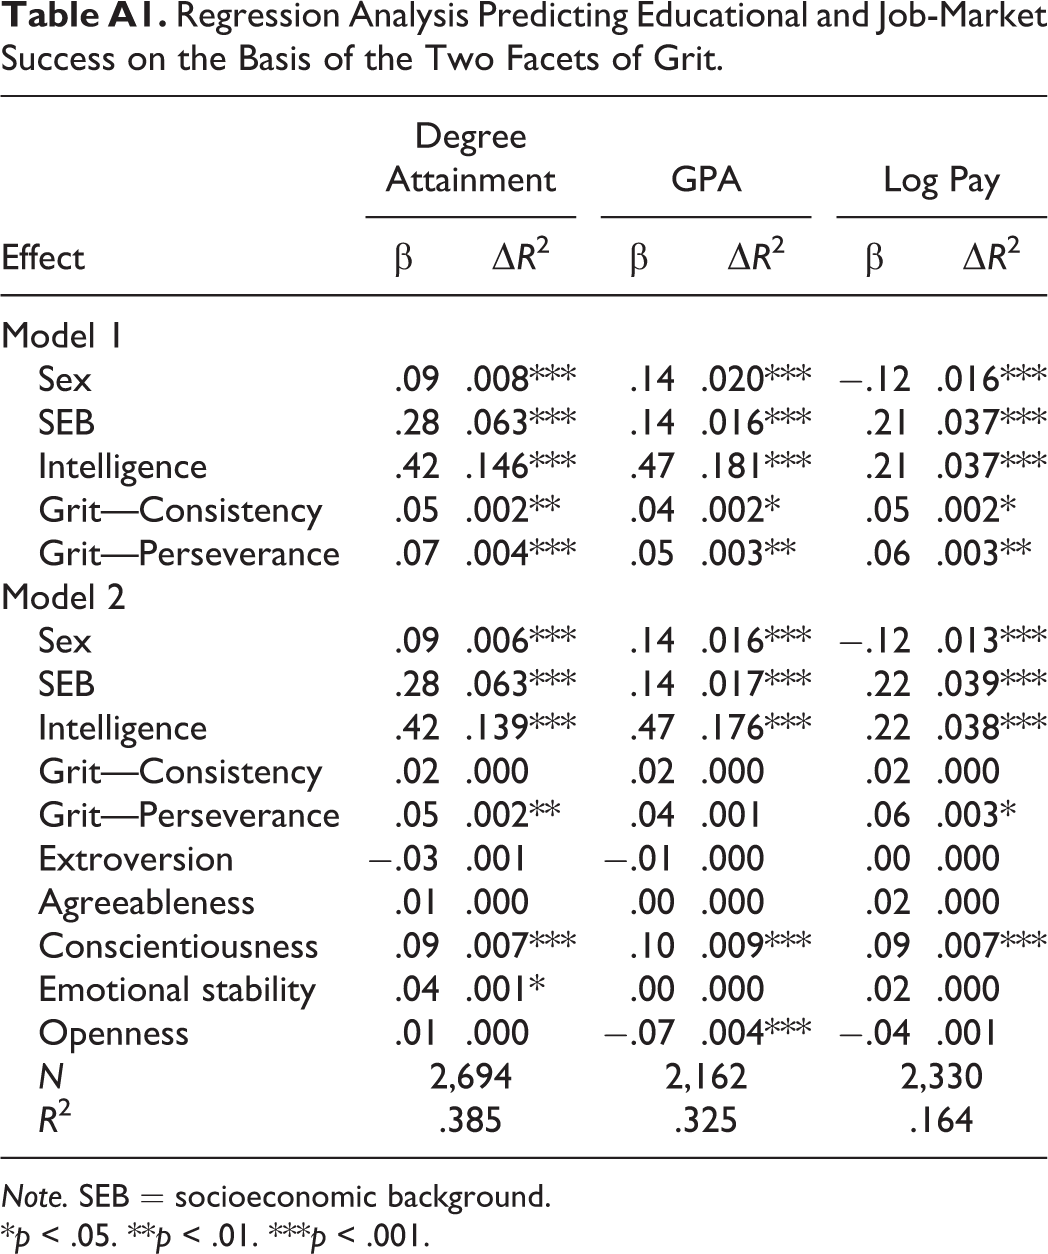
Finally, since previous research showed that grit is better conceptualized in terms of its two components, perseverance and consistency of interest (Credé et al., 2017), we also estimated our models replacing grit with its two components. The results of these analyses indicated that both the overall effects of grit and its relative effects in comparison to intelligence (as well as conscientiousness) did not change much. Also, consistent with Crede et al. (2017), the results showed that most, if not all, of the effects of grit on our indicators of success were associated with perseverance, whereas the effects of consistency were practically zero. These results are reported in the Appendix of this article. 2
The Effect of Range Restriction
To examine the effect of range restriction on the predictive validities of grit and intelligence, we divided the sample into quartiles of SEB. We then calculated, for each of the four quartiles, the correlations of our three measures of success with grit and intelligence as well as the means and standard deviations of grit and intelligence in each of the quartiles. These statistics are presented in Columns 1–4 for quartiles 1–4, respectively. Column 5 presents the average of the four quartiles, and Column 6 presents these statistics for the entire sample.
Consistent with our range restriction argument, dividing the sample into SEB quartiles resulted in considerable decrease in the variance of intelligence (the average variance of intelligence in the quartiles was 25.208, whereas the variance in the entire sample was 28.210, representing an 11% decrease) but had no effect on the variance of grit (the average variance in the quartiles was 0.568, whereas the variance in the entire sample was 0.568 as well). 3
It is clear from Table 3 that for grit, the correlations within the quartiles tend to be higher than the correlation within the entire sample (for degree attainment, the average correlation within the quartiles was .106, while the correlation of the entire sample was .101; for high school GPA, these correlations were .080 and .066, respectively; for pay, they were .087 and .084, respectively). On the other hand, for intelligence, the correlations within the quartiles are clearly lower (for degree attainment, the average correlation within the quartiles was .427, while the correlation within the entire sample was .573; for high school GPA, these correlations were .454 and .518, respectively; for pay, they were .208 and .311, respectively).
The Effect of Range Restriction by SEB on the Correlations of Grit and Intelligence With Success.
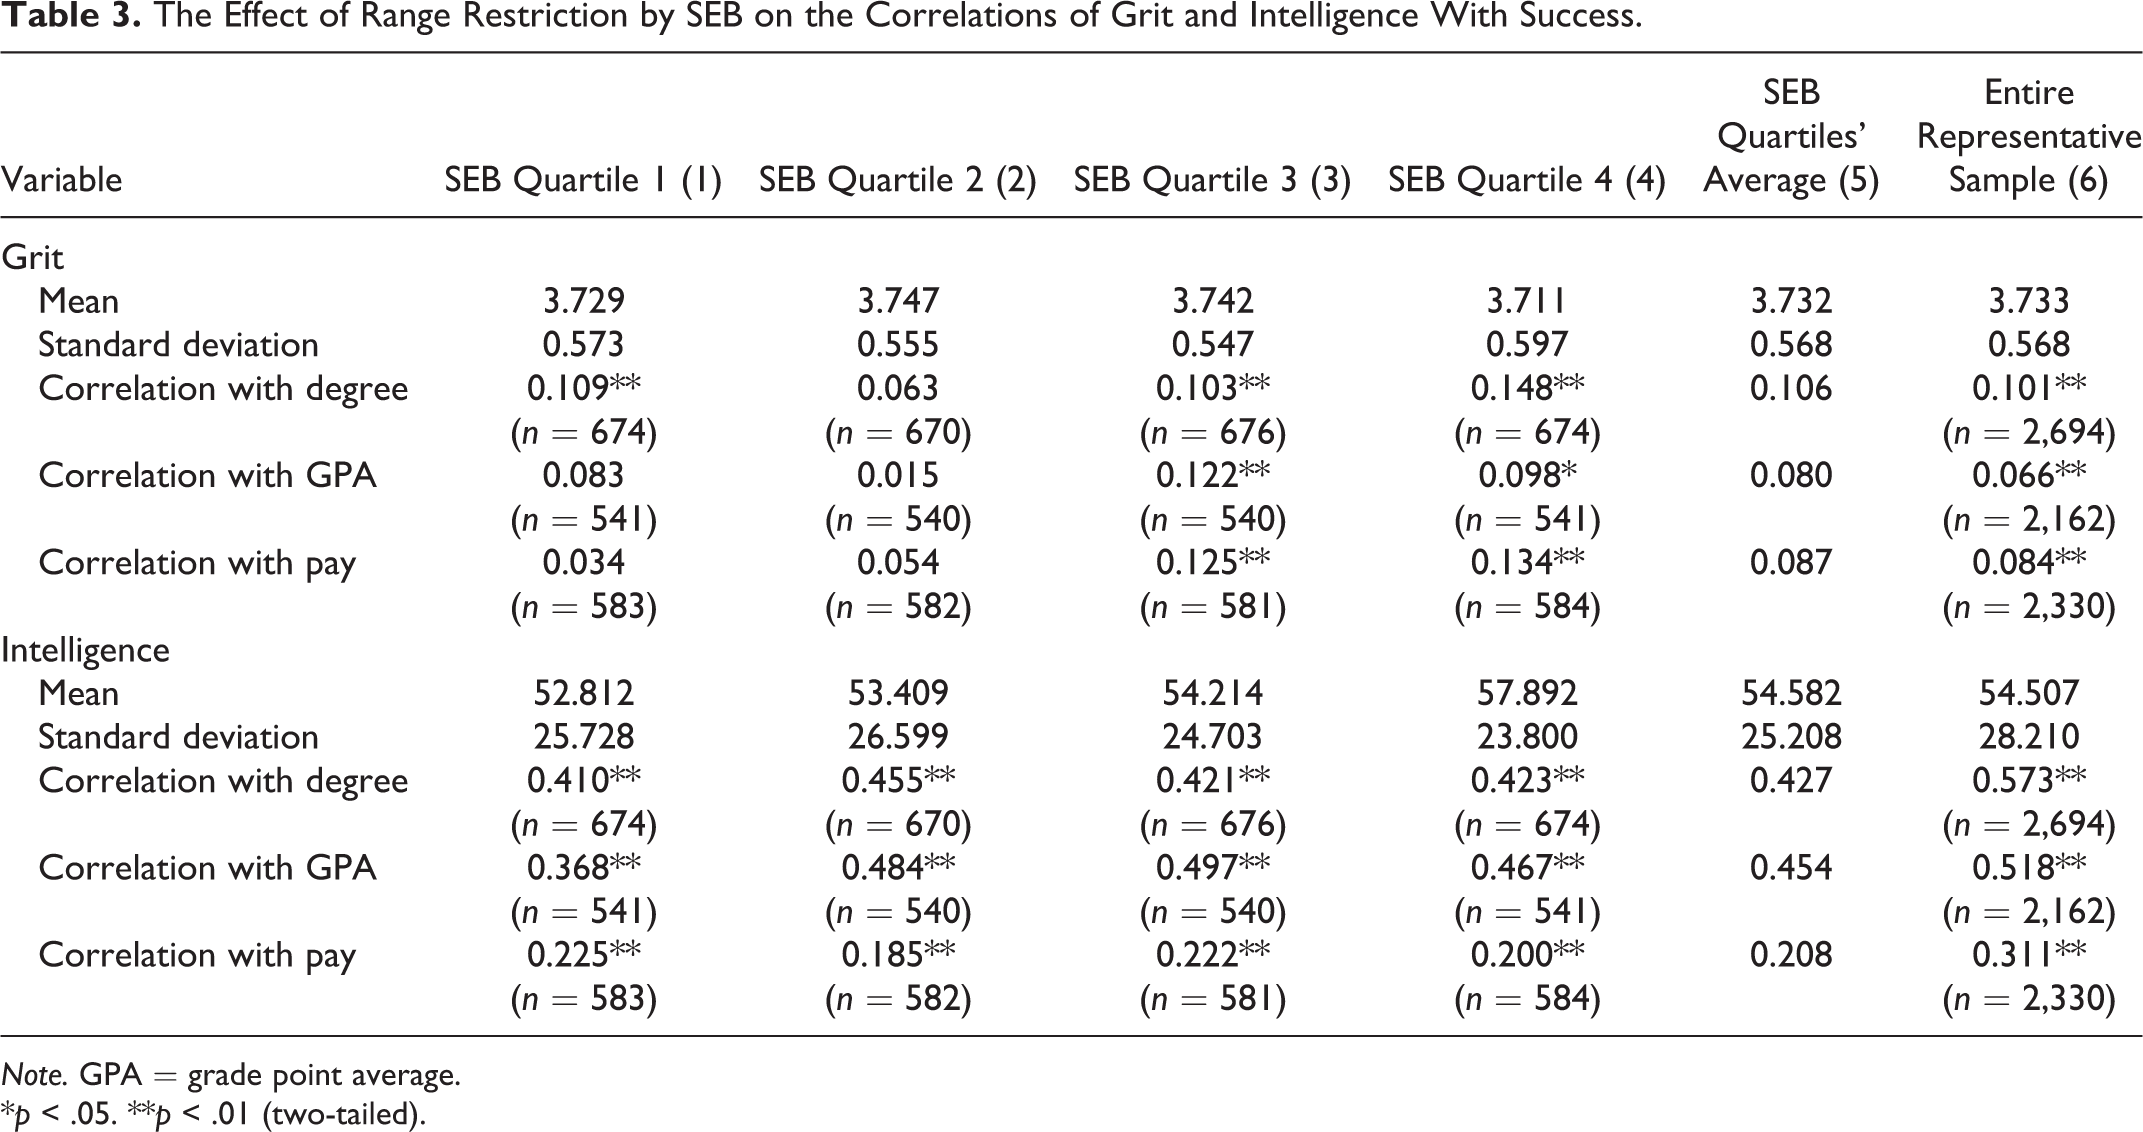
Note. GPA = grade point average.
*p < .05. **p < .01 (two-tailed).
Although SEB is more likely to represent most of the samples that were analyzed in studies of grit, at least some of the samples in these studies were also restricted by intelligence directly (e.g., the sample in Duckworth et al., 2007, which consisted of Ivy League university students who are selected, to a large extent, based on their SAT scores, which, as mentioned above, are good proxies for intelligence). Therefore, in order to further investigate the effect of range restriction on the relative predictive validity of grit and intelligence, we estimated the correlations of these predictors with our success outcomes when samples were restricted by intelligence. Columns 1–4 of Table 4 present the correlations of grit and intelligence with the three success outcomes for each quartile of intelligence, Column 5 presents the averages of the quartiles and Column 6 the correlations of the entire sample. As expected, when samples are restricted by intelligence, the differences between grit and intelligence are even more dramatic than when they are restricted by SEB. For intelligence, the averages of the quartiles’ correlations are considerably lower than the correlations of the entire sample (.209 vs. .573, .178 vs. .518, .085 vs. .311 for degree attainment, high school GPA, and pay, respectively), for grit, the averages are even higher than the correlations of the entire sample (.118 vs. .101, .102 vs. .066, .093 vs. .084, respectively).
The Effect of Range Restriction by Intelligence on the Correlations of Grit and Intelligence With Success.
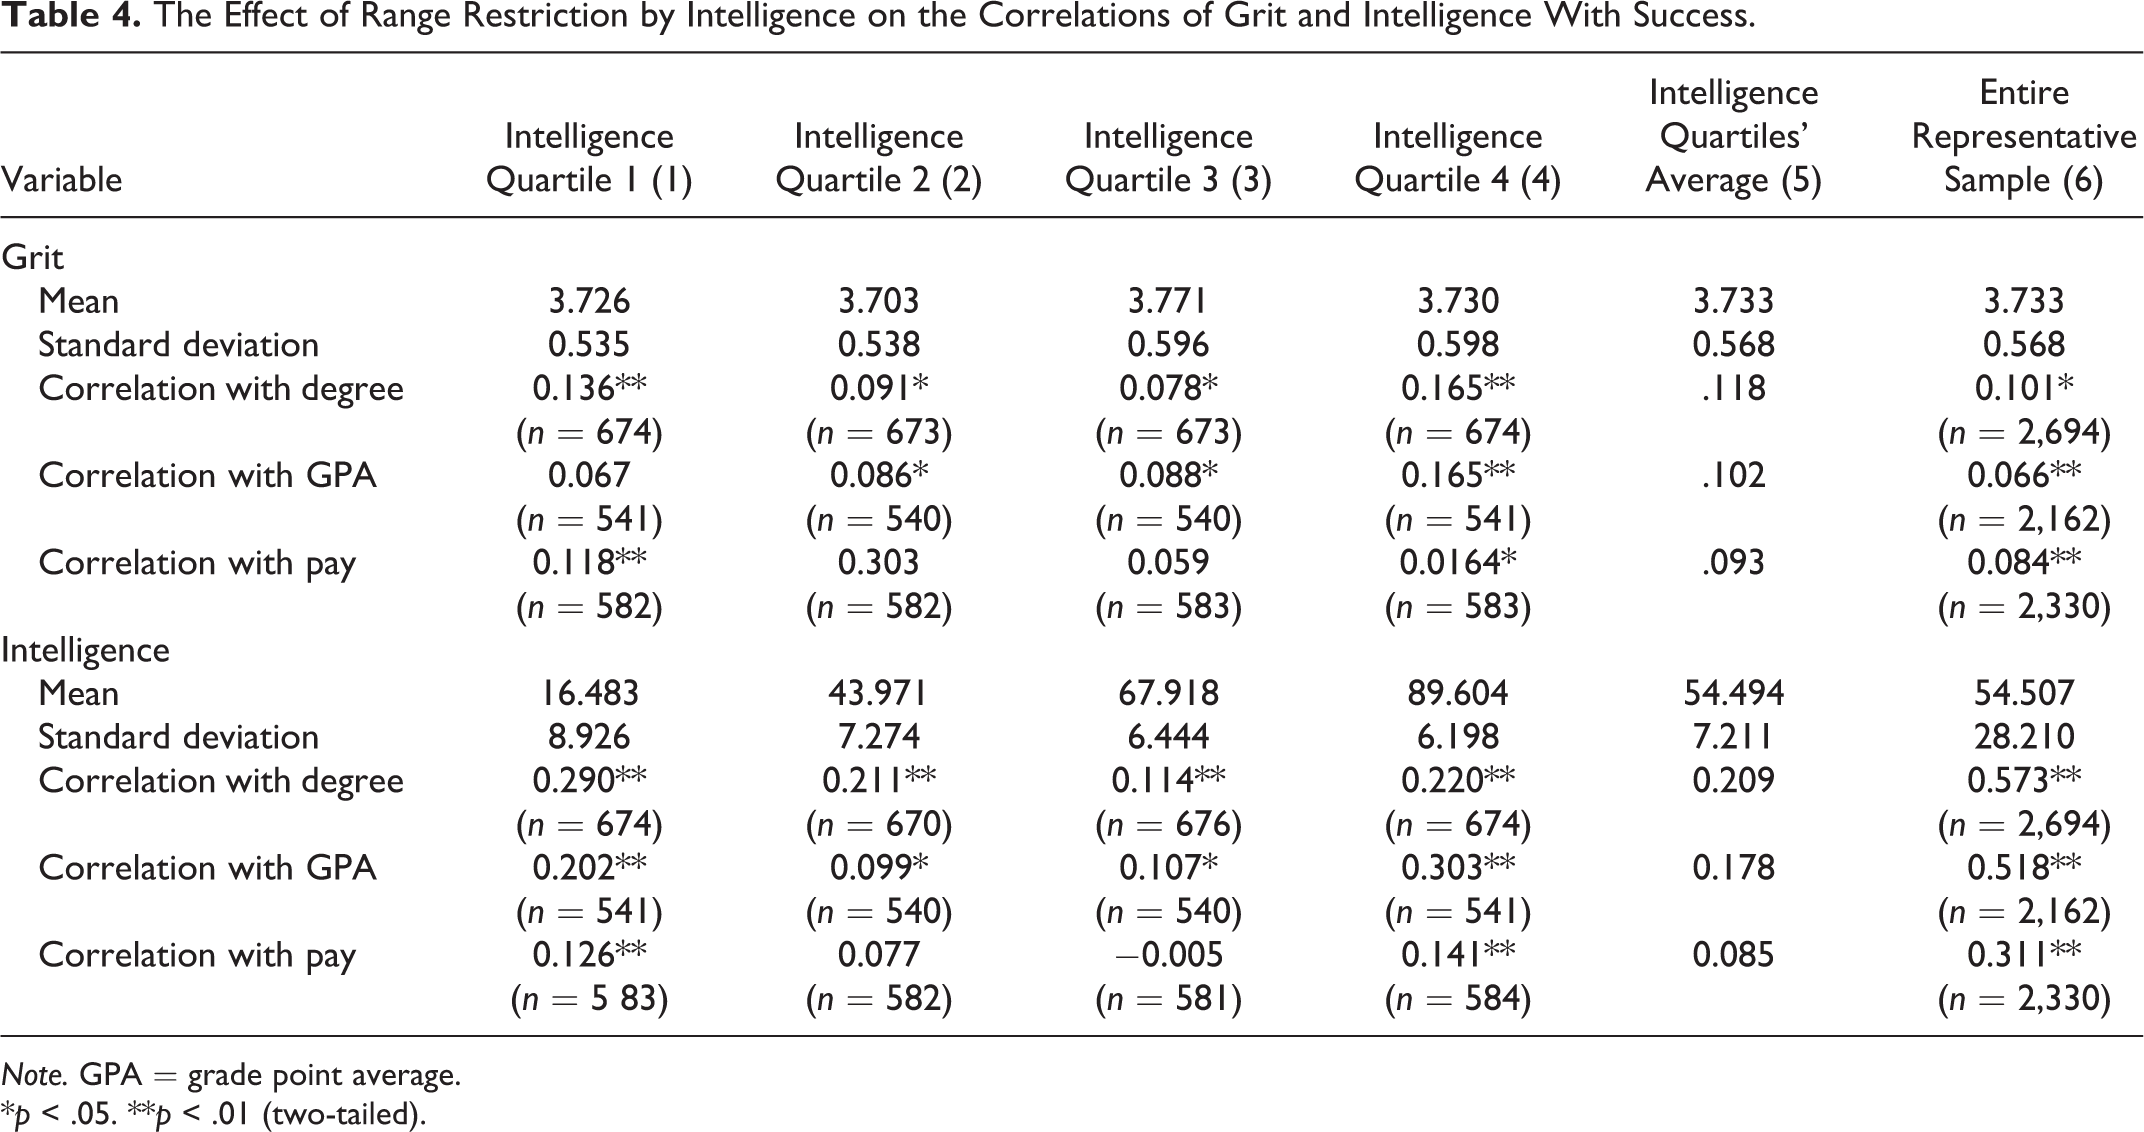
Note. GPA = grade point average.
*p < .05. **p < .01 (two-tailed).
Discussion
Although in our representative sample of the American population grit does explain educational and job-market success over and beyond other predictor variables such as socioeconomic status, intelligence, and the Big Five personality characteristics, its absolute effects are rather minimal. In particular, its effects are negligible in comparison to the effect of intelligence. Finally, the effects of grit were also considerably weaker than the effects of conscientiousness.
We suggest that the weak effect of grit found in the current study in comparison to previous studies is predominately due to the fact that our sample is a representative sample rather than a selected sample of the type used in previous studies. Many of the former grit studies used samples that were homogenous on SEB or intelligence and as a result were range restricted. For example, Eskreis-Winkler et al. (2014) tested the grit of pupils attending a public school in the inner city of Chicago which is characterized by a low socioeconomic status; Kelly et al. (2014) tested grit as a predictor of performance among cadets attending the prestigious West Point military academy, with its high admission criteria; and Jachimowicz et al. (2018) tested the grit of employees working at a technology company. As our study suggests, when these range restrictions are removed, the effect of grit diminishes substantially.
Our results also show that while range restriction had a considerable negative impact on the validity of intelligence as a predictor of success, it did not have a negative impact on the validity of grit. In fact, the validity of grit even increased slightly, suggesting that in samples that are homogenous on the important predictors of success (SEB in this case), the validity of grit may increase. This is consistent with the notion that this effect is due to decreased “noise” (i.e., variability unrelated to grit). When range restriction is determined by intelligence, these results are even stronger (see Table 4).
In our data, there is a nonsignificant correlation between grit and intelligence. This result is different from previous results, which found small to medium negative correlations. For example, in her original study from 2007, Duckworth found a correlation of r = −.20 when testing the effect of grit on high school GPA among Ivy League students. A negative correlation between predictors that are otherwise uncorrelated or even positively correlated is a familiar phenomenon in selected samples (Dawes, 1975; Moutafi et al., 2005), and in the case of Duckworth et al. (2007), it is due to students relatively low on intelligence compensating for this shortcoming with higher grit. By omitting this restriction in our nonselective sample, the correlation between intelligence and grit disappears.
The current study also allowed a comparison of grit and intelligence with regard to the relative predictive ability of educational versus job-market success. This comparison revealed that whereas the predictive validities of grit with regard to educational and job-market outcomes were rather similar (ΔR 2 of .003, .002, .003 for degree attainment, high school GPA, and pay, respectively), the predictive validity of intelligence was clearly higher for educational outcomes than for the job-market outcome of pay (ΔR 2 of .143 and .180 for degree attainment and high school GPA, respectively, as opposed to ΔR 2 of .040 for pay). This finding is consistent with the idea that noncognitive characteristics are more important in job-market success than in scholastic success (see also Borghans et al., 2008; Borghans et al., 2016).
Finally, despite the fact that our results suggest that grit has a negligible effect in predicting success in representative samples, this negligible effect does not necessarily imply that grit is always unusable. As our results indicate, the effect of grit in homogenous samples tends to be higher than its effect in representative samples. Indeed, grit may be a useful predictor of success in selected samples, which often characterizes applicant pools. Grit may be a useful predictor if one is interested in choosing a research assistant among Ivy League undergraduates because all these applicants are highly intelligent, or it may be a useful predictor in identifying the winners of a spelling bee contest because the competitors in such a contest are all highly conscientious. 4 In other cases, however, it is not clear whether samples, even homogenous samples, are restricted in such a way that makes grit a useful predictor. For researchers who are interested in the grit concept, future research could focus on identifying the conditions that make grit useful.
Supplemental Material
gritSppsR1supplementary@ - In a Representative Sample Grit Has a Negligible Effect on Educational and Economic Success Compared to Intelligence
gritSppsR1supplementary@ for In a Representative Sample Grit Has a Negligible Effect on Educational and Economic Success Compared to Intelligence by Chen Zisman and Yoav Ganzach in Social Psychological and Personality Science
Footnotes
Appendix
Regression Analysis Predicting Educational and Job-Market Success on the Basis of the Two Facets of Grit.
| Degree Attainment | GPA | Log Pay | ||||
|---|---|---|---|---|---|---|
| Effect | β | ΔR 2 | β | ΔR 2 | β | ΔR 2 |
| Model 1 | ||||||
| Sex | .09 | .008*** | .14 | .020*** | −.12 | .016*** |
| SEB | .28 | .063*** | .14 | .016*** | .21 | .037*** |
| Intelligence | .42 | .146*** | .47 | .181*** | .21 | .037*** |
| Grit—Consistency | .05 | .002** | .04 | .002* | .05 | .002* |
| Grit—Perseverance | .07 | .004*** | .05 | .003** | .06 | .003** |
| Model 2 | ||||||
| Sex | .09 | .006*** | .14 | .016*** | −.12 | .013*** |
| SEB | .28 | .063*** | .14 | .017*** | .22 | .039*** |
| Intelligence | .42 | .139*** | .47 | .176*** | .22 | .038*** |
| Grit—Consistency | .02 | .000 | .02 | .000 | .02 | .000 |
| Grit—Perseverance | .05 | .002** | .04 | .001 | .06 | .003* |
| Extroversion | −.03 | .001 | −.01 | .000 | .00 | .000 |
| Agreeableness | .01 | .000 | .00 | .000 | .02 | .000 |
| Conscientiousness | .09 | .007*** | .10 | .009*** | .09 | .007*** |
| Emotional stability | .04 | .001* | .00 | .000 | .02 | .000 |
| Openness | .01 | .000 | −.07 | .004*** | −.04 | .001 |
| N | 2,694 | 2,162 | 2,330 | |||
| R 2 | .385 | .325 | .164 | |||
Note. SEB = socioeconomic background.
*p < .05. **p < .01. ***p < .001.
Declaration of Conflicting Interests
The author(s) declared no potential conflicts of interest with respect to the research, authorship, and/or publication of this article.
Funding
The author(s) disclosed receipt of the following financial support for the research, authorship, and/or publication of this article: Saltiel chair, Coller Institute, and Henry Crown Institute.
Supplemental Material
The supplemental material is available in the online version of the article.
Notes
References
Supplementary Material
Please find the following supplemental material available below.
For Open Access articles published under a Creative Commons License, all supplemental material carries the same license as the article it is associated with.
For non-Open Access articles published, all supplemental material carries a non-exclusive license, and permission requests for re-use of supplemental material or any part of supplemental material shall be sent directly to the copyright owner as specified in the copyright notice associated with the article.