
Abstract
We present an analytical approach for the penetration and perforation processes of concrete targets by rigid projectiles. We first derive an empirical relation for the penetration resistance (Rt) of thick concrete targets to rigid projectiles, in terms of their unconfined compressive strength (fc) and the projectile’s diameter (D). We then develop an analytic model for the perforation process of concrete slabs by accounting for their back surface, through a reduced resisting stress (Reff) which the slab exerts on the rigid projectile. With these values of Reff, we calculate the ballistic limit velocity (Vbl) for a given projectile/slab configuration, as well as the residual velocities (Vr) of a perforating projectile. Predictions from our model are compared with several sets of published data, showing good agreement.
Introduction
The impact of high-velocity projectiles at concrete structures has been the subject of intense study for many years, due to its relevance for both industry and military establishments. Issues concerning rigid projectiles penetrating massive concrete targets, or perforating thin slabs, have been dealt with empirically over 50 years. The review article of Li (2012) covers the commonly used formulas for the penetration depths, ballistic limit velocities, scabbing thresholds, and so on. The penetration depths of a rigid projectile in all of these formulas are given as some function of its weight and impact velocity, as well as the unconfined compressive strength of the concrete. As far as their use is concerned, these empirical relations are good for the range of parameters covered by the data. During the past two decades, there has been a serious effort to use numerical simulations, in order to follow the various processes during concrete penetration. However, these attempts are still in their early phase, because of the difficulties in accounting for the constitutive equations of brittle materials, particularly concrete.
One can also gain insight to the interaction at hand through analytical modeling. Such an analysis starts with some physically based assumption concerning the resisting force, which the concrete exerts on the projectile, and derives its penetration depth through the second law (Newton). For example, Forrestal et al. (1994) assumed that the concrete’s resistance to penetration includes two terms, which are related to its compressive strength and to its inertia. According to this approach, the resisting force which the concrete applies on the projectile depends on its velocity during penetration. However, Rosenberg and Dekel (2010b) showed that the resisting force on a rigid projectile has to be constant, namely, independent of its velocity. This observation was based on two experimental findings. First, the data for the penetration depths as a function of impact velocity showed that the average deceleration of the projectile, during the penetration process, is independent of the projectile’s impact velocity. The second observation concerns the fact that the penetration channel in the concrete target, beyond a small region adjacent to the impact face, has the same diameter as the projectile. This means that the kinetic energy lost by the projectile during an increment of time Δt, is the same at all locations along the channel. This loss of kinetic energy is proportional to the displaced volume of the target, as the projectile advances by a distance of Δx. Thus, one can write, ΔEk = kAΔx, where A is the penetration channel’s cross section. The constant k relates the lost kinetic energy of the projectile, to the work done on the target in extending the channel by Δx. Integrating this simple relation results in a penetration depth (P) which depends on the initial kinetic energy of the projectile
Recently, Warren et al. (2014) adopted this approach and reanalyzed penetration data for two types of concrete, with unconfined compressive strengths of 23 and 39 MPa, as given in Forrestal et al. (2003). Their new analysis assumes a constant resisting force which the concrete exerts on these rigid rods, without the inertia term (the stress does not depend on the projectile’s velocity). This analysis is based on direct measurements of projectiles deceleration, using in situ accelerometers embedded in them. These records show that, beyond a small region around the impact face, the deceleration of the projectile can be assumed constant. As expected, the measured decelerations were higher for the stronger concrete, but they did not depend on the projectile’s impact velocity. These measurements, as well as the new analysis by Warren et al. (2014), support the model of Rosenberg and Dekel (2010b), concerning the constant resisting force which a concrete target exerts on a rigid projectile during penetration. This important issue will be the starting point of the analysis presented in this article.
As far as we know, the perforation process of concrete slabs has not been modeled through an analytic approach. This is due to the extra complications which arise from failure mechanisms at the back surface of the concrete slab. We refer to the tensile failure of a large volume around the penetration channel and the subsequent ejection of concrete debris of significant mass and velocity. Several empirical relations were proposed for the limit thicknesses of slabs, which are needed to prevent perforation by a given projectile, as reviewed by Li (2012). In this article, we develop an analytical model for the perforation process of concrete slabs by sharp projectiles. The model is based on the information we derive from the data for deep penetrations into very thick concrete targets (so-called semi-infinite targets).
In the first part of the article, we discuss deep penetrations in concrete, by rigid projectiles, and include several aspects which have not been considered by Rosenberg and Dekel (2010b). The most important issue which we add here concerns the dependence of the penetration depth on the projectile’s diameter, namely, the “diameter effect.” By analyzing several sets of data, we derive an empirical relation for the concrete’s resistance to penetration (Rt), as a function of its unconfined compressive strength (fc) and the projectile’s diameter (D). The second part of the article presents our analytical model for the perforation of concrete slabs by rigid projectiles. This analysis is based on the reduced resistance to penetration (Reff) of the slab, due to its free back surface. The validity of this model is confirmed by comparing its predictions with several sets of experimental results, for different projectile/concrete combinations.
The deep penetration of concrete targets by rigid projectile
General observations
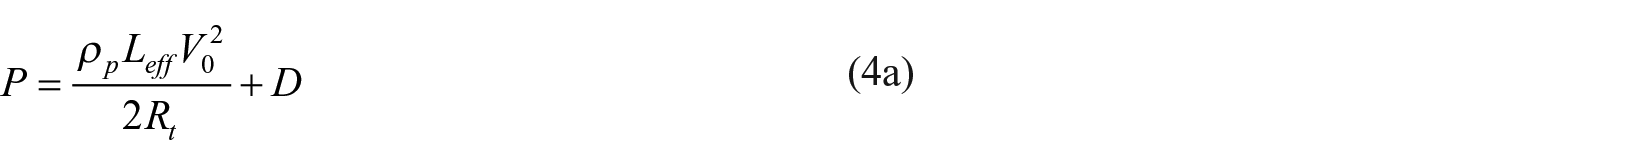
The starting point of our approach is that the resisting force on the projectile, beyond the impact face region (the entrance phase), is constant—independent of the projectile’s velocity. As was shown by Rosenberg and Dekel (2012), the penetration depth of a rigid projectile (effective length, Leff; density, ρp; and impact velocity, V0), in a target which exerts a constant resisting stress (Rt) on it, is given by


where M and r are the mass and radius of the projectile, respectively. Rosenberg and Dekel (2012) found that the target’s resistance to penetration (Rt) depends on the compressive strength of the target and on the nose shape of the projectile. They also showed that this simple equation accounts for all the data presented by Forrestal and his colleagues, for projectiles with different nose shapes penetrating various metallic and concrete targets.
Haldar and Hamieh (1984) analyzed a large amount of data, for rigid projectiles penetrating concrete targets, and observed that the depths of penetration follow a very similar dependence as in equation (1). They defined a non-dimensional parameter, the impact factor (I), and found that it accounts for the penetration depth, normalized by the projectile diameter (P/D), through a linear relation

in which a1 and a2 are constants, and the impact factor (I) is defined by

where N is a nose shape factor, M is the projectile’s mass and fc is the unconfined compressive strength of the concrete.
As is easily seen, this linear relation between P/D and the impact factor is very similar to the expression for P/L as a function of V0, in equation (1) from Rosenberg and Dekel (2010b). Both relations have the quadratic dependence of P on V0, with ρpLeff as the factor multiplying
By analyzing several sets of data for rigid penetrations into concrete, Rosenberg and Dekel (2010b) obtained the following empirical relation between Rt and fc

where Rt is given in GPa and fc in MPa.
This empirical relation between Rt and fc was determined for experiments in which the diameters of the projectiles ranged between 20 and 30 mm. A closer inspection of the data shows that the penetration depths, of rigid projectiles in concrete targets, are size dependent, namely, with increasing projectile diameter (or weight) the concrete’s resistance to penetration decreases. This “size effect” is clearly seen in the data of Warren et al. (2014), with D = 76 mm projectiles impacting fc = 23 and 39 MPa concretes. The inferred Rt values for both concretes are significantly smaller than those for projectiles having diameters in the range of 20–30 mm. We should also note that the empirical relation proposed by Young (2009), for the penetration depths in concrete, includes a scaling factor for projectile weighing less than 182 kg. This relation has to be multiplied by a “mass factor” of 0.4 M0.15 for these projectiles, which amounts to 0.8, 0.565 and 0.44, for projectile weights of 50, 5 and 1 kg, respectively. Thus, the issue of “mass scaling” is not new and it has been taken into account empirically. Obviously, the empirical relation of Rosenberg and Dekel (2010b), in equation (3) has to be modified in order to account for the dependence of Rt on projectile size. This is one of the issues which we deal with in this work, but first we wish to discuss the effect of the impact face (the entrance phase) on the penetration process in concrete targets.
The effect of the entrance phase
The issue of the entrance phase in concrete targets was elegantly resolved by Warren et al. (2014). They recorded the deceleration history of relatively large projectiles (D = 75 mm) in which they embedded fast accelerometers. The recorded data showed that the deceleration of the projectile increases linearly from the impact moment until the projectile’s nose reaches a distance of about 2D in the target. After this time the deceleration is practically constant until the penetration process ends. These observations are very important since they mean that the entrance phase in concrete is of the order of 2D, and that the deceleration of the projectile beyond the entrance phase is, indeed, constant. We should also note that the front spall layer in concrete targets (so-called crater) has a thickness of about 2D, supporting the claim that the entrance phase in these materials is of such extent. Note that for metallic targets, Rosenberg and Dekel (2012) found that the entrance phase extends to depths of 6D and 3D, for ogive and spherical-nosed projectiles, respectively. Warren et al. (2014) argued that Rt, the resistance of the concrete to penetration, should be calculated through the penetration depths beyond the entrance phase. Using some simple calculations, they obtained the following relation for the penetration depth
which is similar to equation (1). Note that with this approach, Rt is determined from the data through the relation
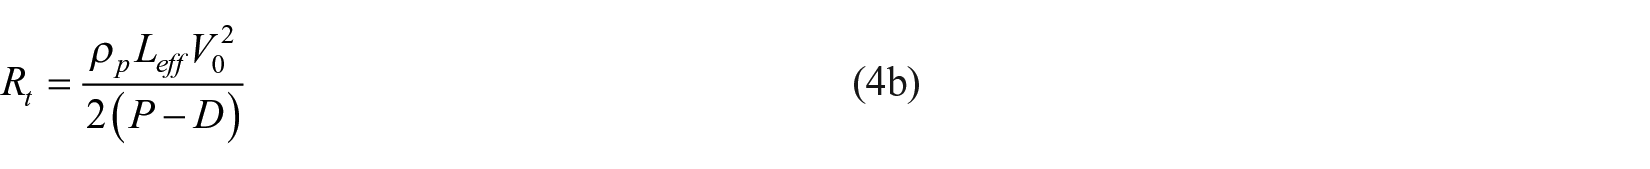
which is somewhat different than the corresponding derivation through equation (1). However, the inferred values for Rt are very close by both treatments. Still, in order to account for the lower resistance to penetration throughout the entrance phase, we now revise the values of Rt for the various concretes as given by equation (3), from Rosenberg and Dekel (2010b), using equation (4b).
The relation between Rt and fc for projectiles with various diameters
Figure 1 summarizes the resulting values of Rt as a function of fc, from several sets of experiments with different concretes. The values of Rt are grouped according to the diameter of the projectiles in three groups: small diameters (6–13 mm), intermediate diameters (20–30 mm) and large diameters (75 mm). One can clearly see that, indeed, Rt depends on D and it decreases with increasing D. We should note that the data we analyzed is mostly for CRH3 ogive-nosed steel projectiles. There are several cases where the projectiles had ogive shapes of CRH2 and CRH4.25, but the scatter within the experimental data is too large to delineate the effect of these different nose shapes.

The relation between Rt and fc for different projectile diameters.
The data in Figure 1 were taken from the works of Forrestal et al. (1994, 1996, 2003), Frew et al. (1998), Gomez and Shukla (2001), O’Neil et al. (1996) and Unosson and Nilsson (2006). The values for Rt are the average values from each set of experiments, as calculated through equation (4b). A summary of these Rt values is given in Table 1, together with the relevant information concerning the concrete targets and the projectiles from these works.
Summary of the Rt values from the different sources.
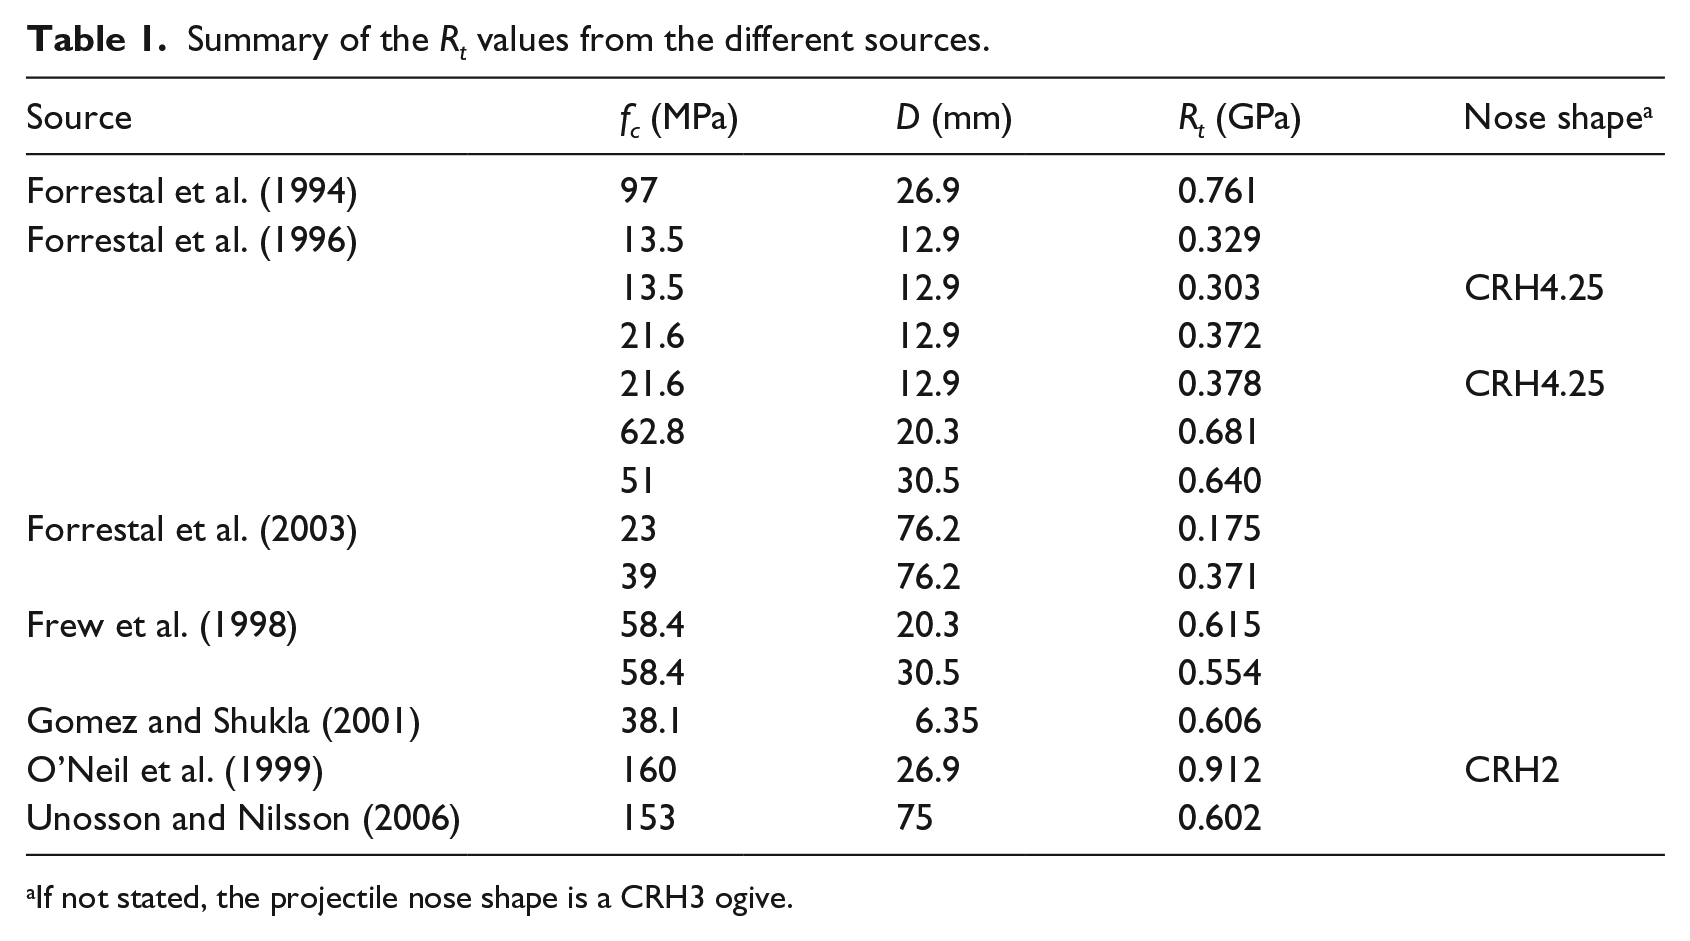
If not stated, the projectile nose shape is a CRH3 ogive.
A simple explanation for the “diameter effect” can be given by considering the fact that the size of the aggregate particles, in most of these concretes, is in the range of 8–10 mm. These are the strong particles in the composite structure of the concrete. Thus, it is reasonable to assume that a small projectile (D = 10 mm) will experience their full resisting force. On the other hand, a much larger projectile will experience a weaker force, averaged through the strong aggregates and the weaker cement. Another explanation may be related to the coupling between the aggregates and the cement through their adhesive forces. In any case, we can assume that Rt depends on the ratio D/d, where d is the aggregate size. Moreover, we may speculate that for very large projectiles the values of Rt will asymptote to a certain value which will not change by a further increase in D. Our assumption is that this takes place for D somewhere between 7.5d and 10d. The data for very large projectile in several works support this trend. For example, Langberg and Markeset (1999) impacted 75 and 152 mm projectiles at concrete targets with strengths ranging between 30 and 200 MPa. Their data indicate that the Rt values for both projectiles are close. Obviously, more experiments, with projectile diameters in the range of 75–120 mm, have to be done in order to find the asymptotic value of D. Specifically, we would like to see penetration results for projectiles with diameters in this range, but having the same mass, impacting a given concrete target at the same velocity. On the other side of this issue, we may also assume that for D < d, the values of Rt will not depend on D, since such projectiles should experience a resisting force which depends mainly on the strength of the aggregate material. The data of Gomez and Shukla (2001) demonstrate this size effect for their 6-mm projectiles penetrating an fc = 38 MPa concrete. The resulting Rt value in this case is considerably higher than for the much larger projectiles, but it does not seem to be very different than the Rt values for D = 10–12 mm projectiles. We should note that several works have shown that the resistance to penetration of concrete targets is dependent on both the aggregate size, through the ratio D/d, and the strength of the aggregate material, as in Bludau et al. (2006) and Dancygier et al. (2007).
The question whether the “size effect” is due to the mass of the projectile, as given by Young (2009), or to its diameter as we suggest here, can be resolved by considering two other sets of experiments. First, consider the experiments by Frew et al. (1998) with projectiles having the same diameter but different lengths (mass). These projectiles (D = 20.3 mm, L/D = 10, 12.5 and 15) impacted fc = 58.4 MPa concrete targets at velocities of about 800 m/s. By analyzing the penetration depths of these projectiles, through equation (4b), we obtain very close Rt values for the three projectiles. This result supports our notion that the decrease in Rt with the projectile’s size is a “diameter effect,” rather than a “mass effect.” Another set of experiments which supports our notion is given in Canfield and Clator (1966). They performed two sets of experiments with scaled projectiles having diameters of 76.2 and 7.62 mm (a scale of 1:10). They also scaled their fc = 34.5 MPa reinforced concrete targets by reducing the aggregate size, as well as the dimensions of the steel reinforcement, by a factor of 10, in order to have a truly scaled target. Impact velocities in this work ranged between 300 and 800 m/s. It turned out that the normalized penetration depths for the two sets of experiments, in terms of P/D as a function of V0, can be represented by a single curve. The main result from this important work is that the penetration of rigid projectiles in concrete targets does not depend on the geometric scale, as long as the scaling is done properly for both projectile and concrete. We can also interpret these data as a strong support for the issue of the “diameter effect,” as discussed here. The two sets of experiments had very different projectile diameters (by a factor of 10), but had the same value of D/d. Thus, the equal values for the normalized penetration depths (P/D) strongly support our interpretation for the role of the projectile’s diameter, rather than its mass.
A least square fit of the data presented in Figure 1, in terms of Rt as a function of fc and D/d, is given by the relation

where Rt is given in GPa and fc in MPa.
This empirical relation accounts for all the data we examined with concrete strengths in the range of 13–160 MPa, and projectile diameters of 6–76 mm, a total of 84 experiments. As with every empirical relation, equation (5) should be used only as an interpolation tool, for D and fc values within the above cited ranges. As mentioned above, it will be interesting to find out how Rt varies for D > 76 mm projectiles. It will be also interesting to follow the dependence of Rt on D/d numerically, with a mesoscopic model in which the target is composed of strong aggregates embedded in a softer matrix.
Figure 2(a) compares the normalized penetration depths in each experiment from the works cited above, as calculated by equation (4a), with Rt values calculated by equation (5). The good correlation means that our procedure resulted in meaningful values for Rt, which we can use in the following parts of this work. Moreover, it means that the concrete’s resistance to penetration (Rt) is a monotonic function of its unconfined compressive strength (fc) which is, apparently, the important physical property for the penetration process, rather than its tensile strength, density, and so on. In order to demonstrate the correlation between Rt and fc, Figure 2(b) compares the average Rt values from Table 1 with those calculated by equation (5). The good correlation enables one to use equation (5) in order to determine Rt values for any given projectile/concrete pair.
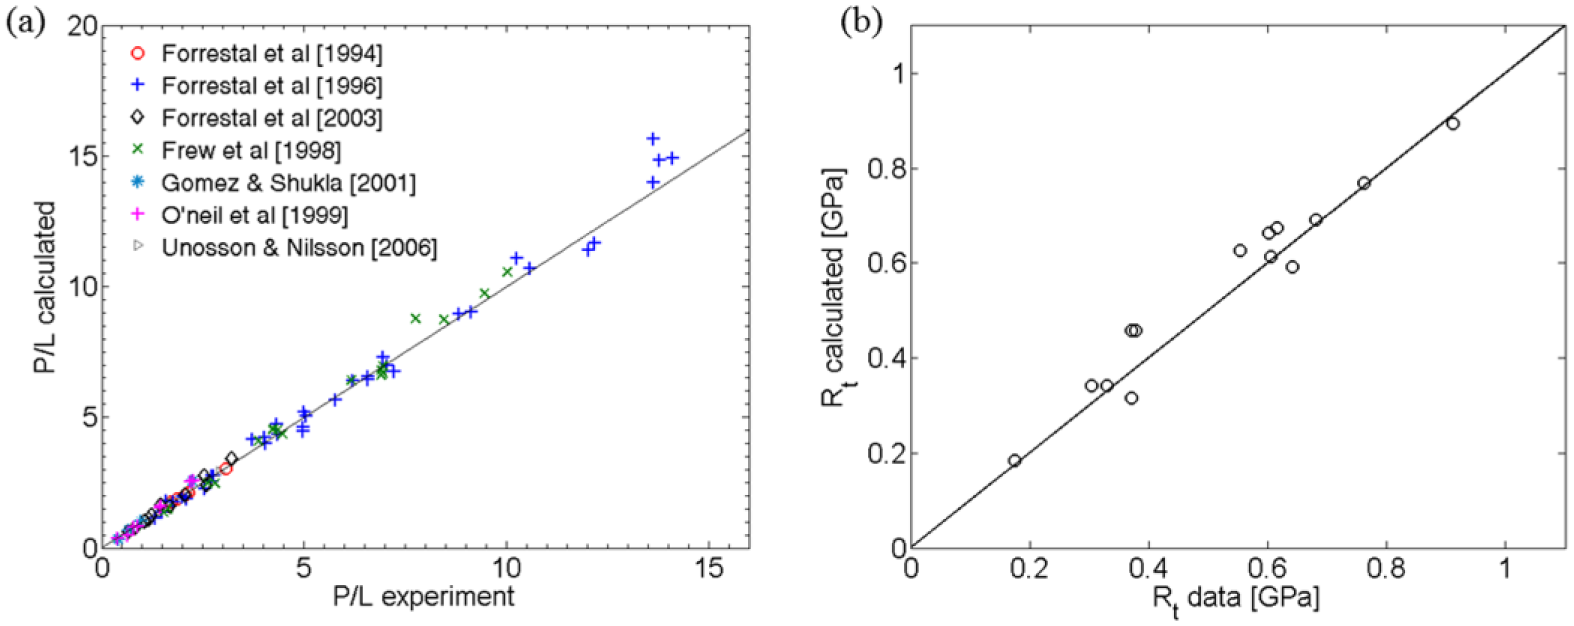
(a). Comparison of experimental and calculated normalized penetration depths, for the data analyzed in this work. (b) Correlation between the experimental values of Rt and those calculated through equation (5).
The perforation of concrete slabs by rigid projectiles
General considerations
The issue of plate perforation in terminal ballistics is more complicated than that of deep penetration, as discussed by Rosenberg and Dekel (2012), due to the back surface of the plate which complicates the process in two ways. First, it reduces the resisting force on the projectile, as it approaches the back surface. This “back surface effect” is similar to the effect of the entrance phase, by which the resistance around the impact face is lower than the resistance deep in the target. Obviously, one has to quantify the force reduction near the target’s back surface. A second complication is due to the fact that the back surface is prone to various failure mechanisms, which may take place around the penetration channel. This is especially true for brittle materials which have very low tensile strength, such as concrete. Thus, phenomena like spalling and scabbing are often encountered with these targets, complicating the analysis of the perforation process.
We approached the issue of concrete slab perforation by three steps as follows. (1) Using numerical simulations, we estimated the influence range of the exit phase, namely, the distance from the back surface, in projectile diameters, where the projectile starts to “recognize” the existence of the back surface. (2) Using these simulation results, for the history of the projectile’s deceleration, we constructed a simple model for the effective resisting stress (Reff), which a finite-thickness slab exerts on the projectile. Obviously, this effective resistance depends on Rt (the resistance to deep penetration) and on the thickness of the target (H). With this value for Reff, we determine the ballistic limit velocity (Vbl) of a given projectile impacting the concrete slab. (3) Finally, an energy-based model is suggested which accounts for the residual velocity of a given projectile, as a function of its impact velocity at a given concrete slab. Our first step in this construction is to account for the effect of the exit phase.
We discussed above the analysis of Warren et al. (2014), for the effect of the entrance phase in thick concrete targets, using in situ accelerometers which recorded the projectile’s deceleration during penetration. Since we do not have such measurements for finite-thickness slabs, we resorted to numerical simulation using the 2D-AUTODYN code. The numerical model consists of a CRH3 ogive-nosed projectile with a diameter of 76.2 mm impacting a 762-mm-thick concrete target. The projectile was modeled with a Lagrangian mesh, while the target was modeled with smooth particle hydrodynamic (SPH) formulation. We used the randomized hough transform (RHT) procedure (see Riedel et al., 1999) to model the concrete’s equation of state and constitutive relations. This model was specifically calibrated for fc = 35 MPa concrete and it has been used for over a decade by many workers. We should note that our simulations are not aimed at accounting for penetration/perforation data. The only aim of these simulations was to determine the extent of the exit phase, as explained above. Figure 3 shows the deceleration history of this projectile as a function of its nose location x normalized by the projectile diameter D. The deceleration history was calculated by a numerical derivative of the velocity history of the projectile with respect to time. We used a moving average filter with a window of 0.05 ms to remove noise generated by elastic waves propagating in the projectile. The figure clearly shows the three phases during perforation. The first is the entrance phase which lasts for about 1.5 projectile diameters. This phase is characterized by a nearly linear increase, as in the accelerometer records of Warren et al. (2014). The second phase, in which the deceleration is roughly constant, lasts until the projectile reaches a distance of about four projectile diameters from the back surface. It is difficult to pinpoint the end of this phase, due to its wavy nature. The third stage is the exit phase, where the deceleration is linearly decreasing until the projectile’s nose emerges from the concrete.

Deceleration-distance history of the projectile from the numeric simulation.
The main conclusion from this simulation, as well as from others which we performed with different impact velocities and slab thicknesses, is that the resisting stress which the slab exerts on the projectile can be presented schematically by a trapeze, as shown in Figure 4. The entrance and the exit phases are characterized by linearly increasing and decreasing stresses, respectively, and the resisting stress in the middle part of the target has the value of Rt, as in a semi-infinite target. Another important conclusion, which we can make from these simulation results, is that the overall distance where the resisting stress is increasing or decreasing, ranges between five to six projectile diameters.
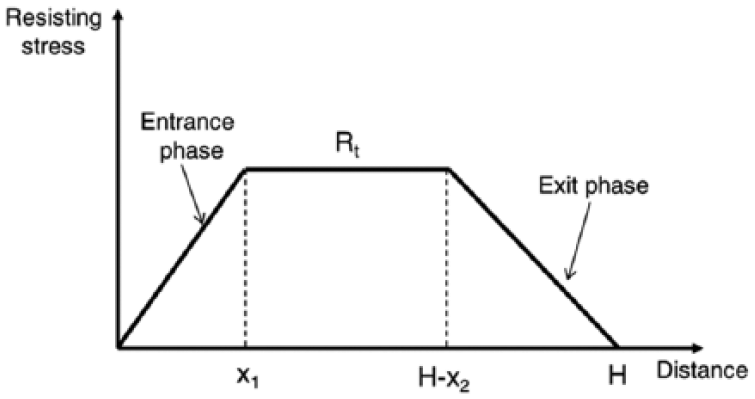
A schematic description of the resisting stress during slab perforation.
Our next step is to define an effective (average) resisting stress (Reff) which the concrete slab exerts on the projectile. In order to find the value of Reff, we use the fact that the work done by the projectile, in order to perforate the target, is proportional to the area below the trapezoid in Figure 4. We then convert the trapezoidal-shaped stress history into a rectangular one and equate the areas of the trapezoid and the rectangle. The base of the equivalent rectangle is equal to the slab’s thickness H, and its height is equal to Reff. By equating the two areas we find that the effective resisting stress (Reff) is given by the following relation

where x1 and x2 are the extents of the entrance and exit phases, respectively.
We have seen that the entrance phase extends to about x1 = 1.5D, by both our simulations and the experimental records of Warren et al. (2014). For the exit phase we chose an average value from our simulations: x2 = 4D. Thus, we chose an average value of x1 + x2 = 5.5D, and with this value we find, from equation (6), that the effective resisting stress is given by

We should note that the influence range of the back surface, about 3–4D, means that a semi-infinite target should be thicker than the penetration depth by at least these values. In order to be on the safe side, we recommend using concrete targets which are thicker by at least 5D than the actual penetration depths. Otherwise, the effect of the back face cannot be ignored. The effective resisting stress (Reff), which depends on the slab thickness through equation (7), will be used in our model for the perforation of concrete slabs. Such a model has to account for the experimental value of Vbl for a given projectile/slab configuration, as well as for the residual velocities which are measured for V0 > Vbl.
A simple model for concrete perforation
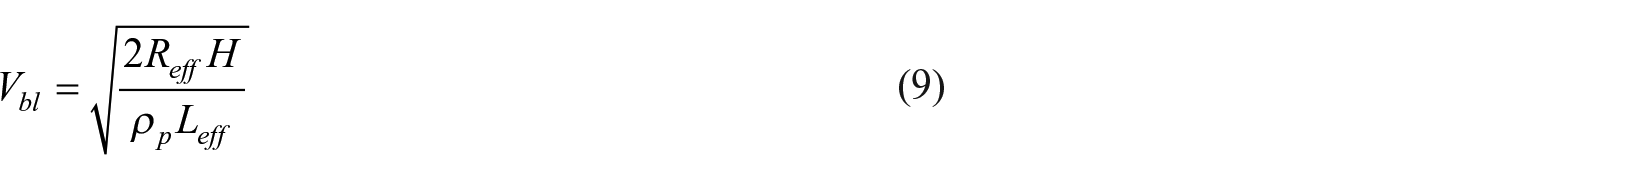
In order to determine the ballistic limit velocity (Vbl) for a given projectile/slab pair, we follow the procedure developed by Rosenberg and Dekel (2012), for metallic plates which are perforated by rigid projectiles. The basic idea behind this approach is that the kinetic energy of the projectile at V0 = Vbl is spent on the work needed to perforate a slab of thickness H. This slab exerts an average (constant) resisting stress (Reff) on the projectile, as derived above, and we can write

With the definition of the effective length of the projectile,
Predictions from this simple equation will be compared with experimental data in the next section, for various projectile/slab pairs. The values for Reff are calculated by equation (7), which accounts for the entrance and exit phases, as outlined above. The values for Rt are calculated by the empirical relation in equation (5), which accounts for the compressive strength of the concrete and for the diameter of the projectile (the “diameter effect”).
In order to estimate the residual velocity of a rigid projectile impacting a given concrete slab, at an impact velocity higher than Vbl, we follow the well-known approach of Recht and Ipson (1963) for metallic plates. This approach makes use of energy conservation, with which one can write

where Vr is the residual velocity of the projectile, m and v are the mass and velocity of the ejected target material, respectively, and W is the work done by the projectile in order to perforate the target. Similar equations have been applied for various metallic targets and, as shown by Rosenberg and Dekel (2012), their predictions match the data very well.
The main problem in applying equation (10) to concrete slabs is that both the mass and the velocity of the ejected concrete material are very difficult to quantify. Thus, we have to make a few assumptions concerning the kinetic energy of the ejected mass (mv2/2) in equation (10). One can follow the data for the front and back spalled craters in concrete slabs, as given by Wu et al. (2015b), for example, and make an estimate for the volume of the ejected material. Our estimate is that this volume is roughly equal to the volume of a cylinder with a diameter of D and a height of 2D. Thus, according to our assumption, the mass of the ejected concrete is given by m = ρtπD3/2, where ρt is the density of the concrete. As stated above, we have no knowledge about the velocity (v) of this material, and we assume that v = Vr. Obviously, this assumption is very simplistic since the ejected concrete chunks move at different velocities, and those ejected from the front spall probably move at a much lower velocity than those ejected from the back. Still, this is the only way by which we can proceed with our analysis. These assumptions about the mass and velocity of the concrete debris should be checked by future work which will be devoted to measuring these quantities.
Inserting these estimates in equation (10), we obtain

where

We should note here that our estimate for the energy term mv2/2, of the ejected mass, will be checked by comparing predictions from the model with experimental data for the projectile’s residual velocity. As discussed above, at V0 = Vbl the residual velocity is zero, thus W = MVbl2/2. Inserting this expression in equation (11), we finally get for the projectile’s residual velocity

where

The predictions of this equation are compared with experimental data in the next chapter for several sets of experiments for various projectile–slab pairs. As stated above, a good agreement between predictions and data enhances the validity of our assumptions concerning the kinetic energy of the ejected concrete chunks. Note that Peng et al. (2015) used a somewhat different model, but arrived at similar conclusions. They start with a velocity-dependent resisting force on the projectile and ignore the entrance phase. In order to simplify the analysis, they calculate an effective constant resisting stress which acts on the projectile, by introducing an empirical parameter for the ratio between the inertial- and strength-related forces. They assume that the ejected material from the back face of the concrete slab has a truncated-cone shape with a volume which is much larger than the volume we assumed above. However, according to their model, the velocity of the ejected debris is only 0.2 Vr. In fact, the kinetic energy of the debris in their model is very similar to that of our model. As far as the extent of the exit phase, they chose a value of 2.5D. The analysis of Peng et al. (2015) for the ballistic limit velocity of a given slab and the residual velocities for V0 > Vbl is based on similar principles as our analysis, since they are based on similar energy-conservation considerations.
Comparison with experimental data
The first set of experiments with which we compare our model is from Hanchak et al. (1992). They impacted 500 g ogive-nosed projectiles (D = 25.4 mm), at 178-mm-thick concrete slabs of two strengths fc = 48 MPa and fc = 140 MPa, having densities of 2.44 and 2.52 g/cc, respectively. The relevant relations here are as follows: H/D = 7 and b = 0.942 and 0.94 for the 48 and 140 MPa concretes, respectively. From equation (5) we find that Rt = 0.6 GPa, for the fc = 48 MPa concrete and the D = 25.4 mm projectile. Equation (7) results in Reff = 0.364 GPa, for this projectile–slab pair. Inserting this value of Reff in equation (9), we get Vbl = 362.4 m/s for this pair. The same procedure for the fc = 140 MPa concrete results in the following values: Rt = 0.868 GPa, Reff = 0.527 GPa and Vbl = 436 m/s. Once the corresponding values for Vbl are determined, we insert them in equation (12) and calculate the relation Vr(V0) for the two concretes.
Figure 5 shows the good agreement between our model for Vr(V0) and the experimental results of Hanchak et al. (1992), for the two types of concrete. We should note that this agreement is, in fact, twofold. First, the values of Vbl for the two concretes, as calculated by equation (9), are very close to the experimental results. This fact enhances the validity of our analysis for the effective resisting stress Reff (equations (6) to (9)). Second, the agreement between our model’s predictions for Vr, through equation (12), and the experimental results is a strong indication that the assumptions behind our model are valid. In particular, we refer to the assumptions concerning the kinetic energy of the ejected concrete chunks (their mass and velocity).
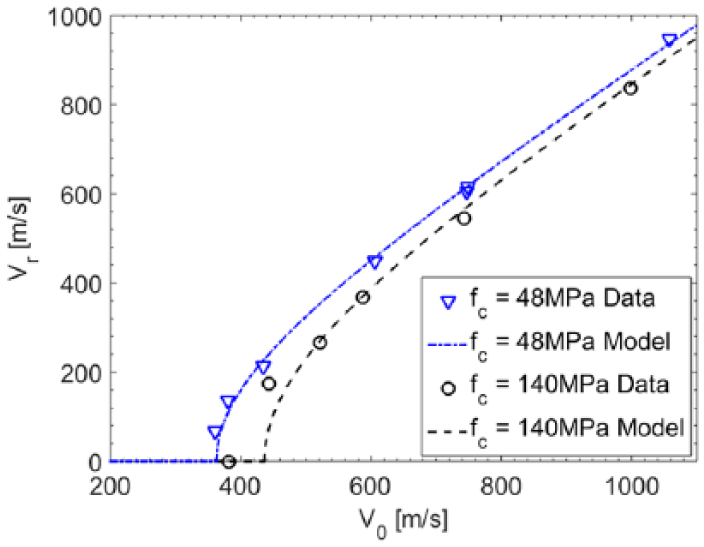
Comparing the model with the data of Hanchak et al. (1992).
The fact that these concretes, which differ by a factor of 3 in their unconfined compressive strengths, have very close values of Vbl is not intuitive and needs some discussion. A possible explanation for this result was given by Hanchak et al. (1992), who report on shear strength measurements of these concretes under confining pressures. These shear strengths of both concretes increase with confining pressure and seem to saturate at pressures of about 600 MPa. The ratio of these confined shear strengths diminishes with the confining pressure and reaches a value of about 1.3 for pressures of 400–600 MPa. We may speculate, as did Hanchak et al. (1992), that the resistance to penetration of concrete targets is determined by their confined strengths, since the material around the projectile–concrete interface experiences some pressure during the penetration process. Qualitatively, we may link the relatively small differences between the corresponding Rt and Vbl values of these concretes, with the 30% difference in their shear strengths under confined pressures. A proper analytical model should consider this pressure-related strength increase and account for the relation between Rt and the concrete’s confined strength.
The second set of experiments with which we compare our model is by Li et al. (2013). They measured residual velocities of M = 4.8 kg, D = 64 mm projectiles, which perforated various slabs of fc = 34.3 MPa concrete. Note that these projectiles are much larger than those of Hanchak et al. (1992). Impact velocities in the work of Li et al. (2013) were around 410 m/s, and the thicknesses of the slabs ranged between 300 and 600 mm. They also performed an experiment with a 700-mm-thick target, in which the projectile penetrated to a depth of 428 mm. With equation (5) we find that Rt = 0.34 GPa for this projectile/concrete pair, and from equation (4a) we get an estimated value of P = 437 mm, for the penetration depth in a semi-infinite target, in agreement with the experimental result. We compare now our model’s predictions with the measured residual velocities for the thinner concrete slabs. This is done in Table 2, where the measured and predicted residual velocities are tabulated. The tabulated values for Reff, Vbl and Vr were determined by the same procedures outlined above, with b = 0.907 for this set of experiments.
Comparing model’s predictions with the data of Li et al. (2013).
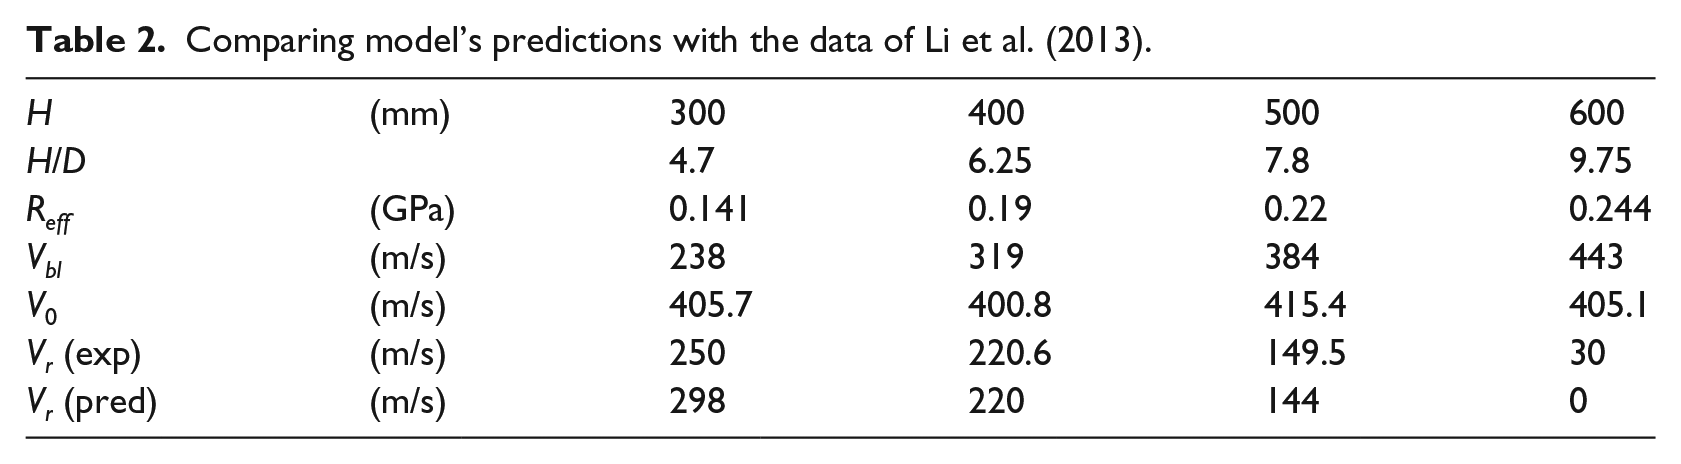
We can appreciate the validity of our model by the good agreement between the predicted and measured residual velocities. Part of the disagreement between these values for the H = 300 mm slab is probably due to the fact that for this slab H/D = 4.7. This value is smaller than the combined extents of the entrance and exit phases in our model, which amounts to H/D = 5.5. For such cases the geometric construction with the trapeze in Figure 4 has to be modified, as will be discussed later on. The agreement between the model’s prediction and the experiment with the thickest target (H = 600 mm) is very good. In this case the impact velocity is close to the value of Vbl for this slab thickness, and the data can show residual velocities of a few tens of meters per second.
In order to enhance this claim, we estimate the value of Hbl, which is the minimal thickness of a slab which is needed to prevent its perforation by a given projectile at a certain impact velocity. The two quantities Vbl and Hbl have the same role in terminal ballistics and they are used interchangeably. Inserting the value of Reff from equation (7) into equation (9), which relates Vbl with H, we get Hbl in terms of V0. This simple procedure results in the following relation
from which we get

where P0 is the penetration depth of the given projectile into the semi-infinite concrete, as calculated by equation (4a). Equation (13b) is a general relation for the ballistic limit thickness (Hbl) of a concrete slab, which is needed to stop the given projectile at V0. One should expect that Hbl be larger than P0, in order to compensate for the exit phase. In the case of metallic targets, this extra thickness amounts to about 1D−2D, as described in Rosenberg and Dekel (2012). Similarly, according to equation (13b), the extra thickness for concrete slabs amounts to 1.75D. For the concrete at hand (fc = 34.3 MPa), we already calculated a value of P0 = 437 mm for an impact velocity of 412 m/s. With D = 64 mm, we find by equation (13b) that Hbl = 550 mm for this impact velocity. Thus, the last shot in Table 1, with a target thickness of 600 mm, was near the ballistic limit for the corresponding projectile/concrete pair.
In order to demonstrate the validity of the relation for Hbl in equation (13b), consider the data in Cargile et al. (1993). They impacted 2.34 kg, D = 50.8 mm projectiles at various fc = 38.2 MPa concrete slabs and followed their residual velocities. By analyzing their data, they obtained the following values of the limit thicknesses: Hbl = 284, 342 and 452 mm, for impact velocities of V0 = 313, 370 and 471 m/s, respectively. Using our model, we find that Rt = 0.414 MPa for this projectile/concrete pair, which results in P0 = 187.5, 241.8 and 360 mm for the three velocities, respectively. Adding the term 1.75D = 89 mm to these values, results in the following predicted values for the limit thicknesses: Hbl = 276.5, 331 and 449 mm, for these impact velocities. The excellent agreement between our model’s predictions and this set of experiments can be considered as strong evidence for the validity of our approach.
A large number of experiments are detailed by Wu et al. (2015b) who shot 428 g, D = 25.3 mm projectiles at several multi-layered configurations of fc = 41 MPa concrete slabs. These slabs were situated at a distance behind each other, and residual velocities of the projectiles were measured as they exited each slab. The first configuration included a monolithic target, 300-mm thick, while the second setup had two slabs with thicknesses of: 150 + 150 mm, 100 + 200 mm and 200 + 100 mm. The third configuration consisted of three slabs, each a 100-mm thick. The last concrete slab in each configuration was backed by a 1-mm-thick steel plate (referred to as a liner), with which we shall deal later on.
First, consider the penetration depth of 254 mm, for a projectile which impacted the 300-mm target at V0 = 540 m/s. Using equation (5), we find that Rt = 0.562 GPa for this projectile/concrete pair. This value results in a penetration depth of 246 mm from equation (4a), which is very close to the experimental result of P = 254 mm. On the other hand, the agreement between our model’s prediction and the Vr, data, for the 300-mm-thick slab which was backed with the steel liner, was less satisfactory. This was also the case with data from all the last slabs in the multi-layered configurations, which were backed by steel liners. These discrepancies are probably due to the support which the steel liners render to the back face of the slab, affecting the perforation process. Moreover, these liners were attached to the last slab in each multi-layered configuration. Thus, projectiles which impacted these slabs may have done so with some yaw angle, as they came out of the preceding slab (or two slabs). For these reasons, we shall first analyze the data for the bare slabs in this work and deal with lined slabs in the next chapter. In the following analysis, we shall use the value of Rt = 0.562 GPa, in order to calculate Reff values for these slabs through equation (7), and their corresponding Vbl values from equation (9).
For the 200-mm-thick slabs, with H/D = 7.9, we find that Reff = 0.366 GPa and Vbl = 414.5 m/s. A similar analysis for the H = 150 mm slabs results in values of Reff = 0.3 GPa and Vbl = 325 m/s. With these values of Vbl, we calculated the corresponding curves for Vr(V0) through equation (12). Figure 6 compares our model’s predictions for Vr(V0), with the data of Wu et al. (2015b), for these two slab thicknesses. One can clearly see the good agreement between model and data which, again, enhances the validity of the model.

Comparing the model’s predictions with the data of Wu et al. (2015b).
As mentioned above, Wu et al. (2015b) presented several sets of experiments for multi-layered slabs, H = 100 mm thick. This is a relatively thin slab, with H/D = 3.95, for which the geometric construction, with the trapezoid in Figure 4, does not apply. Instead, we present in Figure 7 a different diagram which applies for cases where H < 5.5D. This diagram is based on our assumption that the entrance phase, together with the exit phase, extend to a distance of 5.5D. The large triangle in Figure 7, with a height of Rt and a base of 5.5D, represents the case for H = 5.5D, for which the end of the entrance phase coincides with the beginning of the exit phase. The smaller triangle represents cases where H < 5.5D.

Schematic representation of the stress history for thin slabs.
As discussed above, our approach assumes that the area below the large triangle, given by S0 = 5.5DRt/2, is proportional to the work done by the projectile in order to perforate a slab with H = 5.5D. In the same way, the area of the smaller triangle (Sz) accounts for the work to perforate a slab of thickness ZD (where Z < 5.5). Assuming geometric similarity of the two triangles, we have Sz/S0 = (Z/5.5)2. Thus, the area of the small triangle is given by

As was done earlier, we equate this area with the area of a rectangle, having a base of ZD and a height of Reff, which amounts to ZDReff. The condition for equal areas means that for cases where Z < 5.5, we have the simple relation

For the H = 100-mm slabs in the work of Wu et al. (2015b) we have Z = 3.95 and Rt = 0.562 GPa, which result in Reff = 0.202 GPa by equation (15). Inserting this value in equation (9) we find that Vbl = 217.6 m/s for these slabs, with which we calculate Vr(V0) through equation (12). Figure 8 shows the good agreement between the predicted residual velocities and the experimental results, enhancing the validity of our approach.
Comparing the model’s predictions for H = 100 mm with the data of Wu et al. (2015b).
We should note that Booker et al. (2009) recorded the deceleration of instrumented projectiles, with D = 76 and 71 mm, as they perforated H = 200-mm slabs. These experiments have H/D values of about 2.7, corresponding to the triangle-shaped resisting stresses. The experimental records have, indeed, a triangle-shape, with heights which are lower than the corresponding records in the much thicker targets. These deceleration records support our triangle-construction for the resisting force in thin slabs. We should also note that the data of Wu et al. (2015b) shows that the ballistic limit velocity for the thick monolithic slab (H = 300 mm) is higher than the corresponding values of all the other combinations with thinner slabs, having a total thickness of 300 mm. This is the expected result since the additional free surfaces reduce the resisting stresses of layered targets.
Finally, we compare our model’s predictions with the experimental results of Børvik et al. (2002). They used high-strength concrete slabs, 100-mm thick, and determined the corresponding Vbl values for a 197 g, D = 20 mm conical-nosed projectile. The unconfined strengths of the slabs were fc = 88, 140 and 197 MPa. Using these values, we get Rt = 0.777, 0.893 and 0.979 GPa for the three concretes, respectively. The normalized thickness of these slabs, H/D = 5, renders the “triangle treatment” presented above. Thus, Reff = 5Rt/11 according to equation (15), resulting in Reff = 0.353, 0.406 and 0.445, for the fc = 88, 140 and 197 MPa concretes, respectively. Inserting these values in equation (9) results in the corresponding Vbl values which are compared with the experimental values, as derived by Børvik et al. (2002), in Table 3.
Comparing model’s predictions with the data of Børvik et al. (2002).
The agreement between the two sets of values is quite good, especially for the strongest concrete. This is another indication for the validity of our model, even for very strong concrete slabs. Note that our model predicts that by increasing the concrete’s strength from about 90 to 140 MPa, one gets a larger increase in Vbl, as compared with the corresponding increase from 140 to 200 MPa. This is also the observed trend as manifested by the data from several sources, such as Langberg and Markeset (1999). At the high end of the concrete’s strength, the improvements in the ballistic efficiency tend to diminish.
As a final note, we wish to discuss the universal property of the perforation process, as depicted by equation (12). Rewriting this equation in a somewhat different way, we get
This normalized relation means that all the data for concrete perforations, with different projectile/concrete configurations, should lie on a single curve. We term this curve as “universal” and in Figure 9 we show that it accounts very well for the data from Hanchak et al. (1992) and Wu et al. (2015a). The dotted line in the figure, for Vr = V0, emphasizes the fact that at high impact velocities the data for Vr/b should asymptote to V0. This asymptotic behavior is due to the fact that the relative magnitude of W, the energy invested in perforation, diminishes in comparison with the high kinetic energies. We should note that the data shown in Figure 9 include experiments with similar projectiles (same values for b). It would be interesting to add more experiments, with different projectile diameters, in order to check the universality of this normalized relation.
Comparing the normalized perforation curve with the data.
The perforation of concrete slabs backed by a steel liner
As mentioned above, the agreement between our model’s prediction and the data for Vr, from Wu et al. (2015b), is much less satisfactory for all the slabs which were backed by a steel liner (1-mm thick). The liner’s support diminishes the amount of scabbing and the velocity of the ejected concrete chunks, as discussed by Grisaro and Dancygier (2014). They suggest a rather simple procedure for assessing the liner’s effect by estimating the equivalent thickness of a concrete slab, which represents the supporting effect of the steel liner, as far as the limit velocity (Vbl) is concerned. They used empirical formulas in order to estimate Vbl values for the concrete slabs. For the steel liners, they used the numerically based model of Rosenberg and Dekel (2010a) for thin metallic plates perforated by rigid projectiles. We approach this issue in a similar way, but we use the analytical model developed here for concrete slabs, in order to calculate equivalent Vbl values for the lined slabs.
The first step of our approach is similar to that of Grisaro and Dancygier (2014). We use the relations derived by Rosenberg and Dekel (2010a) for the ballistic limit velocity of a thin metallic plate. The value of Vbl for a plate of thickness h and yield strength Yt, perforated by a rigid projectile (with a diameter D, density ρp and effective length Leff), is given by
where the effective resisting stress (σr), of the metallic plate during perforation, is given by

Note that this relation was derived by Rosenberg and Dekel (2010a) for thin metallic plates with h/D < 1/3. This is clearly the case for the work of Wu et al. (2015a), with h = 1 mm and D = 25.3 mm. For the 1-mm-thick steel liners having strength of Yt = 0.4 GPa, we get from equations (17) and (18): Vbl = 28 m/s. This value of Vbl has to be added to the corresponding values of Vbl for the bare slabs, in order to account for the supporting effect of the steel liner. We demonstrate this procedure for the H = 300-mm and the H = 150-mm slabs. Thus, for the 300-mm slab, the value of Vbl increases from 540 m/s to 540 + 28 = 568 m/s, and for the 150-mm slab, Vbl increases from 325 m/s to 325 + 28 = 353 m/s. With these values of Vbl, we calculate the predicted curve of Vr(V0) for the two lined slabs. The resulting curves are compared with the data of Wu et al. (2015b) in Figure 10, demonstrating very good agreement between model and data. The figure also shows the calculated Vr(V0) curves for bare slabs, 300-mm and the 150-mm thick, from our model. Obviously, these predictions do not account for the data, since the supporting effect of the steel liner is missing in these calculations.
Comparing the model’s predictions with the data of Wu et al. (2015b) for the 300-mm and 150-mm slabs, backed by 1-mm steel liner.
It seems that, albeit its simplicity, the proposed scheme of calculating Vr for lined concrete slabs captures the general features of the perforation process of such a composite target. Obviously, this is not enough to establish the validity of a model, and one should look for more data on this issue. Such data should include perforation experiments on bare versus lined slabs, different liner thicknesses (h), and even different liner strengths (Yt). As a final note on this issue, we estimate the extra thickness (δ) which has to be added to the bare slabs, in the work of Wu et al. (2015b), in order to get the same value of Vbl as for the lined slabs. Inserting the value of Vbl = 28 m/s for the 1-mm liner in equation (9), we get a value of Reff δ = 0.334 GPa mm, for the product of the effective resisting stress and the thickness of this equivalent layer. Reff itself depends on δ through equation (15) from which, with Z = δ/D, we find that δ is about 13 mm for these concrete/projectile pairs. Thus, the support rendered by a 1-mm-thick steel liner, at the back of these concrete slabs, is equivalent to a 13-mm increase in their thickness.
Discussion and conclusion
We presented an analytic model for the penetration and perforation processes of concrete targets by rigid projectiles. The model is based on the notion that the resisting stress (Rt) on the projectile, deep in the target, is constant (independent of its velocity). The values for Rt in our model were determined empirically through various sets of experiments, which include concretes of different compressive strengths (fc) and projectiles with different diameters. The dependence of Rt on the diameter of the projectile seems to be related to the aggregate size in the concrete (d), as we found for D = 6–6 mm. It would be interesting to explore this dependence for projectiles with diameters around 100 mm, as discussed here. The proposed perforation model accounts for the effects of the impact face (entrance phase) and the back face (exit phase), on the resisting stress exerted by the concrete slab (Reff). The reduction in the resistance to perforation, in terms of the ratio Reff /Rt, depends on the normalized thickness of the slab (H/D). The model’s predictions agree with the data from various sets of experiments, as far as ballistic limit and residual velocities are concerned. We have also presented a preliminary treatment for the difference between bare and steel-lined concrete slabs, which may account for the supporting effect of these liners.
There are, however, some issues which we did not cover here, mainly for the lack of experimental data. One of these issues concerns the influence of the projectile’s nose shape on its penetration capability. Most of the data we analyzed were for CRH3 ogive-nosed projectiles, and only few cases with CRH2 and CRH4.25 ogives. Due to the experimental scatter within each set of experiments, we could not resolve the effect of the nose shape. This fact may mean that the penetration capability of these pointed-nosed projectiles is not very sensitive to the exact shape of the projectile. Some support for this claim can be found in the data of Hansson (2011), for CRH3, CRH8 and CRH12 ogive-nosed projectiles impacting different concrete targets. The penetration depths with CRH12 projectiles were higher by only 12%–22% than those of the CRH3 projectiles, depending on the concrete’s strength. Still, this issue deserves a more quantitative treatment.
Another issue concerns the effect of aggregate size, and their type, on the concrete’s resistance to penetration. The concretes in all the works we analyzed here had a maximal aggregate size of about 10 mm. It is worth exploring the changes, if any, in the resistance to penetration with the aggregate size, as well as its type. Zhang et al. (2005) varied both size and type of the aggregate material and noticed some differences in the depths of penetration. However, their data are difficult to analyze because the penetration depths were very low (around the entrance phase). Recently, Wu et al. (2015a) presented interesting data for deep penetrations in concrete targets, having either basal or corundum aggregates. These results clearly show that the projectiles penetrated less in the corundum-aggregated concretes, as expected by the much higher strength of corundum. Also, the projectiles penetrating the corundum-aggregated concretes were deformed at lower impact velocities, as compared with those penetrating the basalt-aggregated targets. Moreover, the maximal size of the corundum aggregates was varied between 15 and 65 mm. As expected, the corresponding penetration depths of the rigid projectiles decreased as the aggregate size increased. These findings are in accord with our basic assumptions, as presented here. More experiments of this sort should be done in order to have a more general model which will include the aggregate strength.
We discussed the issue of the “diameter effect” in terms of the D/d ratio between the projectile’s diameter and the maximal aggregate size. We assume that this ratio should reach a limiting value, above which the concrete’s resistance to penetration will not change with D/d. We estimate this ratio to be in the range of 7.5–10, but for the lack of experimental data it is difficult to finalize this issue. However, an experimental result with a large diameter projectile was reported recently by Liu et al. (2015), which enables one to estimate the value of this limiting ratio. The nose shape of this projectile was of a double-ogive, with a total length of a CRH4.5 nose. The mass and diameter of this projectile were 81.1 kg and 140 mm, respectively, and the target’s compressive strength was fc = 48 MPa. The penetration depth of this projectile, at an impact velocity of 835 m/s, was 5.1 m. Using equation (4b), we find that the value of the resisting stress in this experiment is Rt = 0.37 GPa. Inserting this value in equation (5), with fc = 48 MPa, results in a value of D/d = 7.55 for this experiment. This value is much smaller than the actual value for the D/d ratio, suggesting that the asymptotic value for D/d is indeed near 7.5. Clearly, more experiments with large projectiles are needed in order to have a definite answer to this issue.
Finally, most of the experiments in the works we reviewed here were performed in the so-called ordnance range of velocities, namely, 400–1000 m/s. It would be interesting to study penetrations and perforations of concrete targets, with rigid projectiles, at higher impact velocities. We expect that at some threshold velocity the resistance to penetration will increase due to the target’s inertia. This issue was discussed by Rosenberg and Dekel (2009) for metallic targets, which exhibit a cavitation phenomenon at impact velocities beyond some threshold velocity. They showed that the diameter of the penetration channel, for impact velocities above this threshold, is larger than the diameter of the projectile. If such a cavitation takes place with concrete targets, at high impact velocities, we expect to see a different size of the front spall, as well as larger diameters of the penetration channels.
Footnotes
Declaration of conflicting interests
The author(s) declared no potential conflicts of interest with respect to the research, authorship, and/or publication of this article.
Funding
The author(s) received no financial support for the research, authorship, and/or publication of this article.