




Abstract
This study performed damage assessment of a reinforced concrete slab subjected to consecutive explosions. To this end, the resistance functions were updated to account for the permanent displacement calculated in the previous step to capture the response of the reinforced concrete slab of the current explosion. In other words, the permanent deformation should be basically evaluated according to the prior explosion. Next, the revised resistance function should be calculated according to damage level. Third, the maximum dynamic responses should be estimated based on the modified single-degree-of-freedom model. Finally, cumulative damages can be evaluated based on the sum of the permanent deformation and the maximum dynamic responses. In order to confirm a feasibility of the proposed single-degree-of-freedom model, a comparative study with the finite element analysis results is carried out under the identical consecutive explosions. Prior to performing the comparative study, the computational model of the target structure is calibrated based on small-scale experimental data to carry out more reliable finite element analysis.
Keywords
Introduction
Blast loads due to unexpected explosions such as terrorist attacks and explosion accidents induce dynamic responses of a structural component. Such a response is used as a primary parameter to evaluate its damage (Oswald and Skerhut, 1993; U.S. Army Corps of Engineers, 2008b). Thus, it is essential to preliminarily predict the response of a structural component (Krauthammer, 2008). To this end, the finite element (FE) methods are widely used to predict dynamic responses of a structural component. However, the FE methods require considerable efforts to construct computational model for a target structure and heavy computation cost for carrying out numerical simulation (Børvik et al., 2009; Castedo et al., 2015; Thiagarajan et al., 2015; Wu and Sheikh, 2013).
In order to overcome such a drawback, single-degree-of-freedom (SDOF) method received considerable attention during the past few decades. The SDOF method constructs the one-dimensional mass-spring system for a structural component to quickly analyze its blast response. The simplification of the problem can save much effort and time for numerical simulation. An excellent review for SDOF method can be found in Morison (2006).
Fischer and Haring (2009) presented two minimization problems to determine parameters for best practice SDOF models based on the structural response. Oswald and Bazan (2014) experimentally confirmed that the maximum dynamic displacements estimated by SDOF model are conservative compared to test data by 20% to 30%, on average. Stochino and Carta (2014) proposed two SDOF models to estimate the blast response of the beam. The first model was developed based on the law of energy balance, and another model can predict the dynamic responses of the beam by a spring-mass oscillator. Dragos and Wu (2015) newly defined the concept of a reduced resistance function to accurately consider the P-delta effects. Feldgun et al. (2016) investigated the blast response of geometrically nonlinear elastic plates based on a nonlinear SDOF model. They compared the nonlinear SDOF model with experimental data and numerical predictions, and confirmed their good agreement. Al-Thiry (2016) proposed and validated a modified SDOF model for the prediction of responses of axially loaded steel columns subjected to blast loads. The modified SDOF model was validated against the test data presented in an open literature and numerical results. The results indicated the reliability of the method. Recently, Liu et al. (2018) experimentally investigated the blast responses of reinforced concrete (RC) beams and RC columns from small-scale tests. Moreover, a pressure–impulse (P-I) diagram derived from SDOF theory is also widely used for a preliminary protective design of structural components (Dragos and Wu, 2013; Fallah and Louca, 2007; Hamra et al., 2015; Hou et al., 2018; Krauthammer et al., 2008; Li and Meng, 2002; Ma et al., 2007).
However, conventional SDOF models can be used only to perform damage assessment of a structural component under a single explosion. Since terrorist attacks and unexpected explosion accidents may not be a single explosion, the development of a new SDOF model to predict blast responses under consecutive explosions is highly required.
For this reason, the resistance functions were updated to account for the permanent displacement calculated in the previous step to capture the response of the RC slab of the current explosion. Thus, the proposed model can consider a permanent deformation of a structural component. Moreover, the model can predict blast responses based on its modified resistance function due to a prior explosion.
Under the identical consecutive explosions, a comparative study with the FE analysis results is carried out to confirm an applicability of the proposed model. A one-way RC slab with the fixed–fixed supports is used as the test structure. Prior to performing the comparative study, the computational model of the target structure is calibrated based on small-scale experimental data to conduct more reliable FE analysis.
Theory
The conventional SDOF model
The equation of motion of the conventional SDOF model can be constructed based on the information on a structural continuous model (total mass

where

Relationship between (a) a structural continuous model and (b) an equivalent SDOF model.
The updated SDOF model for performing cumulative damage assessment
This section describes procedures to perform cumulative damage assessment of a structural component under consecutive explosions. To this end, a conventional idealized SDOF model [23] is modified by revising its resistance function, as shown in Figure 2.
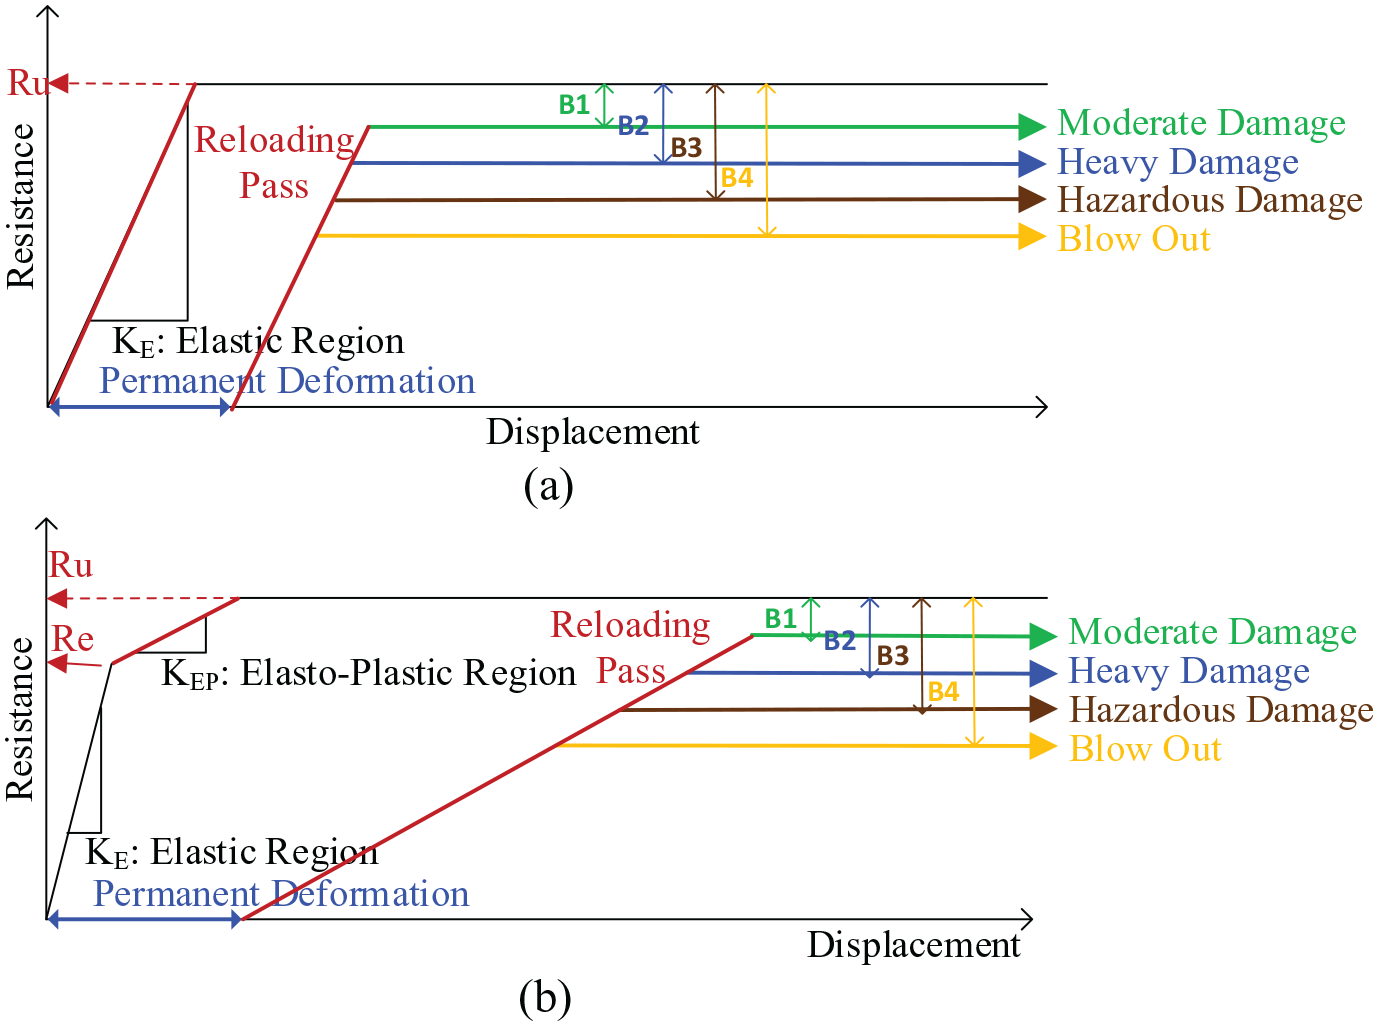
Reconstruction of the resistance function: (a) Statically determinate system and (b) statically indeterminate system.
Thus, for a statically determinate system, it is assumed that the structural component ideally behaves along the pre-constructed resistance function through the initial stiffness after a permanent deformation due to a prior explosion, as depicted in Figure 2(a). For a statically indeterminate system, this study assumes that the structural component behaves in accordance with the stiffness in elasto-plastic region if additional blast loads are applied after its yielding (U.S. Army Corps of Engineers, 2008a), as shown in Figure 2(b). The parameters such as the ultimate resistance in elasto-plastic region (Ru), the ultimate resistance in elastic region (Re), the stiffness in elasto-plastic region (KEP), and the stiffness in elastic region (KE) to construct the resistance function in Figure 2 can be calculated based on equations described in UFC-3-340-02 (2008).
In addition, this study determined the optimal values from B1 to B4 (see Figure 2) based on engineering judgments from a variety of comparative studies between SDOF analysis and FE analysis. Thus, this study recommends the values of B1(0.05 × R), B2(0.15 × R), B3(0.5 × R), and B4(0.75 × R), respectively. Here, B1, B2, B3, B4 are the damage criteria for moderate damage, heavy damage, hazardous damage, blow out (U.S. Army Corps of Engineers, 2008b). Since the values were determined based on engineering judgments, the values may be changed to more optimized values based on additional comparative data set. For this reason, the proposed SDOF model has a disadvantage that the reliability of the model depends on FE analysis results. Thus, if FE analysis results are incorrect, the reliability of the proposed model also decreases.
The process to determine the optimal values of B1 to B4 for the SDOF model based on the FE analysis results is as follows:
During the FE analysis, gradually increase the magnitude of the applied blast loads (i.e. inputs) and evaluate the damage levels (i.e. outputs) based on the damage criteria described in U.S. Army Corps of Engineers (2008b).
Accumulate the database by repeating the process (1).
Construct the SDOF model corresponding to the FE model used in processes (1) and (2).
Define the inputs and outputs of the SDOF model by using the inputs and outputs stored in the database of the FE analysis results.
Modify the resistance function of the SDOF model based on the inputs and the outputs.
Determine optimal B1 ~ B4 that minimize the error between the FE analysis results and the SDOF analysis result using the modified resistance function.
In the case of an RC slab, most of the actual structures are constructed with a statically indeterminate system. Thus, this study only considers an RC slab having the resistance function in Figure 2(b). In other words, this study considers rather idealized SDOF model based on the resistance function in Figure 2(b) to predict cumulative damages for an RC slab.
In Figure 2, the ultimate resistance (Ru) of a one-way structural component is determined by the boundary condition, the length (L), and the distribution of the moment capacity (Mu). The examples of the ultimate resistance for a one-way structural component are in Table 1.
Ultimate resistance of a one-way structural component (UFC-3-340-02, 2008).
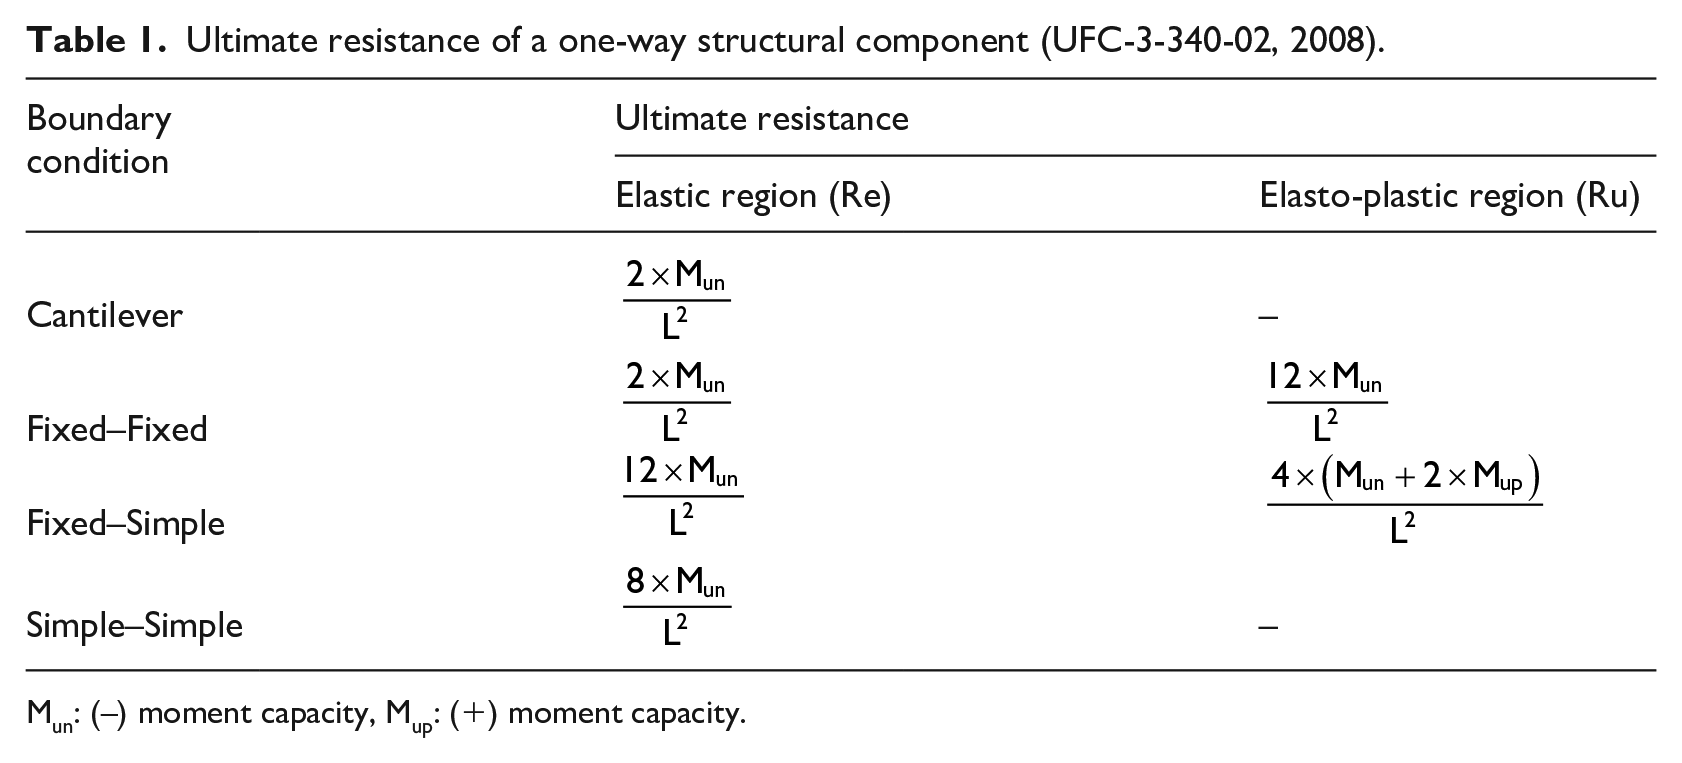
Mun: (–) moment capacity, Mup: (+) moment capacity.
The stiffness is the slope of the resistance function. It depends on the boundary condition, the elastic modulus (E), the moment of inertia (I) of a structural component and others. The examples of the stiffness of a one-way structural component are shown in Table 2.
Stiffness of a one-way structural component (UFC-3-340-02, 2008).
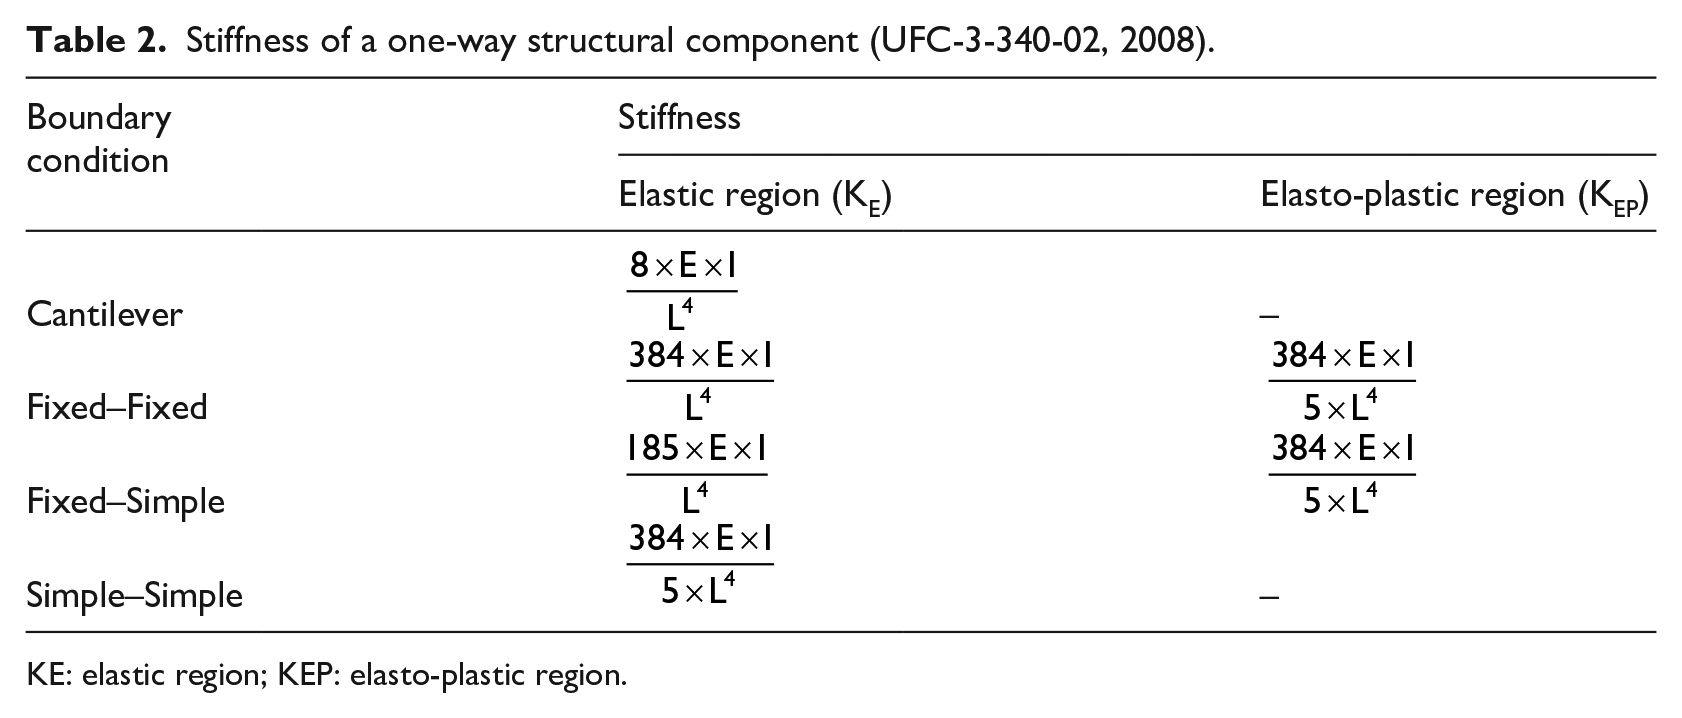
KE: elastic region; KEP: elasto-plastic region.
The procedure to perform the cumulative damage assessment based on the proposed SDOF model is as follows:
Evaluating the permanent deformation according to the prior explosion by examining the time–displacement curve which is the output of the SDOF analysis.
Revising the resistance function according to the estimated damage level, as shown in Figure 2.
Performing SDOF analysis based on the revised resistance–displacement curve in step 2 under the next explosion.
Evaluating the maximum deformation according to the explosion by examining the time–displacement curve.
Performing the cumulative damage assessment of a structural component based on the sum of the permanent deformation (obtained from the first procedure) and the maximum dynamic response (obtained from the third procedure).
The flow chart to assess cumulative damages based on the proposed SDOF model is shown in Figure 3. In Figure 3, if the target structure has no permanent deformation, the value of the permanent deformation is defined as zero.
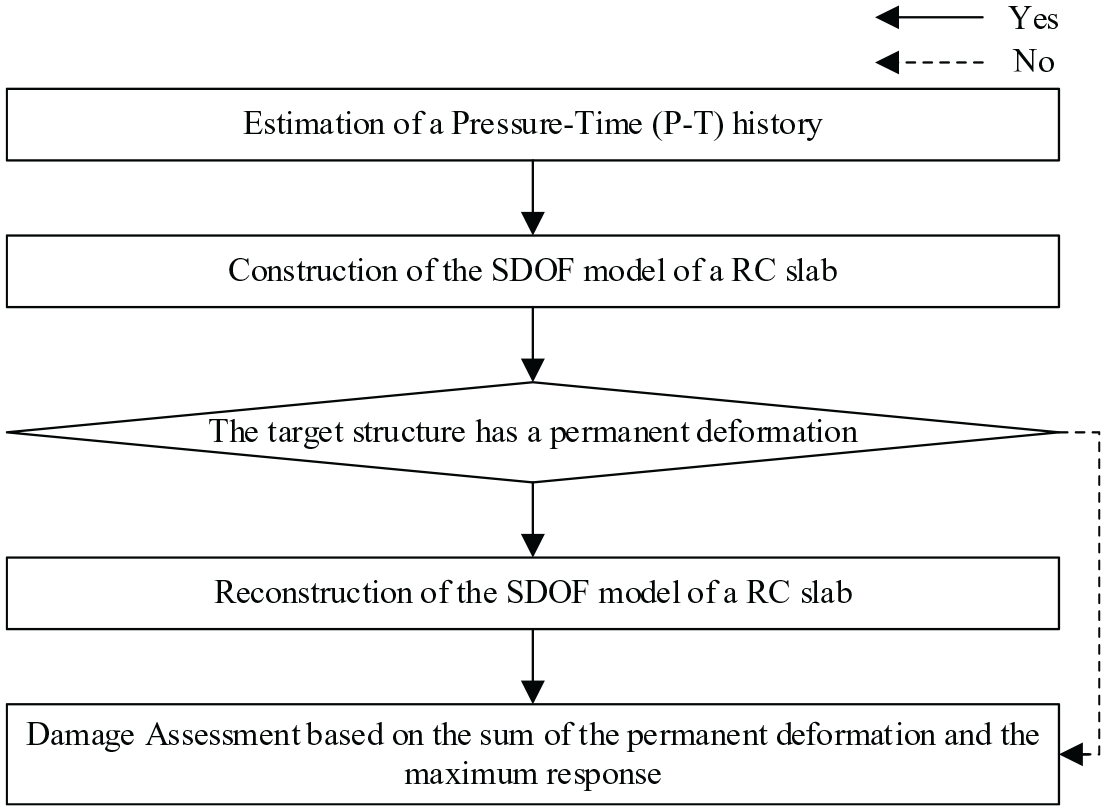
Flow chart to assess cumulative damages based on the proposed SDOF model.
Preliminary experiments
Experimental setup
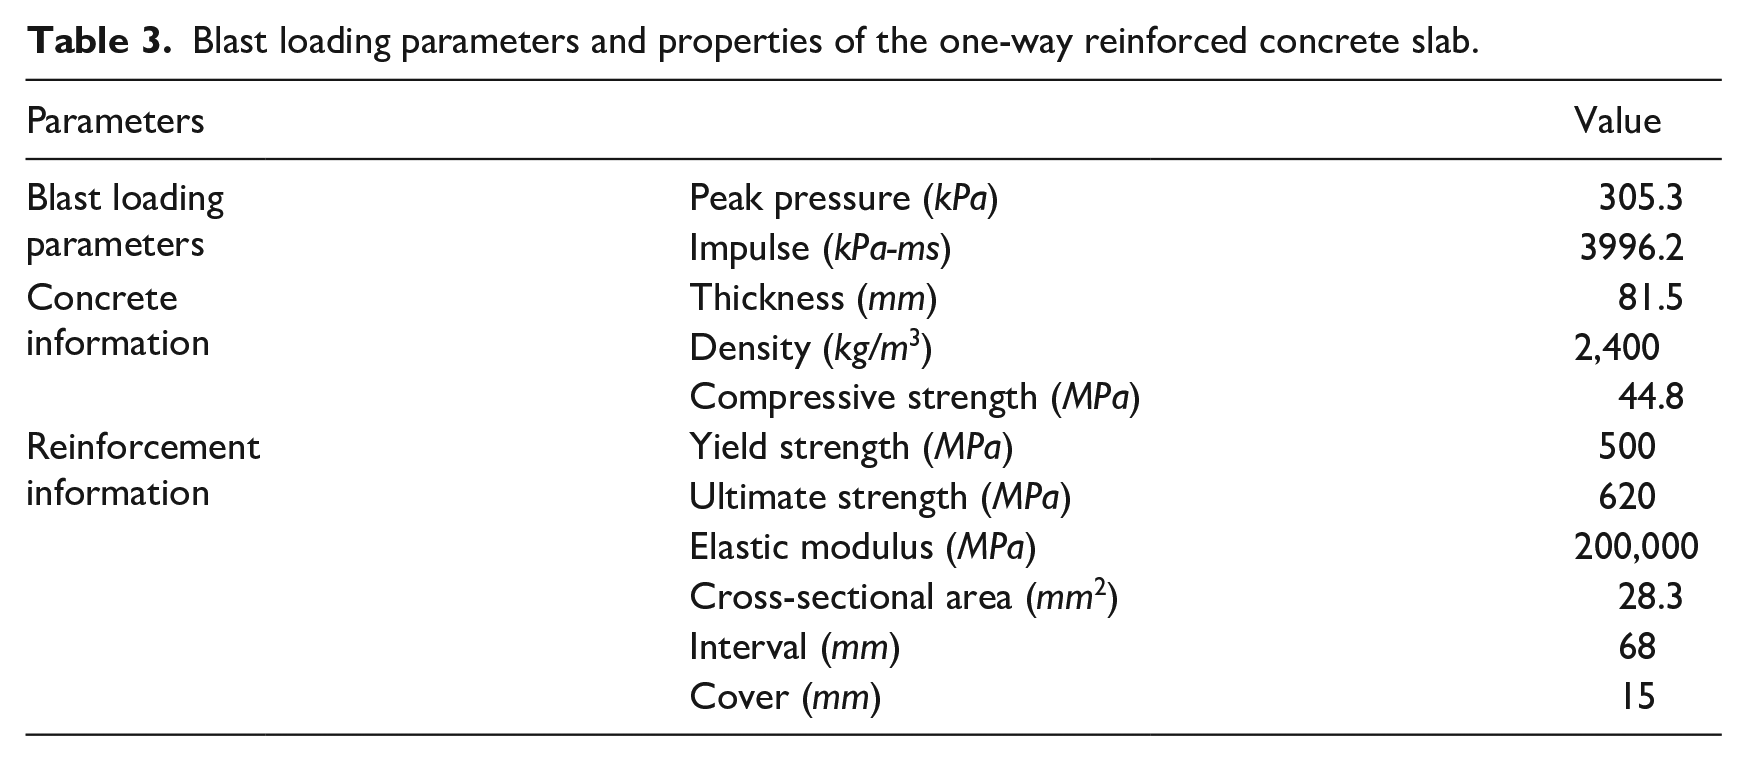
To calibrate FE model, the preliminary experiments were carried out. For the experimental investigation, an RC slab has been tested in an air blast shock wave tunnel for their structural responses to air blast loading. The experimental setup is shown in Figure 4. The test structure is supported with two bolts in each boundary to hold the test structure. Two pressure sensors are deployed on each side of the test structure, as shown in Figure 4(a). A laser-type displacement sensor is placed at the center of the test structure on the back face, as shown in Figure 4(b). Experiments were performed with the 0.6 kg TNT and the 21-m stand-off distance. Properties of the one-way RC slab, blast loading parameters, and pressure–time history which was measured from then installed pressure sensors (see Figure 4(a)) are described in Figure 4(c), Table 3, and Figure 5.

Experimental setup: (a) Front view, (b) side view, (c) details of the target structure, (d) TNT shape.
Blast loading parameters and properties of the one-way reinforced concrete slab.

Pressure–time history applied to the test structure.
FE model mesh calibration
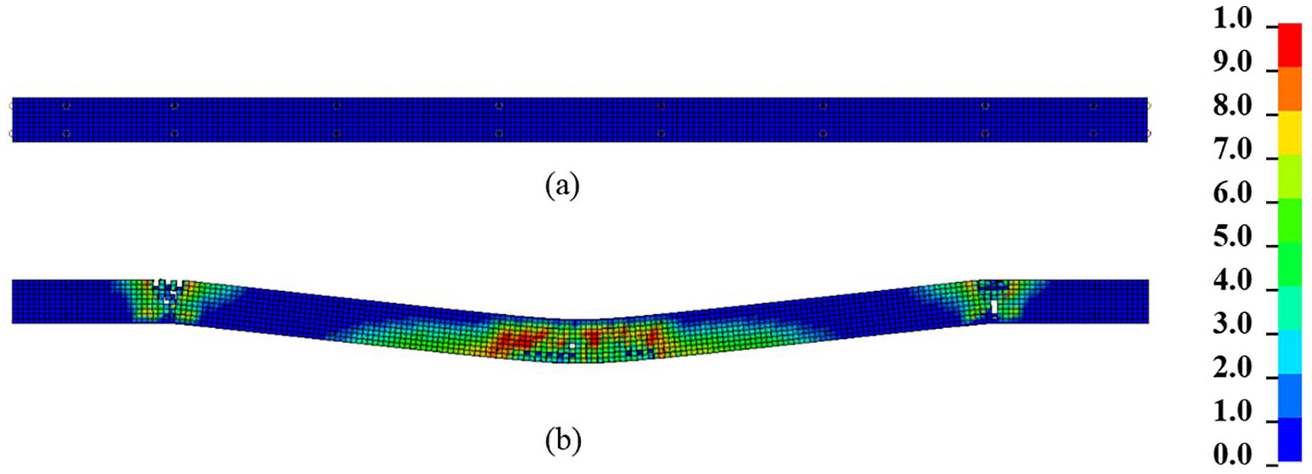
LS-DYNA software was used for FE model mesh calibration. Figure 6 shows the computational model of the target structure for FE analysis. Its concrete and fixed supports were modeled by solid element, and beam element was used for reinforcement modeling. In addition, a symmetric model was considered to save analysis time. The concrete element and the reinforcement element were coupled for their simultaneous behavior using constrained Lagrange in solid keyword (LS-DYNA, 2017). The scaled distance at the end of the target structure is about 24.91 kg/m3, and the scaled distance at the center of the target structure is about 24.89 kg/m3. That is, since the difference is very small, it can be assumed that uniformly distributed loads act on the structure.

FE model for the target structure (a) side view and (b) front view.
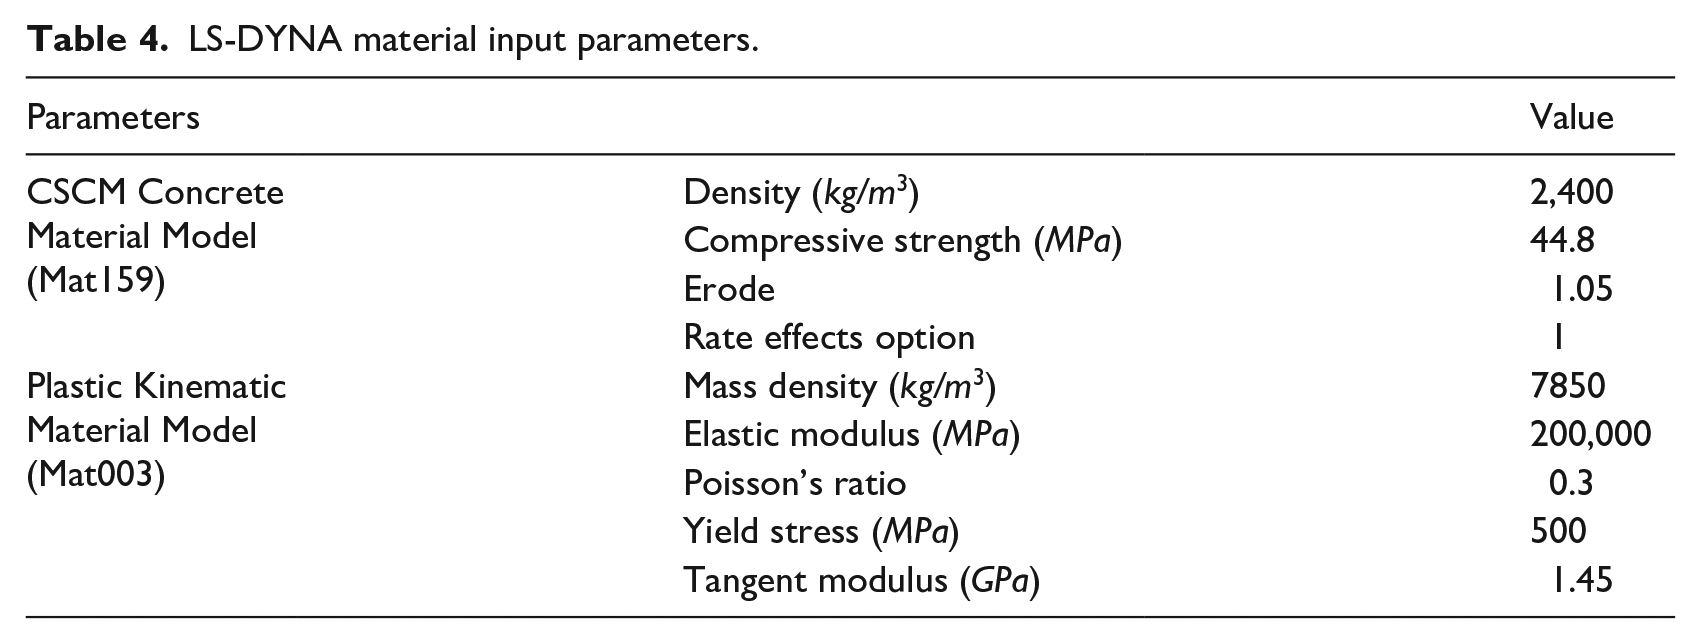
Table 4 describes the material input parameters for the concrete and the reinforcement (Brannon and Leelavanichkul, 2009). Here, CSCM concrete keyword was used for the concrete material model which is cap model with a smooth intersection between yield surface and gardening cap. The model can consider strain rate effect. Plastic kinematic keyword was used for the reinforcement material model. Moreover, rigid keyword was used for fixed supports. FE model calibration was carried out by adjusting concrete element size. When 10 mm mesh size was used, the error of the maximum responses at the center of the target structure between preliminary experiment result and FE analysis result was about 0.29% under the identical uniformly distributed blast loads, as shown in Figure 7. Moreover, their permanent deformations coincided well each other. For this reason, 10 mm concrete element size was used, and a permanent deformation shape of FE model under stable condition is depicted in Figure 8.
LS-DYNA material input parameters.

Displacement–time histories for test result, FE analysis result, and SDOF analysis result.
Deformation of the target structure (a) initial condition and (b) permanent deformation.
In addition, SDOF analysis was carried out to confirm the maximum response error between SDOF analysis result and FE analysis result. The maximum response error was about 8.5% with respect to the FE result, as shown in Figure 7.
Numerical simulation
A series of numerical simulations were carried out to confirm a feasibility of the proposed SDOF model. The target structure is the same model described in “Preliminary experiments” section. Thus, the calibrated FE model was used for the comparison with SDOF analysis result. For an SDOF model, a resistance function of the SDOF model can be modified when a permanent deformation occurs, as shown in Figure 2. The SDOF model coefficients are described in Table 5.
SDOF model coefficient.

SDOF: single degree of freedom; KEP: elasto-plastic region; KE: elastic region.
Finally, the SDOF analysis results were compared with FE analysis results. The detailed information on the properties for the SDOF analysis and FE analysis was already described in Tables 1 and 2, respectively.
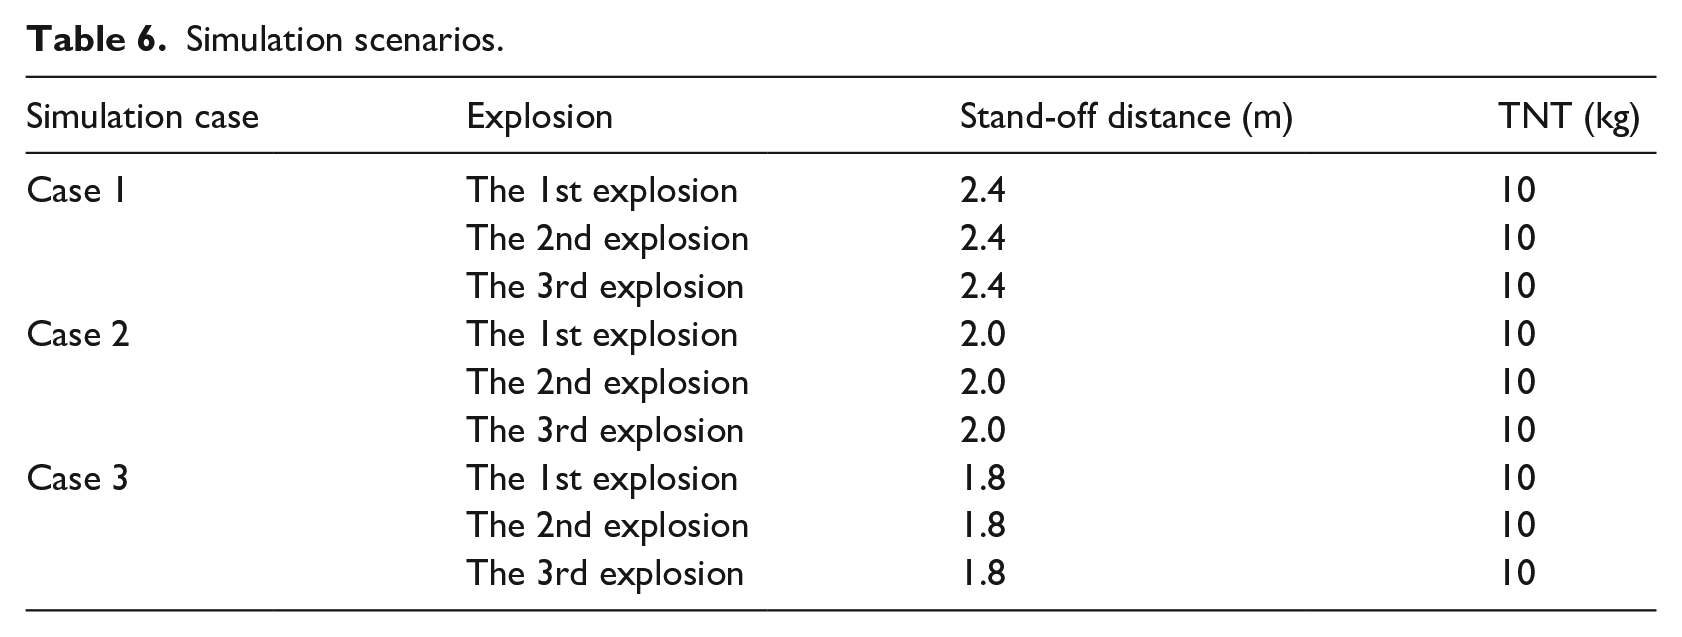
Numerical simulations were performed for three cases. In this study, it was assumed that for the consecutive explosion simulation, the same amount of TNT was detonated three times in the same position. Under the circumstances, a total of three cases were simulated as shown in Table 6. Pressure–time histories for each simulation case are depicted in Figure 9. Thus, in FE model and the SDOF model, the blast loads established from LS-DYNA software using Load Blast Enhanced Keyword were used as the input loads. For all numerical simulations, the same blast loads were applied to simulate the consecutive explosions until the target structure was blown out. The dynamic increase factor (DIF) for the concrete and for the reinforcement of the SDOF model was based on the values given in the literature (Malvar and Crawford, 1998a, 1998b) to consider strain rate effect. Thus, the values of 1.19 for the concrete and 1.33 for the reinforcement were used, respectively.
Simulation scenarios.

Pressure–time histories for each numerical simulation.
For Case 1, numerical simulation was carried out using a 10 kg TNT under four consecutive explosions at a 2.4-m stand-off distance. Figure 10 shows blast responses predicted by FE analysis and the SDOF model. As shown in the figure, the structural component was evaluated as heavy damage (U.S. Army Corps of Engineers, 2008b) in both simulations after the first detonation, and the dynamic responses were very similar each other. From the second detonation to the fourth detonation, damage levels were identically estimated as heavy damage, hazardous damage, and blow out, respectively. In this case, the maximum error between the maximum responses was about 16.9% with respect to FE analysis result after the second detonation.
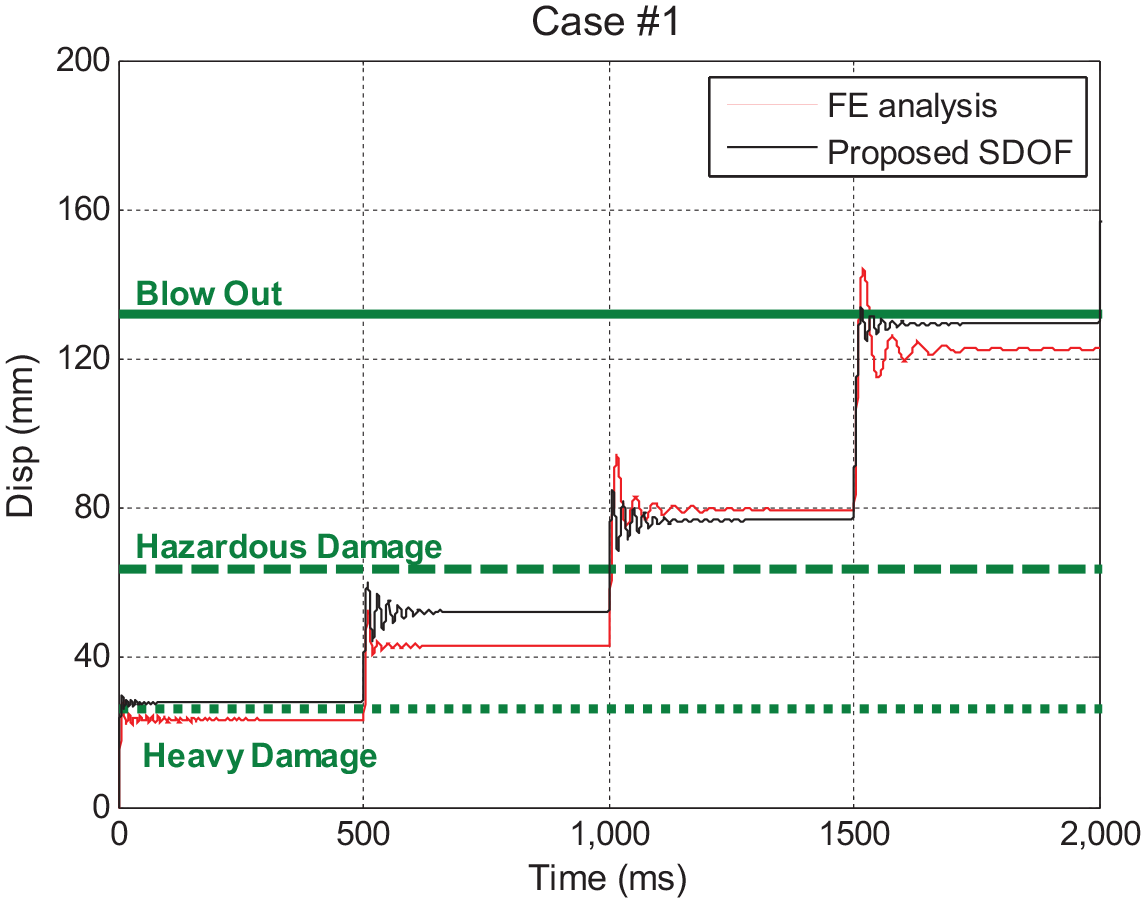
Numerical simulation results for Case 1.
For Case 2, numerical simulation was performed using a 10 kg TNT under three consecutive explosions at a 2-m stand-off distance. As shown in Figure 11, both SDOF analysis and FE analysis identically estimated the damage levels against the three consecutive explosions. In this case, the maximum error between the maximum responses was about 11% after the second detonation. However, it was clear that the dynamic response convergence shapes after blow out threshold were different each other, similar to the Case 1.
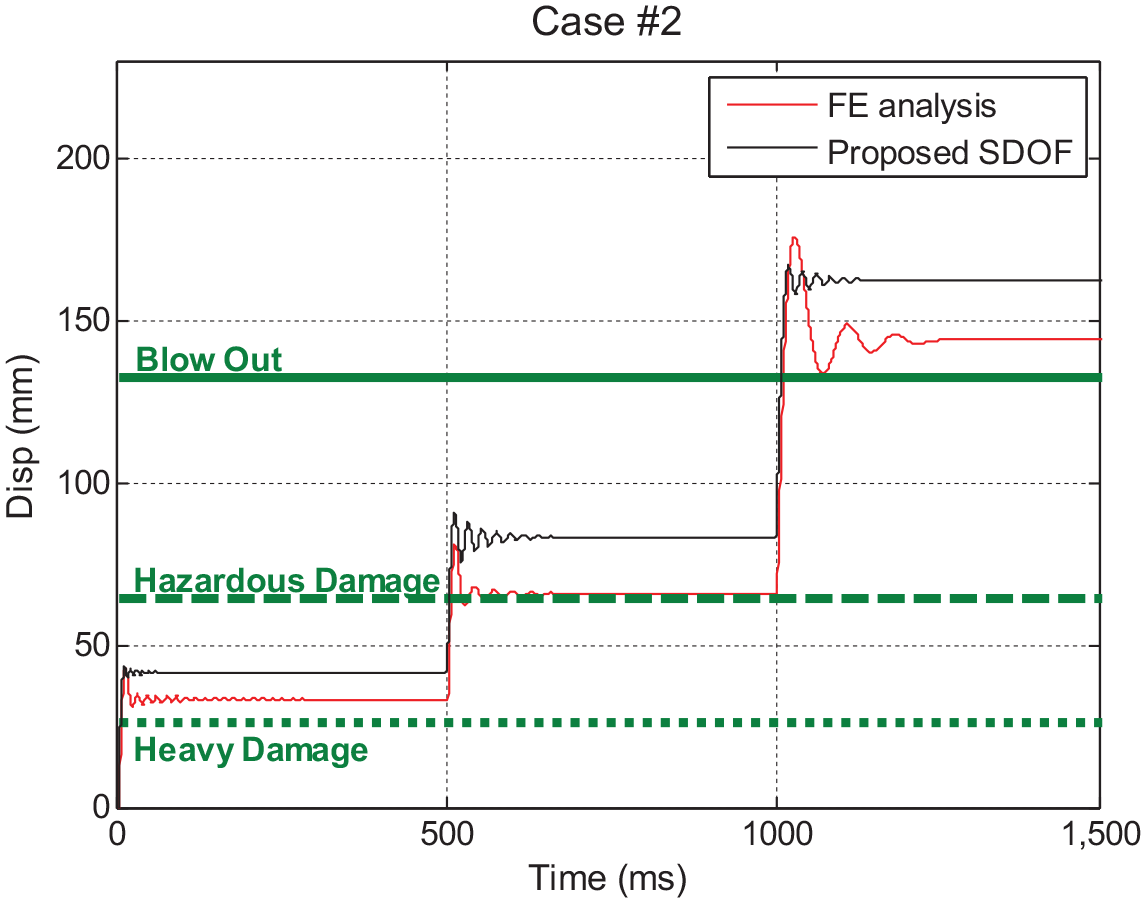
Numerical simulation results for Case 2.
For Case 3, numerical simulation was carried out using a 10 kg TNT under three consecutive explosions at a 1.8-m stand-off distance. Both SDOF analysis and FE analysis identically evaluated the damage levels of the structural component after each explosion, as depicted in Figure 12. The maximum error between the maximum responses was about 3.7% after the third detonation.
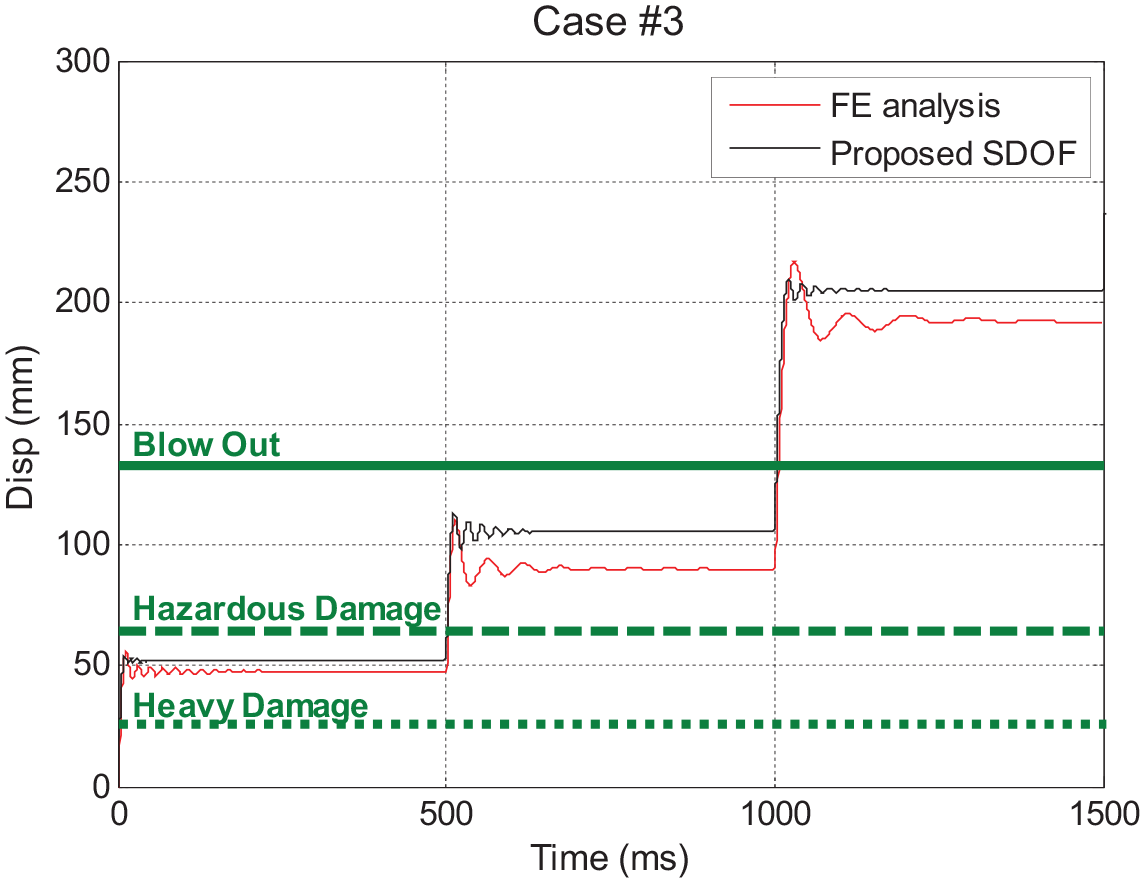
Numerical simulation results for Case 3.
From a series of numerical simulations, it was found that the proposed SDOF model can rapidly and reliably carry out the cumulative damage assessment.
However, the proposed SDOF model has a limitation to predict exact dynamic responses compared with the hydro-code simulation tool. The SDOF model is derived on the assumption that it is subjected to uniformly distributed loads. Moreover, it is impossible to obtain the same results as the FE analysis results, because the SDOF model uses a rather idealized resistance function as shown in Figure 2. In addition, since the SDOF model applies the strain rate effect as a constant value, the errors in the results are inevitable.
For this reason, if sufficient time and cost are given, it is advantageous to use the hydro-code simulation tool. On the contrary, the proposed SDOF model is useful when a user wants to quickly check the trends in various simulation cases.
Conclusion
This study confirmed a feasibility of the cumulative damage assessment method based on SDOF model.
A preliminary test was carried out using the one-way RC slab to calibrate its computational model for reliable FE analysis. The test structure was supported with two bolts in each end to hold the test structure. Two pressure sensors and a laser-type displacement sensor were installed to measure physical properties. The properties were used for an FE model calibration.
A series of numerical simulations were carried out. The test structure was same with the preliminary test model. Numerical simulation was carried out for three cases varying the stand-off distance for a 10 kg TNT.
The numerical simulation results from SDOF model were compared with FE analysis results. From the comparative study, it was found that the proposed SDOF model can quickly and reliably perform the cumulative damage assessment.
However, the proposed SDOF model has a limitation to predict exact dynamic responses compared with the hydro-code simulation tool.
In conclusion, the proposed SDOF model can quickly and reliably perform the cumulative damage assessment. However, it should be noted that the proposed SDOF model may induce errors with respect to FE analysis results in terms of the exact dynamic response prediction. In other words, if a user wants to predict relatively accurate dynamic responses, it is advantageous to use the hydro-code such as Autodyn, LS-DYNA, and so on. On the contrary, if a user wants to rapidly confirm the tendency of the cumulative damages, the proposed SDOF model can be used for a predictive approach.
Footnotes
Declaration of conflicting interests
The author(s) declared no potential conflicts of interest with respect to the research, authorship, and/or publication of this article.
Funding
The author(s) received no financial support for the research, authorship, and/or publication of this article.
