




Abstract
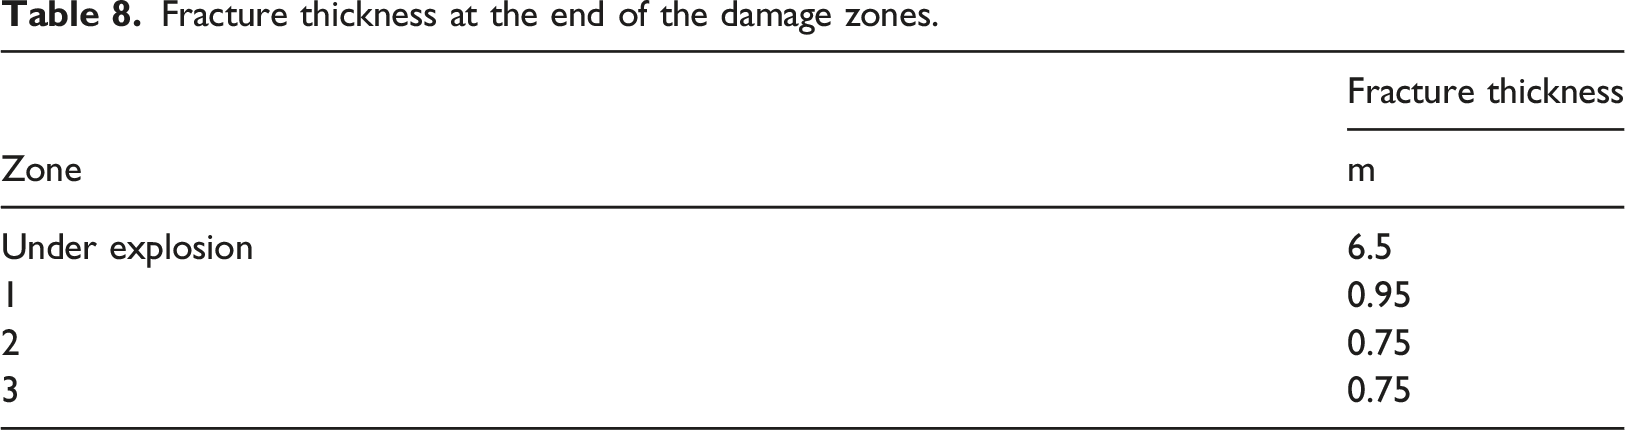
The field tests conducted by the American Engineering Research Associates (ERA) provided important results about the distribution and extension of the damage zones and the failure area that occurred in unlined tunnels as a result of buried explosions in the rock mass surrounding these tunnels. Despite the importance of these results, they did not include specific values for the failure thickness and the fracture angle in the damaged tunnel sections. In the current study, a 3D numerical model is used to simulate one of ERA’s tests using ABAQUS. In this model, the impact of a buried explosion on a tunnel located at (5m) away from the center of the detonation is studied. The results of this model are in good agreement with the published results of ERA’s tests. In addition, the current numerical results give complete values for the change in the failure thickness and the fracture angle over the entire length of the damaged zones of the tunnel. The results of the current study show that the thickness of the failure remains almost constant beyond damage zone 1, while the angle of the fracture decreases remarkably as the charge-to-tunnel distance increases, which causes a decrease in the failure area.
Keywords
Introduction
The methods used to study the effect of explosions on underground facilities can be classified into three groups:
Field tests
The field test was the first method that has been used to study the impact of explosions on underground facilities. Its use is currently limited, due to its high costs and negative side effects. Mishra et al. (2021) considered that the use of field tests to study the effect of explosions on tunnels is a very dangerous, expensive, and useless process in civilian research. Qian et al. (2021) considered that field tests are very expensive and time-consuming. Although there are few published field test results, they are necessary to calibrate and evaluate the results of other methods.
The most comprehensive field tests to study the effect of external explosions on unlined tunnels in rock media were carried out between 1948 and 1952 by the Engineering Research Associates (ERA), and ordered by the US Army Corps of Engineers and the US Bureau of Mines, (Mitelman, 2015).
From 2000 to 2001, several large-scale tests were conducted in a rock tunnel facility in Älvdalen, Sweden. These tests were performed to validate the safety design for underground explosives storage, including response of tunnels, (Zhou, 2011).
Shirzadegan et al. (2016) conducted a series of five large-scale dynamic tests at the LKAB Kiirunavaara mine to develop a testing methodology for in situ testing of ground support.
Laboratory tests
This method is widely used at the present time despite its high cost, the need for special equipment and the difficulty of forming rock models. It is a good alternative in order to overcome the difficulties of field experiments on a large scale (Mishra et al., 2021). In addition, it is necessary to conduct such tests since we are in the early stages of understanding the mechanism of rock failure due to explosions, (Liu et al., 2019).
Hayes (1989) conducted a series of small-scale tests to study the response of buried structures to blast loading in various backfill soil conditions.
De and De et al. conducted centrifuge tests to study the effect of surface blast on buried structures, (Koneshwaran, 2014).
Zhou et al. (2021) studied the dynamic response and failure styles of urban utility tunnel under repetitive explosions.
Numerical simulation
Currently, the numerical simulation is the most widely used method for studying the impact of explosions on buried facilities because of its low costs and its high speed in completion, although it requires complex models to estimate the loads and materials response.
In this method, a numerical model is built. Its results are calibrated with the results of field or laboratory tests. The flexibility and importance of numerical modeling are proved because through the calibrated model it is possible to study various materials and different engineering properties of the same site, (Ma et al., 2011). In addition to that, it is possible to apply the model in order to understand the dynamic behavior of materials under the influence of different conditions that cannot be perceived and understood in experiments, (Liu et al., 2019).
Saharan and Mitri (2008) performed a nonlinear numerical modelling for blast-induced rock fracturing by using the brittle cracking model in ABAQUS. Xiao et al. (2011) tested the ability of ABAQUS program to comprehensively simulate the impact of explosions on buried facilities. They concluded that the program could be used to study this problem. Xu et al. (2014) studied the formation of cracks near a tunnel as a result of the explosion using 1-D and 2-D models.
One of the important numerical models was presented by Mitelman (2015), where he built a 2-D numerical model using ELFEN program, and calibrated his model depending on the results of ERA tests.
Barkhordari and Zarch (2017) presented a numerical model to study the effect of surface blasting on subway tunnels using FLAC. Wang et al. (2020) studied the cumulative damage of underground caverns as a result of four consecutive explosions. An et al. (2020) developed a two-dimensional numerical model to study the excavation damaged zone formation process induced by blasts in a deep tunnel. Liu et al. (2021) studied the dynamic responses of three kinds of crossing type caverns subjected to ground shock by numerical simulation.
Zaid et al. (2021) built a three-dimensional numerical model using ABAQUS to study the effect of internal explosion on a tunnel in two types of rocks. Sadique et al. (2021) also built a three-dimensional numerical model using ABAQUS to study the effect of internal explosion on a tunnel in three types of rocks. Zaid and Sadique (2021) analyzed the stability of underground metro tunnels constructed in different rock types under the effect of internal blast.
Alsabhan et al. (2022) studied the behavior of rock tunnels against missile impact using ABAQUS. Shoeb et al. (2022) studied the internal blast effect on a tunnel constructed in three layered shale rock.
The scarcity of 3D numerical models used to study the effect of external explosions on rock tunnels is noticeable in literature. It is also noted that very limited studies on the collapse of tunnel surroundings under internal and external explosions have been conducted, (Cheng et al., 2021). Determining the blast-induced damage distribution around unsupported rock tunnels, that is, failure thickness and fracture angle, is necessary in order to understand the response of the tunnel under explosion loads towards a reliable blast-resistant design of tunnel support.
In the current study, a three-dimensional numerical model is built using ABAQUS program to simulate one of ERA field tests. In this model, the brittle cracking model is used to represent the behavior of the rock. The results of the model are calibrated with the published results of ERA’s tests in terms of: the radius of the surface crater, the extension of the damage zones in the tunnel, the peak particles velocity and the failure area at the end of each damage zone. Finally, as a result of this simulation, an equation to calculate the decreasing fracture angle with increasing distance from the detonation center is found.
ERA tests results
The most comprehensive field tests to study the effect of external explosions on unlined tunnels in rock media were carried out between 1948 and 1952 by the Engineering Research Associates (ERA). Based on these tests' results, the tunnel damage was divided into four zones according to the scaled distance from the detonation center, as shown in Figure 1 and Table 1. Distribution of blast-induced damage zones in a rock tunnel (EM 1110-345-434 USA Corps of Engineers Manual, 1961b). Maximum scaled distance of the end of tunnel damage zones in sandstone (EM 1110-345-434 USA Corps of Engineers Manual, 1961b).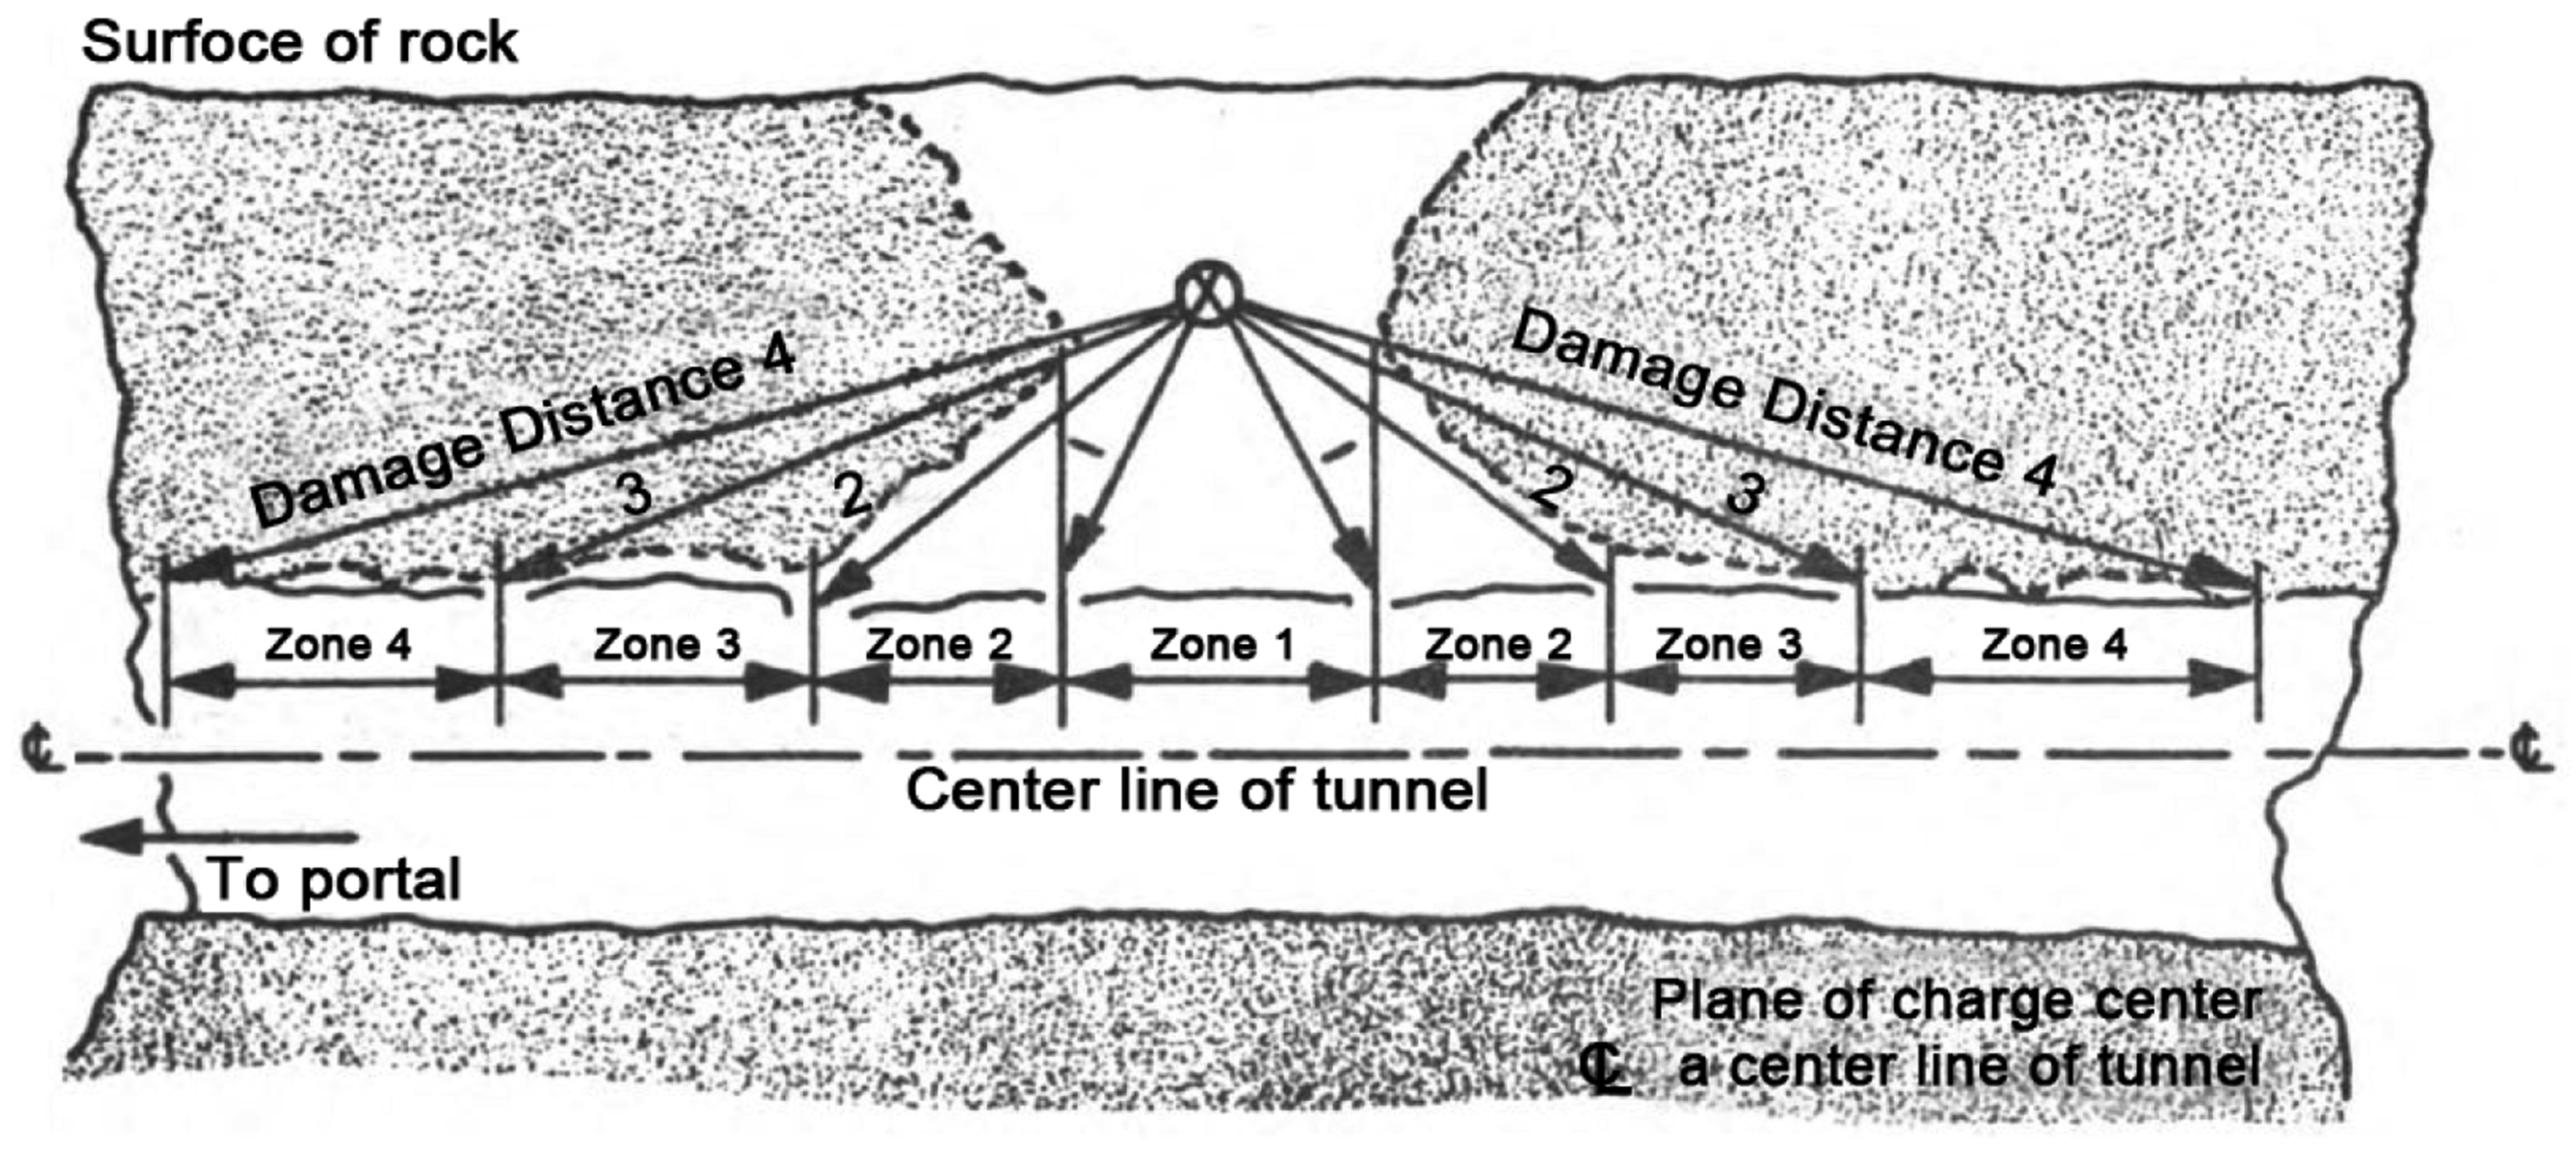
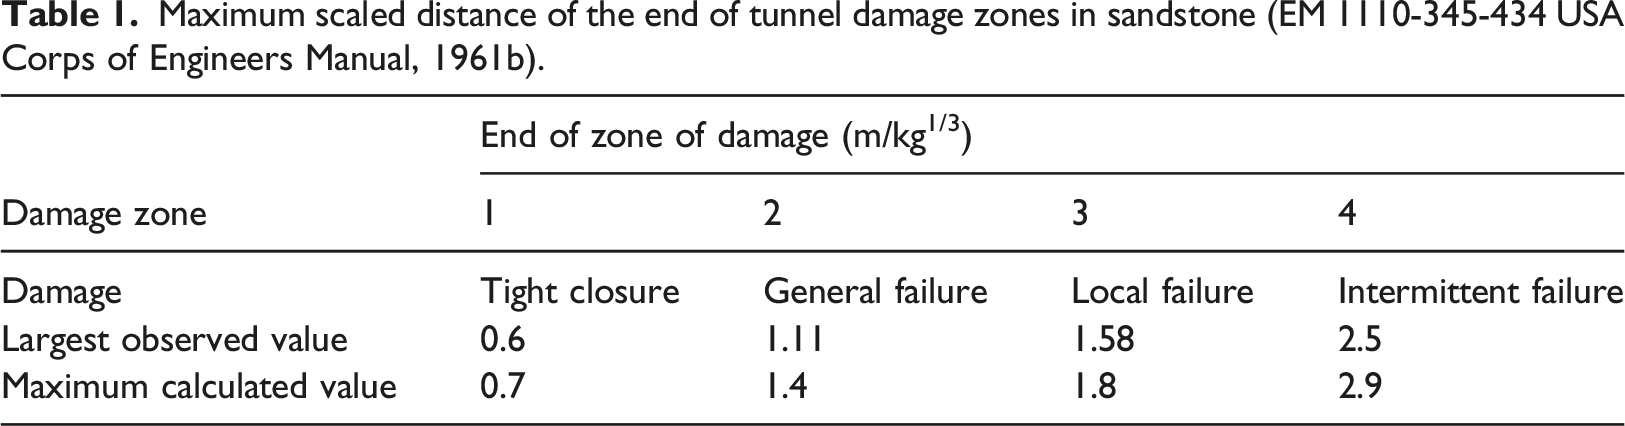
Table 1 shows the scaled distance of the maximum end measured in the tests for each damage zone in sandstone, that is for explosives detonated at a scaled burial depth of (0.144 m/kg1/3) against tunnels with a scaled diameter of (0.174 m/kg1/3).
Table 1 also shows the maximum scaled distances that were calculated based on the so-called maximum radius of rupture, which occurs when the explosive is buried at the maximum depth that produces damage at the surface.
The detonation of an explosive buried in a rock mass surrounding a tunnel does not necessarily mean that all four damage zones will be formed. This is related to charge-to-tunnel distance. As this distance is increased, the number of resulting damage zones decreases, until this distance becomes enough to prevent any failure in the tunnel.
In addition to the previous ERA results, Figure 2 was presented to calculate the percentage of failure area as a function of the scaled distance from the charge center, for tunnels with a scaled diameter of (0.174 m/kg1/3) or less. The effect of scale charge-to-tunnel distance and tunnel diameter on the maximum tunnel damage area (EM 1110-345-434 USA Corps of Engineers Manual, 1961b).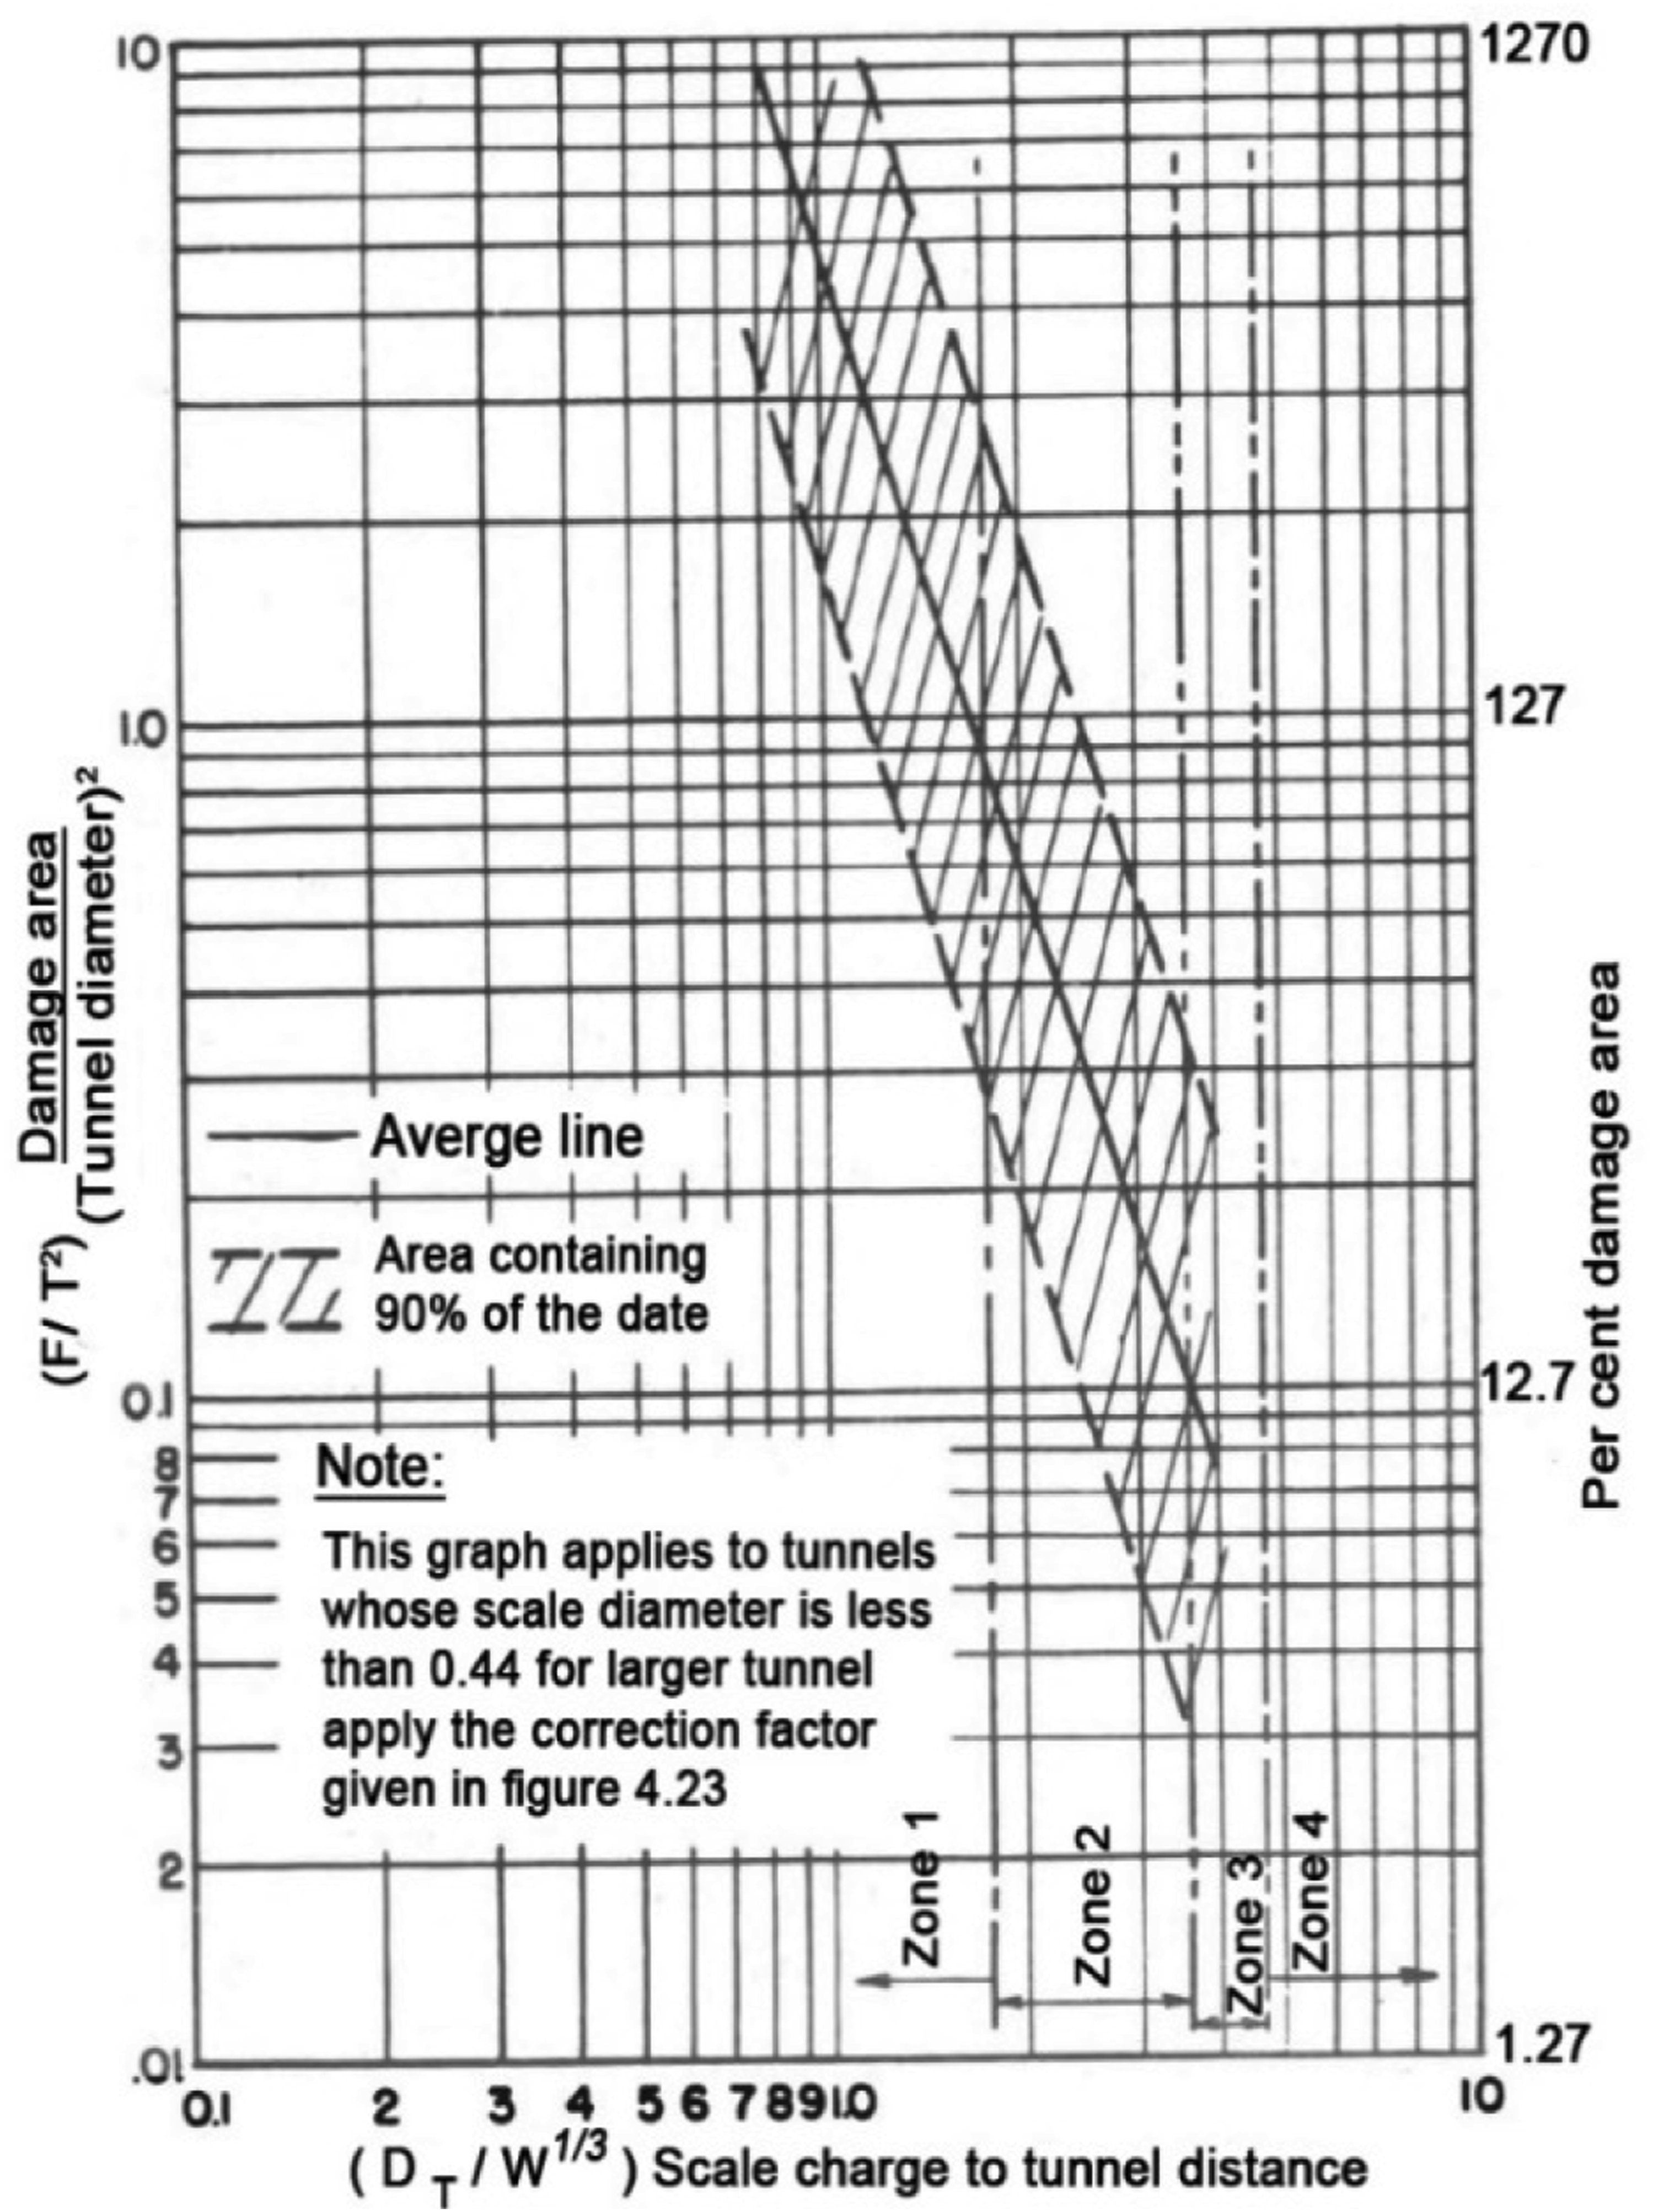
Model setup and material properties
Most of ERA field tests were carried out for explosives with scaled burial depth equal to (0.144 m/kg1/3) against a scaled tunnel diameter equal to (0.174 m/kg1/3), including test No. (811) mentioned in EM 1110-345-432 USA Corps of Engineers Manual, (1961a). In this test, a spherical TNT (Trinitrotoluene) charge was detonated against a circular tunnel in sandstone. This test is simulated in the current study using a 3D numerical model. Because of the symmetry, only a quarter of the model will be used in order to reduce the size of the model, the number of the elements and the analysis time, as shown in Figure 3. 3D numerical model and the location of the explosive.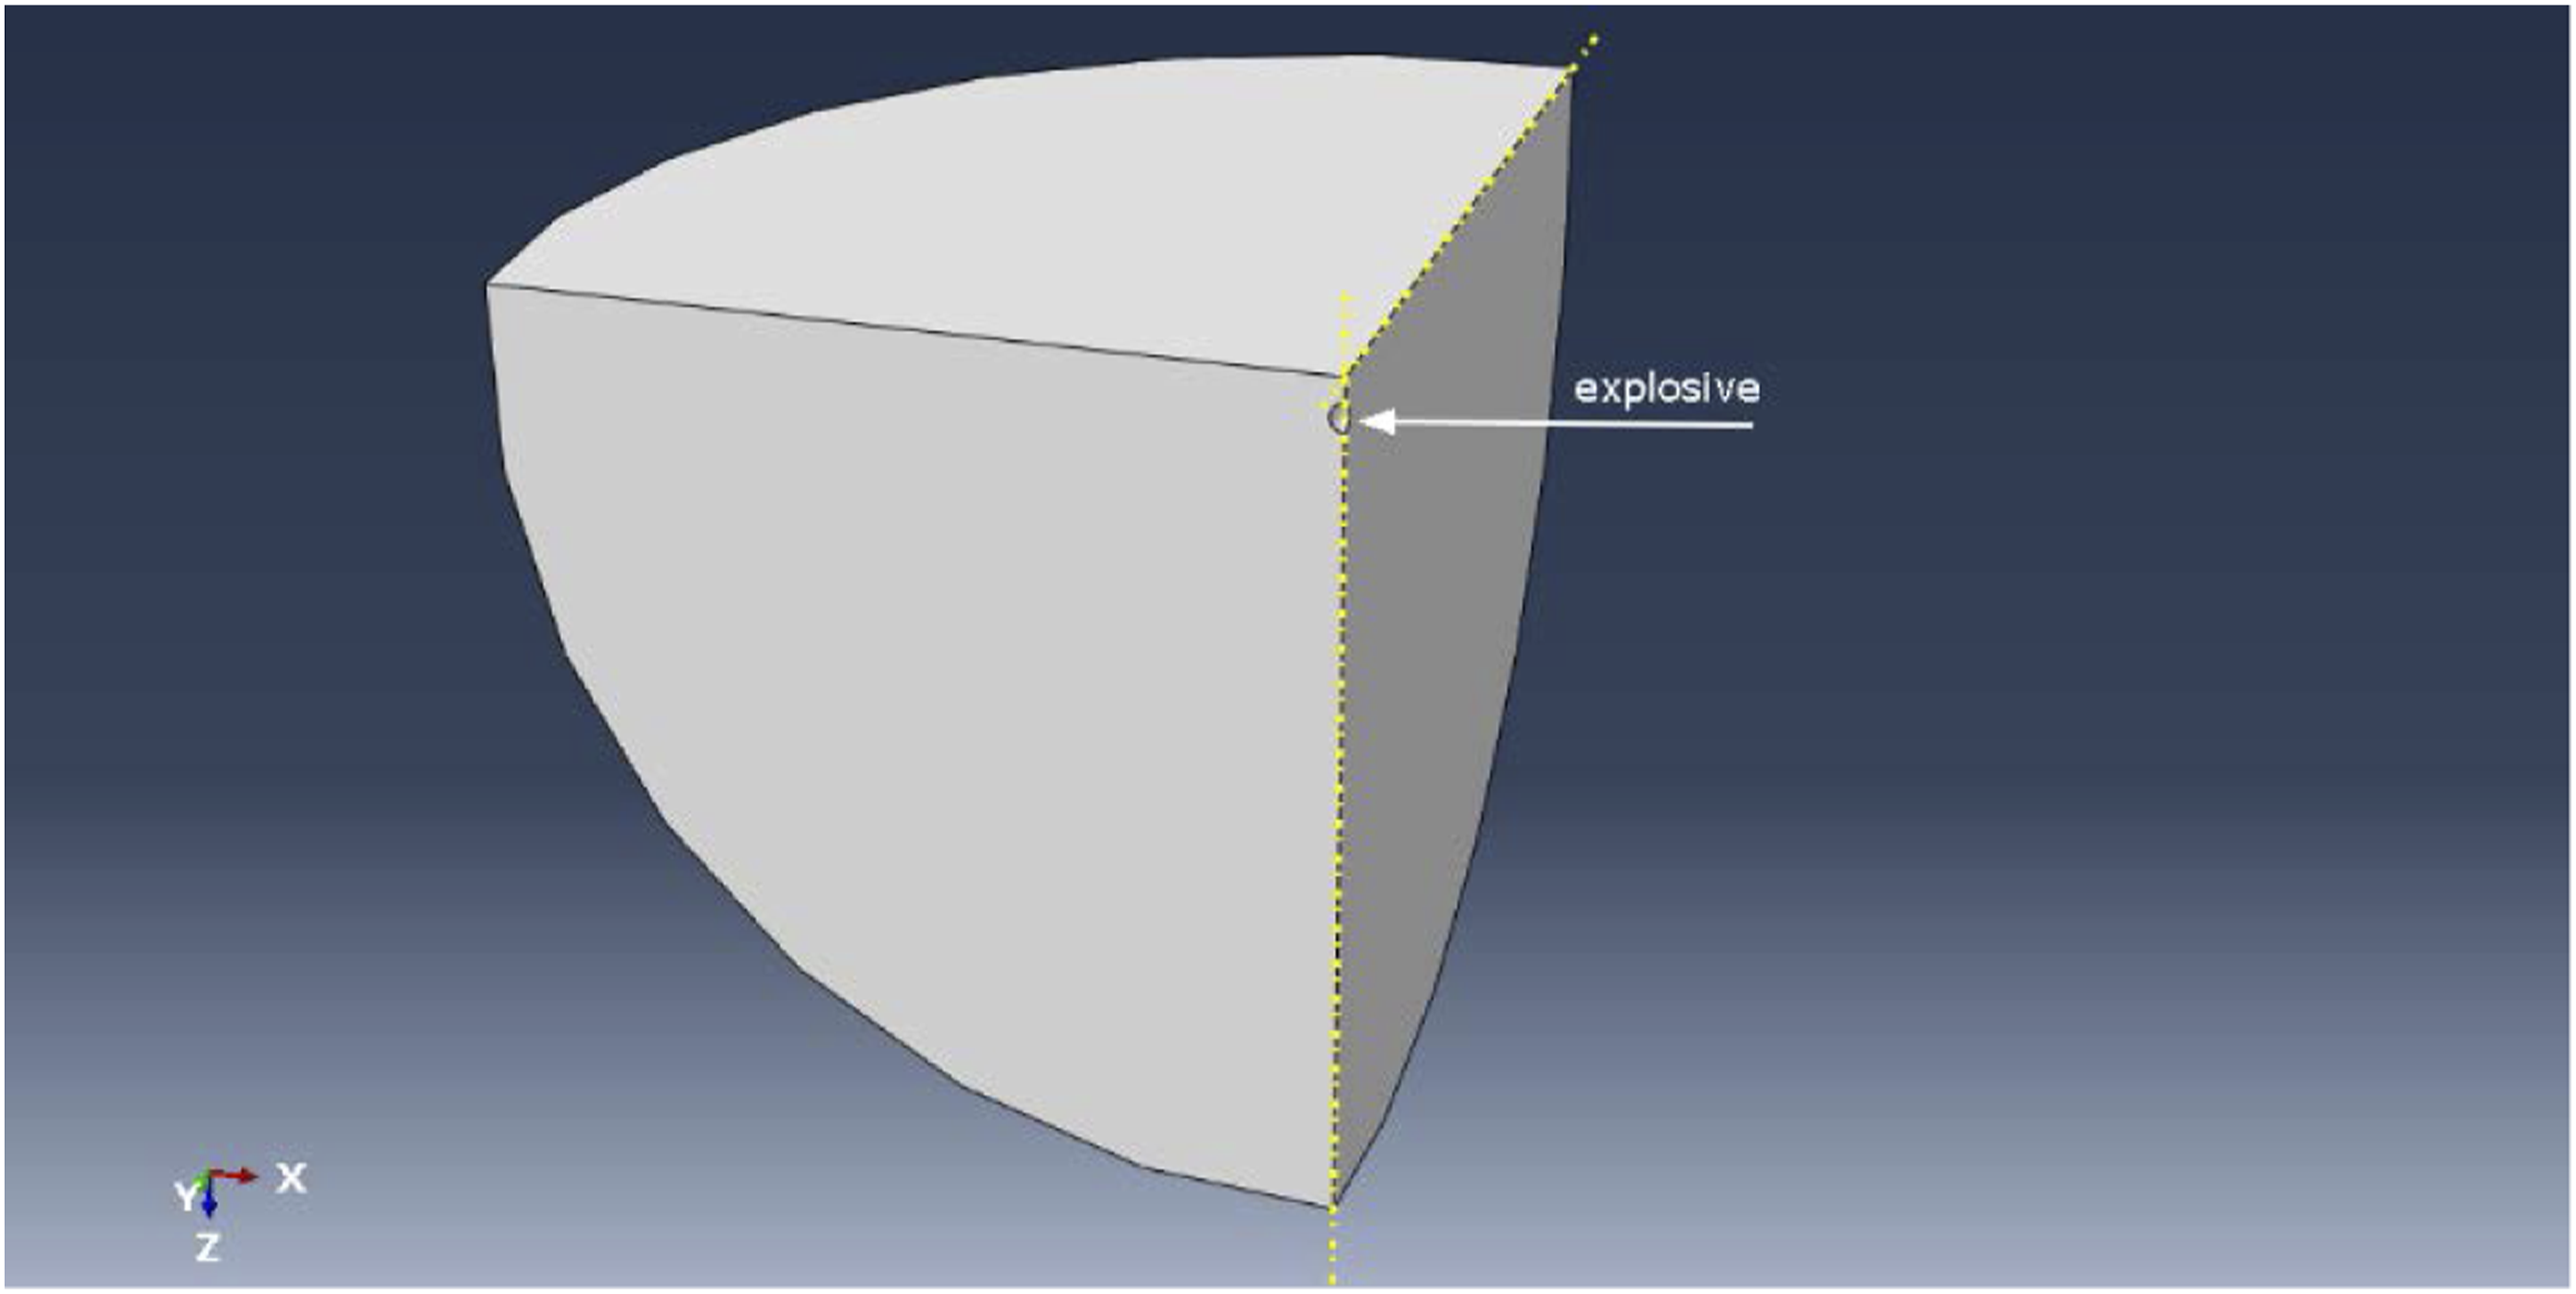
JWL parameters used for modeling TNT explosive (Larcher, 2007).
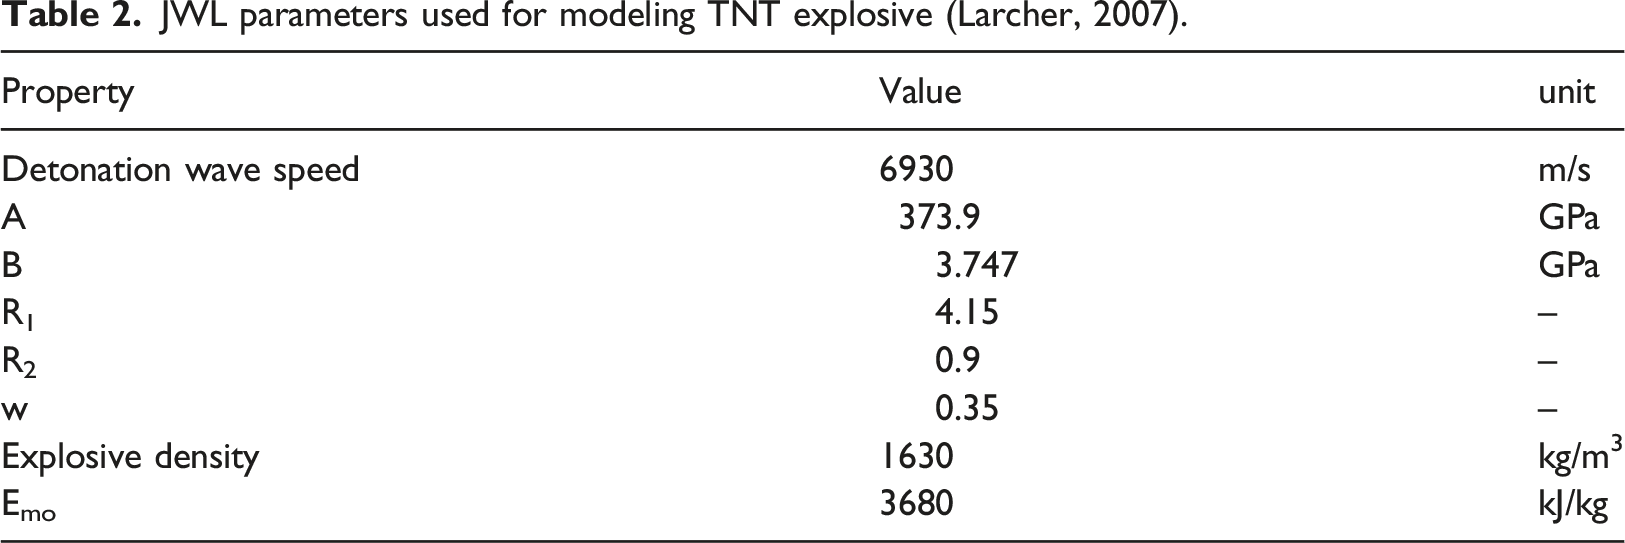
In most reference studies, the behavior of the rock is represented using traditional behavior criteria such as (Mohr–Coulomb) and (Hoek–Brown). These criteria do not capture the actual behavior of rocks under the influence of blast loads. This behavior is dominated by fracturing and fragmentation as a result of tensile loads.
The library of ABAQUS \ Explicit includes a model for representing the behavior of brittle materials. This model is called the brittle cracking model which assumes linear elastic behavior under compression, and brittle behavior under tension, (ABAQUS, Inc, 2006). It uses the simple Rankine criterion to detect crack initiation. The simple Rankine criterion indicates that a crack forms when the maximum tensile principal stress exceeds the tensile strength (
As soon as the Rankine criterion for the initiation of cracking has been met, it is assumed that the first crack has formed. The surface of this crack is taken to be normal to the direction of the maximum tensile principal stress. Subsequent perpendicular cracks may form at the same point, and the number of cracks does not exceed three.
An important feature of the brittle cracking model is that, although crack detection is based purely on Mode I fracture considerations, ensuing cracked behavior includes both Mode I (tension softening) and Mode II (shear softening/retention) behavior. The post-cracked tensile behavior can be defined by applying the approach of fracture energy ( Post failure stress-fracture energy curve, (Dassault Systemes, 2010).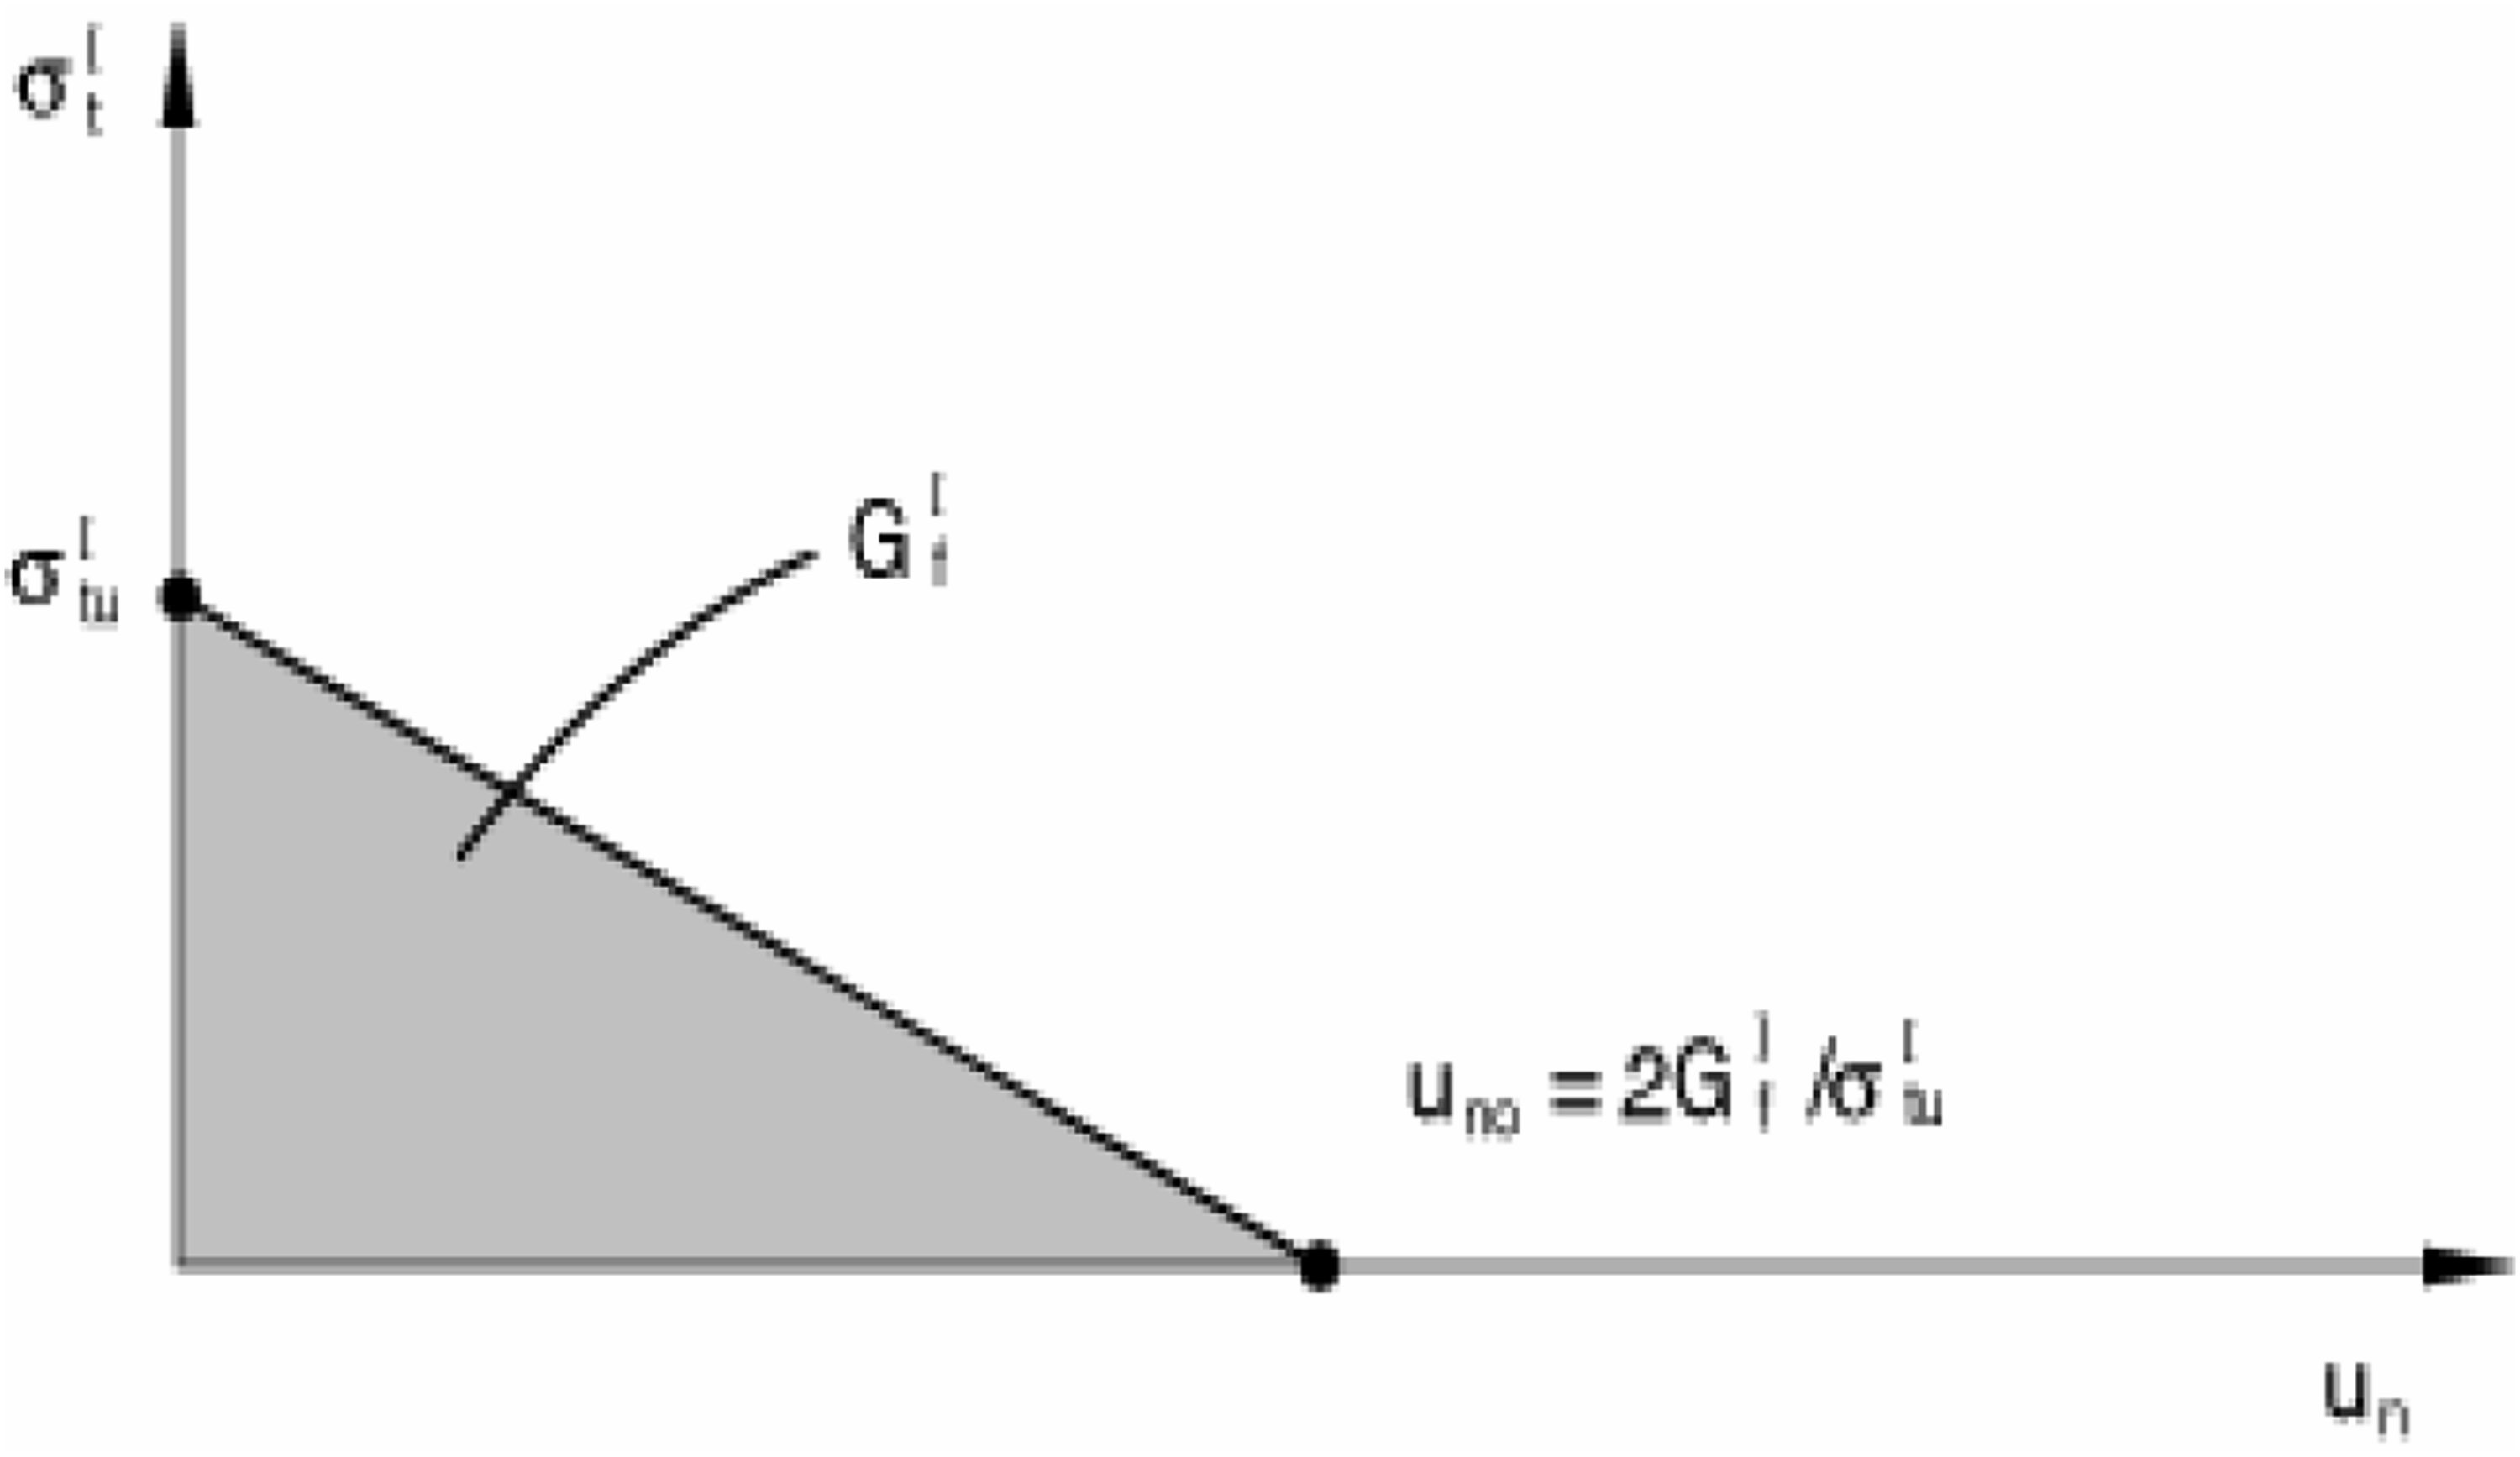
The crack normal displacement at which complete loss of strength takes place is, (Pelfrene et al., 2016)
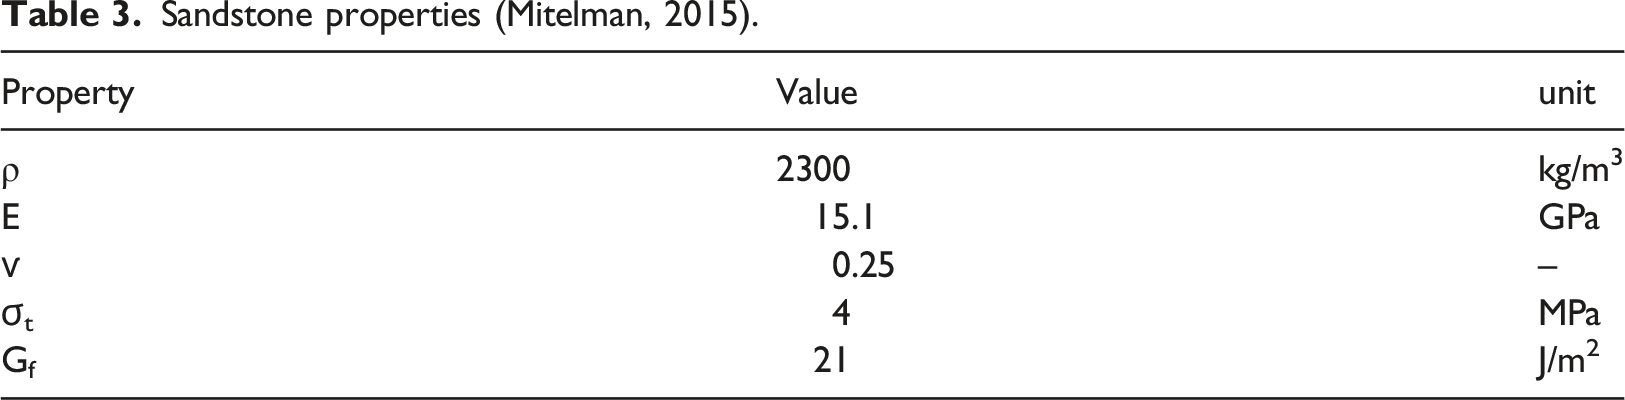
Sandstone properties (Mitelman, 2015).
Radius of model regions and FE mesh size in each region.

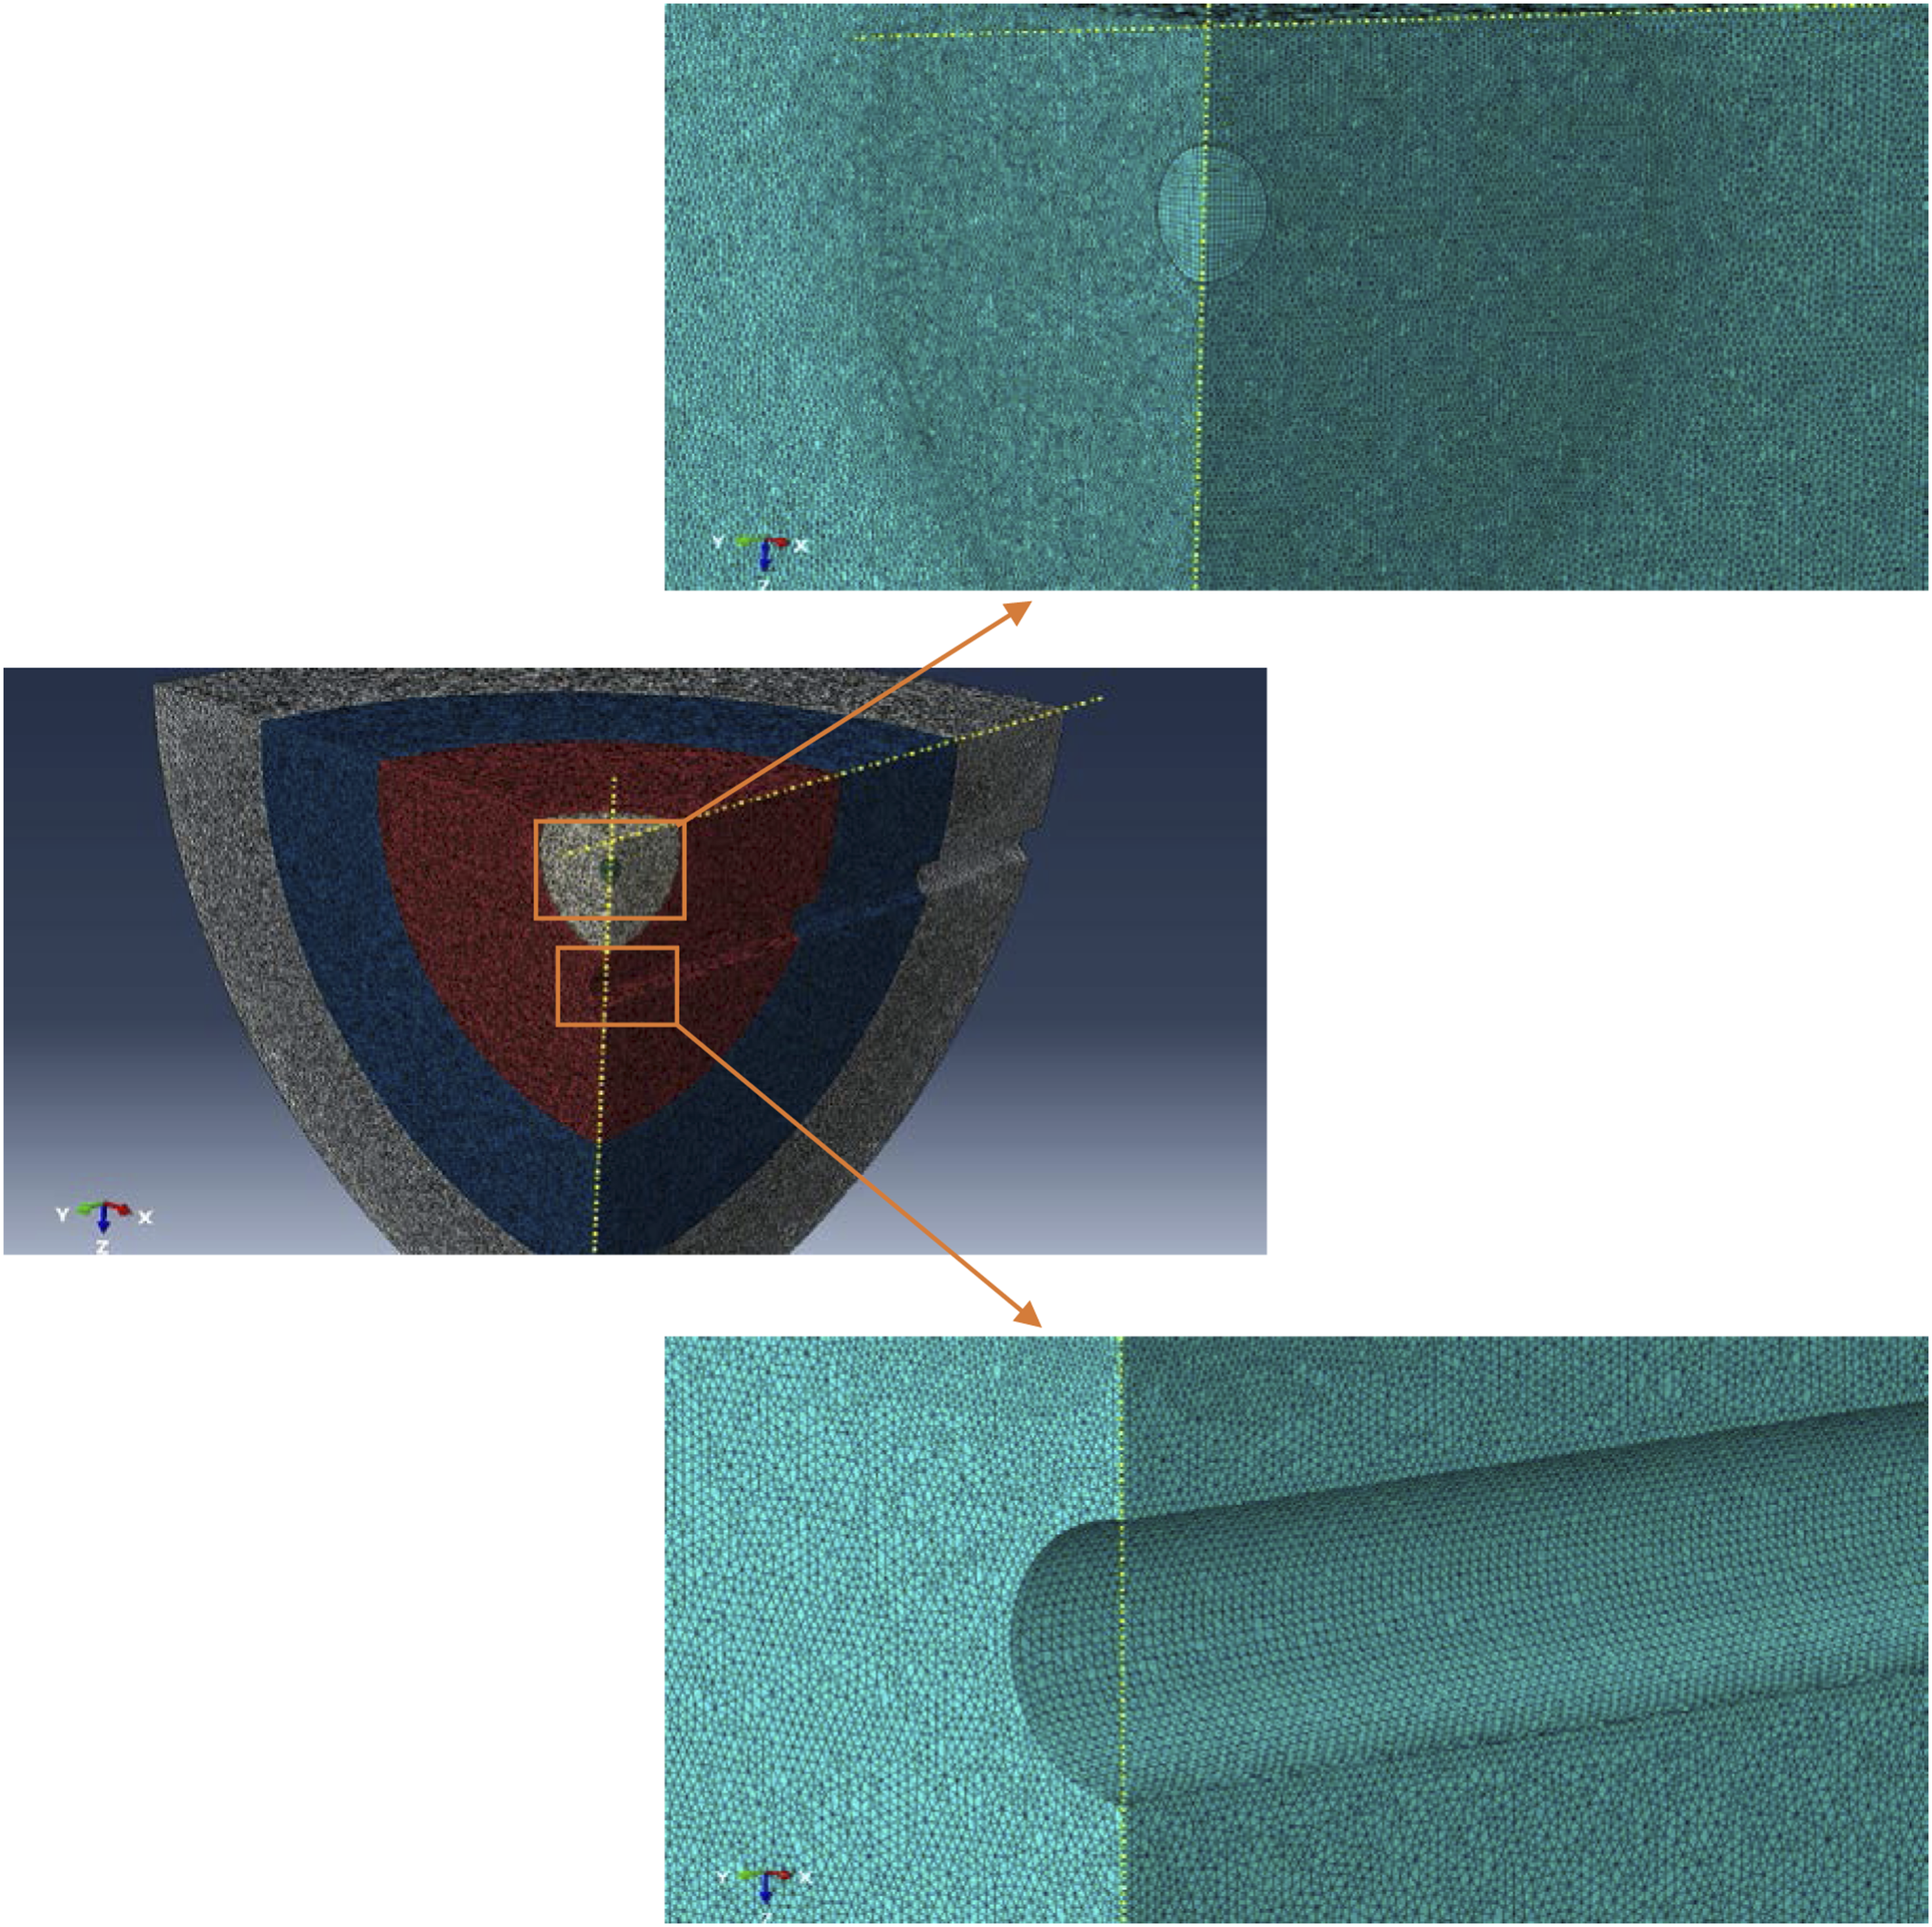
Spherical regions around the explosive center and the meshing of the model.
In order to define the relationship between the surface of the explosive and the surface of the blast hole, a normal hard contact is defined in a dynamic step. The step time is (0.0095 s). During this time, the blast wave spreads within the rock without being reflected from the boundaries of the model.
Boundary conditions are symmetry constraints for the vertical lateral surfaces of both the rock and the explosive. The outer edge of the rock is fixed, while the upper surface remains free.
Free Field Model
Drake et al., (1989) presented empirical equations for calculating the blast-induced pressure of different types of rocks in the free field. According to these equations, ERA sandstone is located between the medium strength rock and the low strength rock.
Based on (Drake et al., 1989) empirical equations in the present study, Figure 6 is drawn. This figure shows the upper and lower pressure limits in the free field, which represent the medium strength rock and the low strength rock, respectively. The upper and lower limit of the pressure in the free field resulting from the application of (Drake et al., 1989) empirical equations.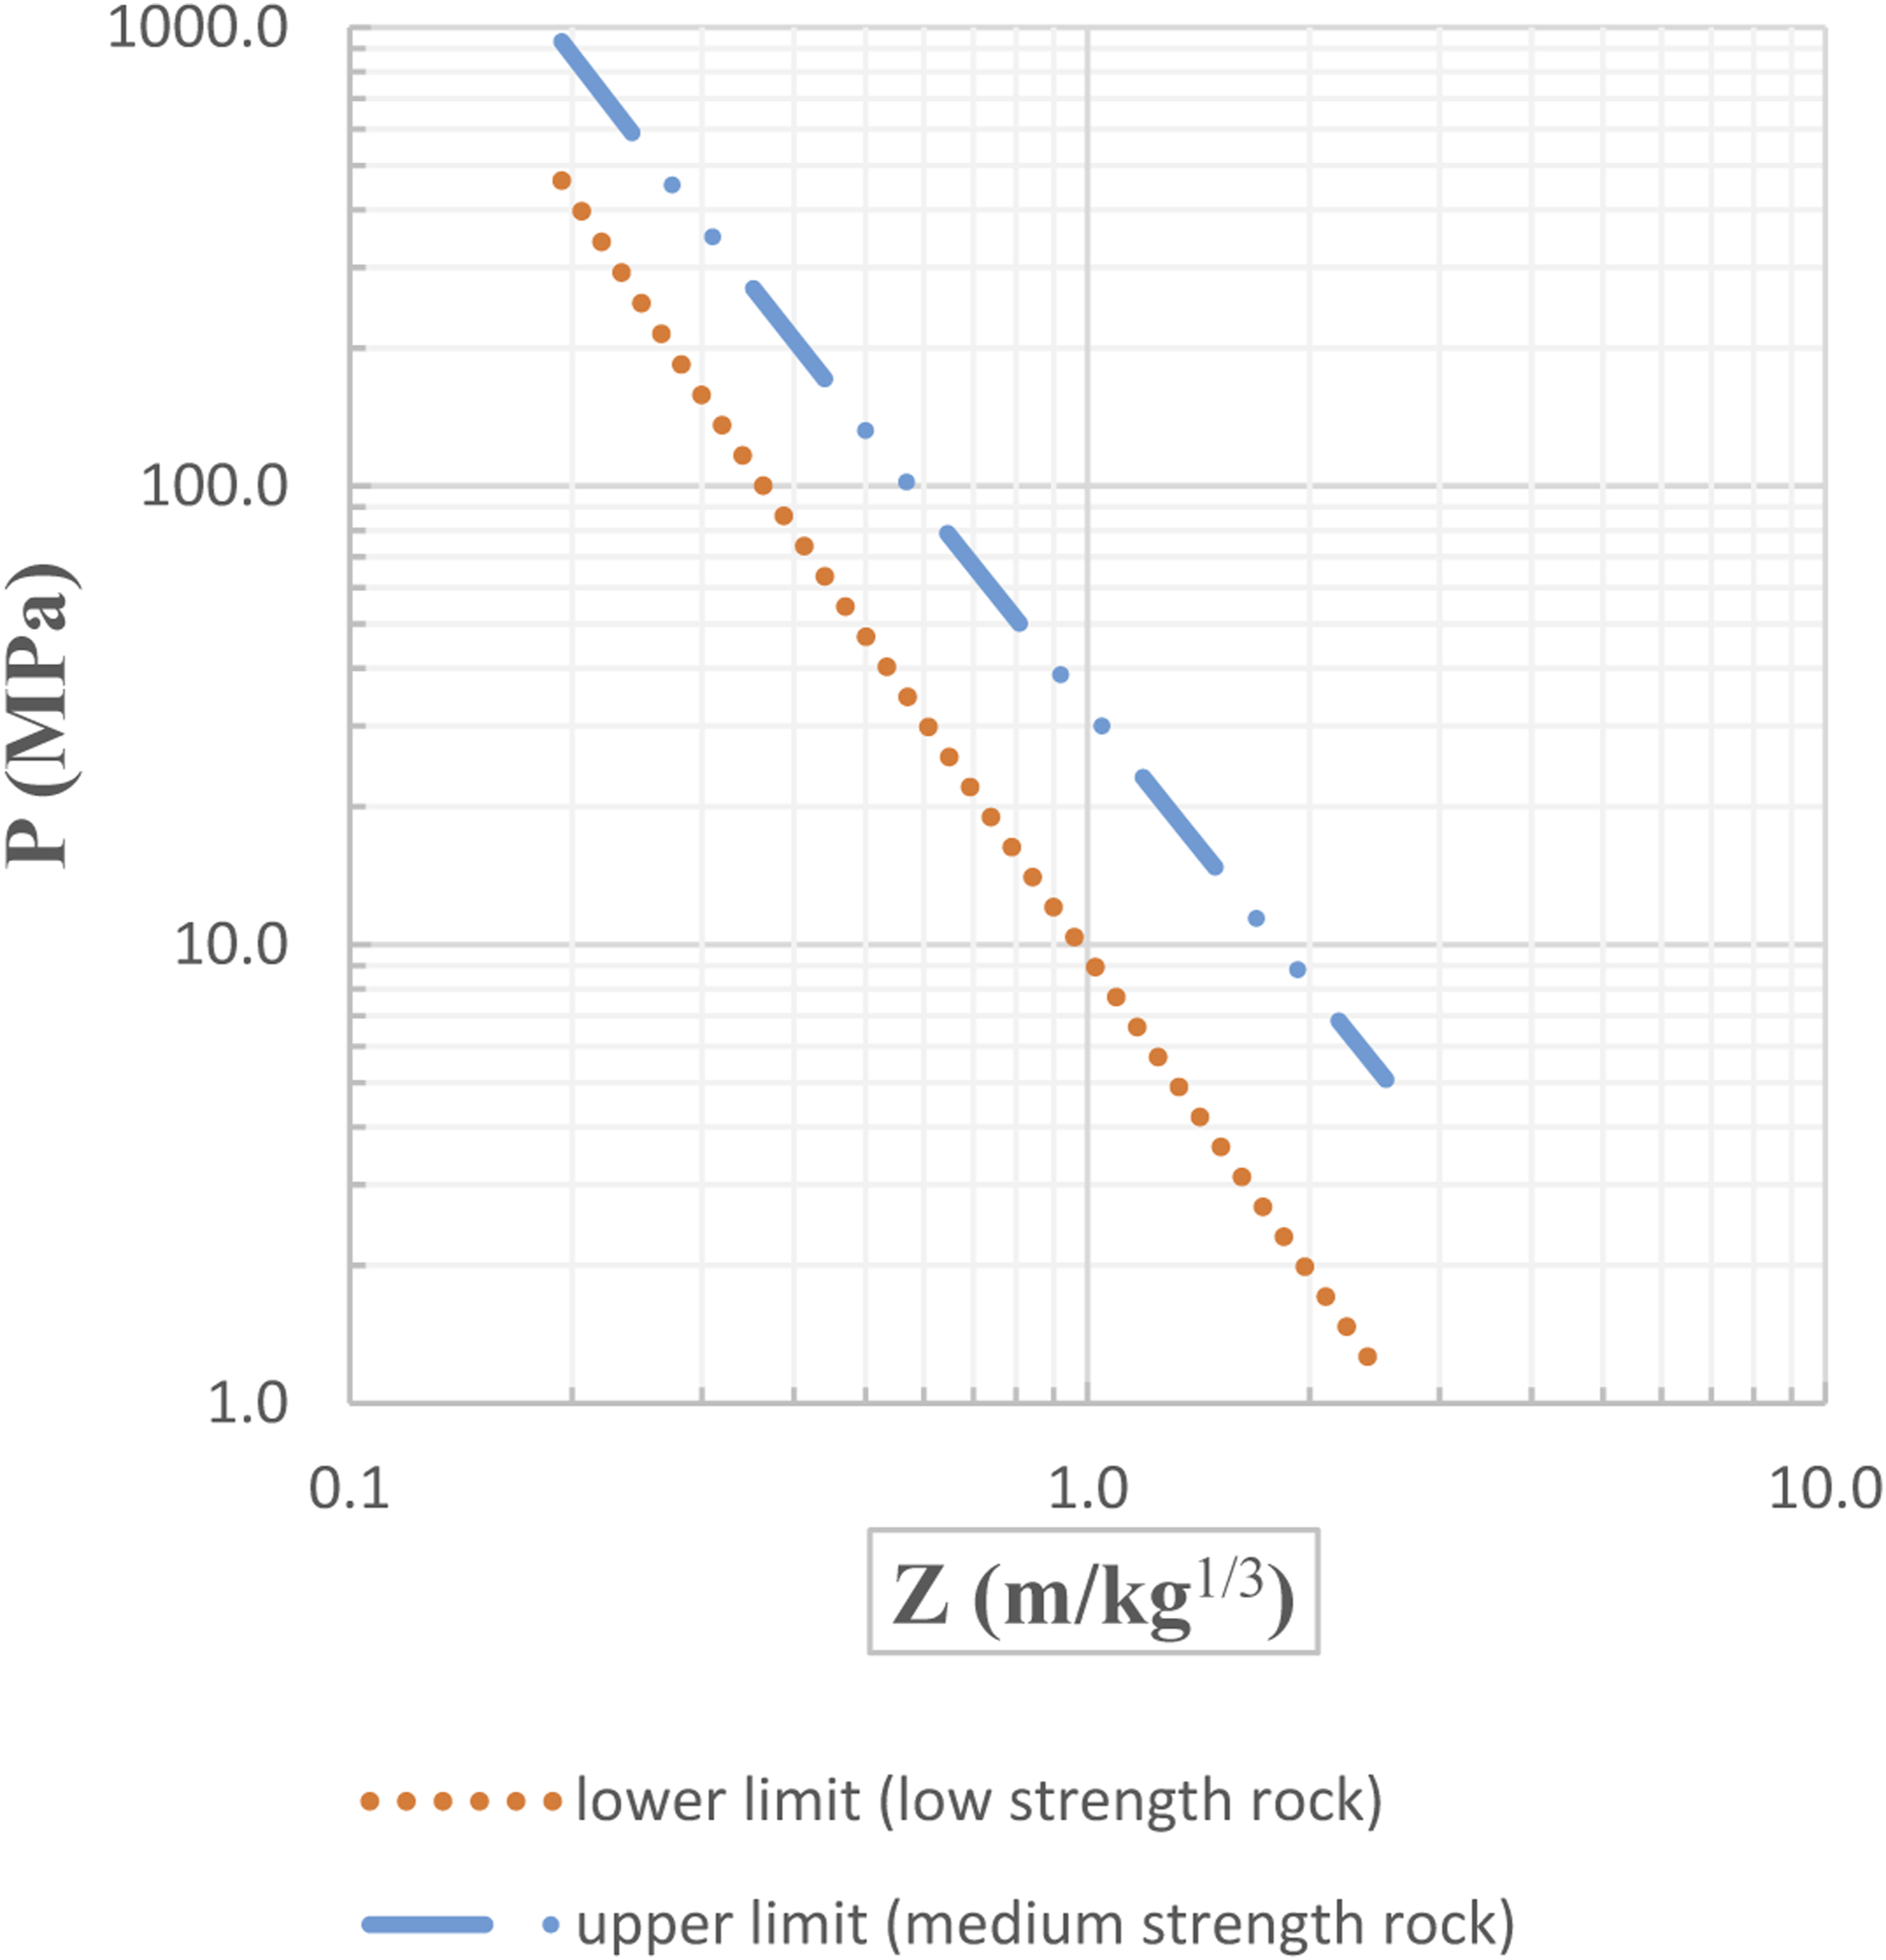
The main objective of the free field model is to determine the damping ratios that should be used for the rock mass in order to achieve compatibility between the blast-induced stress resulting from numerical modeling and empirical equations or field tests. ITASCA recommended using damping Ratios ranging from 2% to 5% for geological materials Eitzenberger (2012) studied the effect of the damping ratio on the propagation of waves in rocks using values ranging from 0 to 5%.
The damping can be introduced into ABAQUS program either by Rayleigh damping or by using bulk viscosity method. Due to the ease of the second method and its limited influence on the stability time of the elements and thus the overall analysis time, it is used in the present model.
The bulk viscosity method introduces damping associated with volumetric deformation. Its purpose is to improve simulation of high-speed dynamic problems. This damping is not part of the material properties or behavior, but it is only treated as a numerical effect, (Dassault Systemes, 2010). It is divided into two parts: linear viscosity and quadratic viscosity. In the current analysis, its value has been increased from the default values (0.06–1.2) to larger values (0.36–7.2), for the linear and quadratic viscosity, respectively.
The bulk viscosity scaling factors for the damping regions.

One of the important features of the brittle cracking model used to represent the behavior of the rock in the numerical model is the study of the tensile and shear behavior after cracking, and the ability to remove cracked elements when the normal displacement of the crack surface exceeds a specific value (
The cracked element is removed from the model when the normal displacement of the crack surface exceeds the value at which the tensile strength is absent. Using equation (1), this displacement is calculated and its resulting value is
Figure 7 shows the free field pressure resulting from the analysis of the numerical model, as a function of the scaled distance. This pressure is measured in nodes spread over the field from 2 m away from the detonation center to the end of the model. In Figure 7 it is clear that the numerical pressure in the free field lies between the upper and lower limit obtained from (Drake et al., 1989) empirical equations. Comparing the pressure generated by the numerical model with Drake’s empirical equations.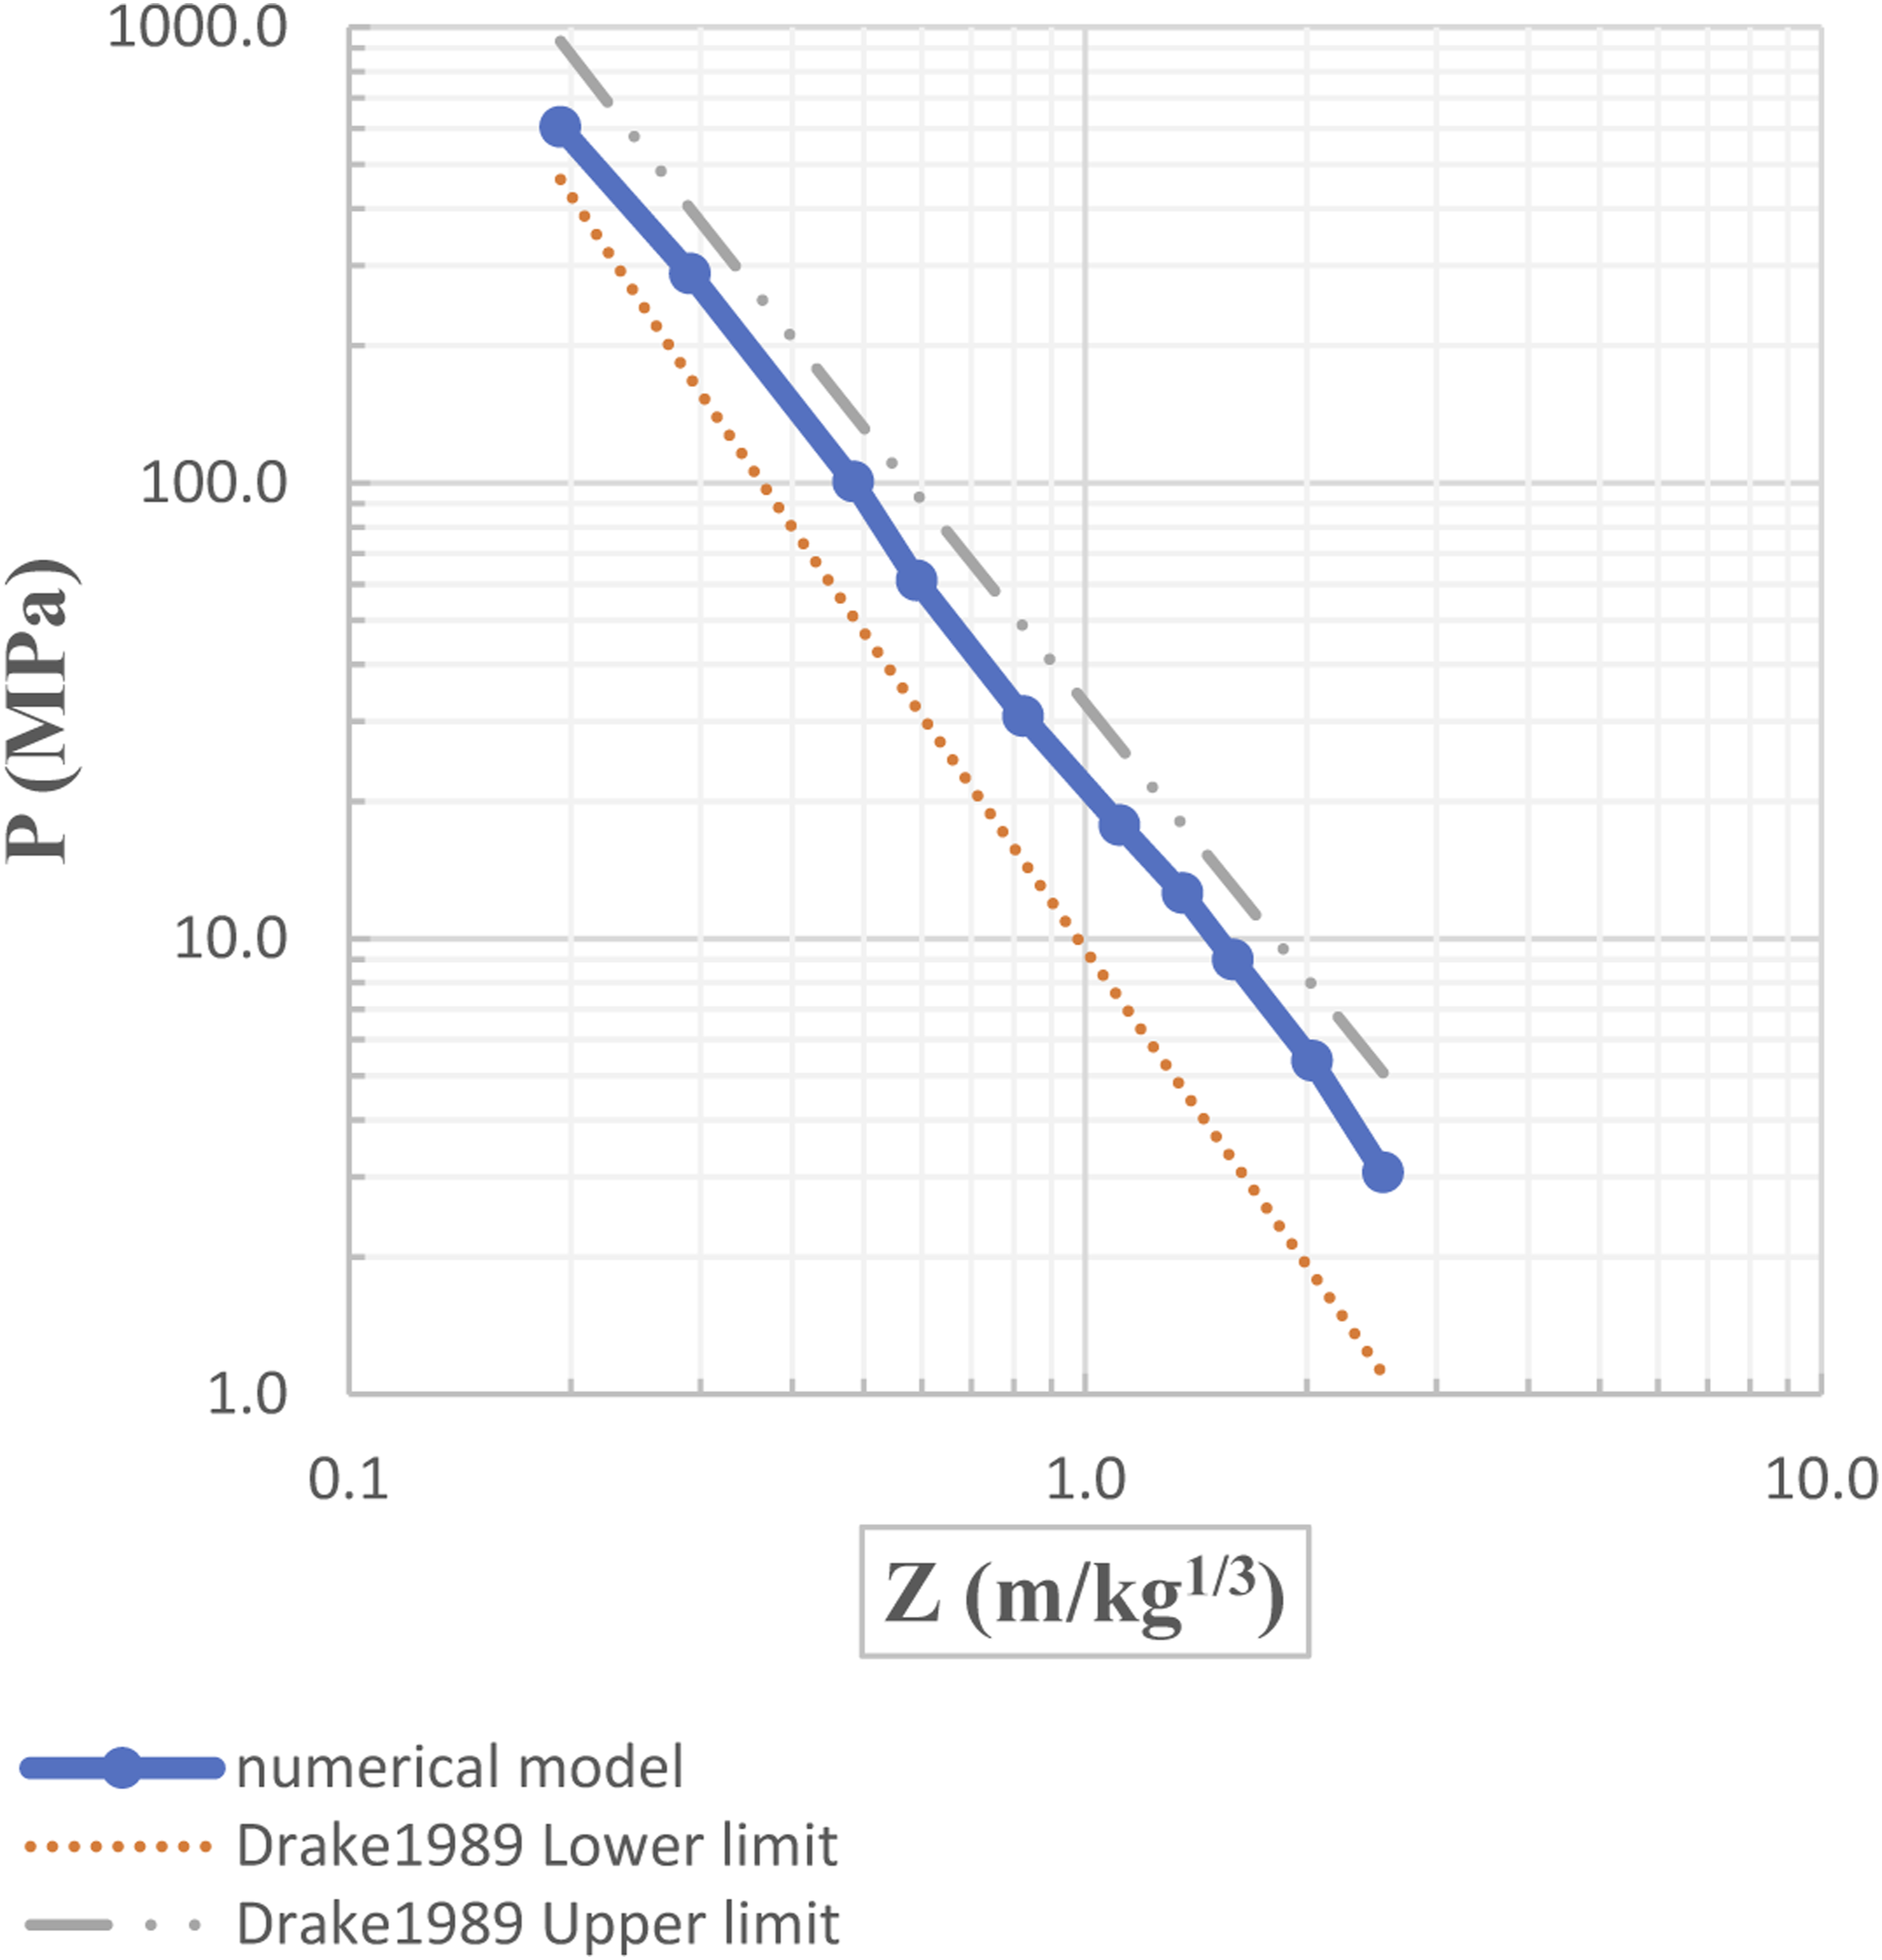
Figure 8 shows the surface blast crater with maximum rupture radius (R = 8.5 m), measured from the center of the blast. It also shows radial cracks formed after the blast crater. Surface blast crater and radial cracks generated in the numerical model.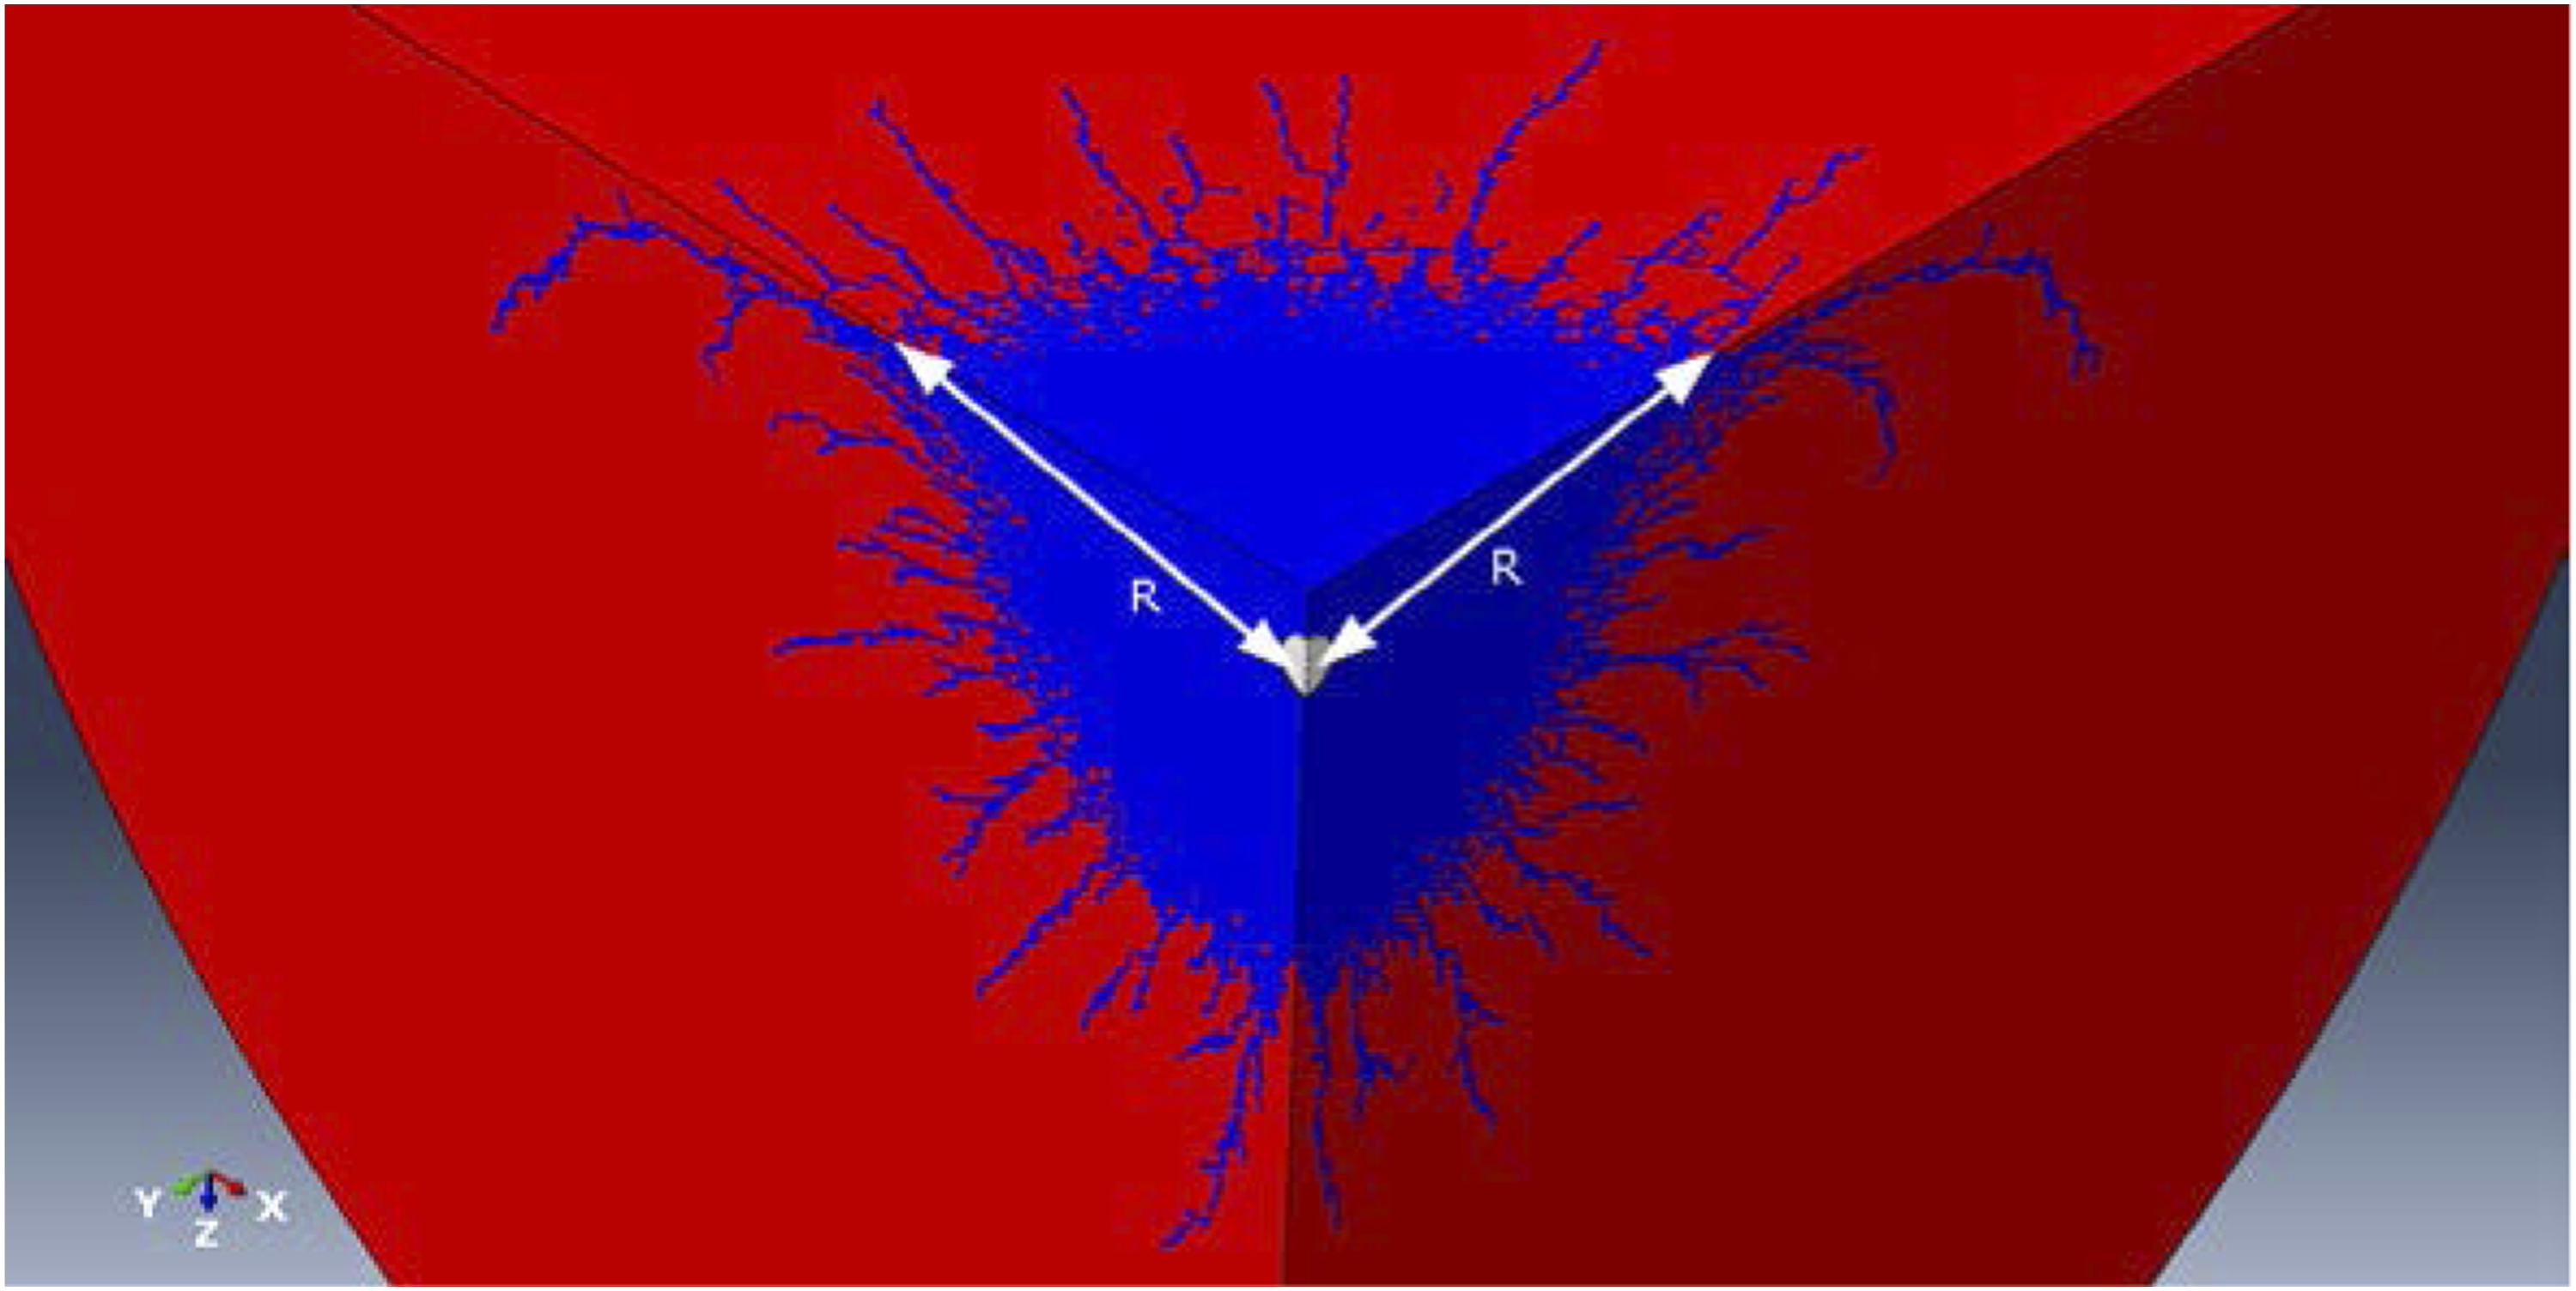
ERA tests resulted in an equation for calculating the average rupture radius of a surface blast crater in sandstone. This equation is as follows (EM 1110-345-434 USA Corps of Engineers Manual, 1961b)

By applying equation (3) to calculate the average radius of the surface blast crater corresponding to the detonation of a charge of weight (1100 kg-TNT) placed at a depth of (1.5 m) in sandstone, we obtain a radius of (7.88 m), which is in good agreement with the result of the numerical model.
Based on what mentioned before, it is clear that the results of the numerical model are in great agreement with the results of the empirical equations, and the radius of the surface blast crater is in good agreement with the results of ERA tests, so we can use this model to study the impact of the explosion on the tunnel.
Numerical model with a tunnel
Figure 9 shows the numerical model used to simulate ERA test No. (811). In this model, the diameter of the tunnel is (1.8 m) as in the test. In order to ensure the formation of the four damage zones, the distance of 5m between the tunnel and the detonation center is adopted. The numerical model with a tunnel.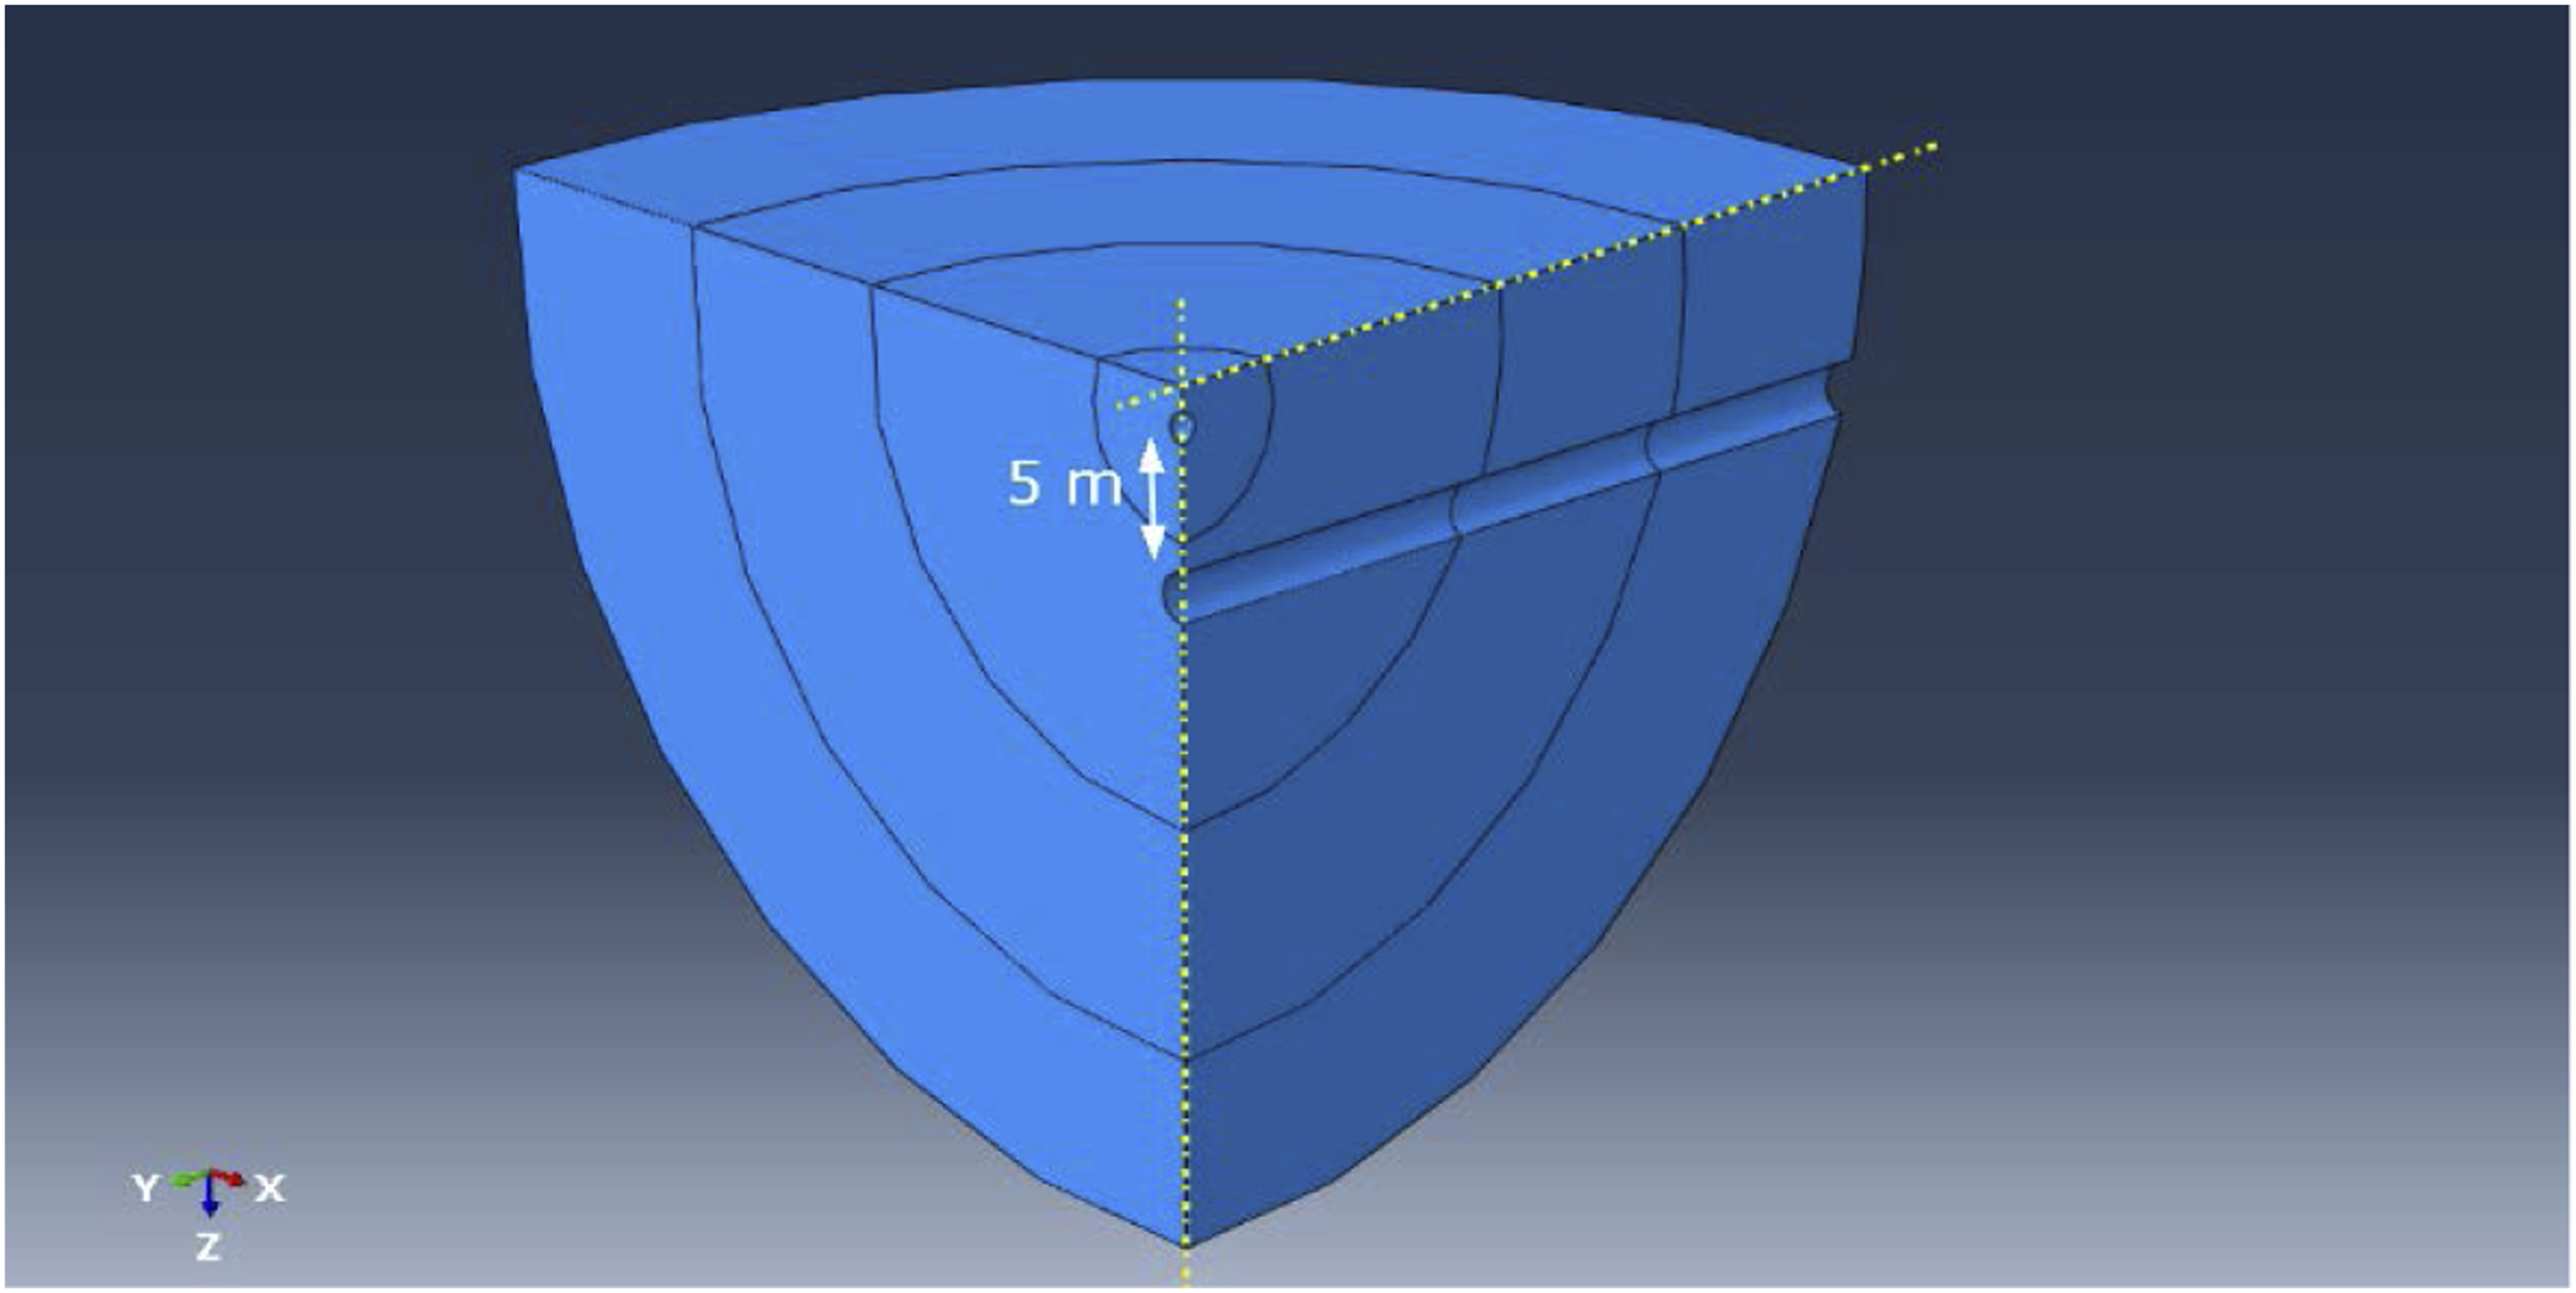
Figure 10 shows the blast-induced failure in the numerical model, where an extensive failure is formed and continues from the tunnel to the surface in the zone near the explosion, then the failure is concentrated at the top of the tunnel with increasing distance from the detonation center. The blast-induced-failure in the numerical model.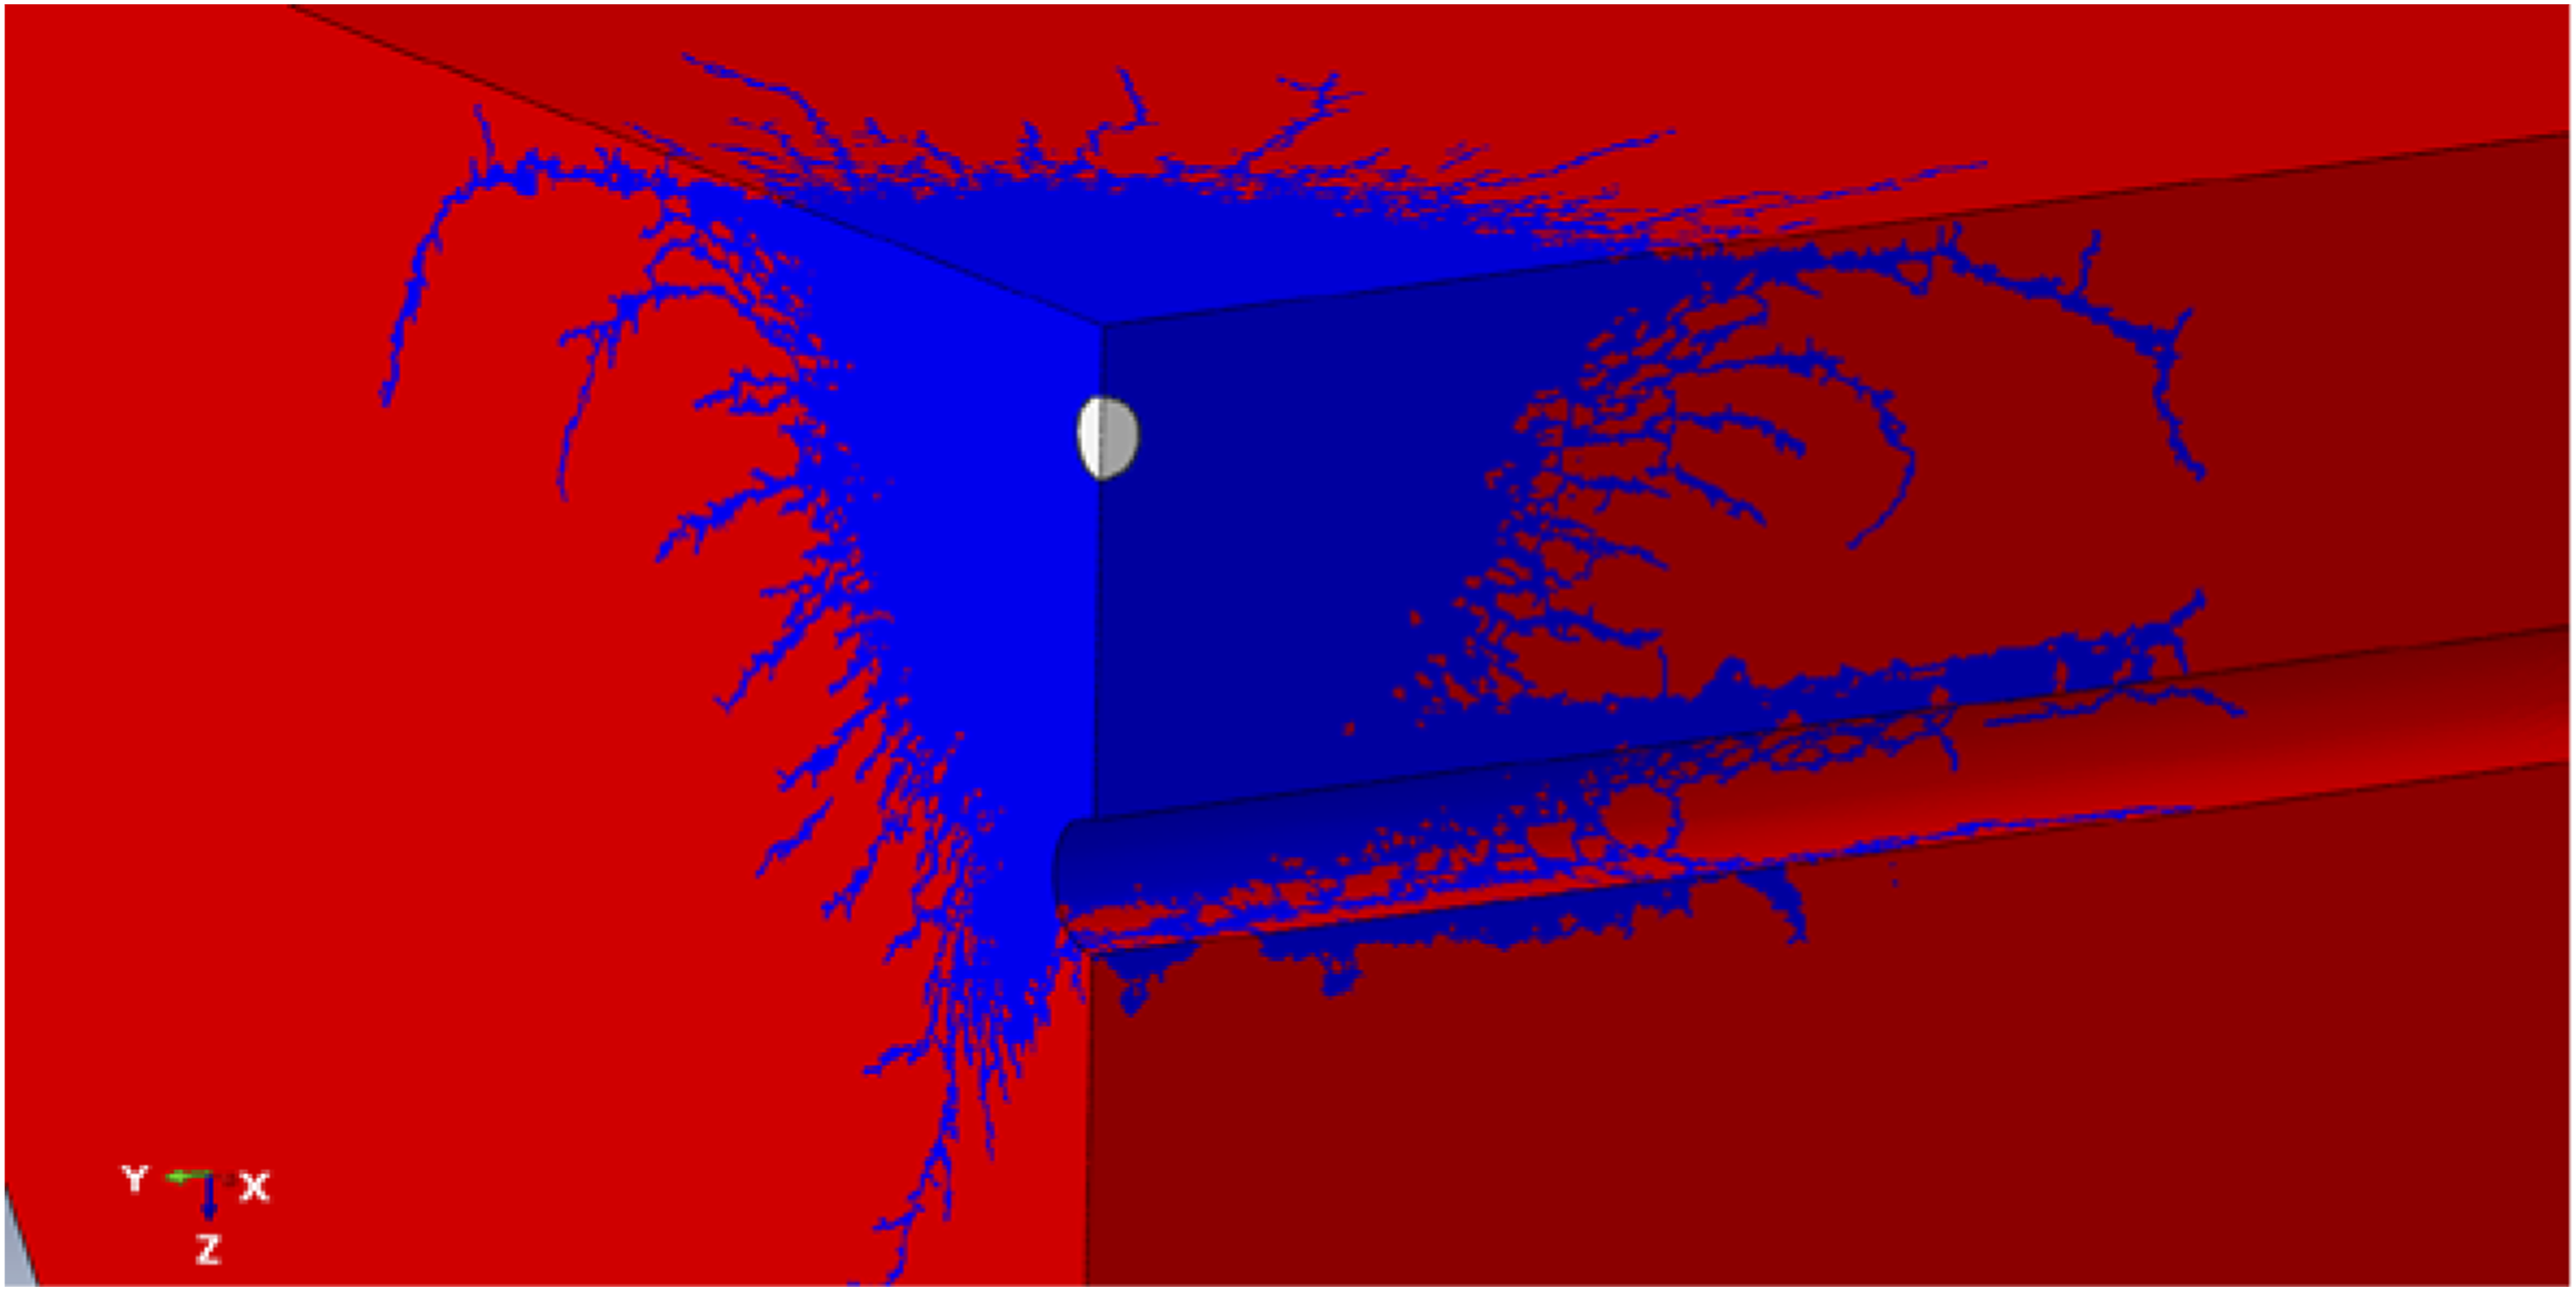
One of the important results obtained from the numerical model is the extension of the damage zones in the tunnel. According to the results of ERA tests, zone 1 is characterized by continuous failure from the detonation center to the tunnel. While the surface of the resulting tunnel in zone 2 is inclined to the original tunnel surface and the failure spreads around the tunnel. Failures occur in zone 3 so that the resulting tunnel surface is parallel to the primary surface and these failures are concentrated over the area along the tunnel surface toward the charge. As for zone 4, the damage is discontinuous and linked to the presence of weak areas in the rock before the explosion. The weak areas are either geological structures present in the rock before the tunnel excavation, or cracks formed in the rock as a result of the drilling process. These areas are not taken into account in the current study.
The extension of the damage zones in the tunnel is shown in Figure 11. This extension is determined in line with the recommendations of the results of ERA tests described above. Zone 4 extension is determined in line with the last crack that appears next to the top of the tunnel. Table 6 provides a comparison between the scaled extension of the damage zones resulting from the numerical model with the maximum scaled extension of the damage zones resulting in ERA. This table shows that the extension of the damage zones of the numerical model is in good agreement with the results of ERA tests. The extension of the damage zones in the tunnel. Comparison of the scaled extension of tunnel damage zones between numerical analysis and ERA.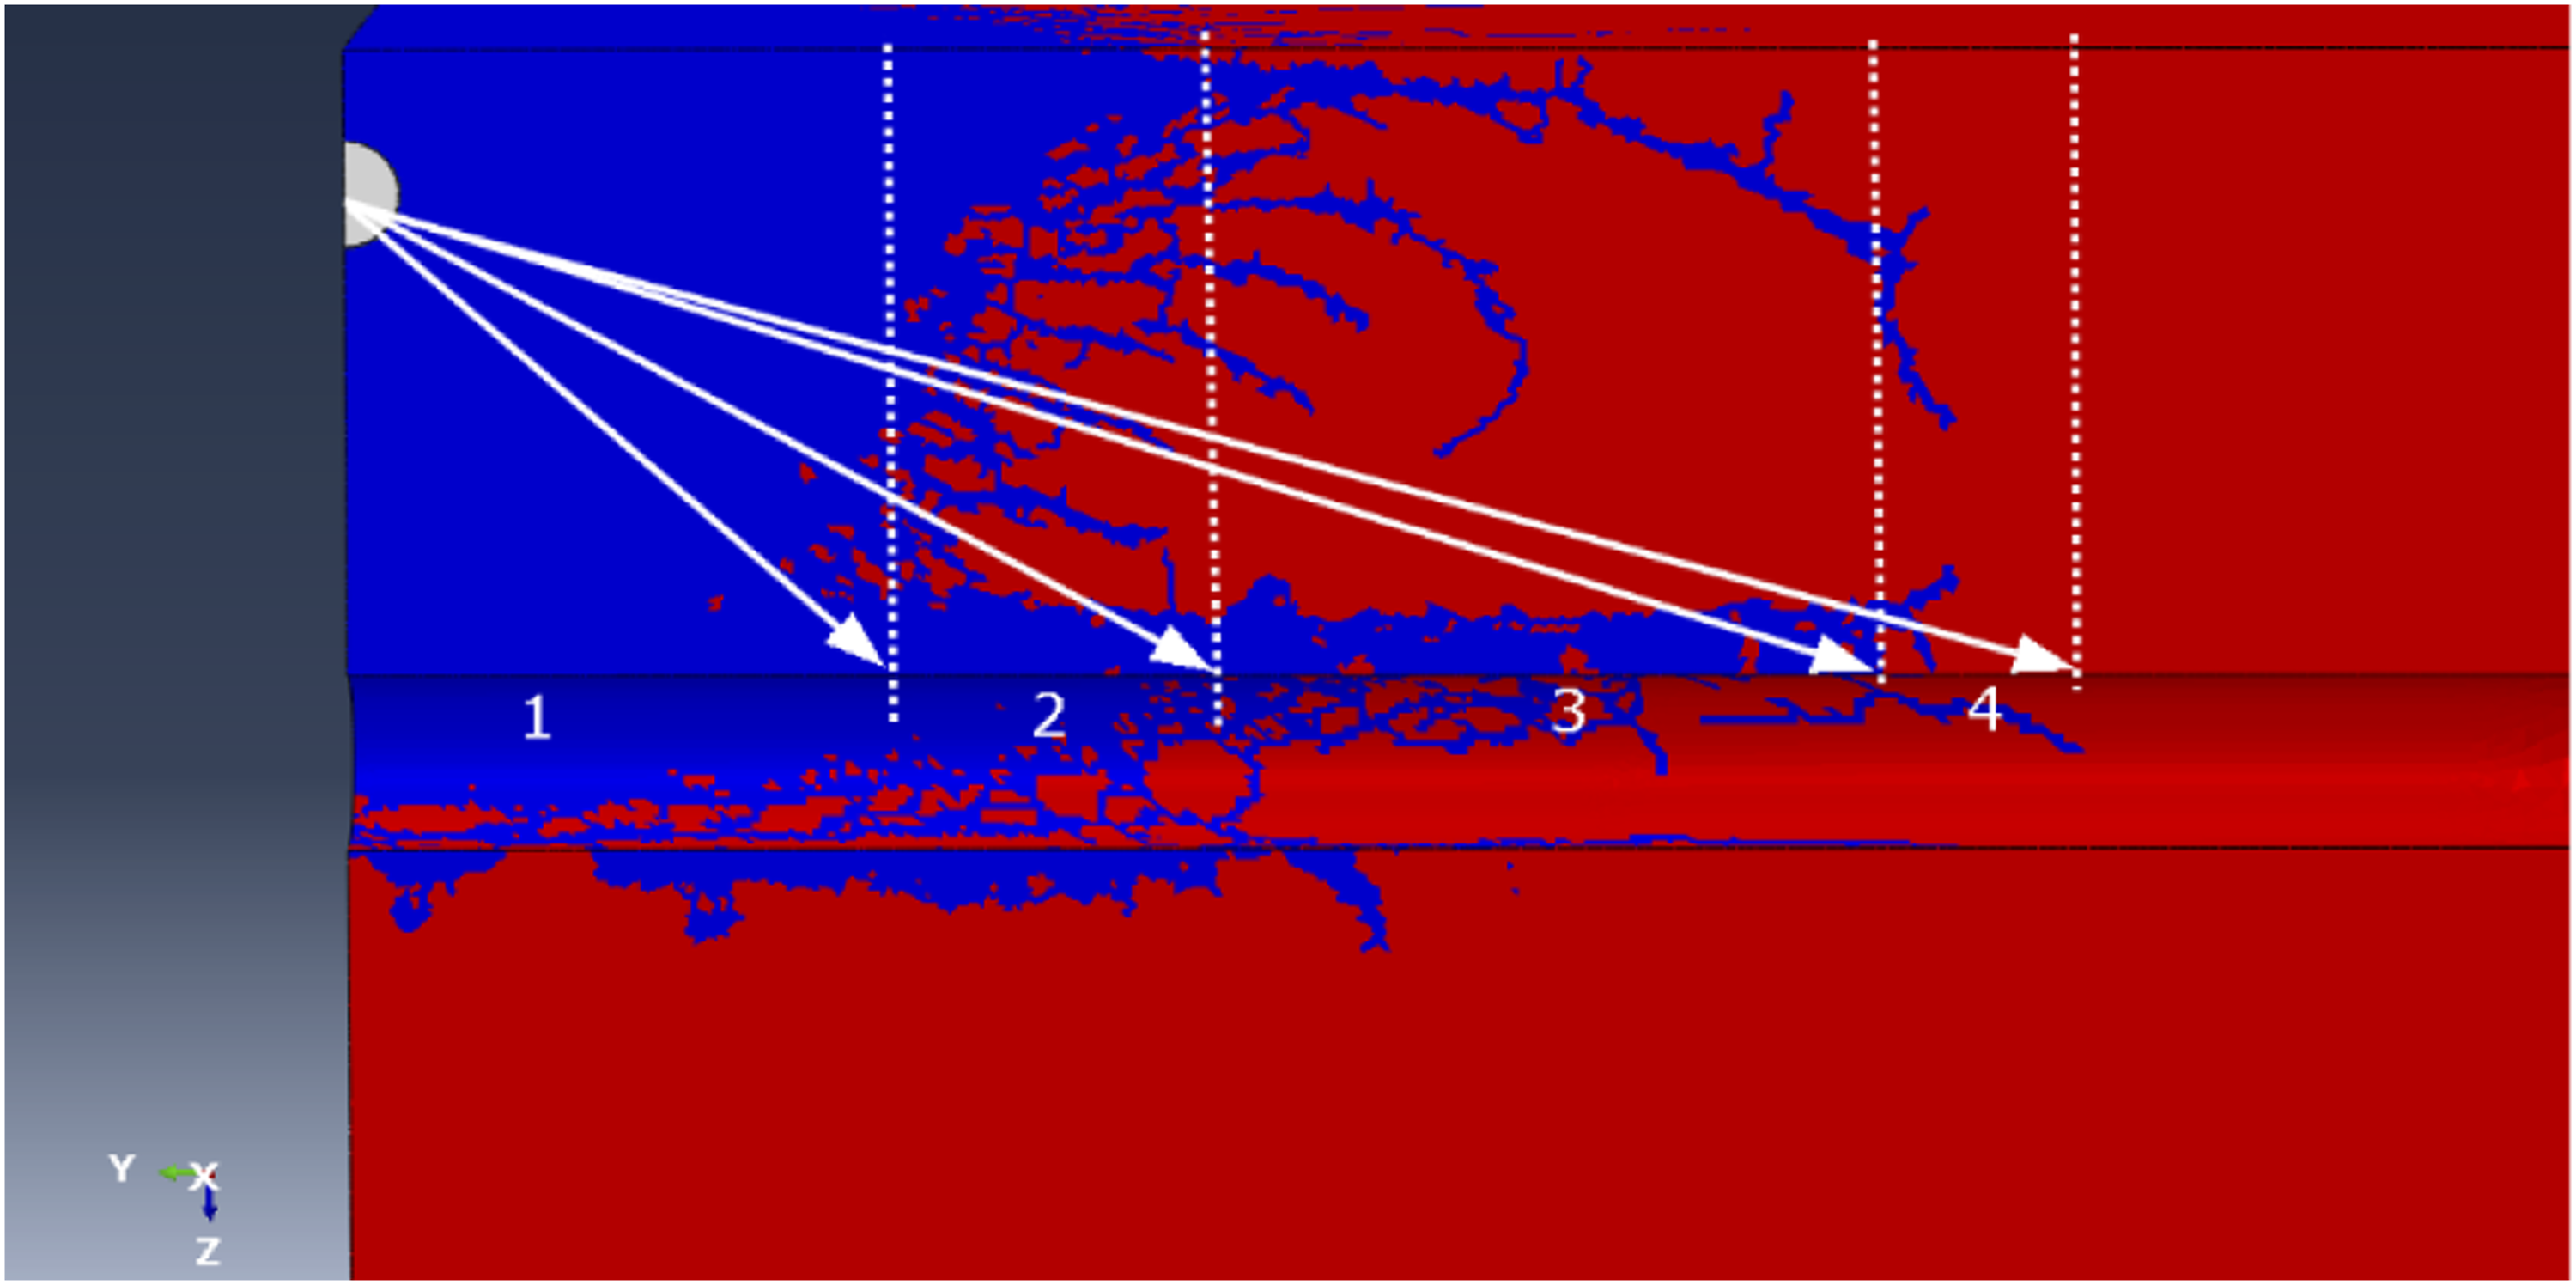

The extension of zone 4 in the current numerical model is less than ERA extension. This can be considered acceptable because the results of ERA are presented as maximum extensions which may not occur in all cases. In addition to that, neglecting weak areas in the rock around the tunnel in the numerical model may cause zone 4 extension decrease.
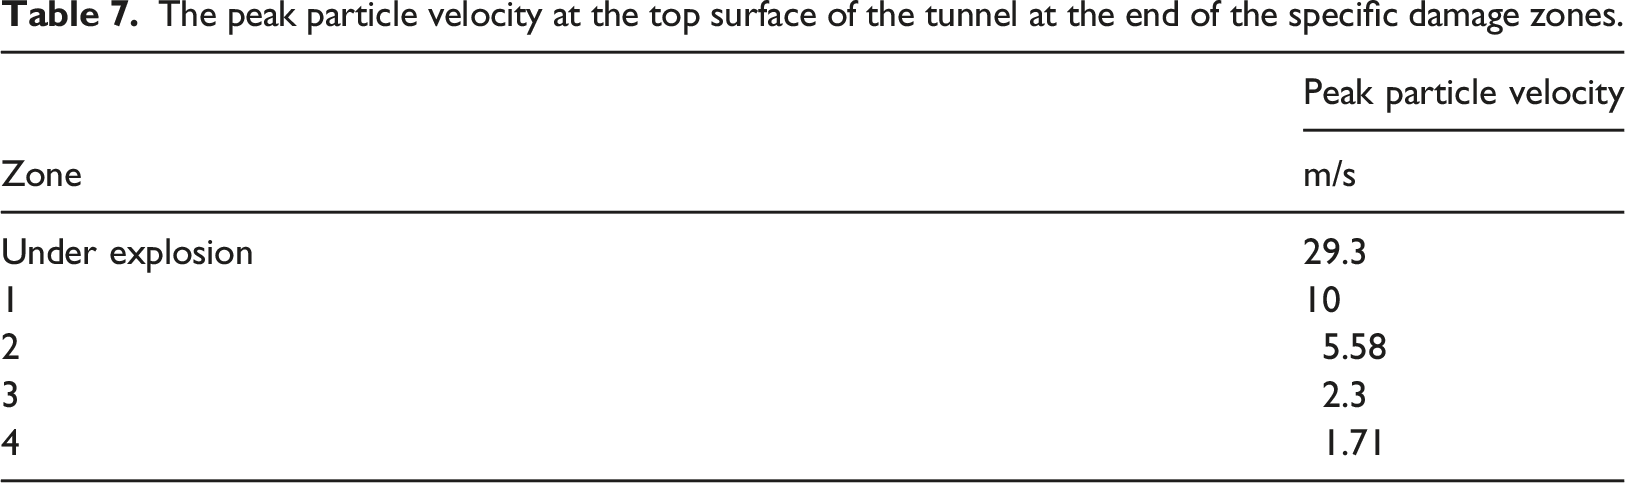
The peak particle velocity at the top surface of the tunnel at the end of the specific damage zones.
The most important result that can be obtained from the numerical model is the failure area. The failure area can be calculated in any cross section of the tunnel by specifying two important parameters, namely the fracture or failure thickness and the fracture angle, as shown in Figure 12. The fracture angle is the angle between the center of the tunnel and the last crack formed around it. The fracture thickness is the thickness of the failure above the top of the tunnel. Thickness and angle of fracture (Mitelman, 2015).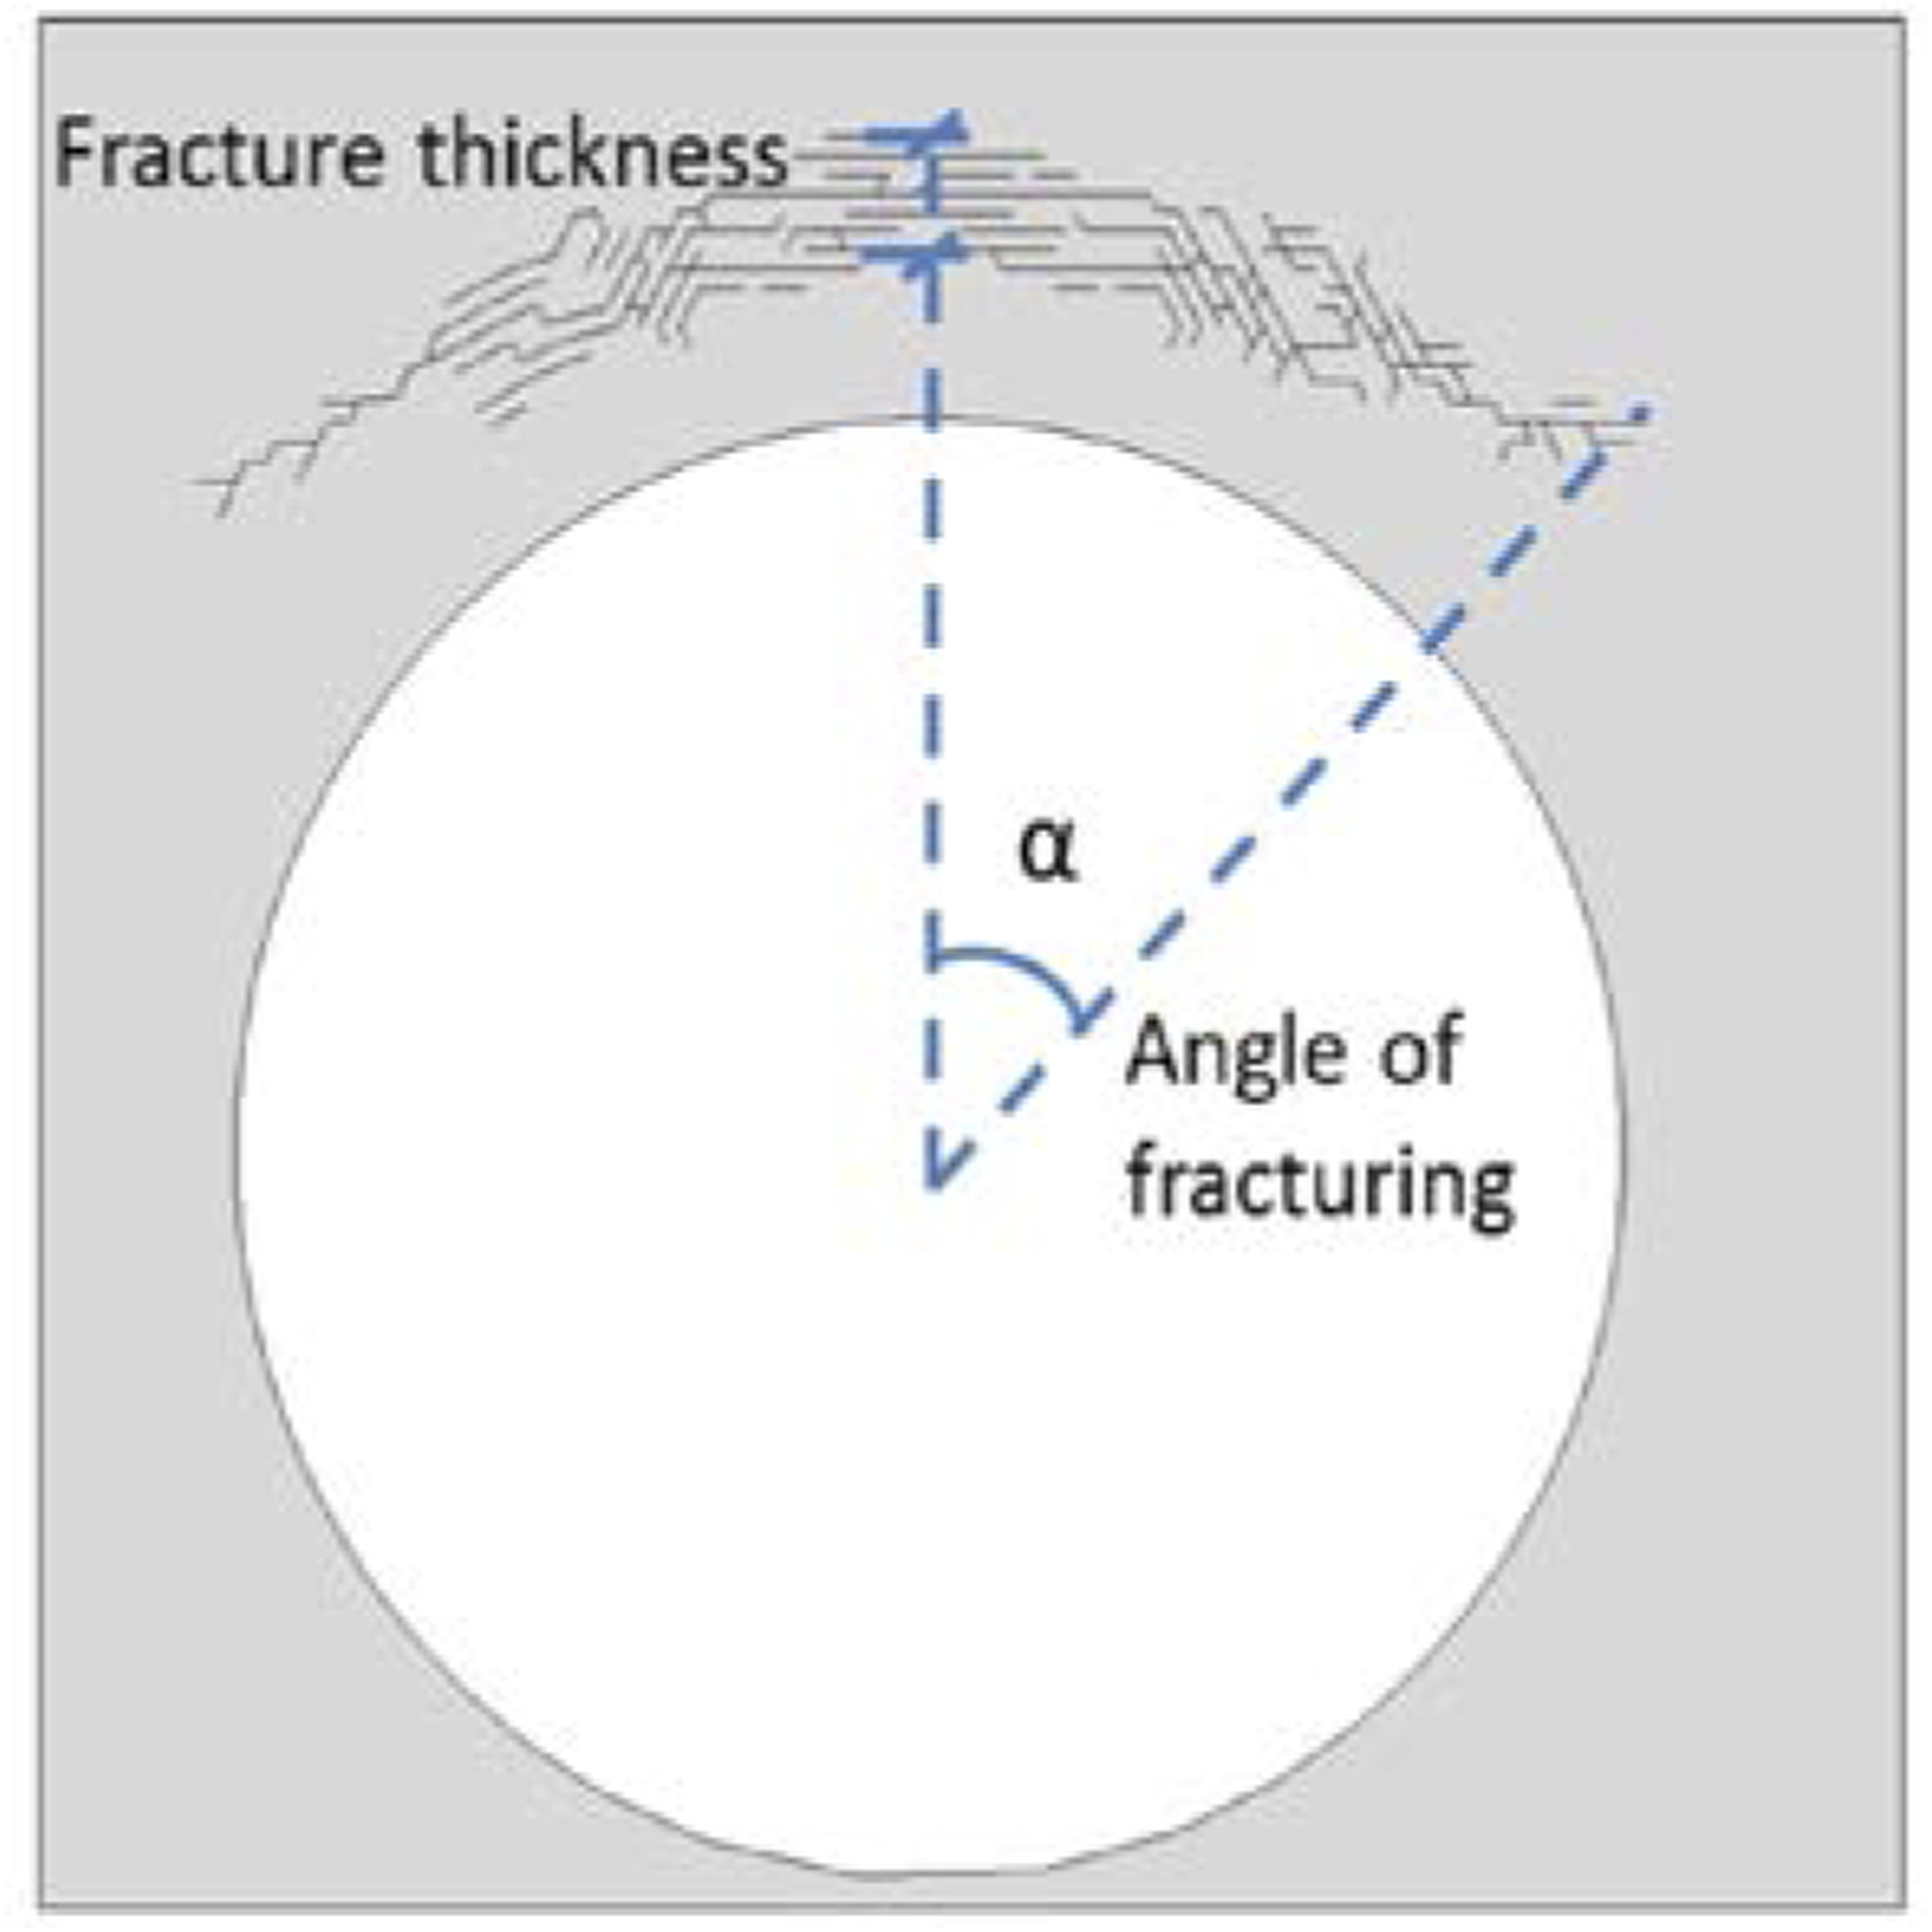
Figures 13 to 16 show the failures around the tunnel cross-section under the detonation center and at the end of zones 1, 2, 3, respectively. Failure in the tunnel under the detonation center. Failure in the tunnel at the end of Zone 1. Failure in the tunnel at the end of Zone 2. Failure in the tunnel at the end of Zone 3.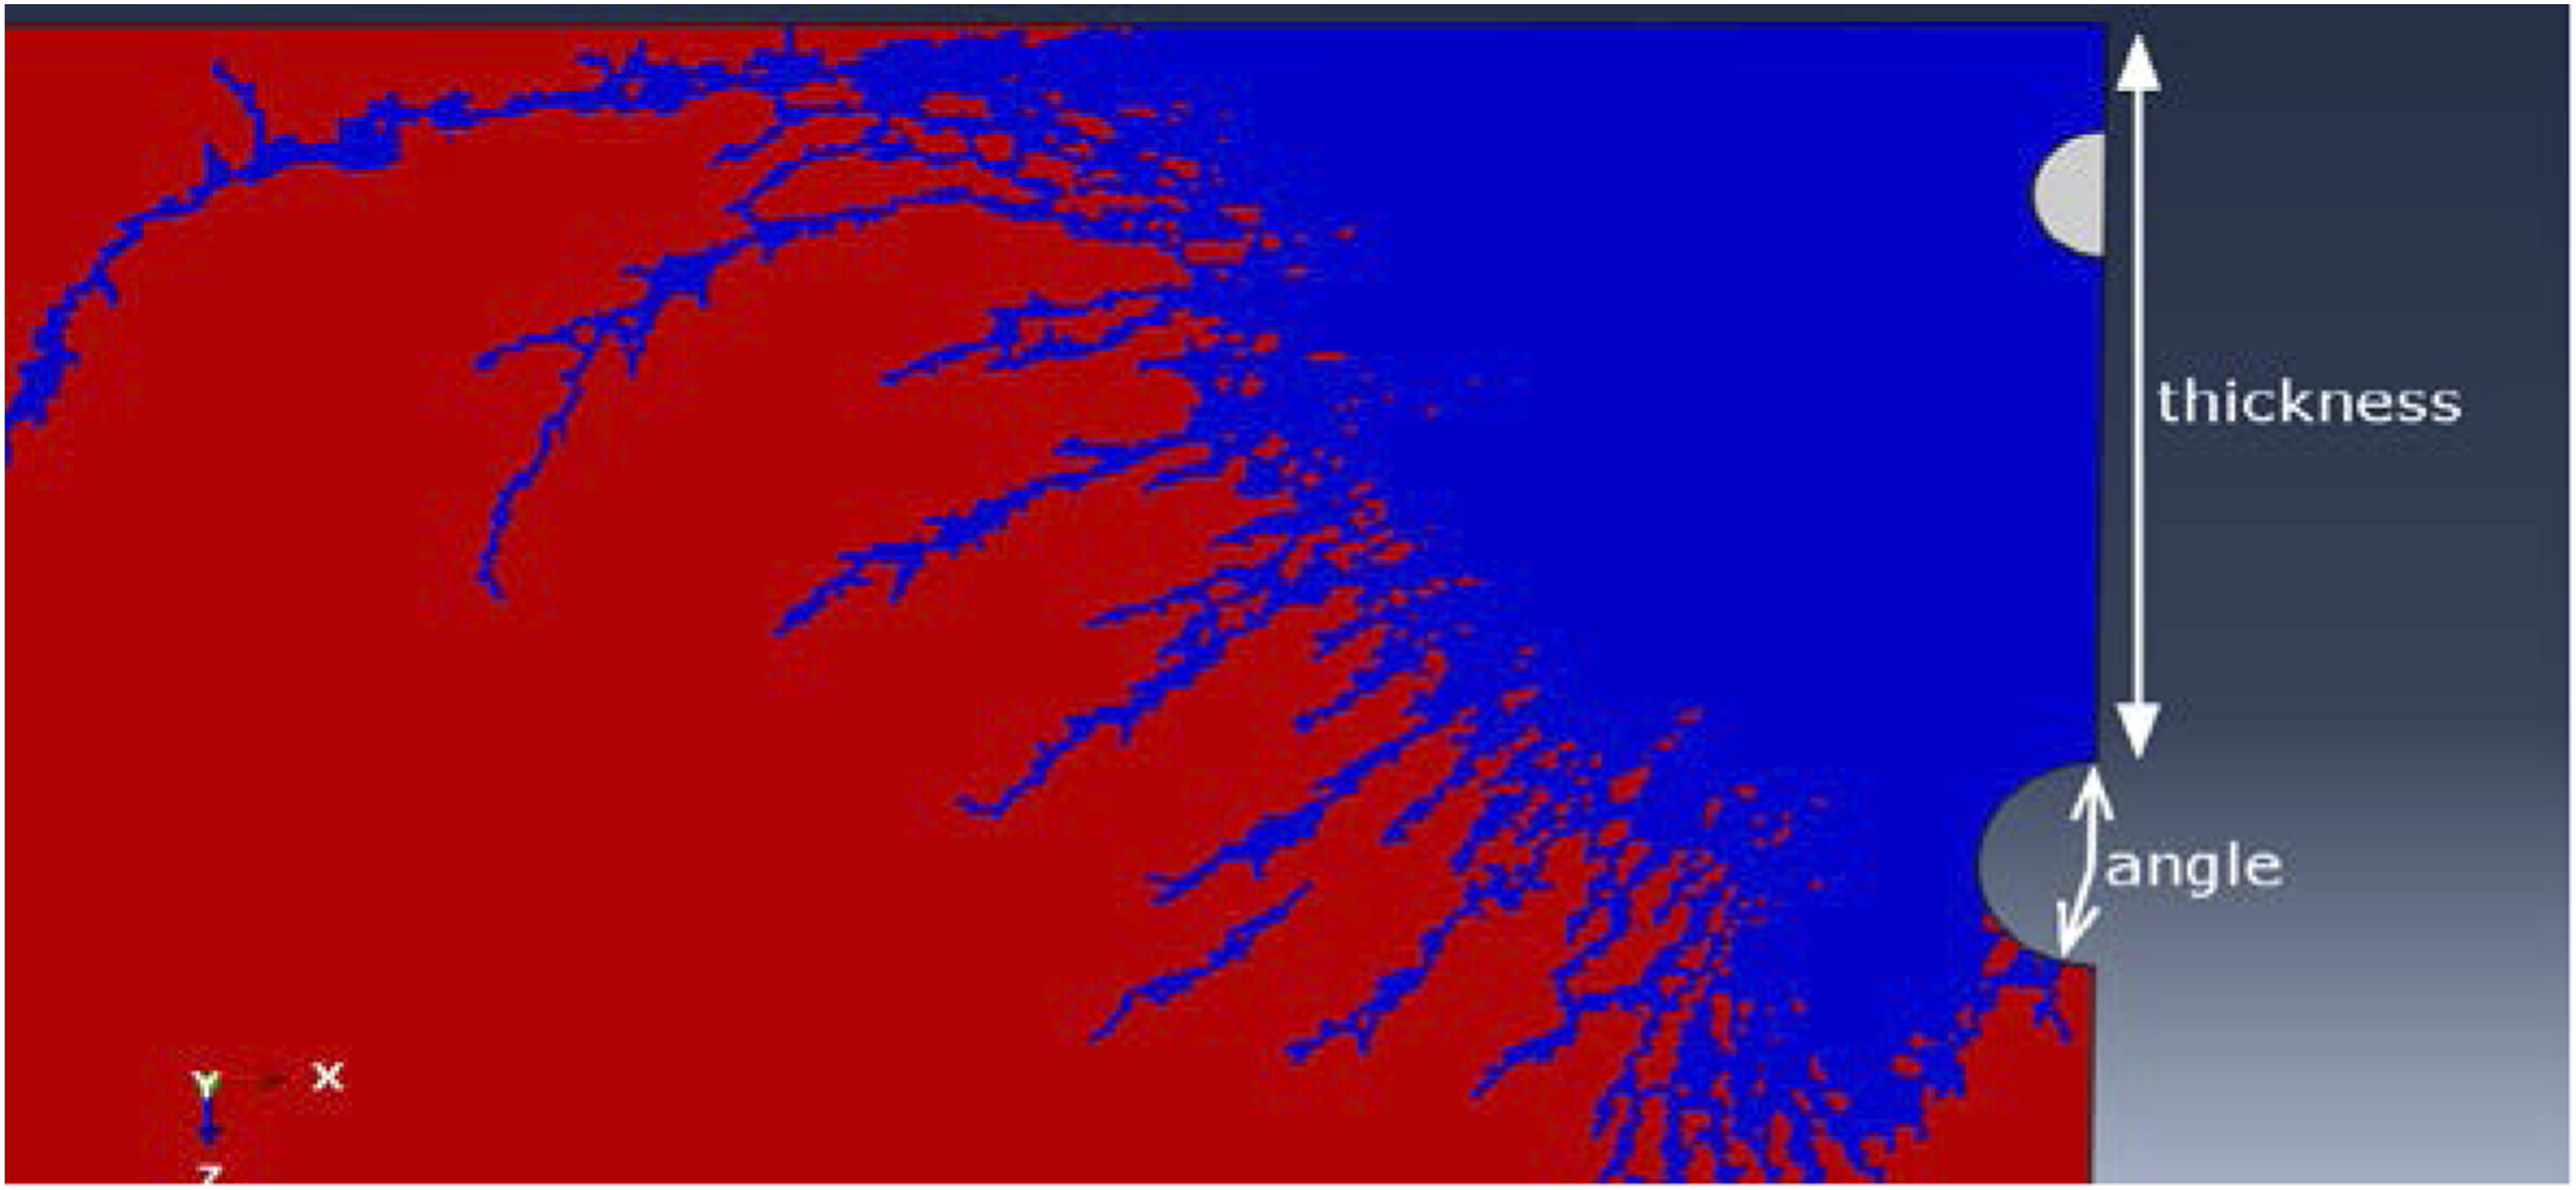
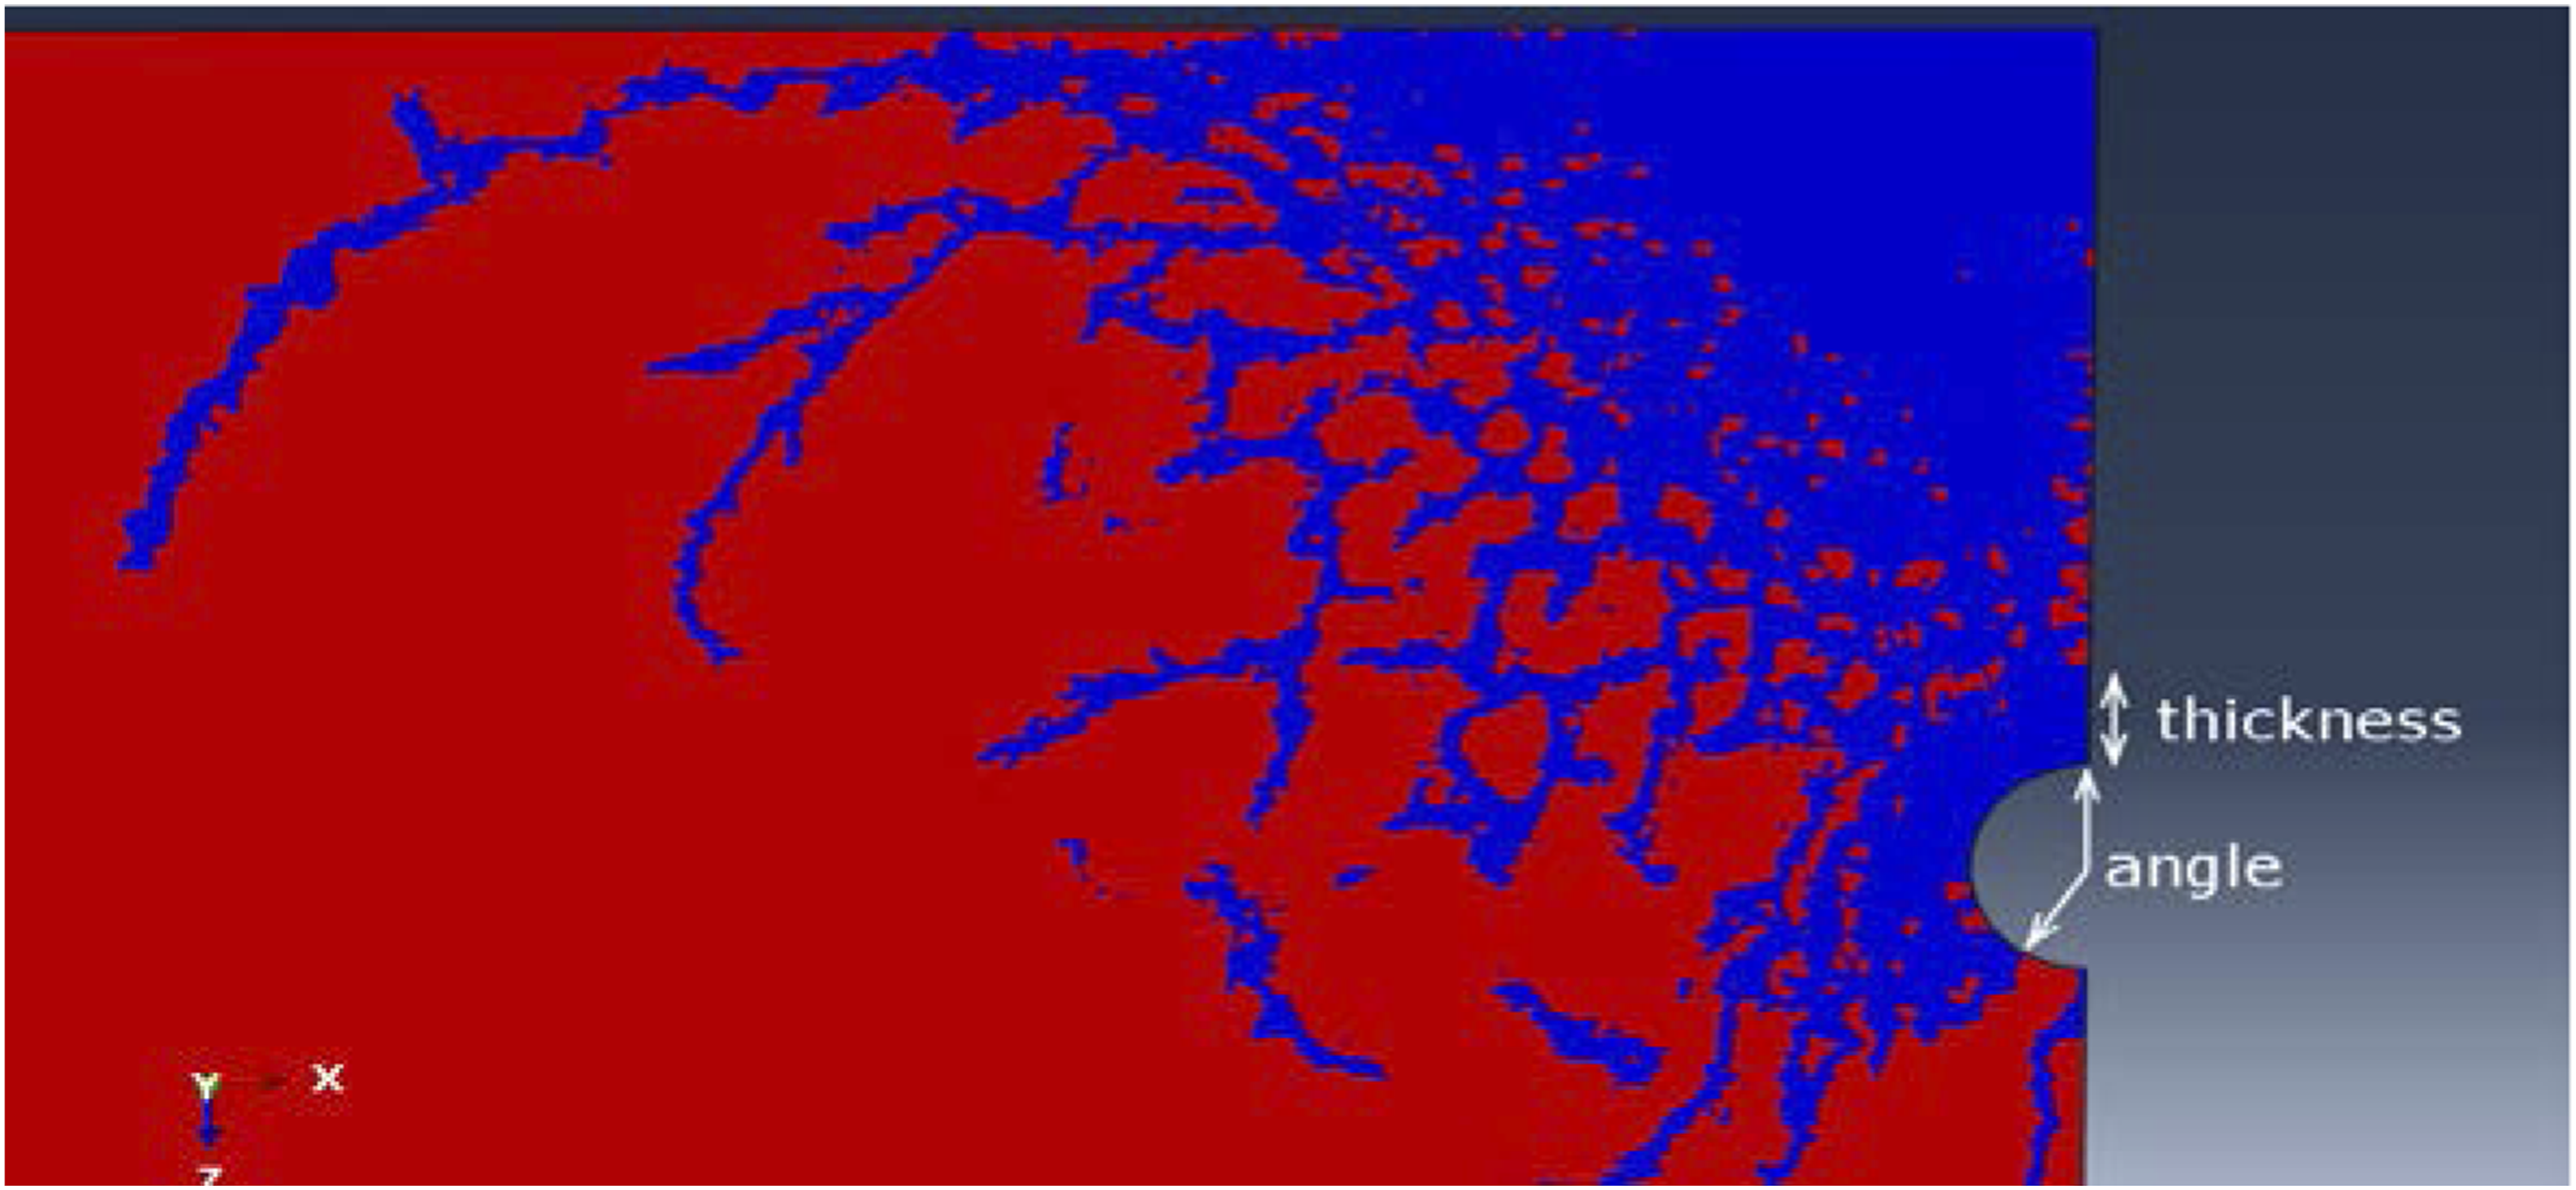

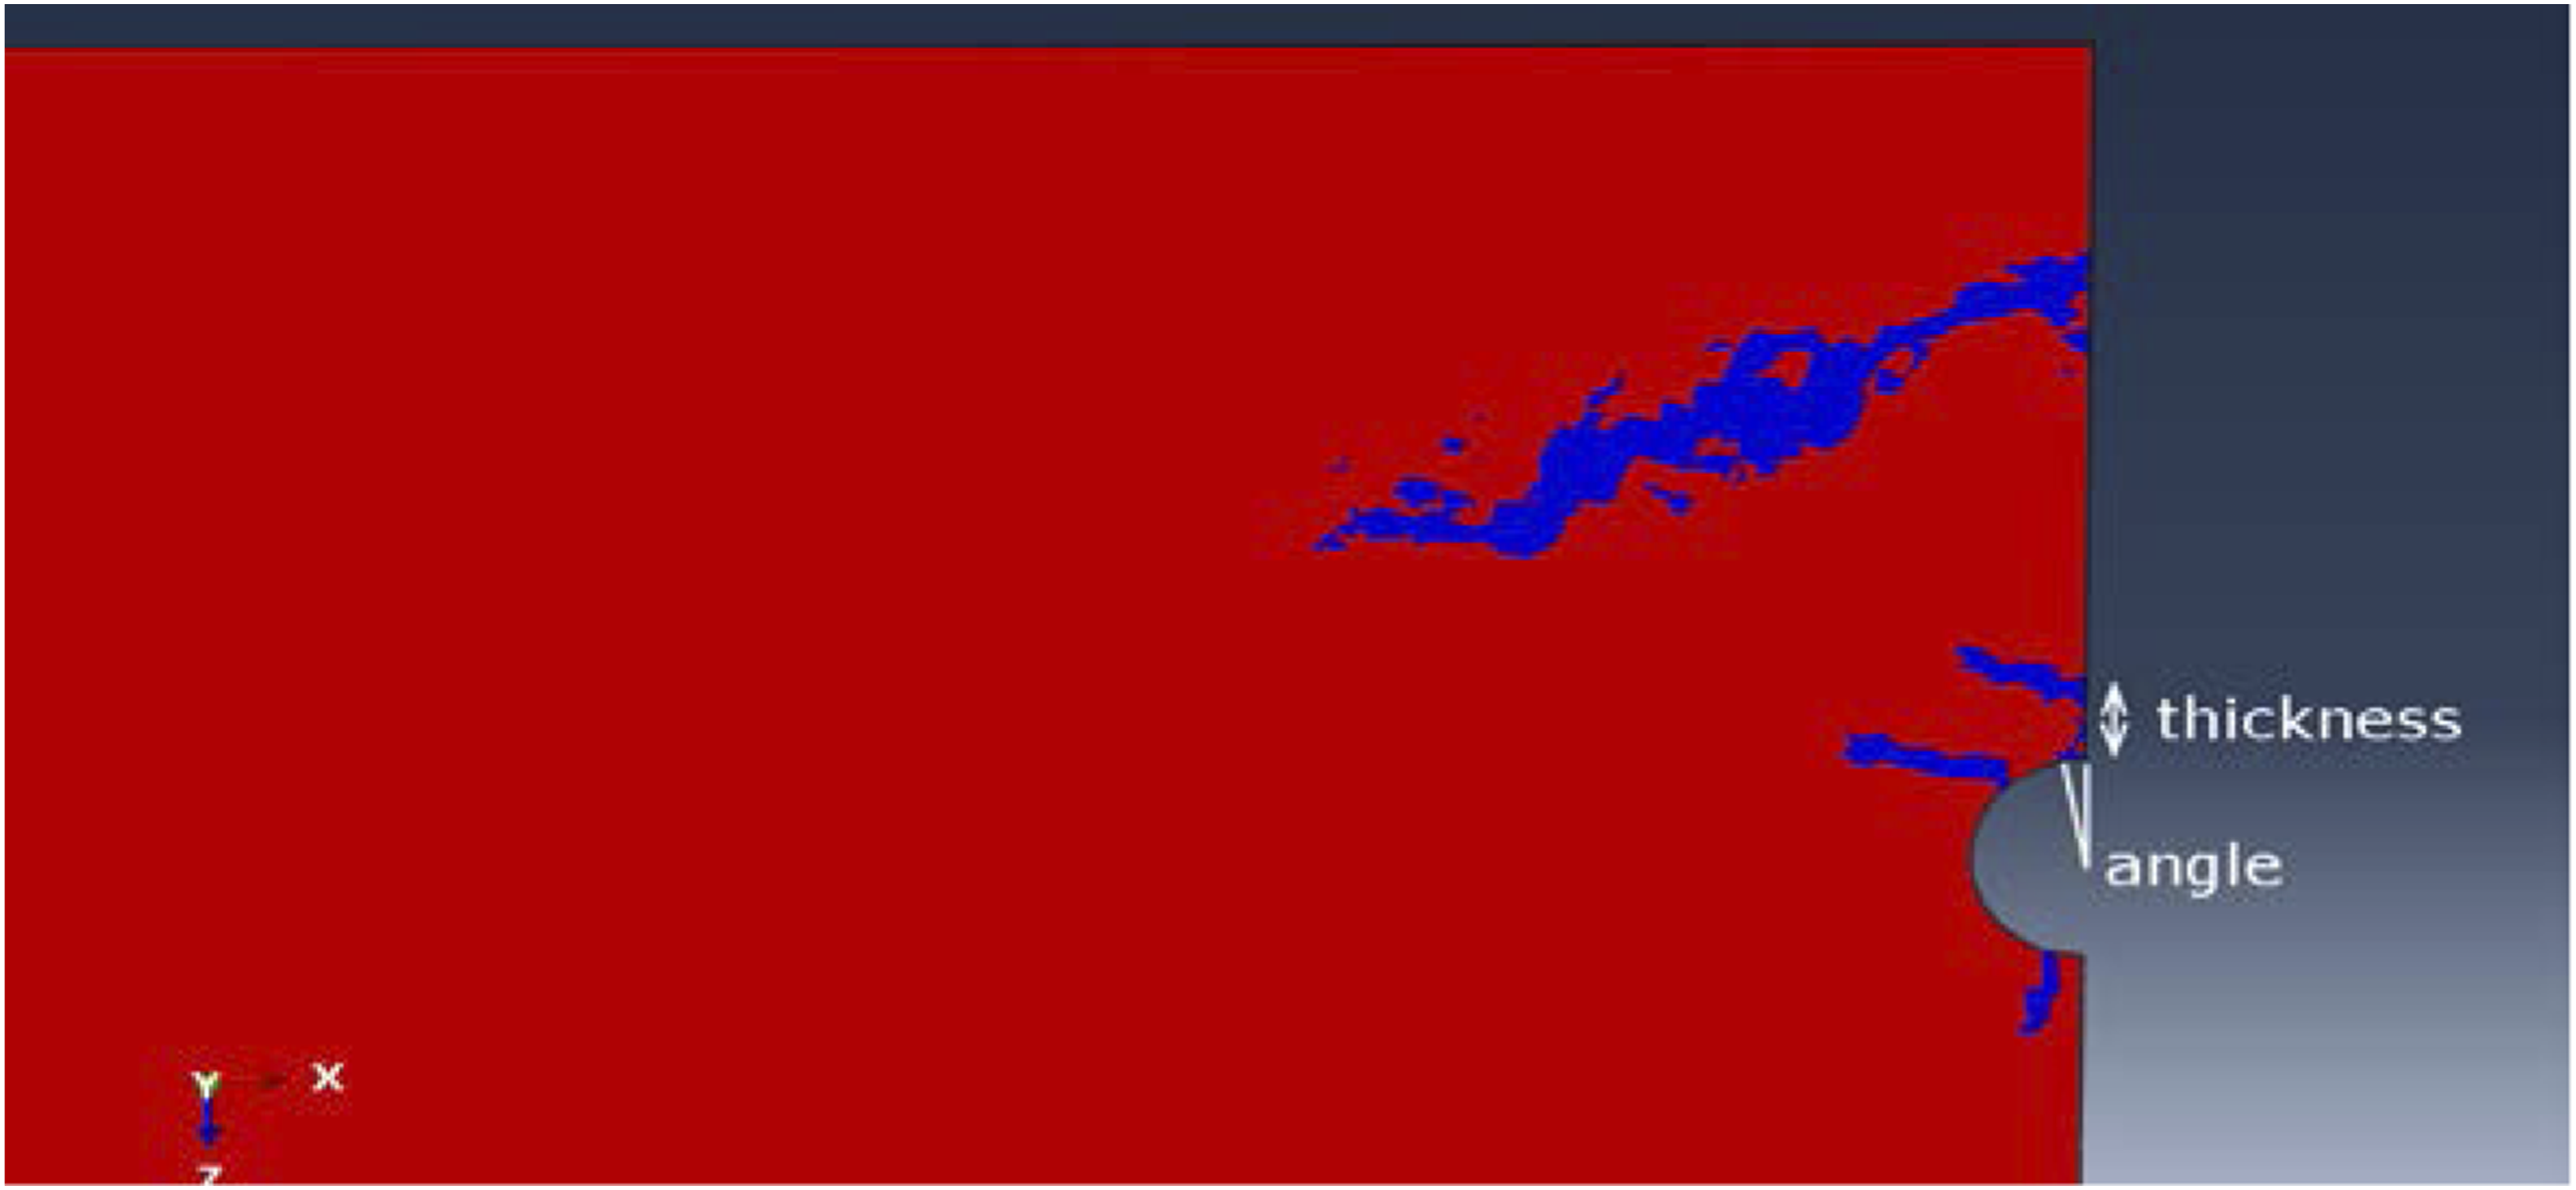
Figure 13 shows that most of the tunnel’s cross-section breaks down and the damage reaches the ground surface. Figure 14 shows a slight decrease in the spread of fractures around the cross-section of the tunnel, with the emergence of rock pieces above the top of the tunnel. This means that the failure will not continue to the surface, which indicates the end of zone 1 and the beginning of zone 2. Figure 15 shows the concentration of the damage in the upper part of the cross-section of the tunnel, which indicates the beginning of zone 3. Then the damage continues to its end, that is shown in Figure 16 as a vertical crack above the top of the tunnel.
Fracture thickness at the end of the damage zones.
The fracture angle at the end of the damage zones.
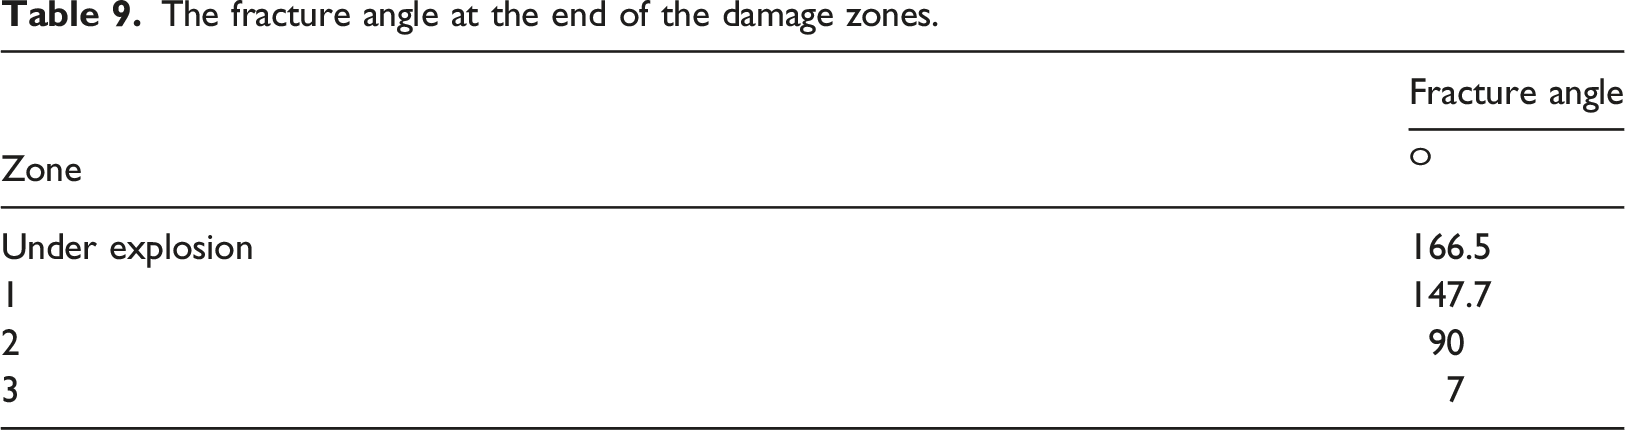
Figure 17 shows the fracture angle in terms of the scaled distance from the center of the explosion. Based on Figure 17, an equation to calculate the fracture angle for any cross-section of the tunnel can be obtained. This equation is given as follows The fracture angle in the tunnel in terms of the scaled distance from the detonation center.
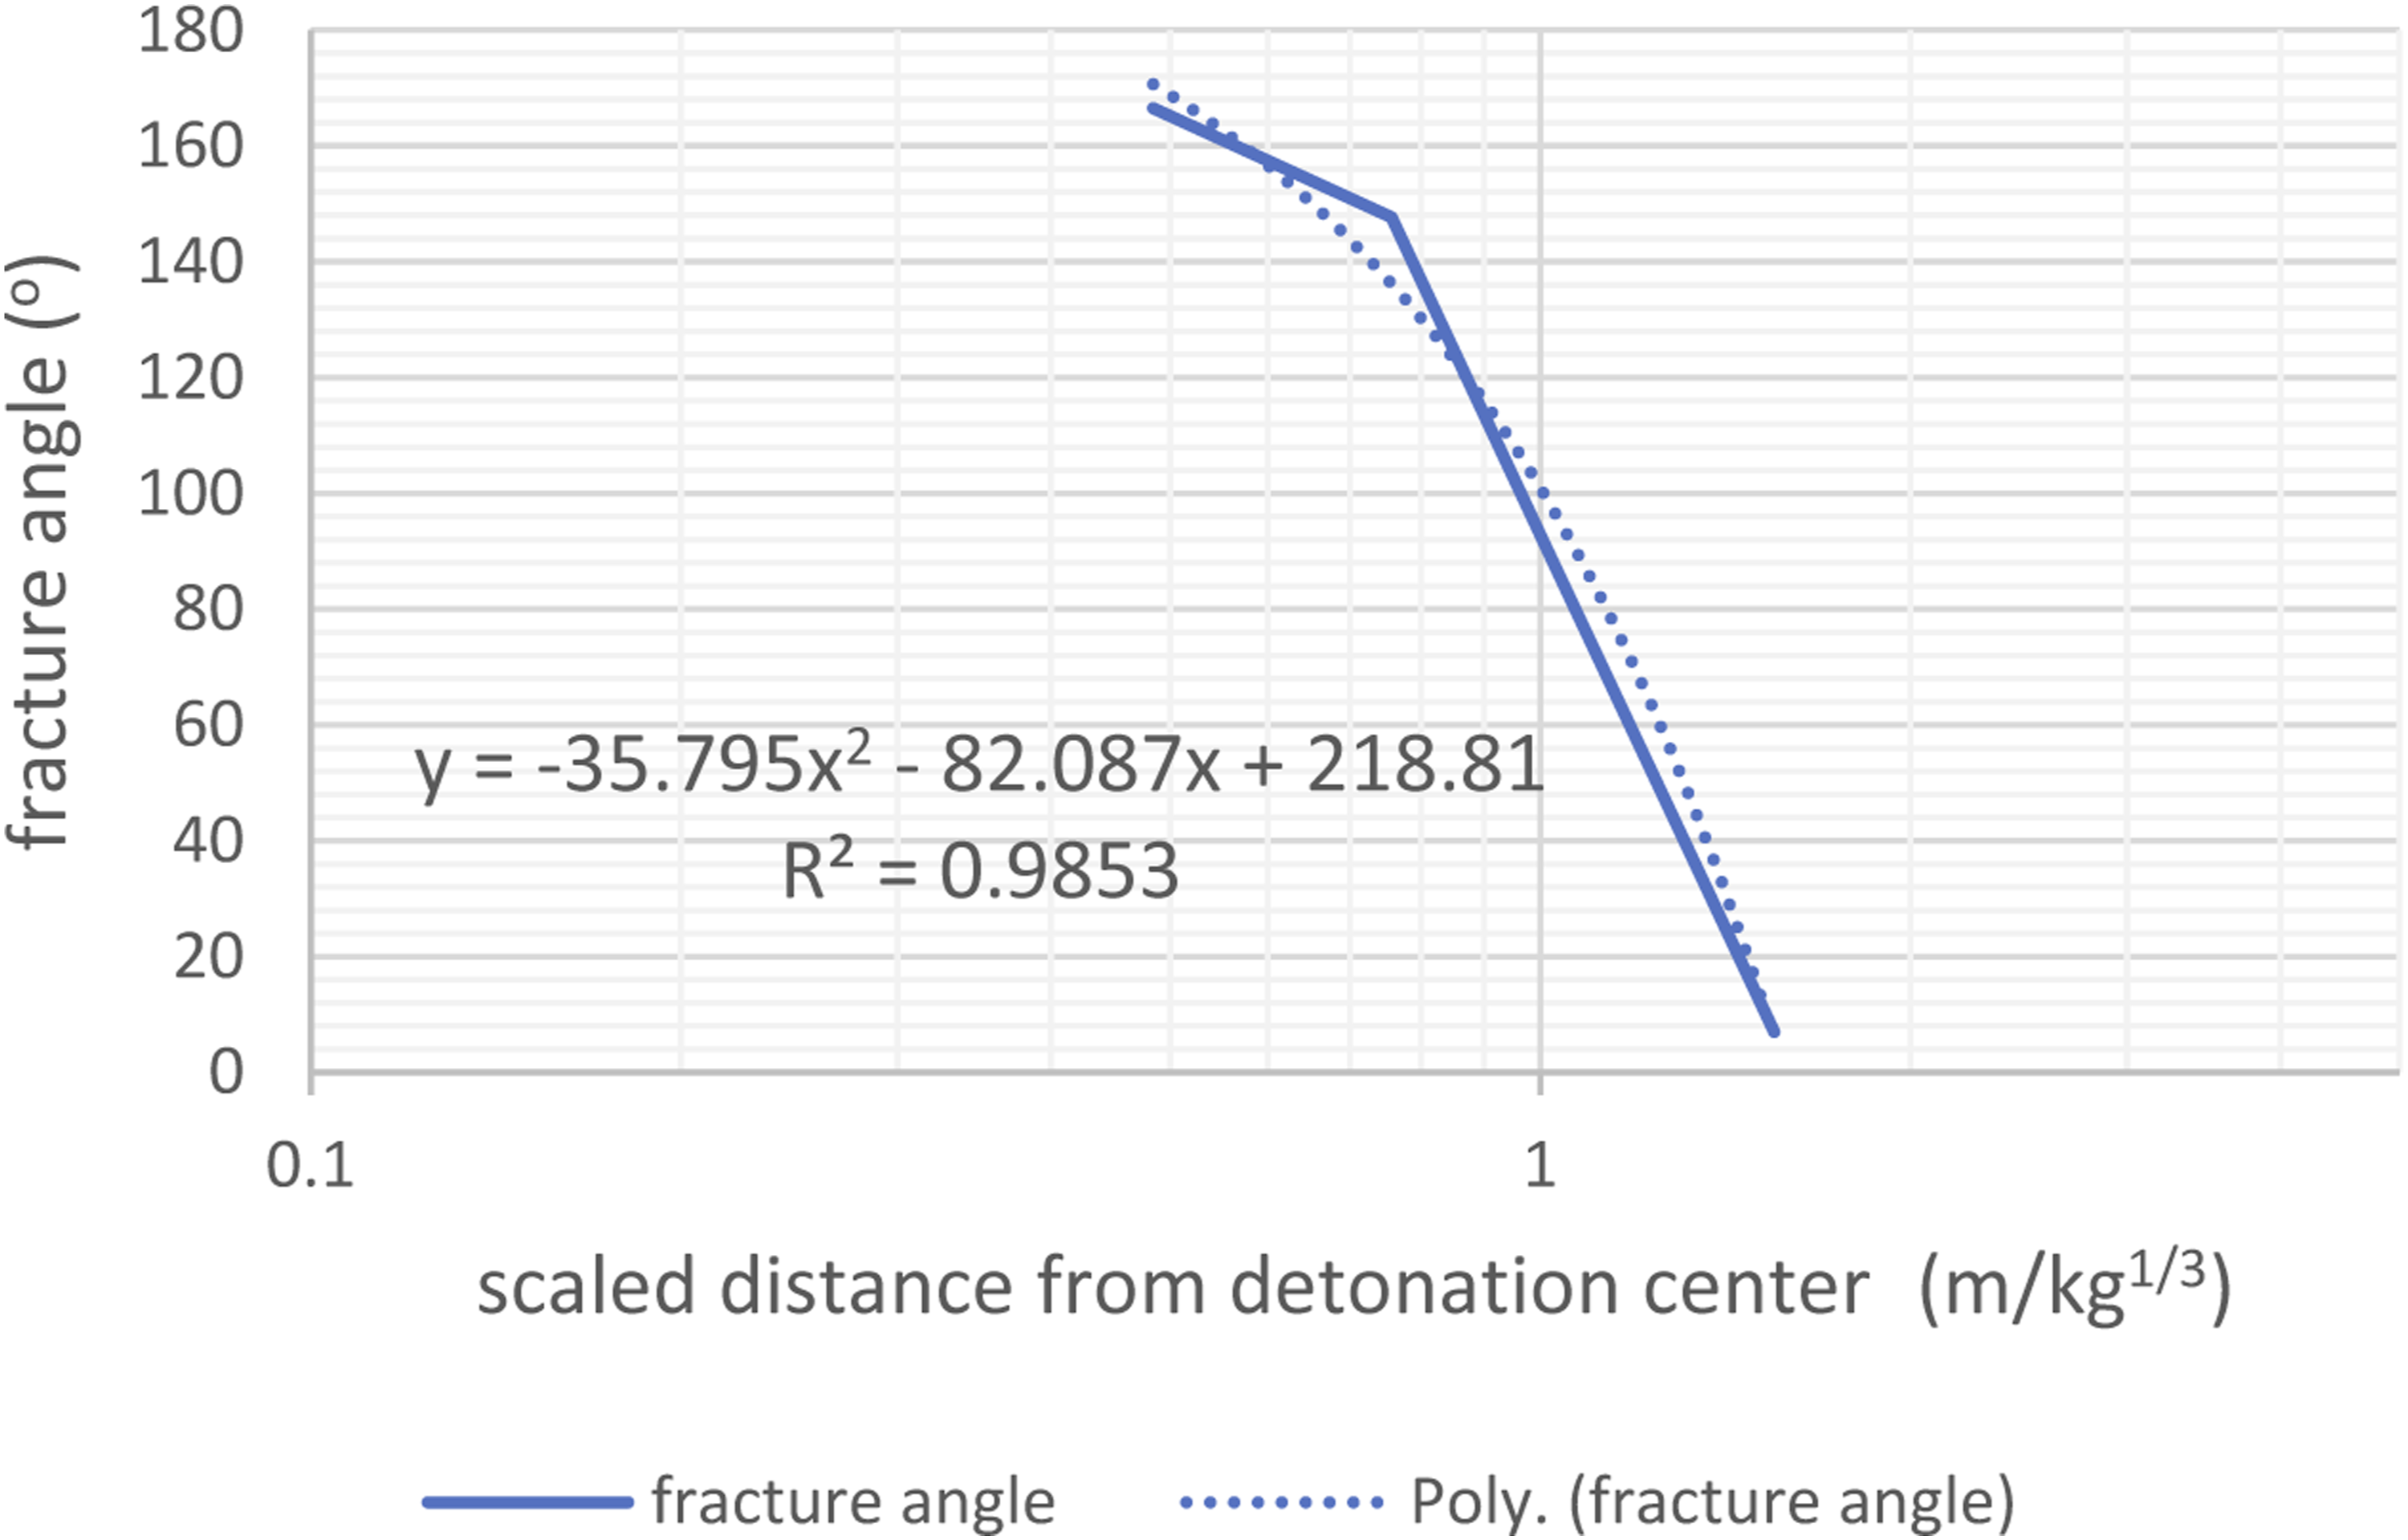
α is the fracture angle in degrees, R is the distance from the detonation center in (m), and W is the explosive weight in (kg).
From Tables 8 and 9, and Figures 14 to 16, it is remarkable that there is a possibility of calculating the failure area in each cross section of the tunnel. It can be noted that the main parameter that affects the change in the failure area is the fracture angle.
The failure area at the end of damage zones.

Figure 18 shows a schematic comparison between the percentage of the failure area generated in the numerical model and the percentage of the failure area generated in ERA tests. It appears that the failure area in the numerical model remains within the range given in ERA tests. Comparison of the failure area percentage between numerical analysis and ERA tests.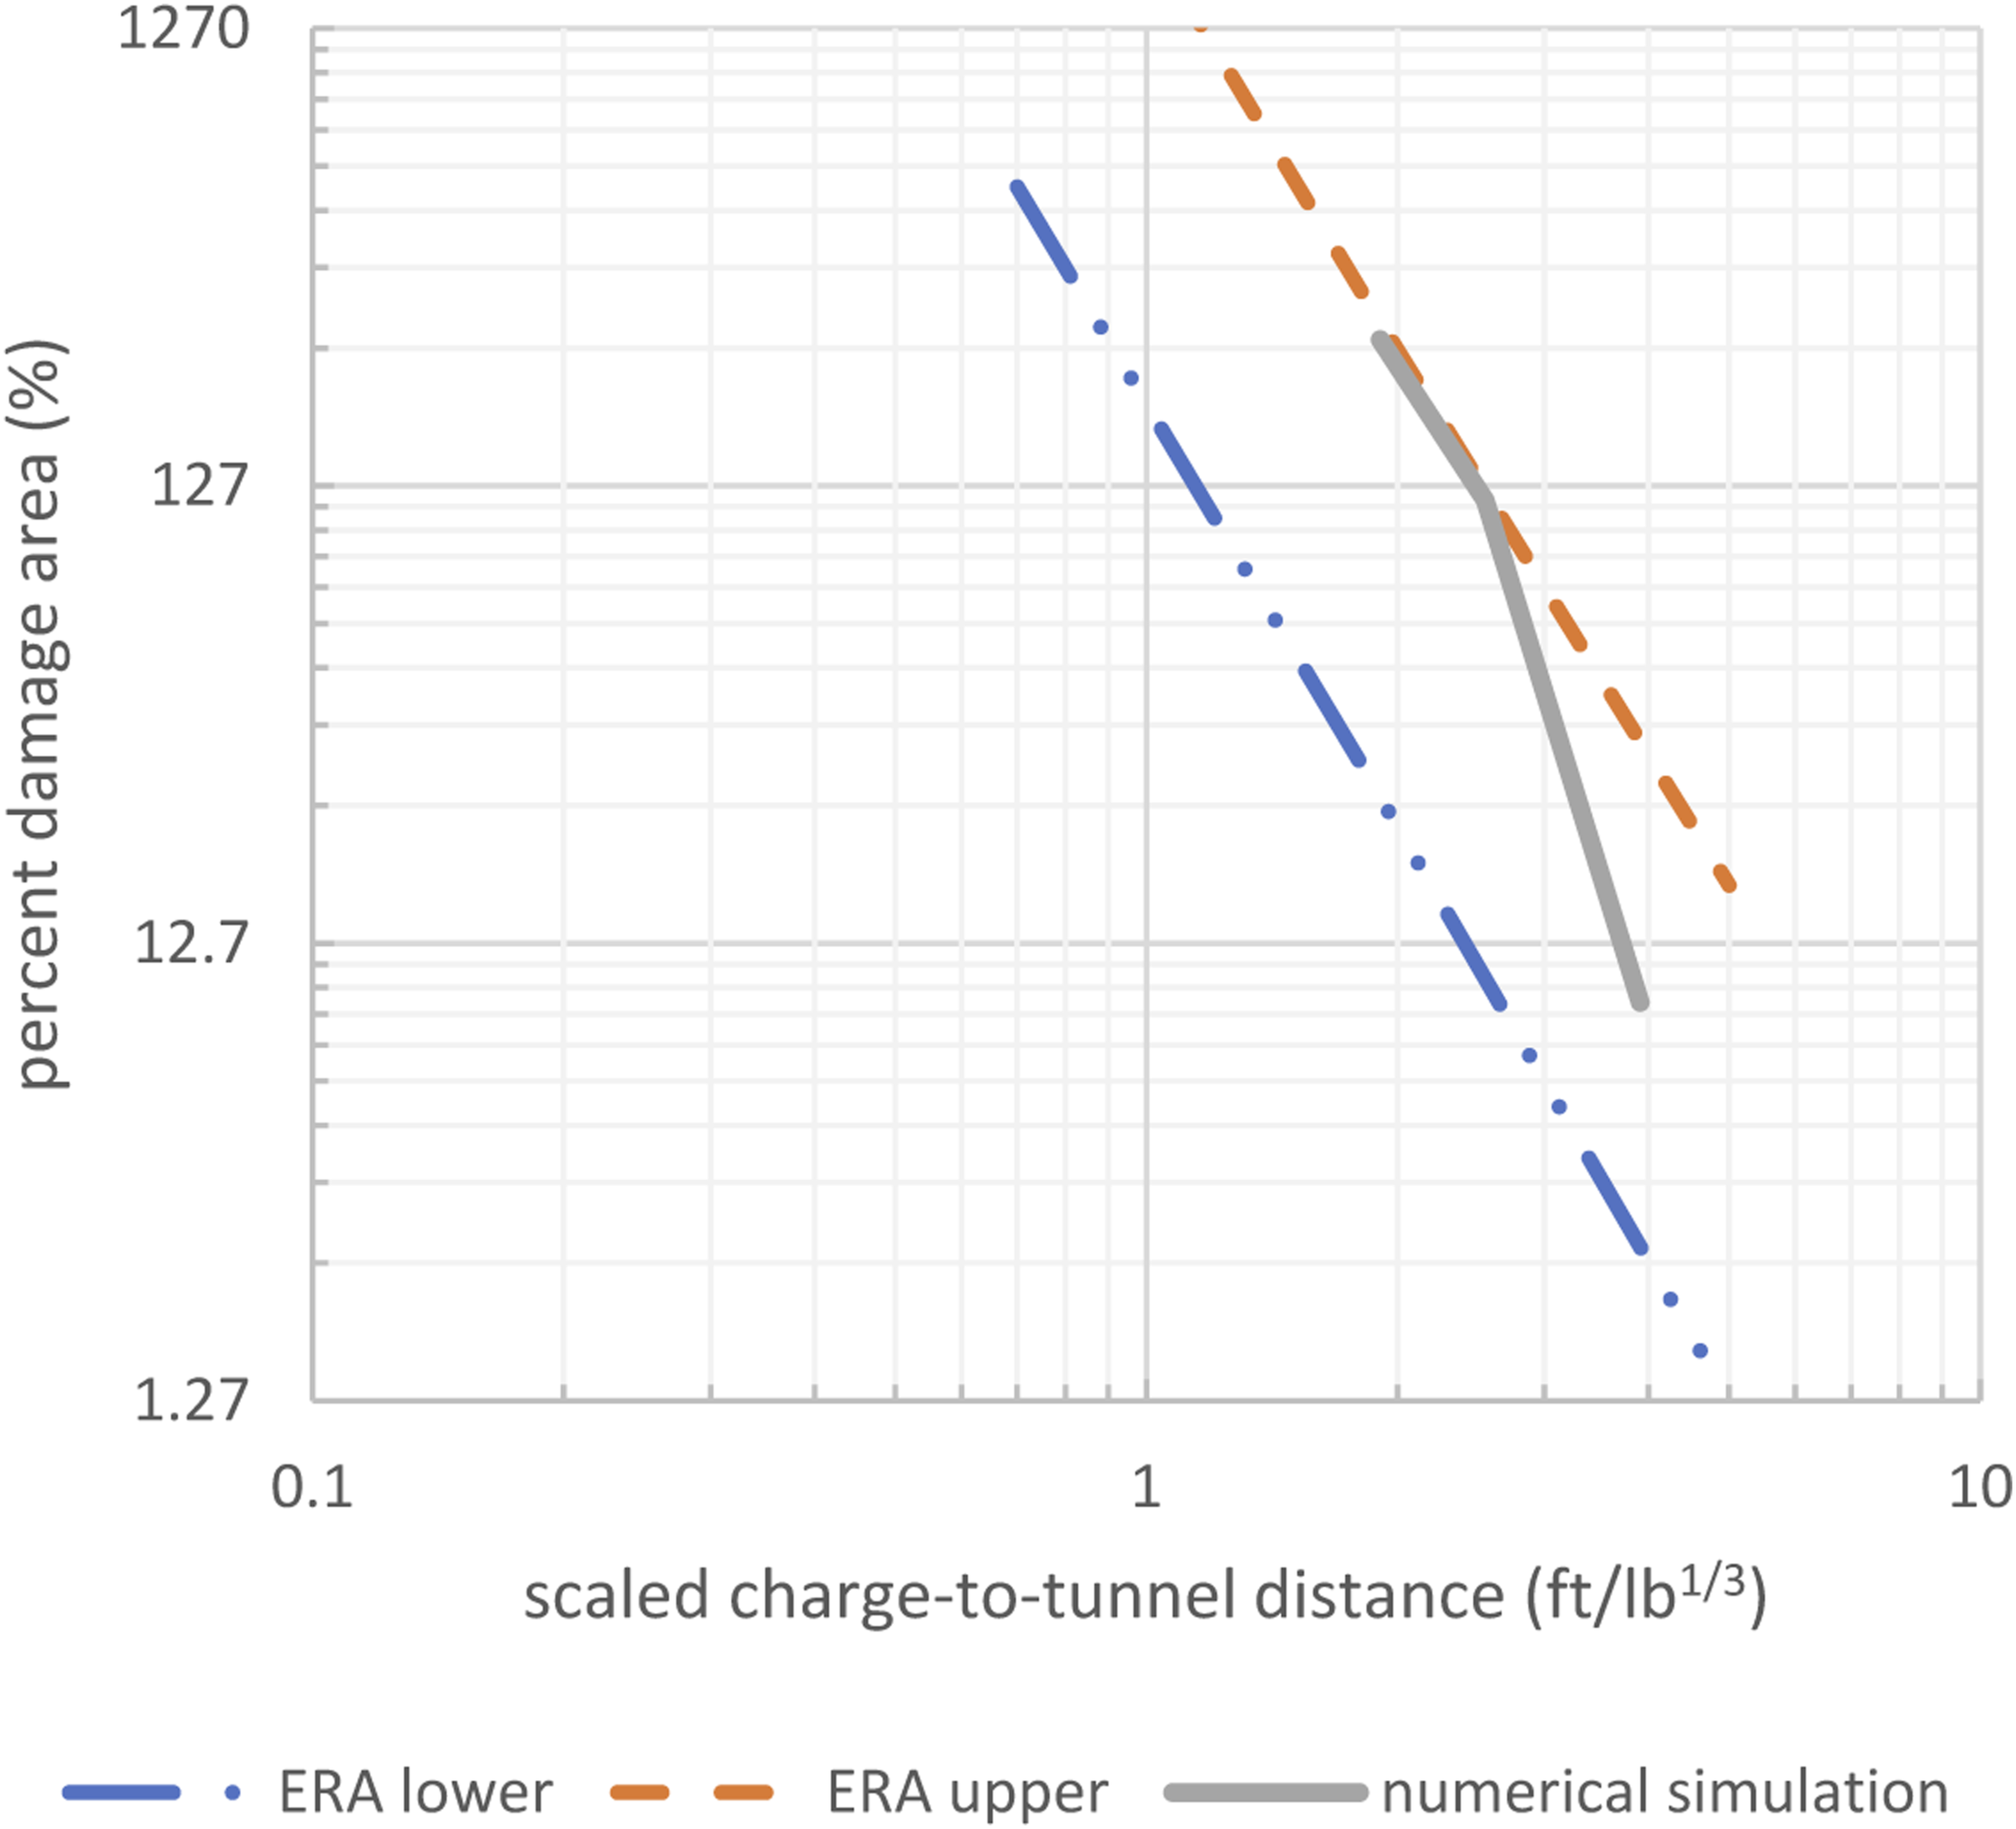
Conclusion
In this study, one of ERA field tests is simulated in order to study the effect of external explosion on unlined rock tunnels. This simulation is conducted by using a 3D numerical model and the brittle cracking model in ABAQUS program.
By comparing the results of the current study with the results of ERA tests, the following points are obtained: 1. Numerical modeling gives results that are in great agreement with the results of ERA tests in terms of the extent of the damage zones and the failure area. 2. The failure thickness in each cross section of the tunnel is clearly defined, as the numerical modeling shows that this failure thickness does not change significantly after the end of damage zone 1, in which the failure reaches the ground surface. 3. The numerical modeling shows that the fracture angle decreases significantly with the increase in the distance from the detonation center. An equation is deduced to calculate the fracture angle changes in terms of the scaled distance from the detonation center. 4. The fracture angle equation can be used for tunnels with a scaled diameter equal or less than 0.174 m/kg1/3. For tunnels with a larger scaled diameter, this equation does not apply.
Footnotes
Acknowledgements
This research did not receive any specific grant from funding agencies in the public, commercial, or not-for-profit sectors.
Declaration of conflicting interests
The author(s) declared no potential conflicts of interest with respect to the research, authorship, and/or publication of this article.
Funding
The author(s) received no financial support for the research, authorship, and/or publication of this article.
