
Abstract
Compared to alternative blast loading formulations, the Friedlander-type loading function effectively captures the attenuation characteristics inherent in explosive pressure-time histories, making it extensively adopted for validating blast loading effects on structures. This empirical model also demonstrates significant potential for enabling refined blast-resistant design methodologies in structural engineering. Furthermore, beam components have gained widespread application in protective structural systems due to their inherent energy absorption capacity and load redistribution mechanisms under blast-induced dynamic loading conditions. Considering the enhanced plastic resistance characteristics of beam components, this study investigates the variation of the dynamic coefficient of beam components under Friedlander-type blast loading. The motion differential equations for both flexible and rigid beam components at different stages are derived using the equivalent single-degree-of-freedom (SDOF) method. The results of dynamic coefficient calculations under 27 typical loading conditions are presented. The displacement response of I-shaped steel beams under Friedlander-type blast loading for different conditions is simulated using the finite element software LS-DYNA. The theoretical results are then compared with finite element and code-based calculations, validating the feasibility of the proposed theory through multiple methods. The research findings indicate that the finite element method results align well with the theoretical results derived from the Friedlander-type loading model. The current blast-resistant design code is more applicable to flexible beam components, while it shows significant discrepancies for rigid beams, which could hinder blast-resistant design. Both the resistance enhancement factor and the Friedlander-type loading shape parameter reduce the dynamic coefficient, with the latter exerting a stronger influence on the dynamic coefficient than the resistance enhancement factor.
Introduction
Blast loading, characterized by a high overpressure peak and short duration, are often simplified as linear decay loads in various national engineering blast-resistance design codes (Department of the Army, 1990; Biggs, 1964; Canadian Standards Association, 2012; China Architecture and Building Press, 2006; Department of the ; China Architecture and Building Press, 2012). After introducing a dynamic coefficient, blast loading is equivalently treated as static loading. Enhancing the accuracy of dynamic response calculations for beam components under blast loading has been a key research focus in structural blast resistance. For instance, Wei et al. (2023), Liao et al. (2019), Chen et al. (2020), Ma et al. (2023), and Nagata et al. (2018) conducted field explosion tests on reinforced concrete beam components. Using the equivalent single-degree-of-freedom (SDOF) method, they calculated the dynamic response of beam components under blast loading and compared these results with experimental data, indicating that the SDOF method is an effective tool for calculating dynamic responses under blast loading. Chen et al. (2021) and Luo et al. (2020) developed blast analysis models for beam components based on the equivalent SDOF method, and performed explosion resistance tests on eight hybrid fiber lightweight aggregate concrete beams. Their results showed that the SDOF model provided a good match with experimental data, further validating the reliability of the SDOF theoretical model. Liu et al. (2021) theoretically derived the dynamic coefficient under series-type explosive loading curves, suggesting a high correlation between the dynamic coefficient and the shape parameter. Geng et al. (2019) used the Friedlander-type loading to study the effect of the shape parameter on the dynamic coefficient of beam components under blast loading, demonstrating that an increase in the shape parameter leads to a reduction in the dynamic coefficient. Cheng et al. (2009), Lin et al. (2001), and Xin et al. (2018) found that Friedlander-type blast loading could accurately model the propagation of shock waves over time. Zhang et al. (2019) analyzed TNT implosion test loads using Friedlander-type loading and showed that this model accurately described the changes in blast loading. Nassr et al. (2012) conducted static tests on six I-shaped steel beams, revealing that all beams exhibited resistance enhancement in the plastic phase and indicating that the plastic resistance enhancement model could accurately describe the relationship between resistance and deformation in components. Hu et al. (2023) suggested that the resistance enhancement effect in the plastic phase significantly influences the overall displacement of steel beams. Chen et al. (2010) pointed out that the resistance enhancement effect notably reduces the dynamic coefficient. Fallah and Louca, (2007) and Cui et al. (2021) used an elastic-plastic enhancement model based on the SDOF system to generate pressure-impulse (P-I) diagrams with the resistance enhancement coefficient as a variable, and concluded that considering the resistance enhancement coefficient provides more accurate predictions of component dynamic responses. Lan et al. (2018) studied the explosion response of components based on the rigid-plastic model both theoretically and numerically. Geng et al. (2021) found that for structures with higher ductility ratios, the dynamic coefficient is smaller, leading to better blast resistance performance. Xu et al. (2018) analyzed the impact of blast loading duration on the dynamic coefficient using both theoretical and finite element simulations.
In summary, current research on dynamic coefficients of beam components under blast loading has generally employed simple load functions and resistance models, without conducting in-depth studies on the dynamic coefficient under blast loading effects. By adopting the more precise Friedlander-type blast loading in conjunction with the plastic resistance enhancement model, more accurate conclusions regarding the influencing factors of dynamic coefficients for beam components can be obtained.
Based on this, considering the classification of flexible and rigid beam components (Geng et al., 2023) the motion displacement solutions for different stages of beam components were solved. Twenty-seven typical working conditions were designed, and feasibility verification was conducted by comparing finite element simulations, current blast-resistant design codes, and theoretical calculations from this study. The effects of different shape parameters and resistance enhancement coefficients on the dynamic coefficient of beam components were analyzed, providing a theoretical basis for blast-resistant design of beam components.
Friedlander-type blast loading and differential equations of plastic resistance enhancement in the SDOF system of beam components
Friedlander-type blast loading and plastic resistance enhancement model
In this study, the dynamic response of beam components under Friedlander-type blast loading is accurately analyzed using the plastic resistance enhancement model based on the single-degree-of-freedom (SDOF) system. The Friedlander-type blast loading curve is shown in Figure 1 below.The relationship between the resistance R of the component during positive motion and its deformation y is shown in Figure 2. The specific expressions for the Friedlander-type blast loading and the plastic resistance enhancement model are as follows Cheng et al. (2009): Schematic diagram of Friedlander-type blast loading. Plastic resistance enhancement model.

Differential equations of the elasto-plastic equivalent system
According to the theory of the equivalent single-degree-of-freedom (SDOF) system, the differential equation for the elastic response stage of the beam component is given by:


At the end of the elastic motion phase, the beam component reaches the peak elastic displacement yT, after which it enters the plastic motion phase. In this phase, the plastic resistance enhancement model is considered, and the equivalent SDOF differential equation is given by:


Dynamic response solution for flexible beam components
Elastic forced motion stage
At the initial stage of the blast loading application, the beam component enters the elastic forced motion phase with external loading, where both displacement and velocity are set to zero as initial conditions. The duration of this phase is defined by the relationship 0 < t < tz. By solving equation (3) and combining equations (2) and (4), the expressions for displacement and velocity in this stage are derived as:

Substituting the initial conditions of zero displacement and velocity into equations (7) and (8), the constants C1 and C2 can be solved as:


Substituting tz into equations (7) and (8), and using equations (10) and (11), the expressions for displacement yz and velocity vz at the end of the elastic forced motion phase can be obtained.
Elastic free motion stage
After the blast loading is removed, the beam component enters the elastic free motion phase, with no external loading and initial conditions of displacement yz and velocity vz. The duration of this phase is defined by the relation tz<t<tT, where tT is the time required for the beam component to reach the peak elastic displacement. The equivalent SDOF differential equation for this phase is given by:

By solving equation (13), the expressions for displacement and velocity during this phase are obtained as:


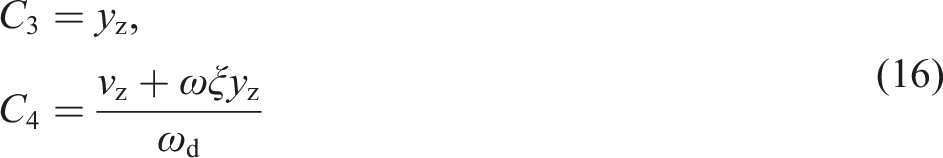
Substituting the initial conditions yz and vz into equations (14) and (15), the constants C3 and C4 are solved as:
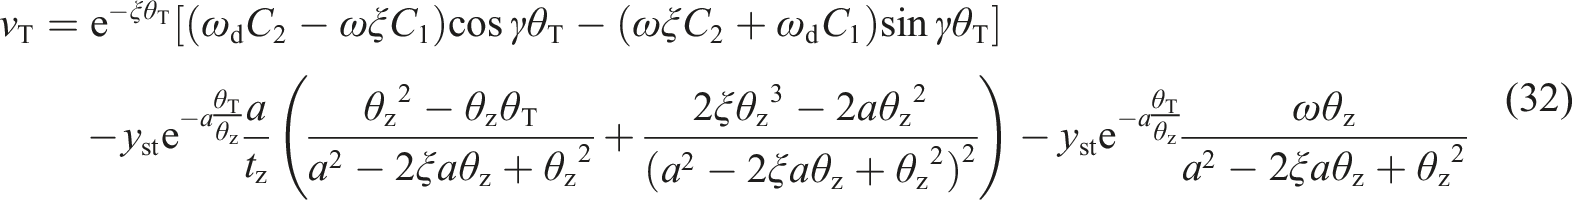
By substituting t = tT into equations (14) and (15) and combining with equation (16), the displacement and velocity expressions at this moment can be obtained as:


Plastic free motion stage
After the elastic free motion phase, the beam component enters the plastic free motion phase, with no external loading and initial conditions of displacement yT and velocity vT. The duration of this phase is defined by the relation tT<t<tm, where tm is the time required for the beam component to reach the peak elasto-plastic displacement. The equivalent SDOF differential equation for this phase is given by:

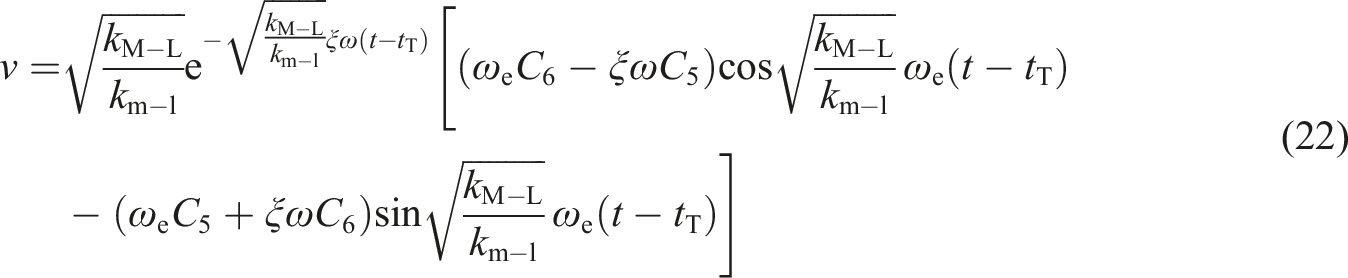
Depending on the relationship between the damping ratio ξ and the resistance enhancement coefficient α, equation (20) needs to be solved in two cases: (1) When ξ2<α: By solving equation (20), the expressions for displacement and velocity in this case are:


Substituting the initial conditions yT and vT into equations (21) and (22), the constants C5 and C6 are solved as:

Setting equation (22) to zero, the time tm corresponding to the peak elasto-plastic displacement ym is obtained as:

Substituting equations (24) and (25) into equation (21), the expression for the displacement at the peak elasto-plastic displacement ym is obtained. (2) When ξ2≥α: By solving equation (20), the expressions for displacement and velocity in this case are:


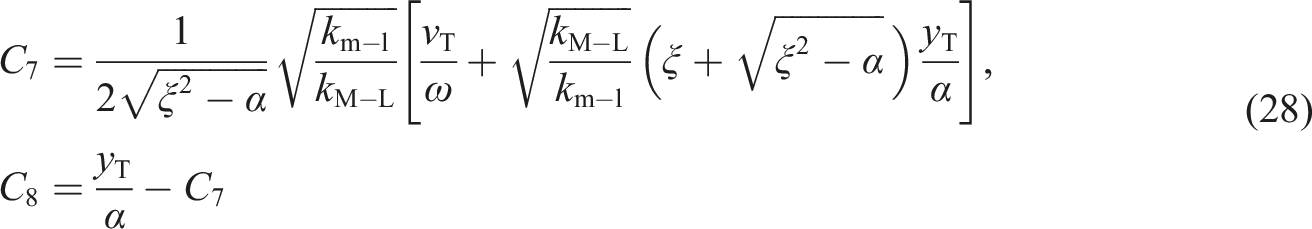
Similarly, the constants C7 and C8 are solved, and the time tm corresponding to the peak elasto-plastic displacement ym is obtained as:

Substituting equations (28) and (29) into equation (26), the expression for the displacement at the peak elasto-plastic displacement ym is obtained.
Based on the theoretical model of blast loading for the beam component and the definitions of anti-explosion parameters, the expressions for the equivalent static loading dynamic coefficient kh and ductility ratio β are given by:

Substituting the values of yT and ym from both cases into equation (30), the dynamic coefficient and ductility ratio for flexible beam components can be obtained.
Dynamic response solution for rigid beam components
Elastic forced motion stage
For rigid beam components, the elastic forced motion phase occurs within the time interval 0 < t < tT. The equivalent SDOF equation for this phase is the same as equation (3). By directly substituting t = tT into equations (7) and (8), the expressions for displacement and velocity at the end of the elastic phase of the rigid beam component are obtained as:

Plastic forced motion stage
After the elastic forced motion phase, the blast loading continues to act on the beam component, which enters the plastic forced motion phase with initial conditions of displacement yT and velocity vT. The duration of this phase is defined by the relation tT<t<tz. The equivalent SDOF differential equation for this phase is given by:

Similar to the method for solving the plastic free motion stage for flexible beam components, solving equation (33) also requires considering two cases: (1) When ξ2<α: By solving equation (33), the expressions for displacement and velocity are:
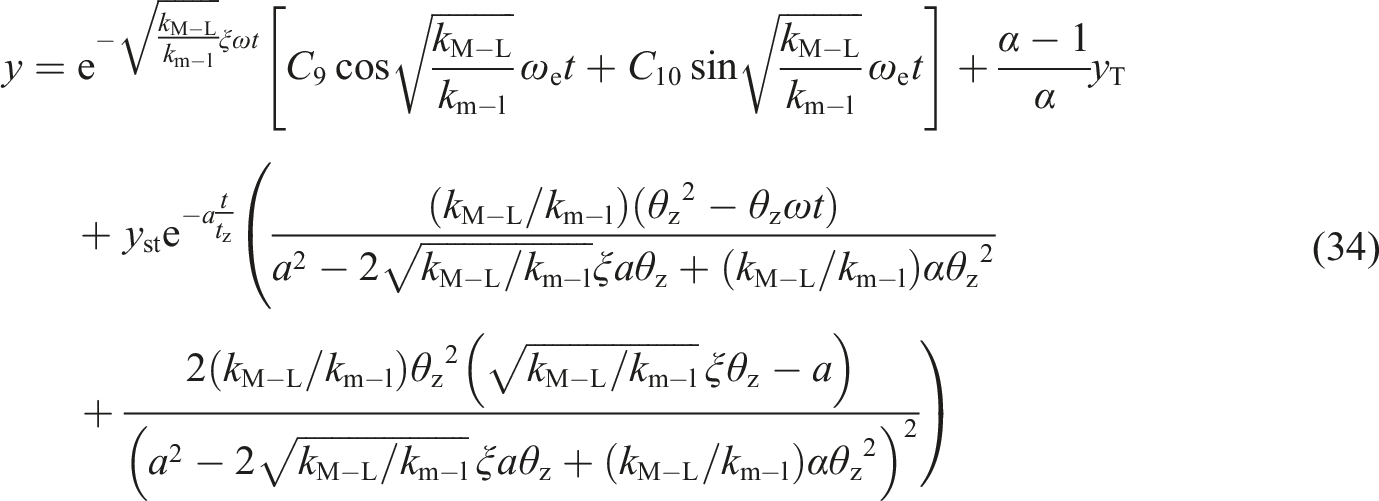

To simplify the expressions for displacement and velocity after substituting the initial conditions of displacement yT and velocity vT into equations (34) and (35), we define:
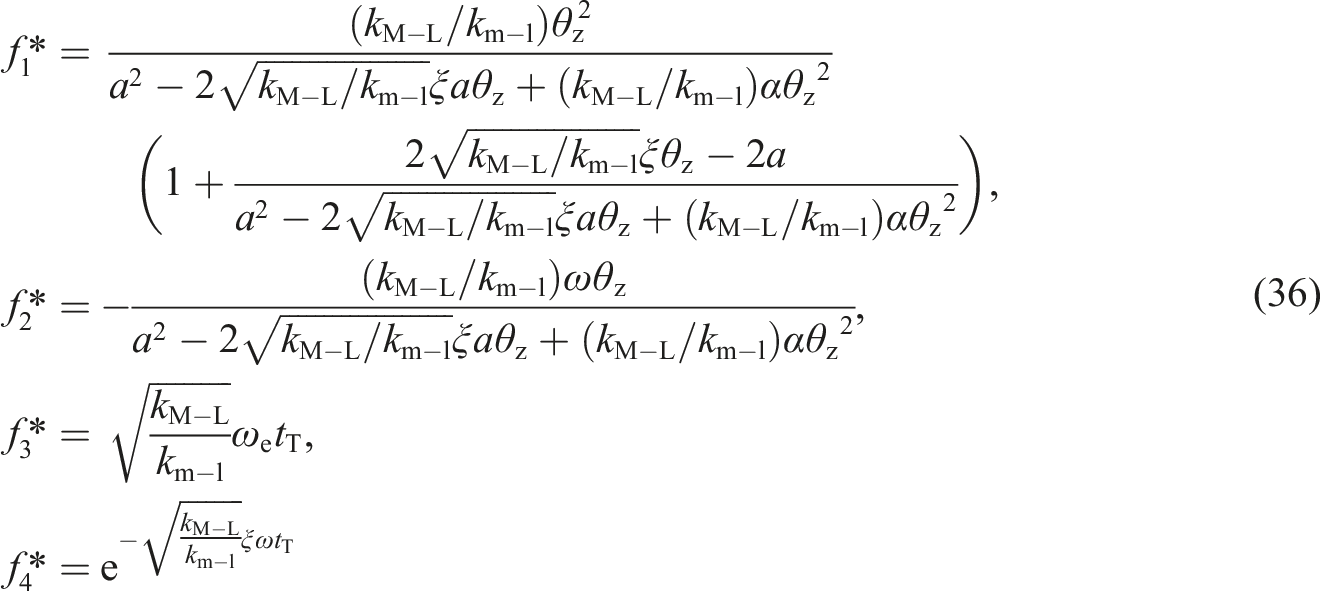
Using equation (36), the constants C9 and C10 are solved as: (2) When ξ2≥α: By solving equation (33), the expressions for displacement and velocity are:


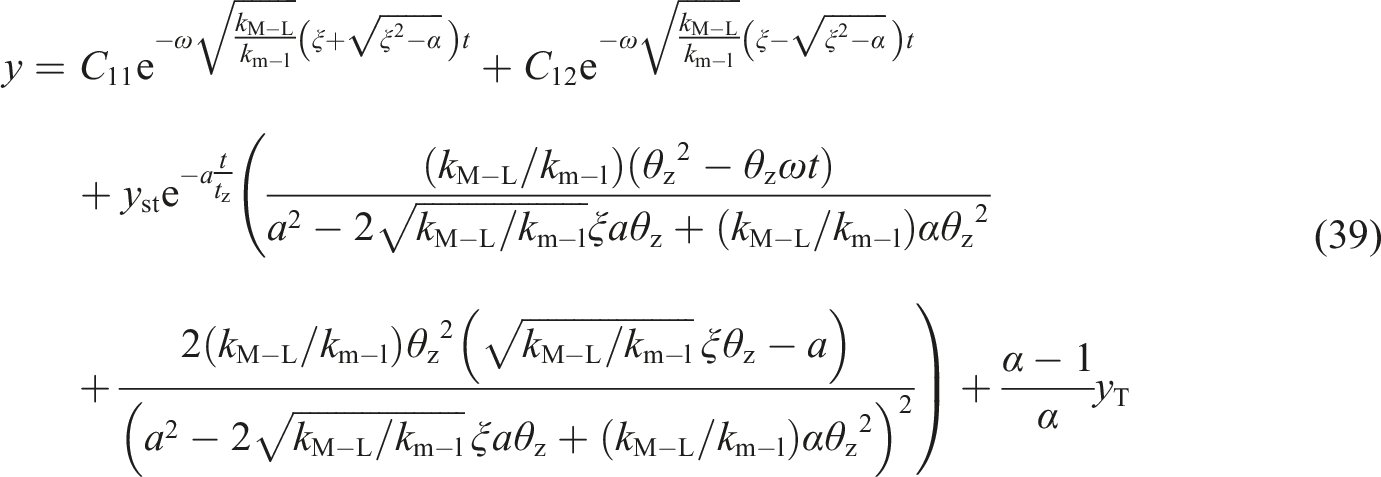
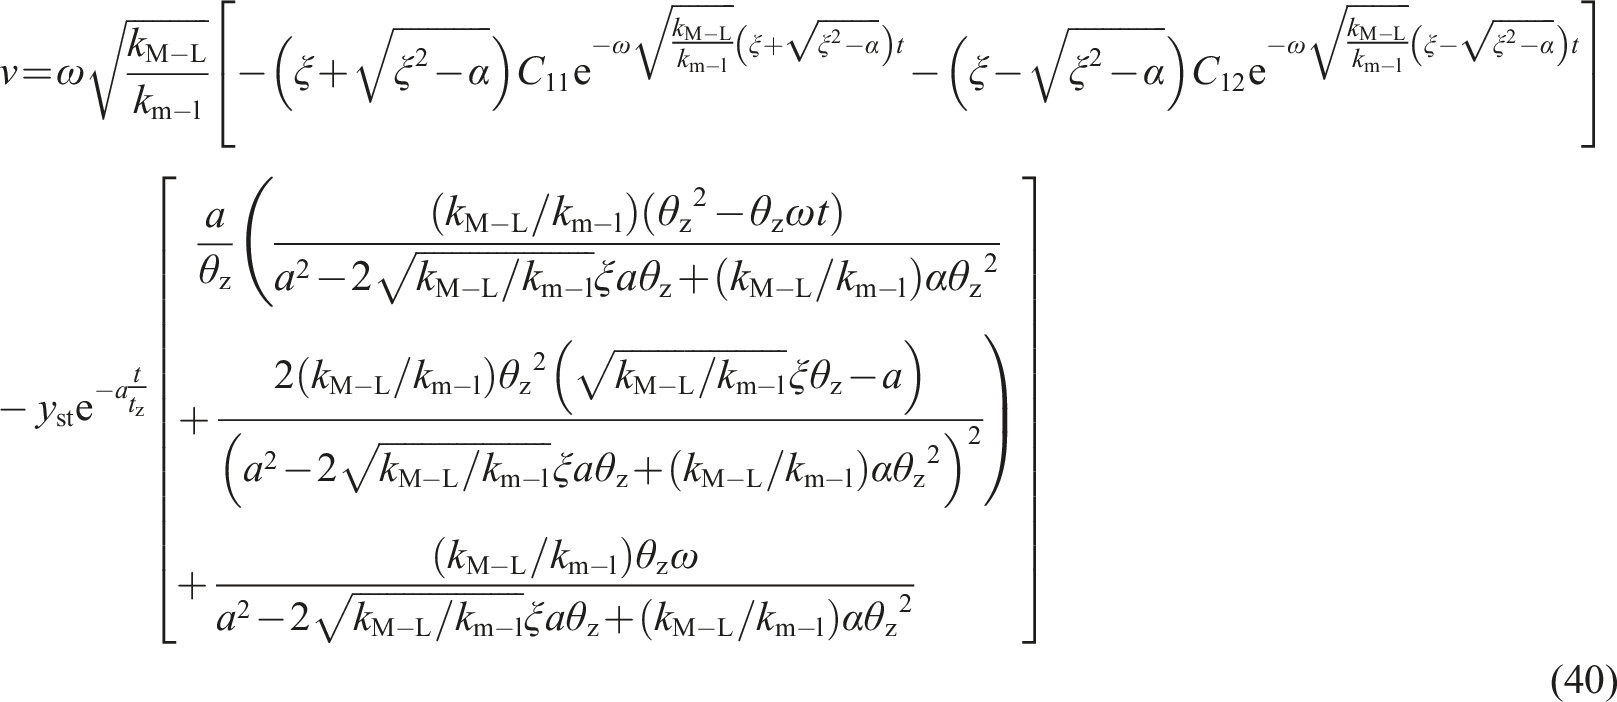
Similarly, to simplify the expressions, let:
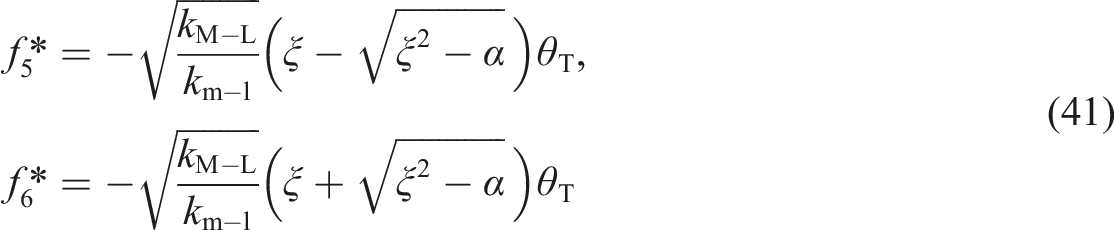
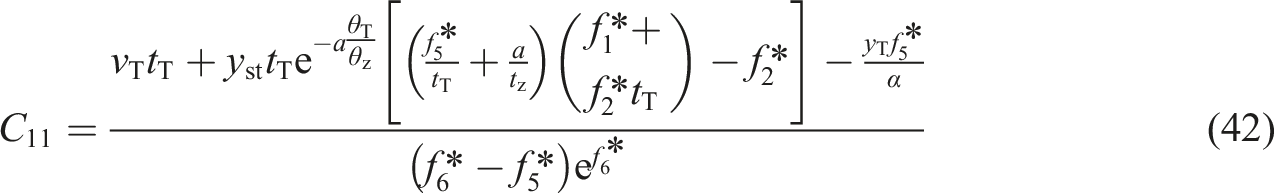
Substituting the initial conditions of displacement yT and velocity vT into equations (39) and (40), and using equation (41), the constants C11 and C12 are solved as:

Substituting t = tz into equations (39) and (40), the expressions for displacement yz and velocity vz at the end of the blast loading effect are obtained.
Plastic free motion stage
After the blast loading is removed, the beam component enters the plastic free motion stage with initial conditions of displacement yz and velocity vz. The duration of this stage is defined by the relation tz<t<tm. The equivalent SDOF equation for this stage is the same as equation (20), and the solution must also be divided into two cases: (1) When ξ2<α: By solving equation (20), the expressions for displacement and velocity are:

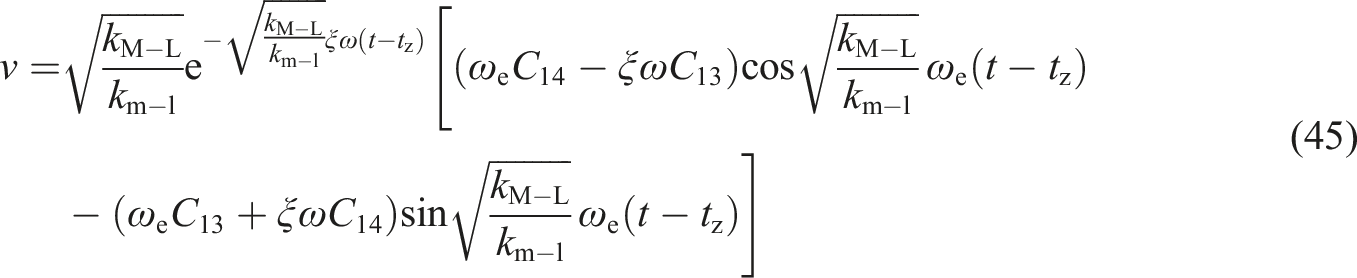

Setting equation (45) to zero, the expression for the time tm when the beam component reaches the plastic displacement peak ym is:

Substituting equations (46) and (47) into equation (44), the expression for the displacement at the plastic displacement peak ym is obtained. (2) When ξ2≥α: By solving equation (20), the expressions for displacement and velocity are:

In this case, the initial conditions are the displacement yz and velocity vz obtained from the plastic forced motion stage for ξ2≥α. Substituting these initial conditions into equations (48) and (49), the constants C15 and C16 are solved as:

Setting equation (49) to zero, the expression for the time tm when the beam component reaches the plastic displacement peak ym is:
Substituting equations (50) and (51) into equation (48), the expression for the displacement at the plastic displacement peak ym is obtained.
By substituting the displacement yT and ym obtained from the above two cases into equation (30), the expressions for the dynamic coefficient and ductility ratio of the rigid beam component are obtained.
Verification of the theoretical accuracy
Experimental verification
Parameter information for steel beams.
Note: h is the height of the steel beam cross-section; b is the width of the cross-section; tw is the width of the web; t is the thickness of the flange.
Material modeling parameters for two types of steel beams.
Schematic of the numerical simulation setup.

Experimental and simulation analysis of I-beam structures under Friedlander-type blast loading.
As shown in Figure 4, the results of the finite element simulation are in excellent agreement with the experimental results, with the errors in the peak elastic-plastic displacement of the two components being 1.07% (Component 2B3) and 2.27% (Component 5B1), respectively. This indicates that the finite element model can accurately reflect the dynamic response of the beam components under blast loading, providing a solid foundation for further in-depth analysis based on finite element methods.
By comparing the theoretical analysis results with the experimental data, the accuracy of the theoretical model can be further evaluated: For Component 2B3, the peak displacement predicted by the theoretical analysis is 38.83 mm, with an error of 4.83% compared to the experimental result of 40.80 mm; for Component 5B1, the theoretical peak displacement is 60.64 mm, showing a 3.44% error relative to the experimental value of 62.80 mm. The overall trend of the theoretical analysis is in good agreement with the experimental results, and the errors are within a reasonable range.
This study validates the accuracy of numerical simulations through experimental results and further comparison analysis indicates that the theoretical model is highly reliable in terms of both precision and practicality, despite some simplifications. Specifically, in the theoretical analysis, the material nonlinearity of the beam components and the complex dynamic characteristics of the blast loading were moderately simplified, which led to corresponding deviations. However, this deviation has a limited impact on the validity of the theoretical model, demonstrating that it possesses strong engineering applicability. Through comparison with the experimental results, this paper finds that the theoretical analysis is not only in good agreement with the experimental data, but the numerical simulation results also match the experimental data, verifying the credibility and high accuracy of dynamic response analysis based on numerical simulations under blast loading. Overall, the theoretical analysis provides a simplified yet effective prediction method, offering valuable insights for preliminary analyses in engineering practice.
Theoretical method verification
Based on the finite element model described earlier, both flexible and rigid I-beams were designed, and simulation analyses were conducted for three different loading conditions to verify the feasibility of the proposed theoretical method. The cross-sectional dimensions of the two types of beams are shown in Figure 5. The tangent modulus Et for the three loading conditions were 0.21 GPa, 2.1 GPa, and 21 GPa, respectively, with a constant damping ratio of 0.1. The remaining material model parameters for the steel beams are provided in Table 3. Cross-section dimensions of steel beams. (unit: mm). Parameter information for steel beams.
Design for calculation cases.

The resistance enhancement coefficient α in the range of 0.001 to 0.1, with values of 0.001, 0.01, and 0.1, represents the transition from ideal elasto-plastic behavior to low-level strengthening. Specifically, α = 0.001 corresponds to nearly ideal elasto-plastic behavior with minimal strengthening effects, suitable for cases with no significant material enhancement; α = 0.01 represents a weak resistance enhancement, applicable to materials with minor strengthening effects; and α = 0.1 indicates moderate strengthening, reflecting the material’s response under higher stress conditions. These values provide a clear description of material resistance enhancement under blast loading, as discussed in reference Geng et al. (2024).
Displacement time history curves for both types of beams under the three conditions, measured at the midpoint of the upper flange at the center span, are presented in Figure 6. Midspan displacement-time curves for two types of beam components.
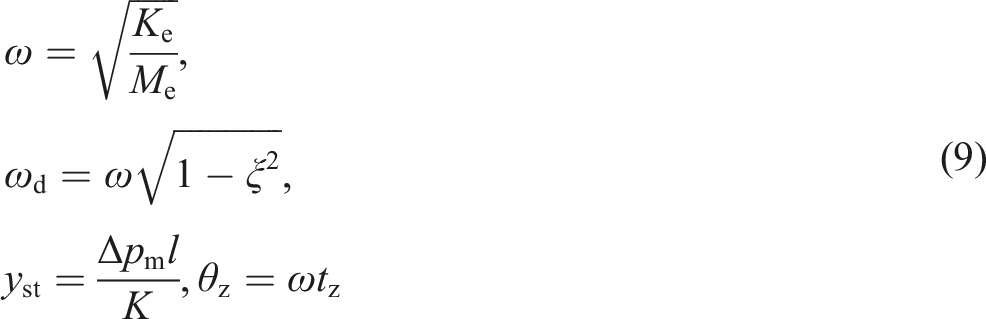
Since the theoretical model in this study treats the displacement (y) and duration parameter (θ) as dimensionless by using the static displacement (yst) and motion frequency (ω) of the blast loading when simplified as a static loading, the units of both the theoretical and simulation results need to be normalized. The calculation of yst and ω is explained below. By substituting the overpressure peak value (Δpm), beam length (l), and stiffness (K) from Table 3 for the flexible and rigid beam components into equation (9), the static displacement (yst) for the two beam types is calculated to be 165.22 mm and 134.98 mm, respectively. Based on the formula for the first natural frequency of motion for I-beams from the literature (China Architecture and Building Press, 2006), and substituting the relevant parameters, the motion frequencies (
Comparison of results between theory and finite element simulation.
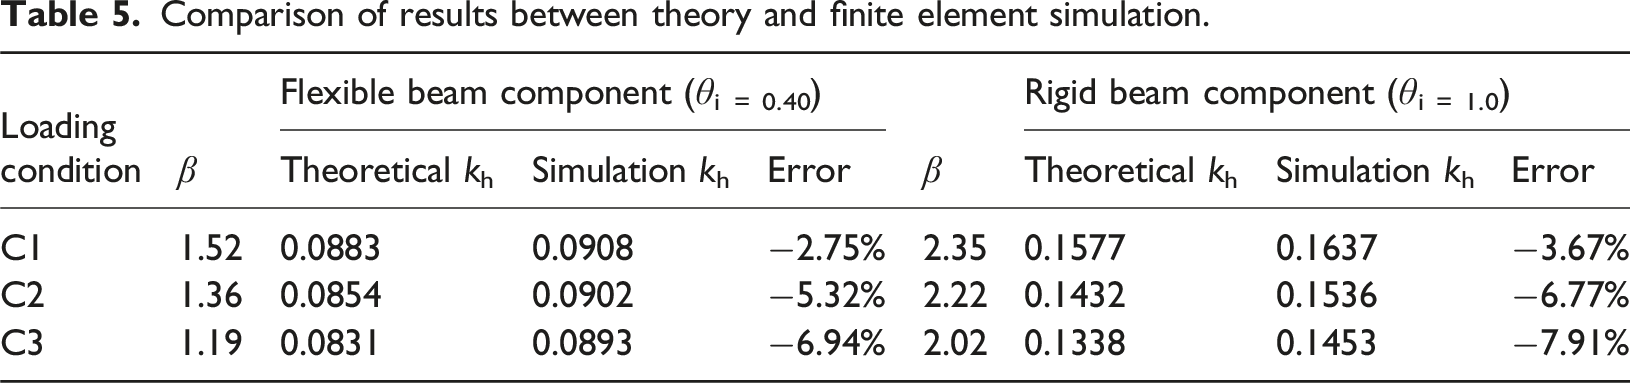
As shown in Table 5, the maximum difference between the dynamic coefficient (kh) calculated using the proposed theoretical method and the finite element simulation results is only 7.91%. This indicates that the theoretical analysis, which simplifies the blast loading to the Friedlander-type loading based on the plastic resistance enhancement model, provides a reliable foundation for simulating and analyzing the dynamic response of beam components under blast loading.
Verification against standards
To further verify the accuracy of the theoretical solutions presented in this study, the calculation method for the equivalent single-degree-of-freedom dynamic coefficient recommended by the current explosion-resistant design code in China is used as a comparative benchmark. The calculation formula provided in the code is (China Architecture and Building Press, 2006): Comparison results for calculation cases and code of a = 1.0. Comparison results for calculation cases and code of a = 1.3. Comparison results for calculation cases and code of a = 1.5. Comparison results for calculation cases and code of a = 1.8. Comparison results for calculation cases and code of a = 2.0.

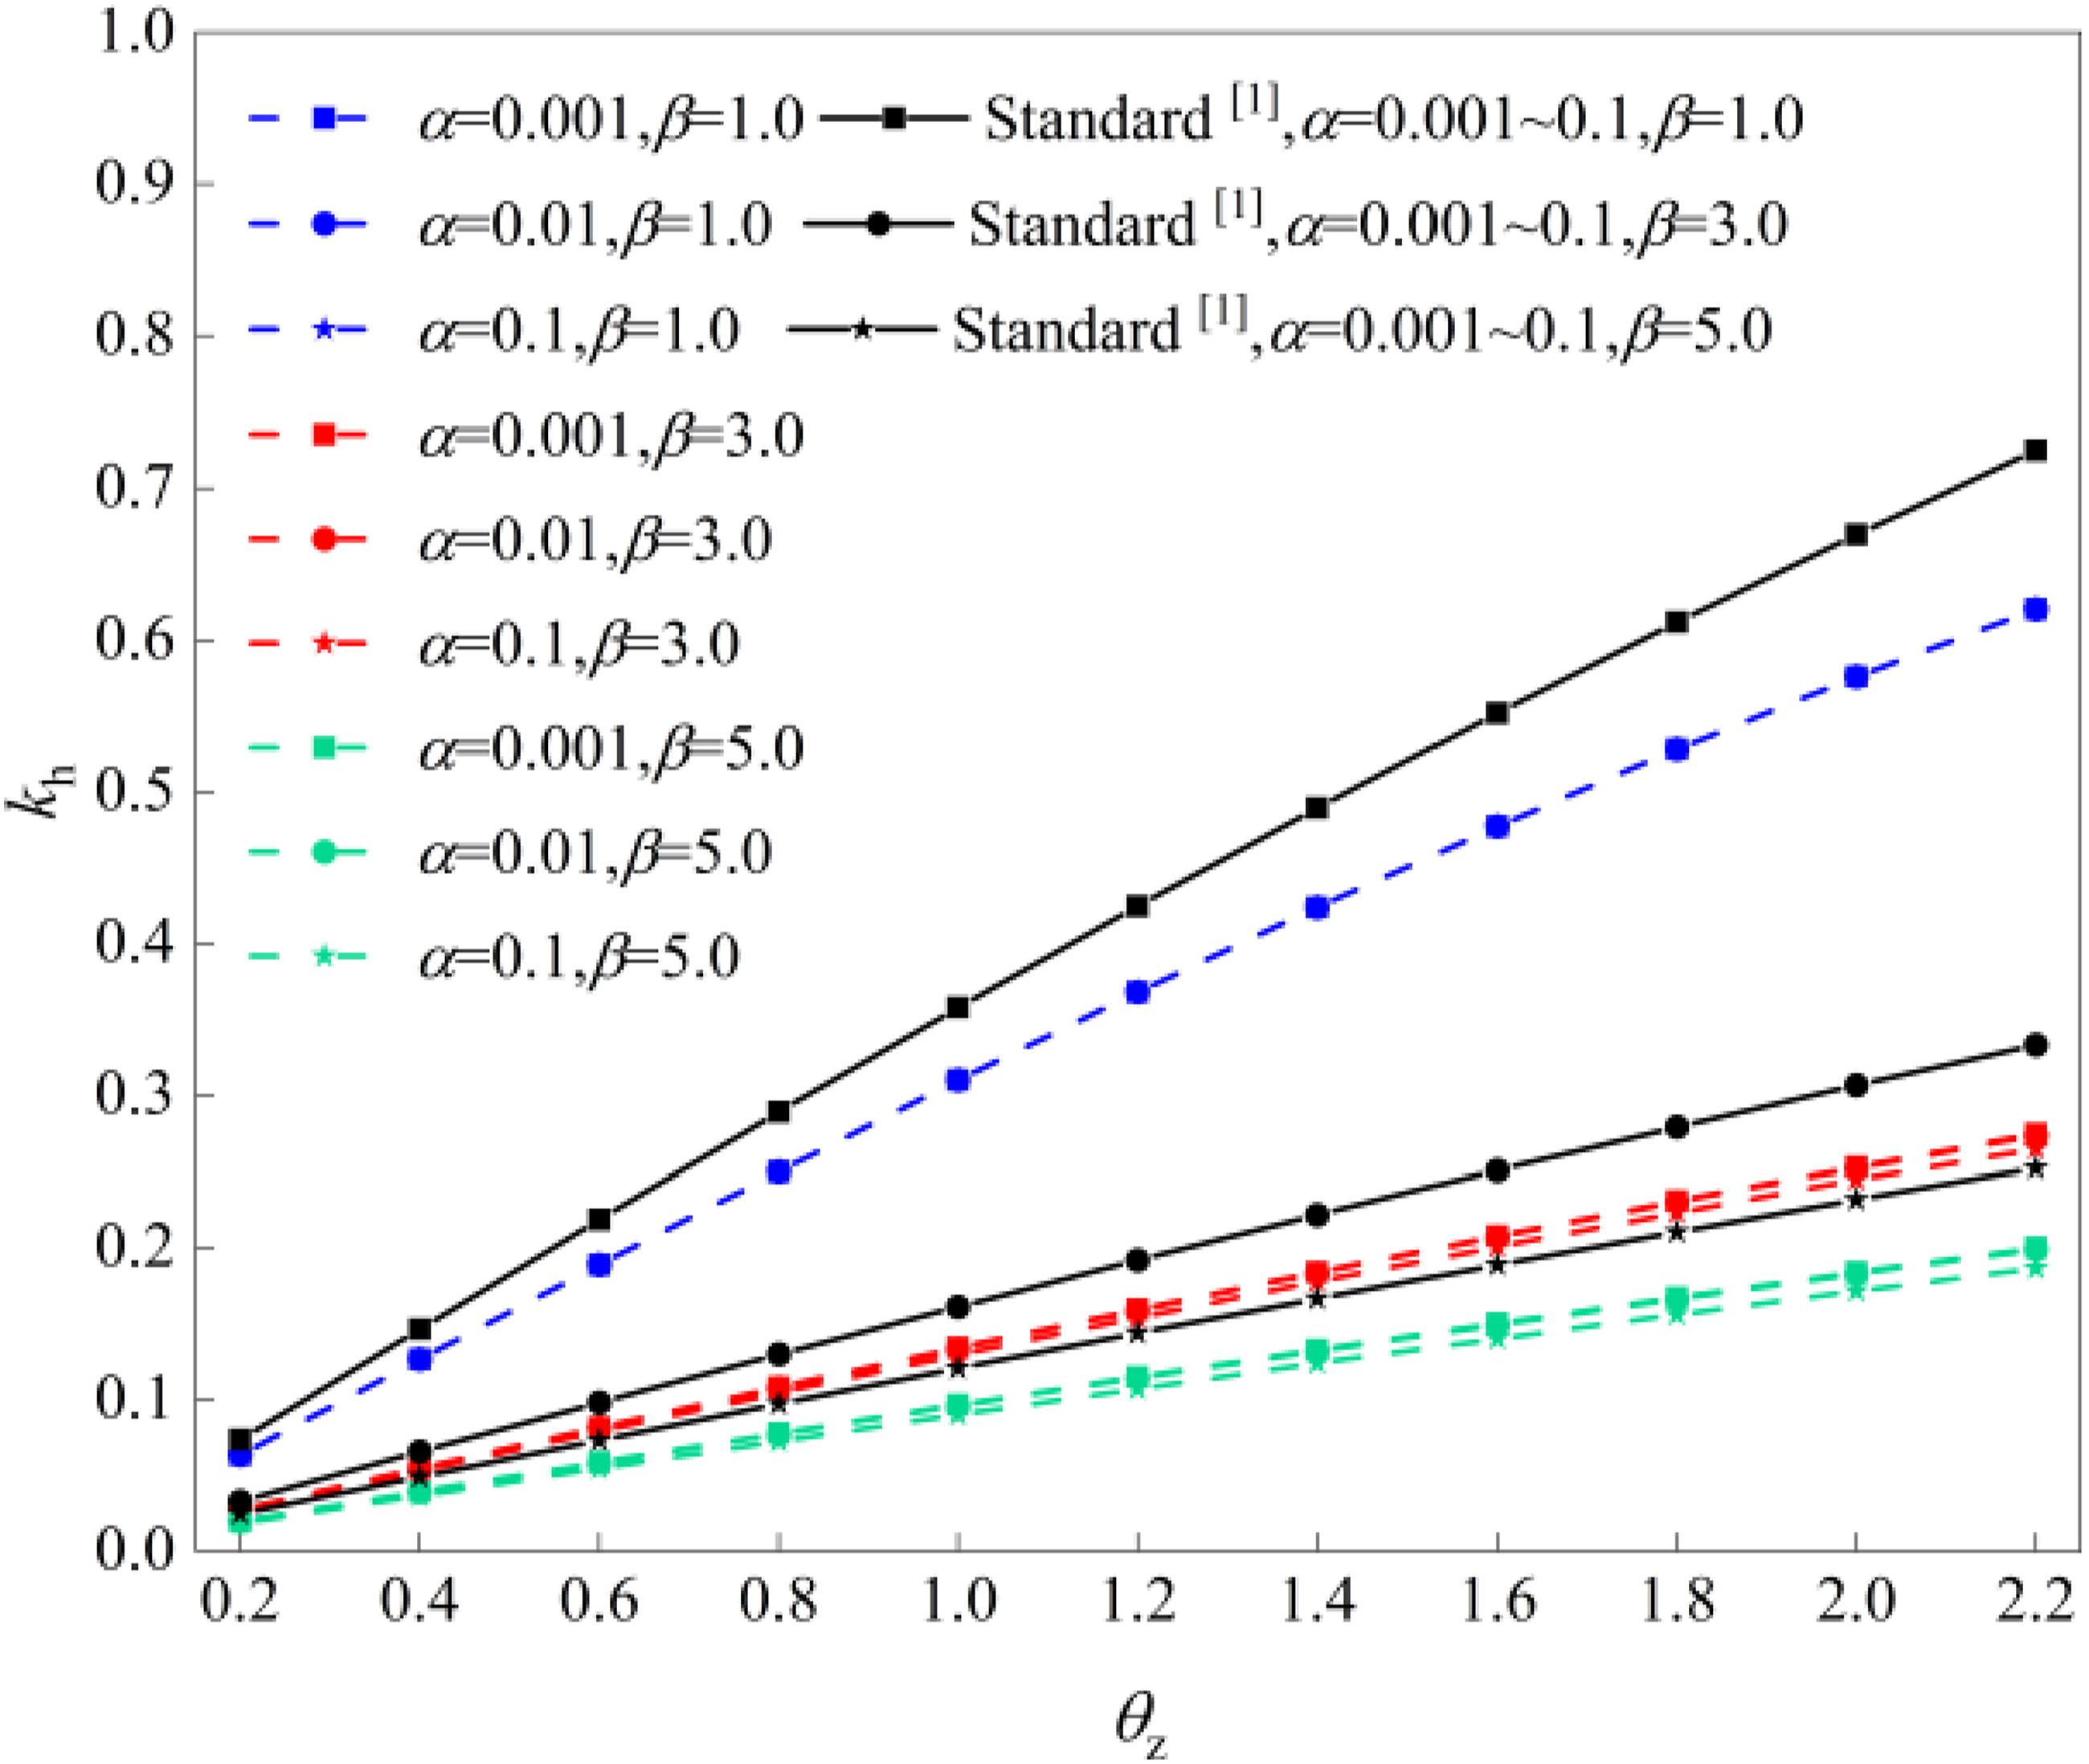
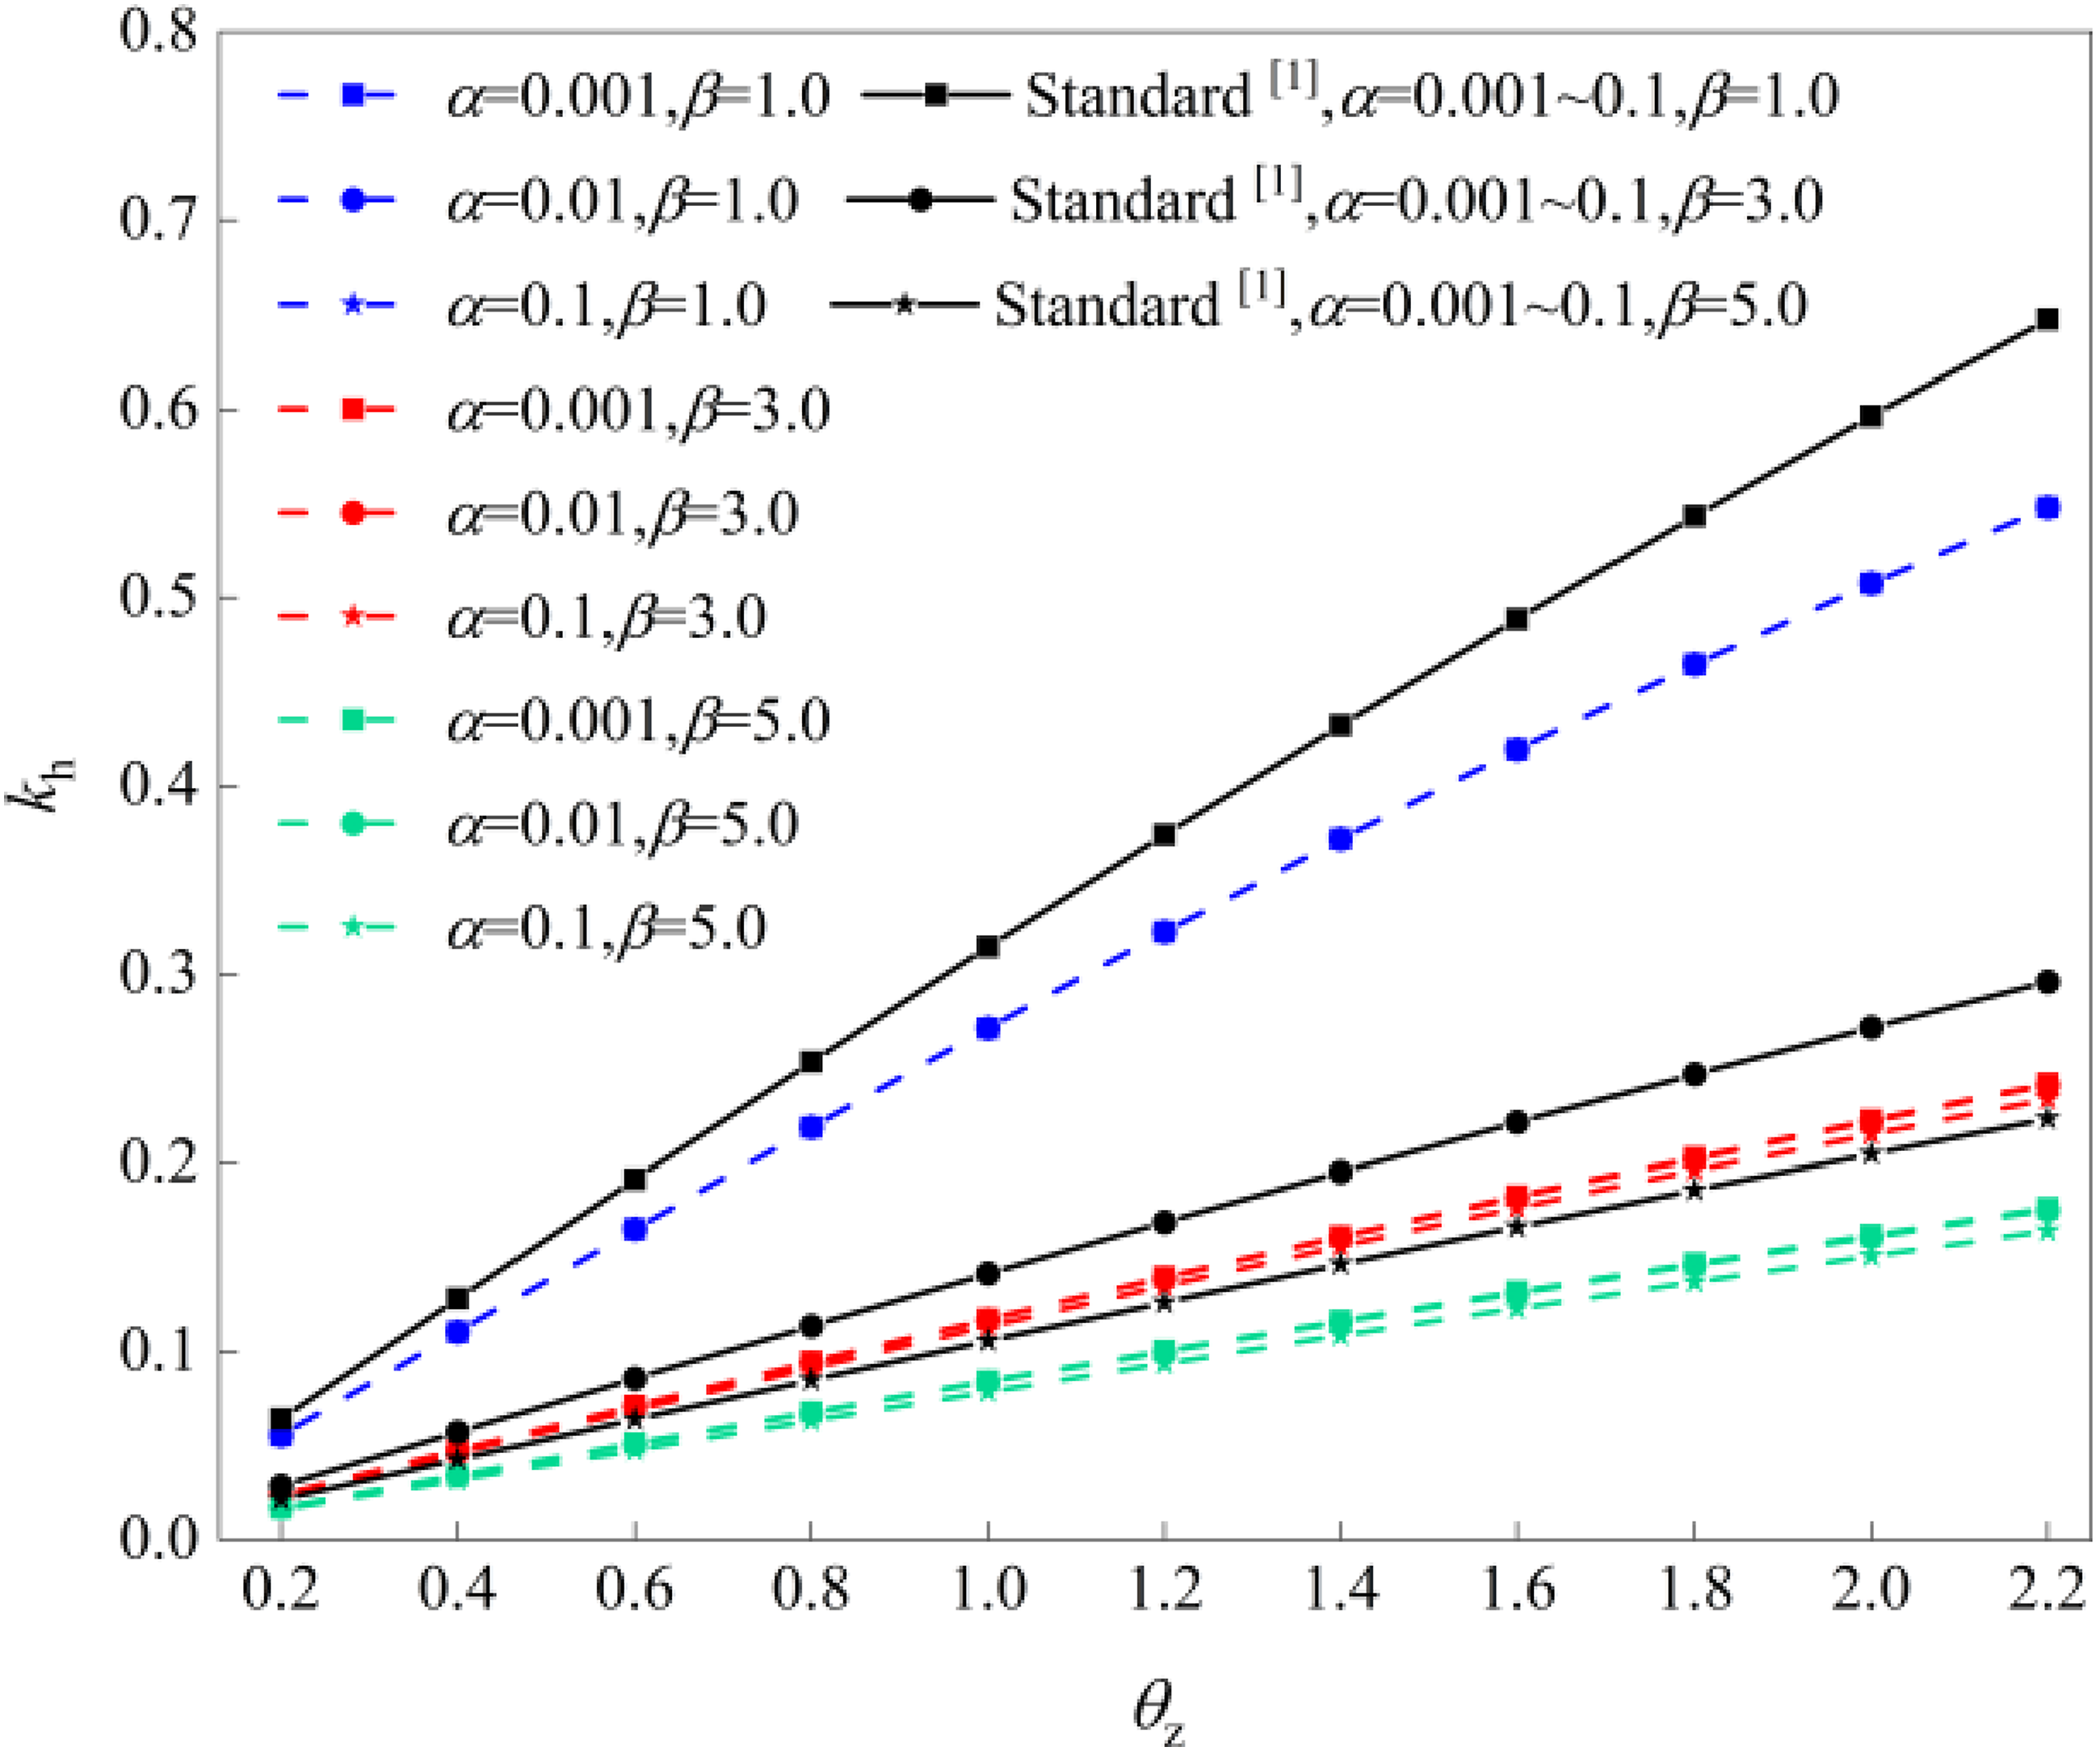
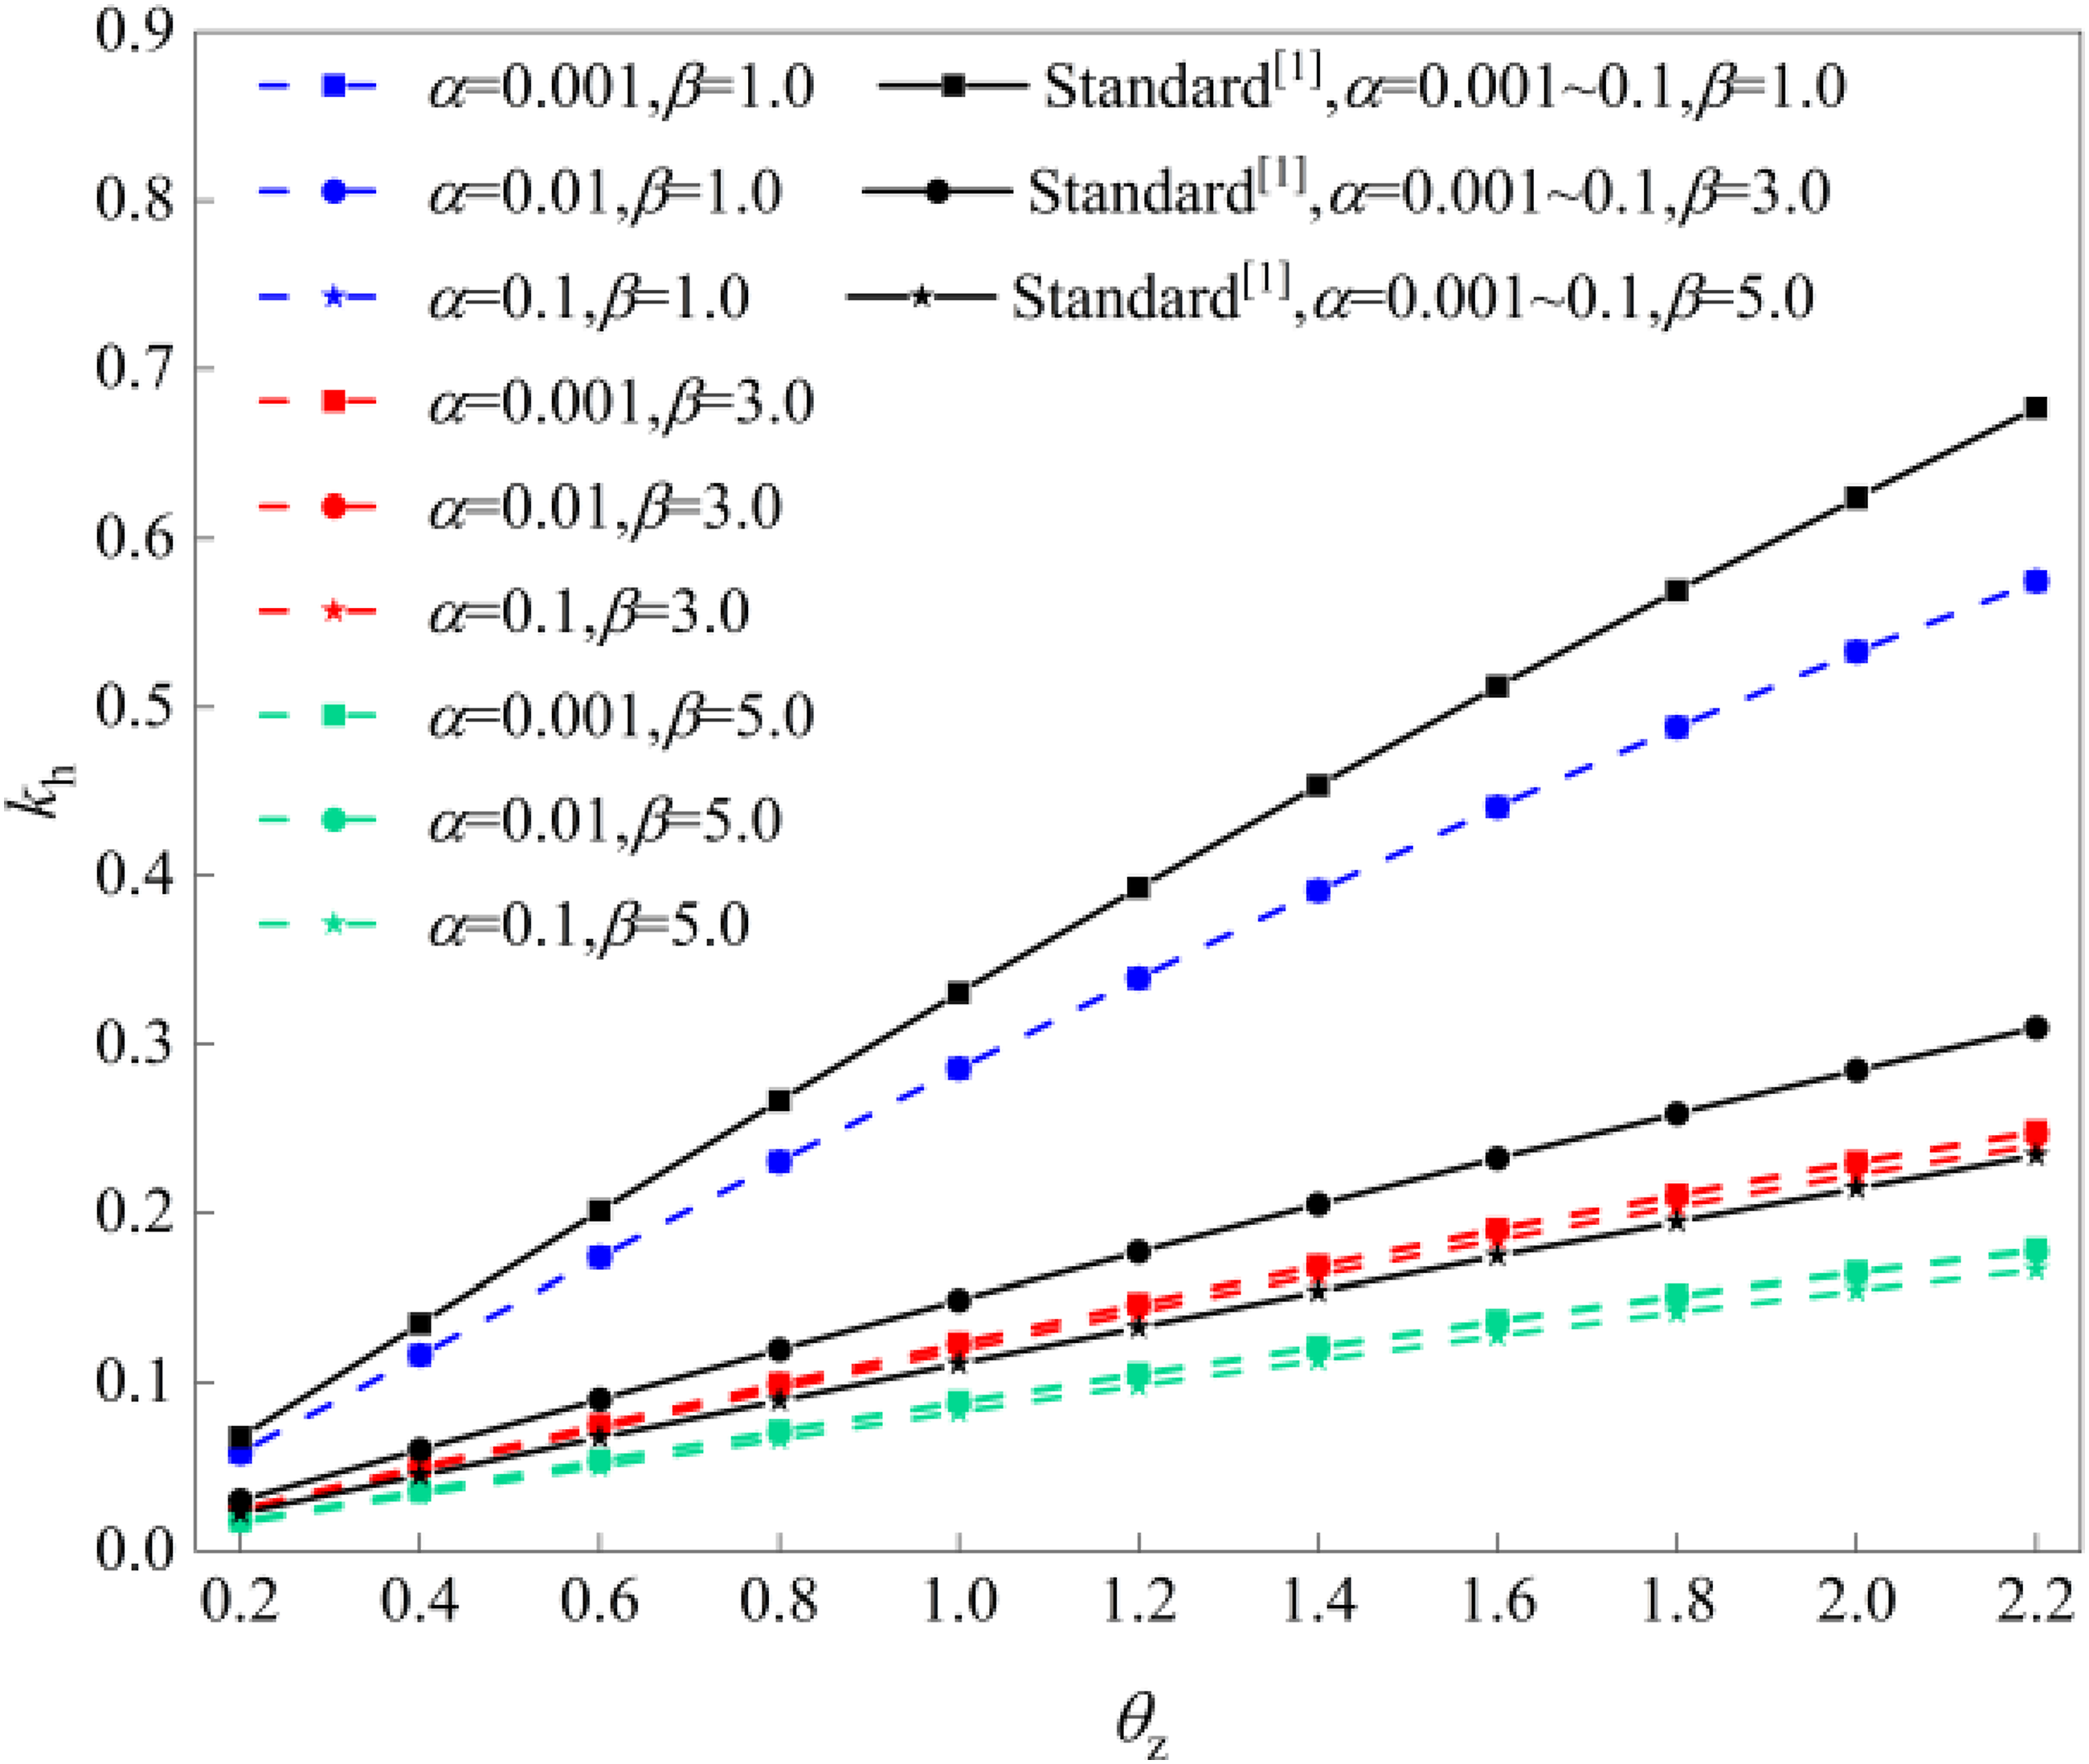
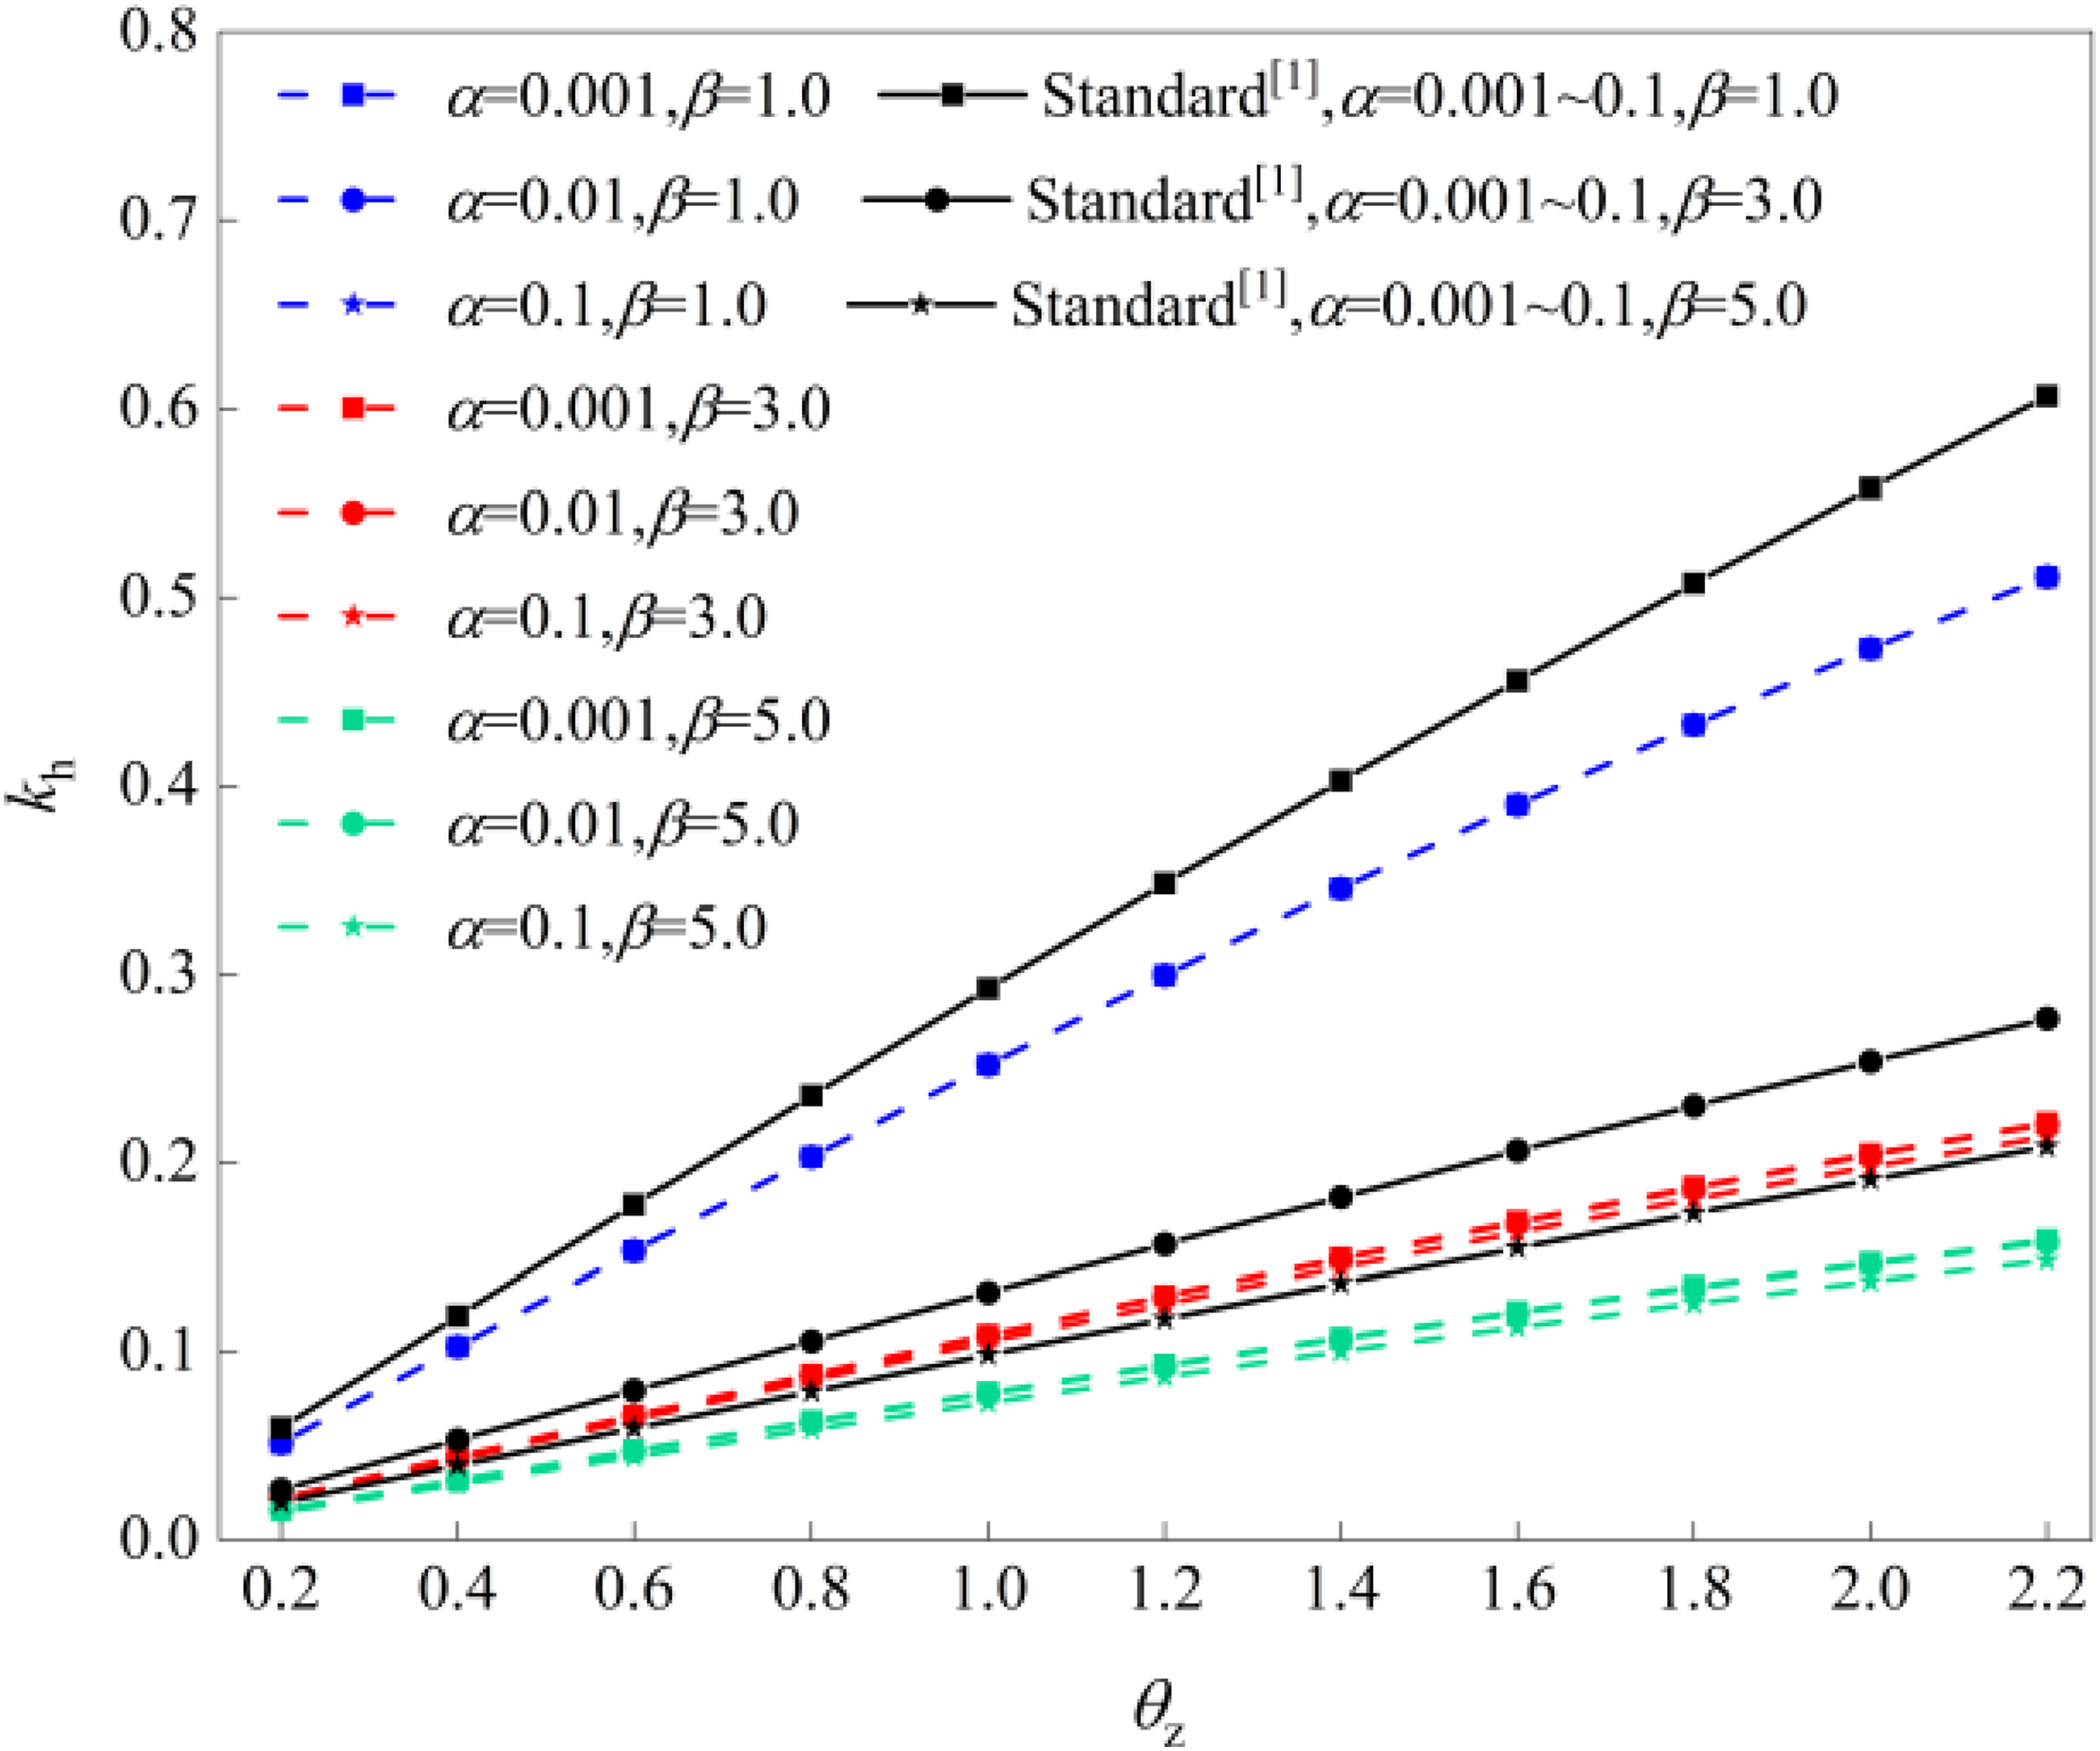

As shown in Figures 7–11, the theoretical calculations of kh in this study are consistently lower than the values obtained from the explosion-resistant design code, with deviations ranging from approximately 13.36% to 26.75%. A smaller kh indicates a more economical explosion-resistant design. For all working conditions, kh increases as θz increases, and for the elasto-plastic design with β = 1, kh is always higher than for designs with β > 1. In this scenario, the elasto-plastic explosion-resistant design can be treated as an elastic design, with no plastic deformation of the beam component. Under the same values of a and β, as α increases, kh decreases; under the same values of α and β, as a increases, kh decreases; and under the same values of α and a, as β increases, kh decreases. These results indicate that increasing α, a, or β leads to a reduction in kh. Moreover, the larger the values of α, a, and β, the greater the relative error between the theoretical results and the code values. The design code formula provides higher accuracy in the explosion-resistant design of rigid beam components compared to flexible beam components.
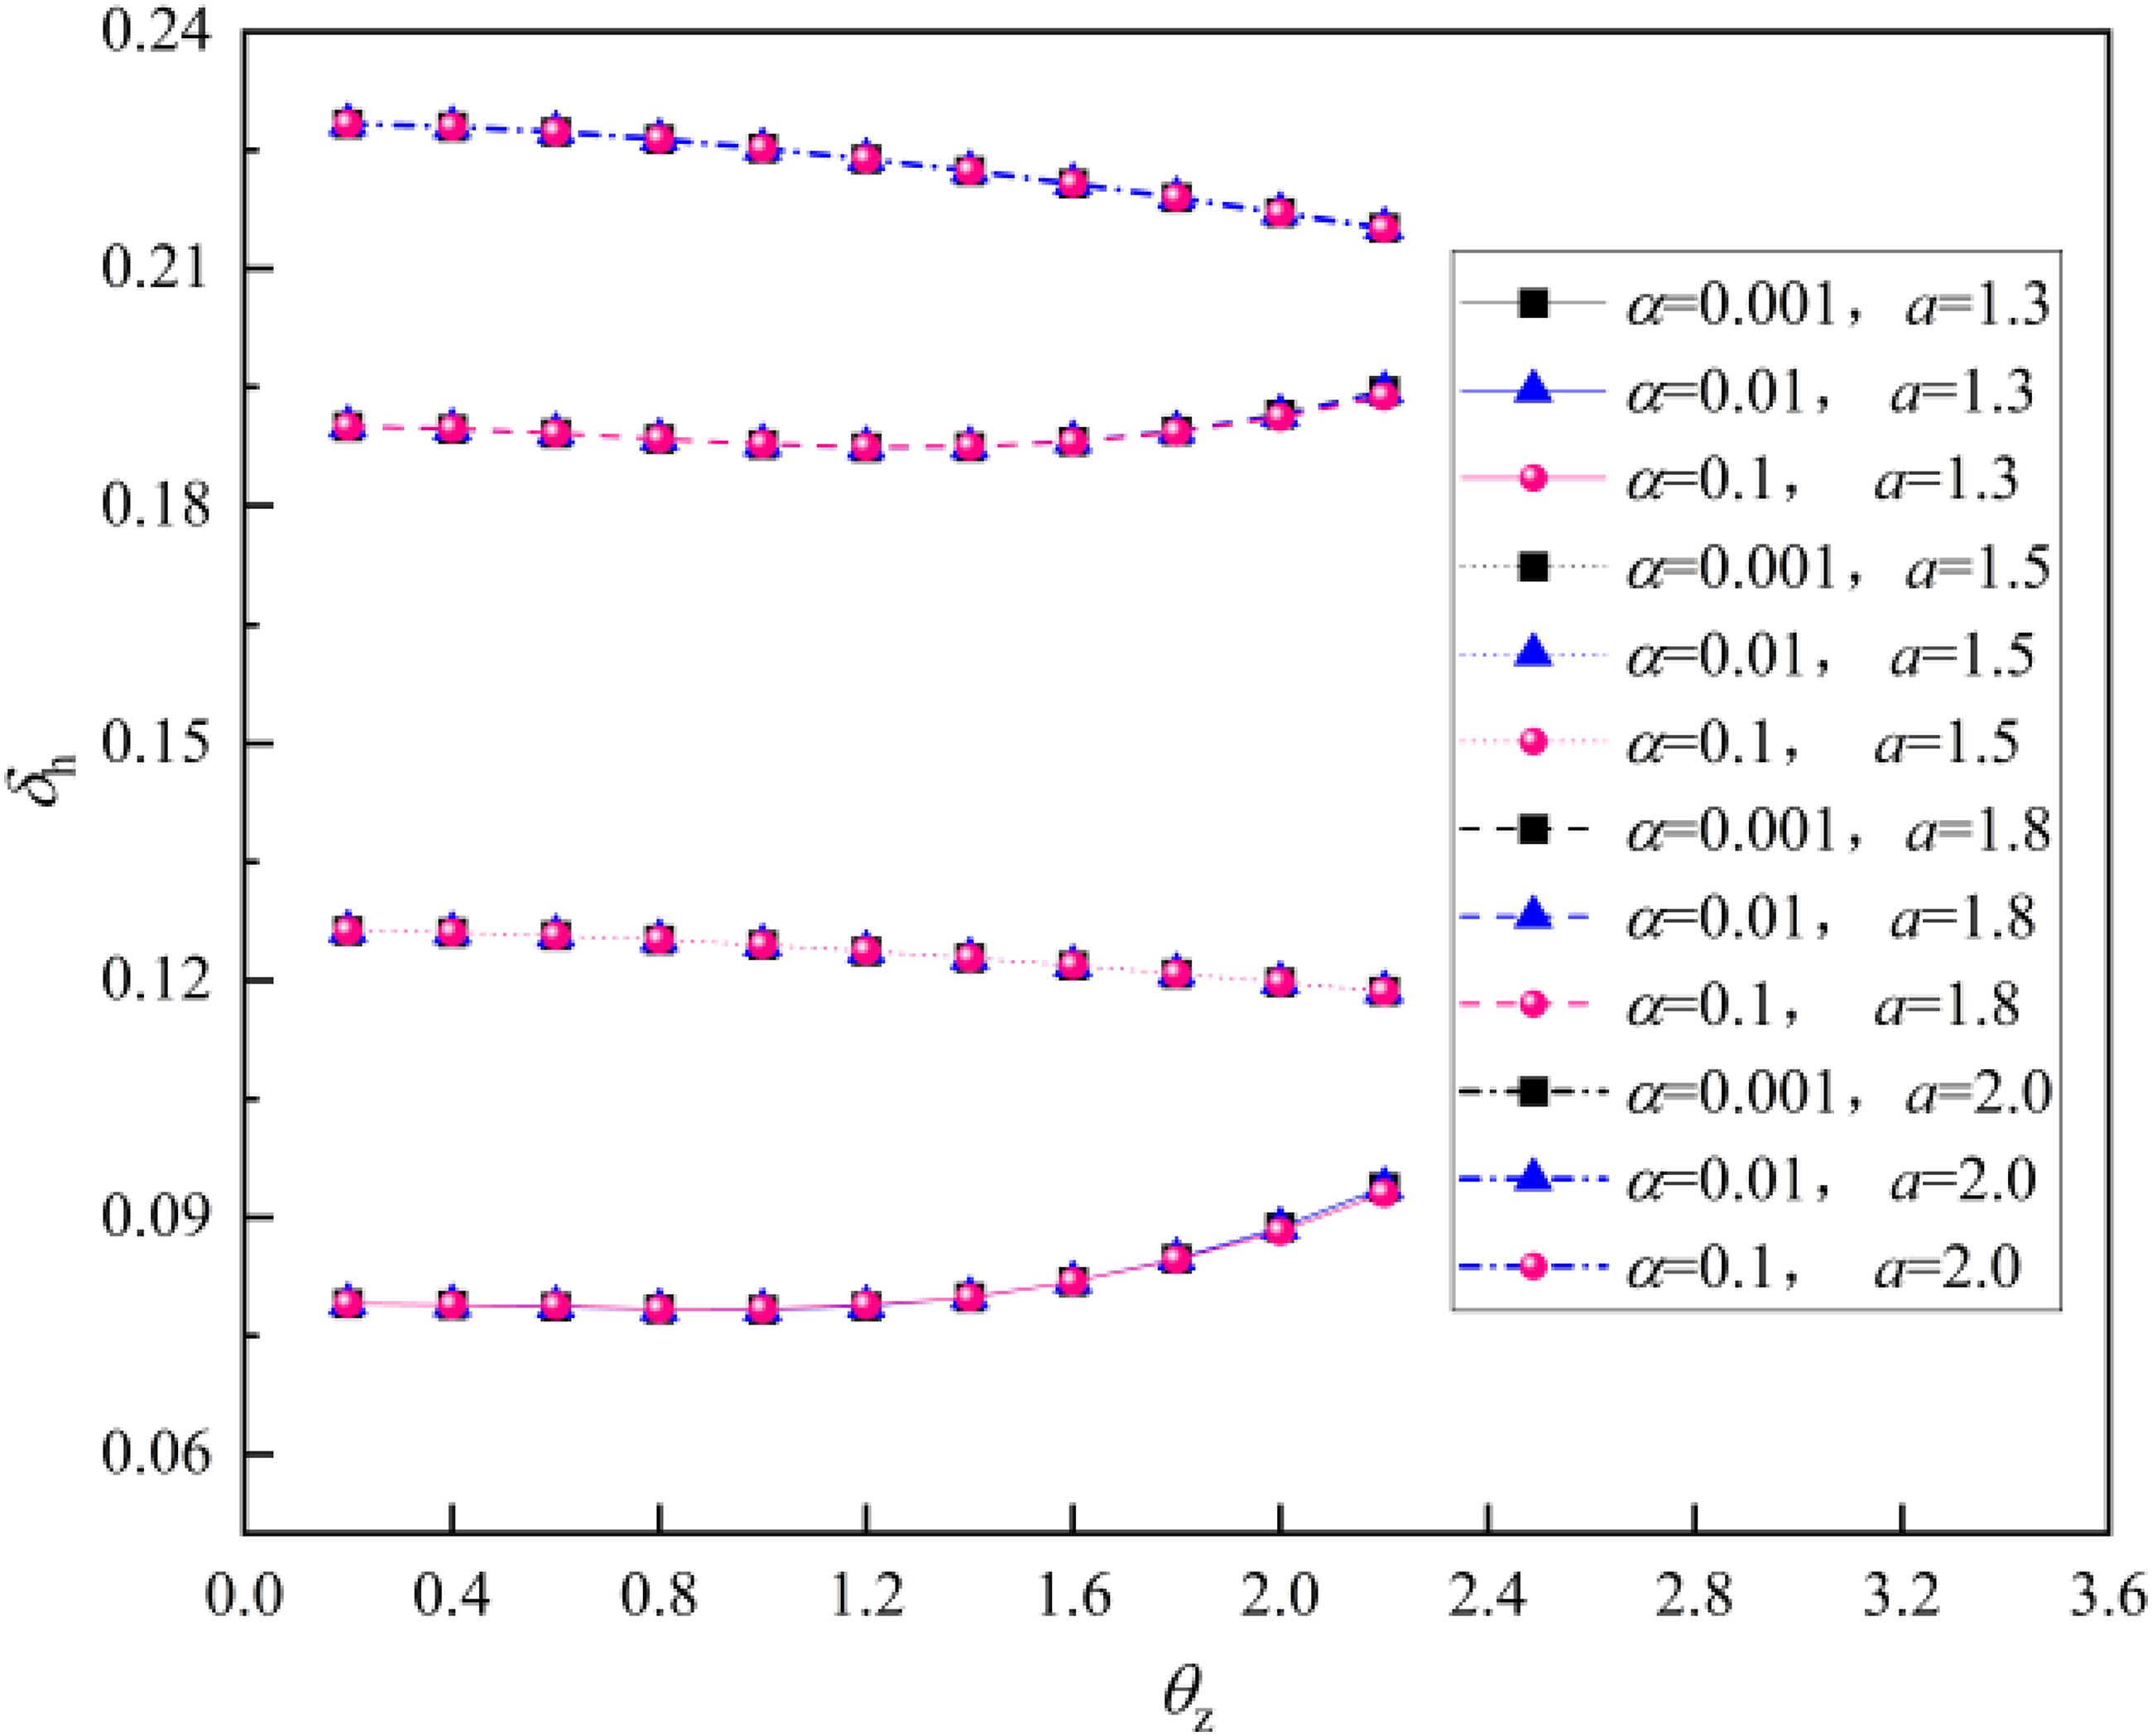
To further investigate the individual effects of α and a on kh, a baseline condition with a = 1.0 is taken, and the reduction in kh for a = 1.3, 1.5, 1.8 and 2.0 relative to this baseline is calculated to study the effect of a, respectively, as shown in Figure 10. Similarly, for α = 0.001 as the baseline, the reduction in kh for α > 0.001 relative to this baseline is calculated to study the effect of α. The reduction in kh is denoted as δh, as shown in Figure 11.
As shown in Figures 12–14, the greater the value of a, the larger the reduction in kh. For a = 1.3, the reduction in kh ranges from 7.31% to 7.91%, for a = 1.5, the reduction in kh ranges from 11.68% to 12.63%, for a = 1.8, the reduction in kh ranges from 17.62% to 20.60%, and for a = 2.0, it ranges from 21.18% to 22.83%. As β decreases, the effect of a on kh becomes more pronounced. For the same value of β, there is almost no difference in kh for different values of α, as the effect of α on kh has already been isolated before examining the effect of a alone. This suggests that α and a have a linear coupling effect. The reduction rate curves for dynamic factor of a at β = 1. The reduction rate curves for dynamic factor of α at β = 3. The reduction rate curves for dynamic factor of a at β = 5.

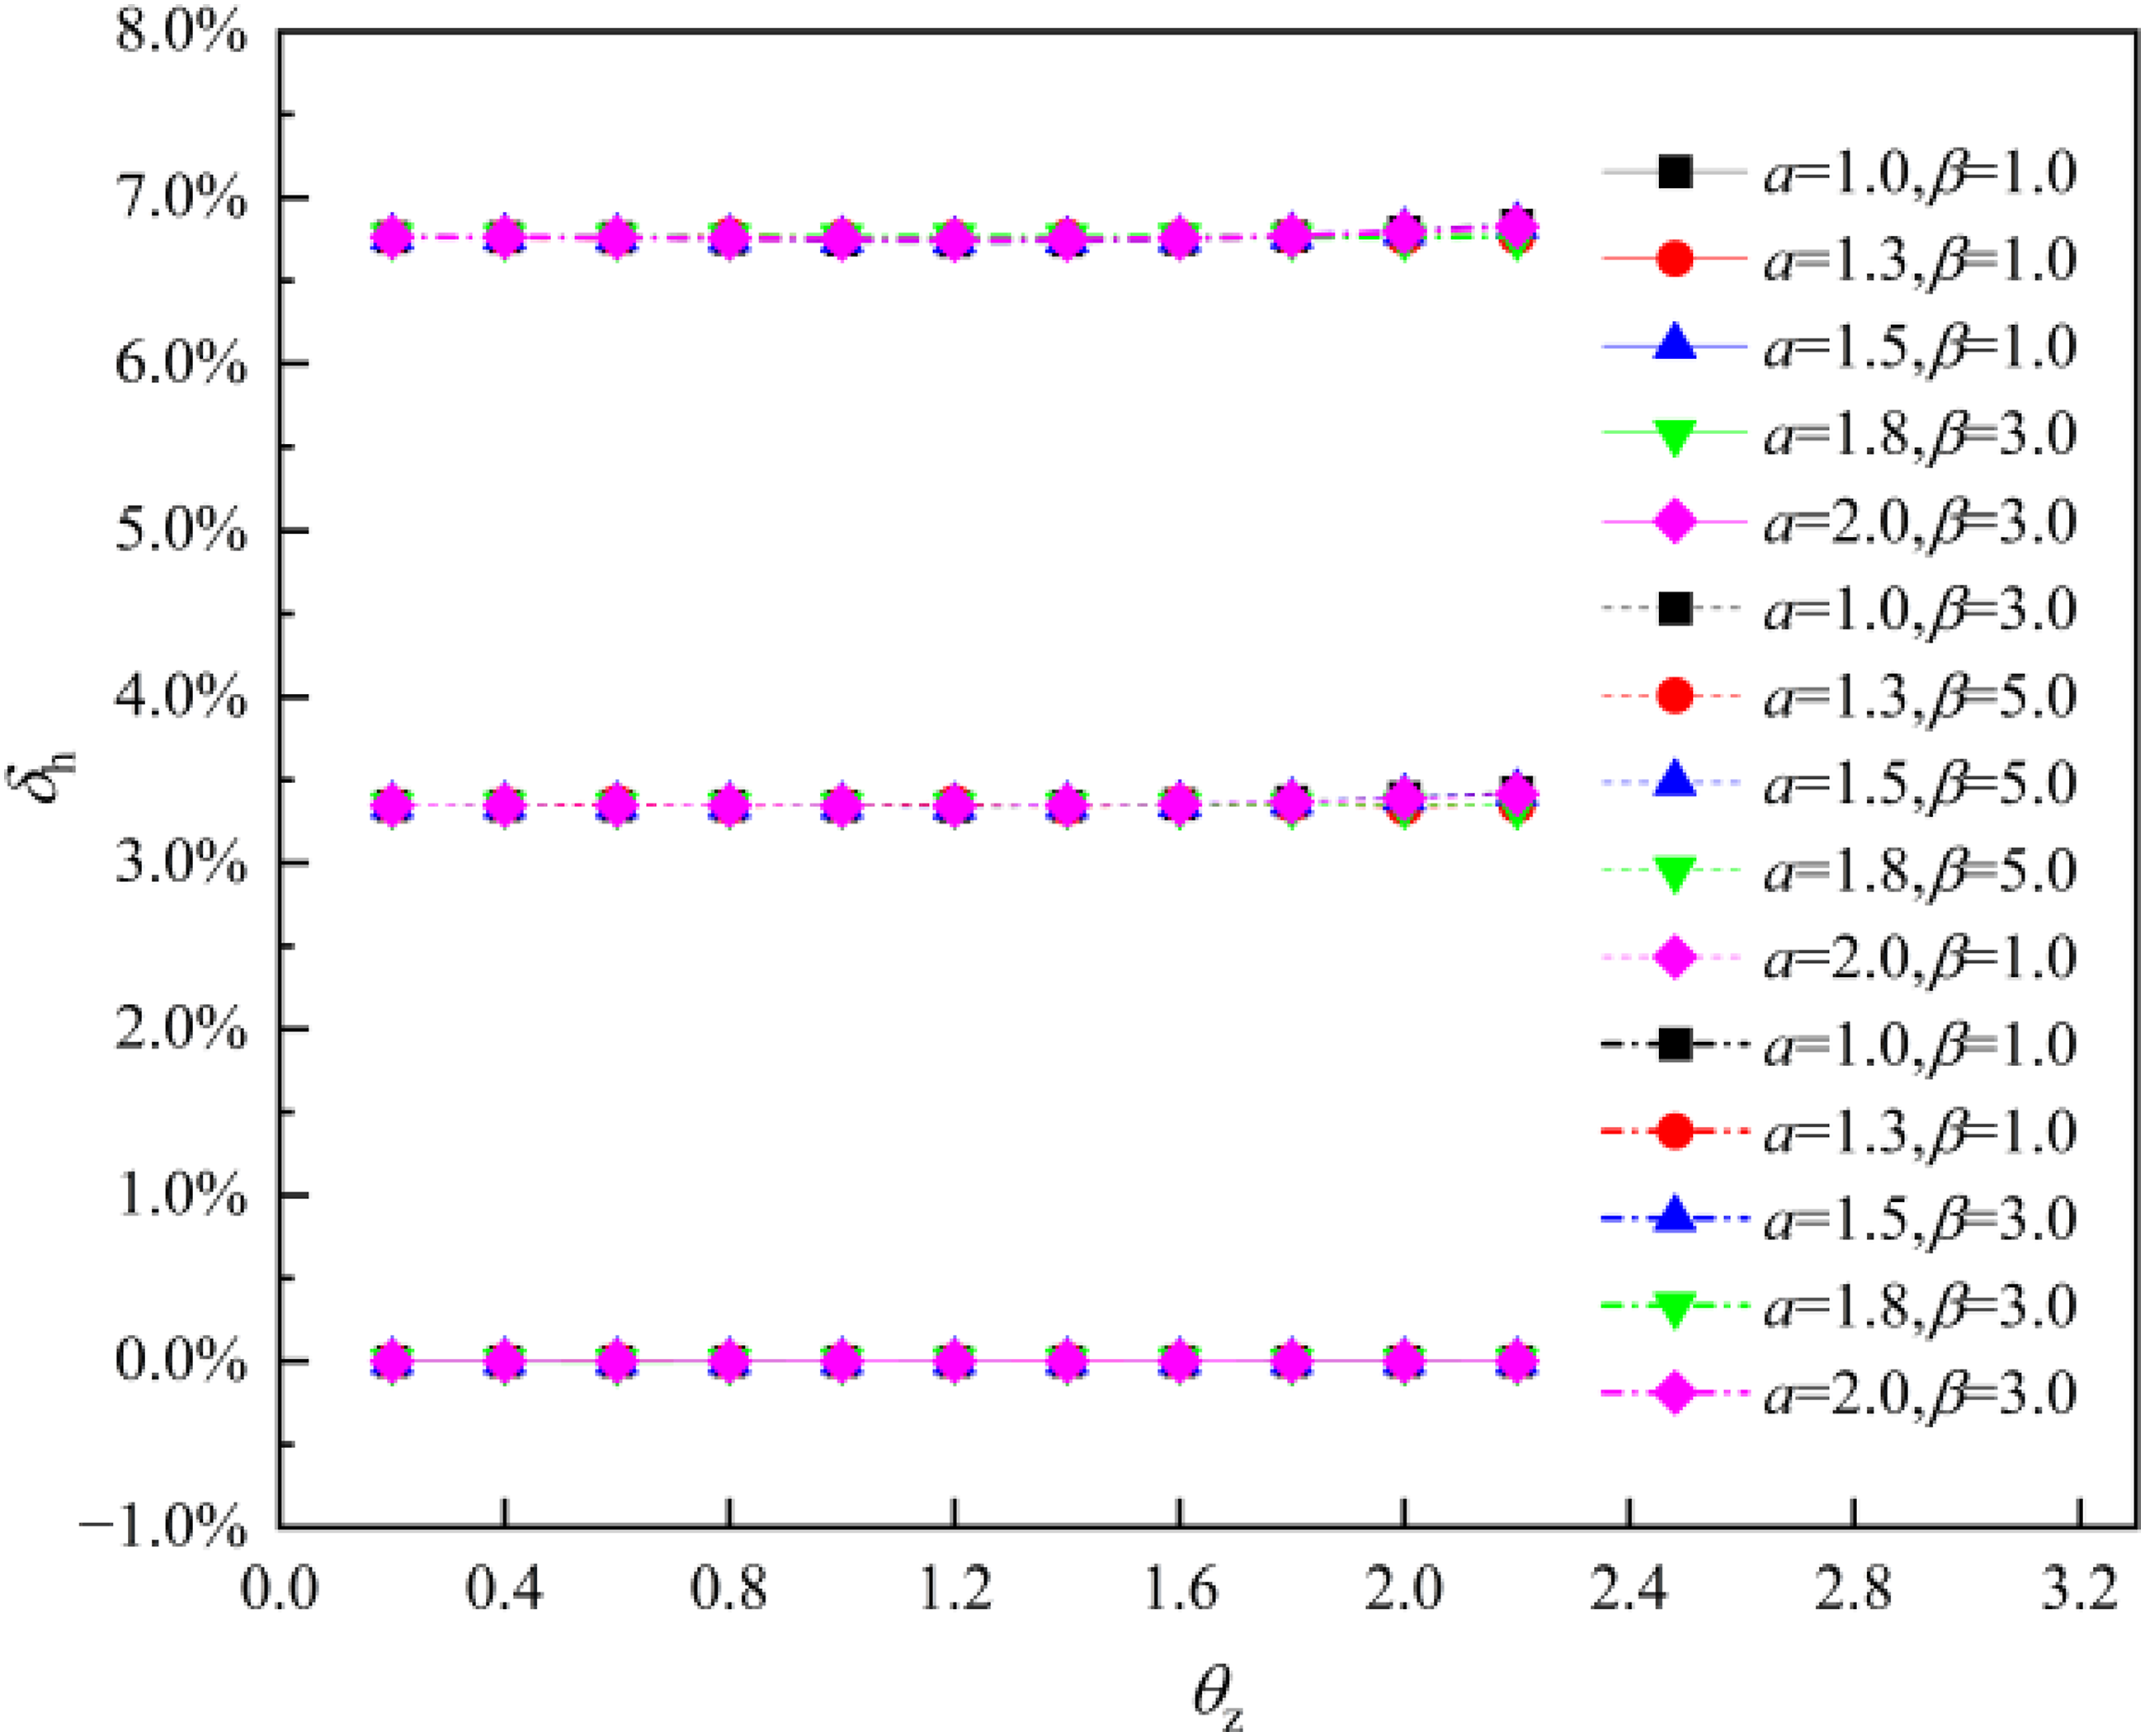
As shown in Figures 15–16, the larger the value of α, the greater the reduction in kh. For α = 0.01 and 0.1, the maximum reduction in kh is 0.69% and 6.83%, respectively. When β = 1, the effect of α on kh is negligible, with a range of 0% to 0.69%. This indicates that in these cases, the effect of α can be ignored. When β > 1 and α > 0.01, the reduction in kh ranges from 3.34% to 6.83%, suggesting that a larger value of α has a more significant impact on reducing kh. In comparison to the effect of a on kh, the effect of α is less significant when considered alone. The reduction rate curves for dynamic factor of a = 0.01. The reduction rate curves for dynamic factor of α = 0.1.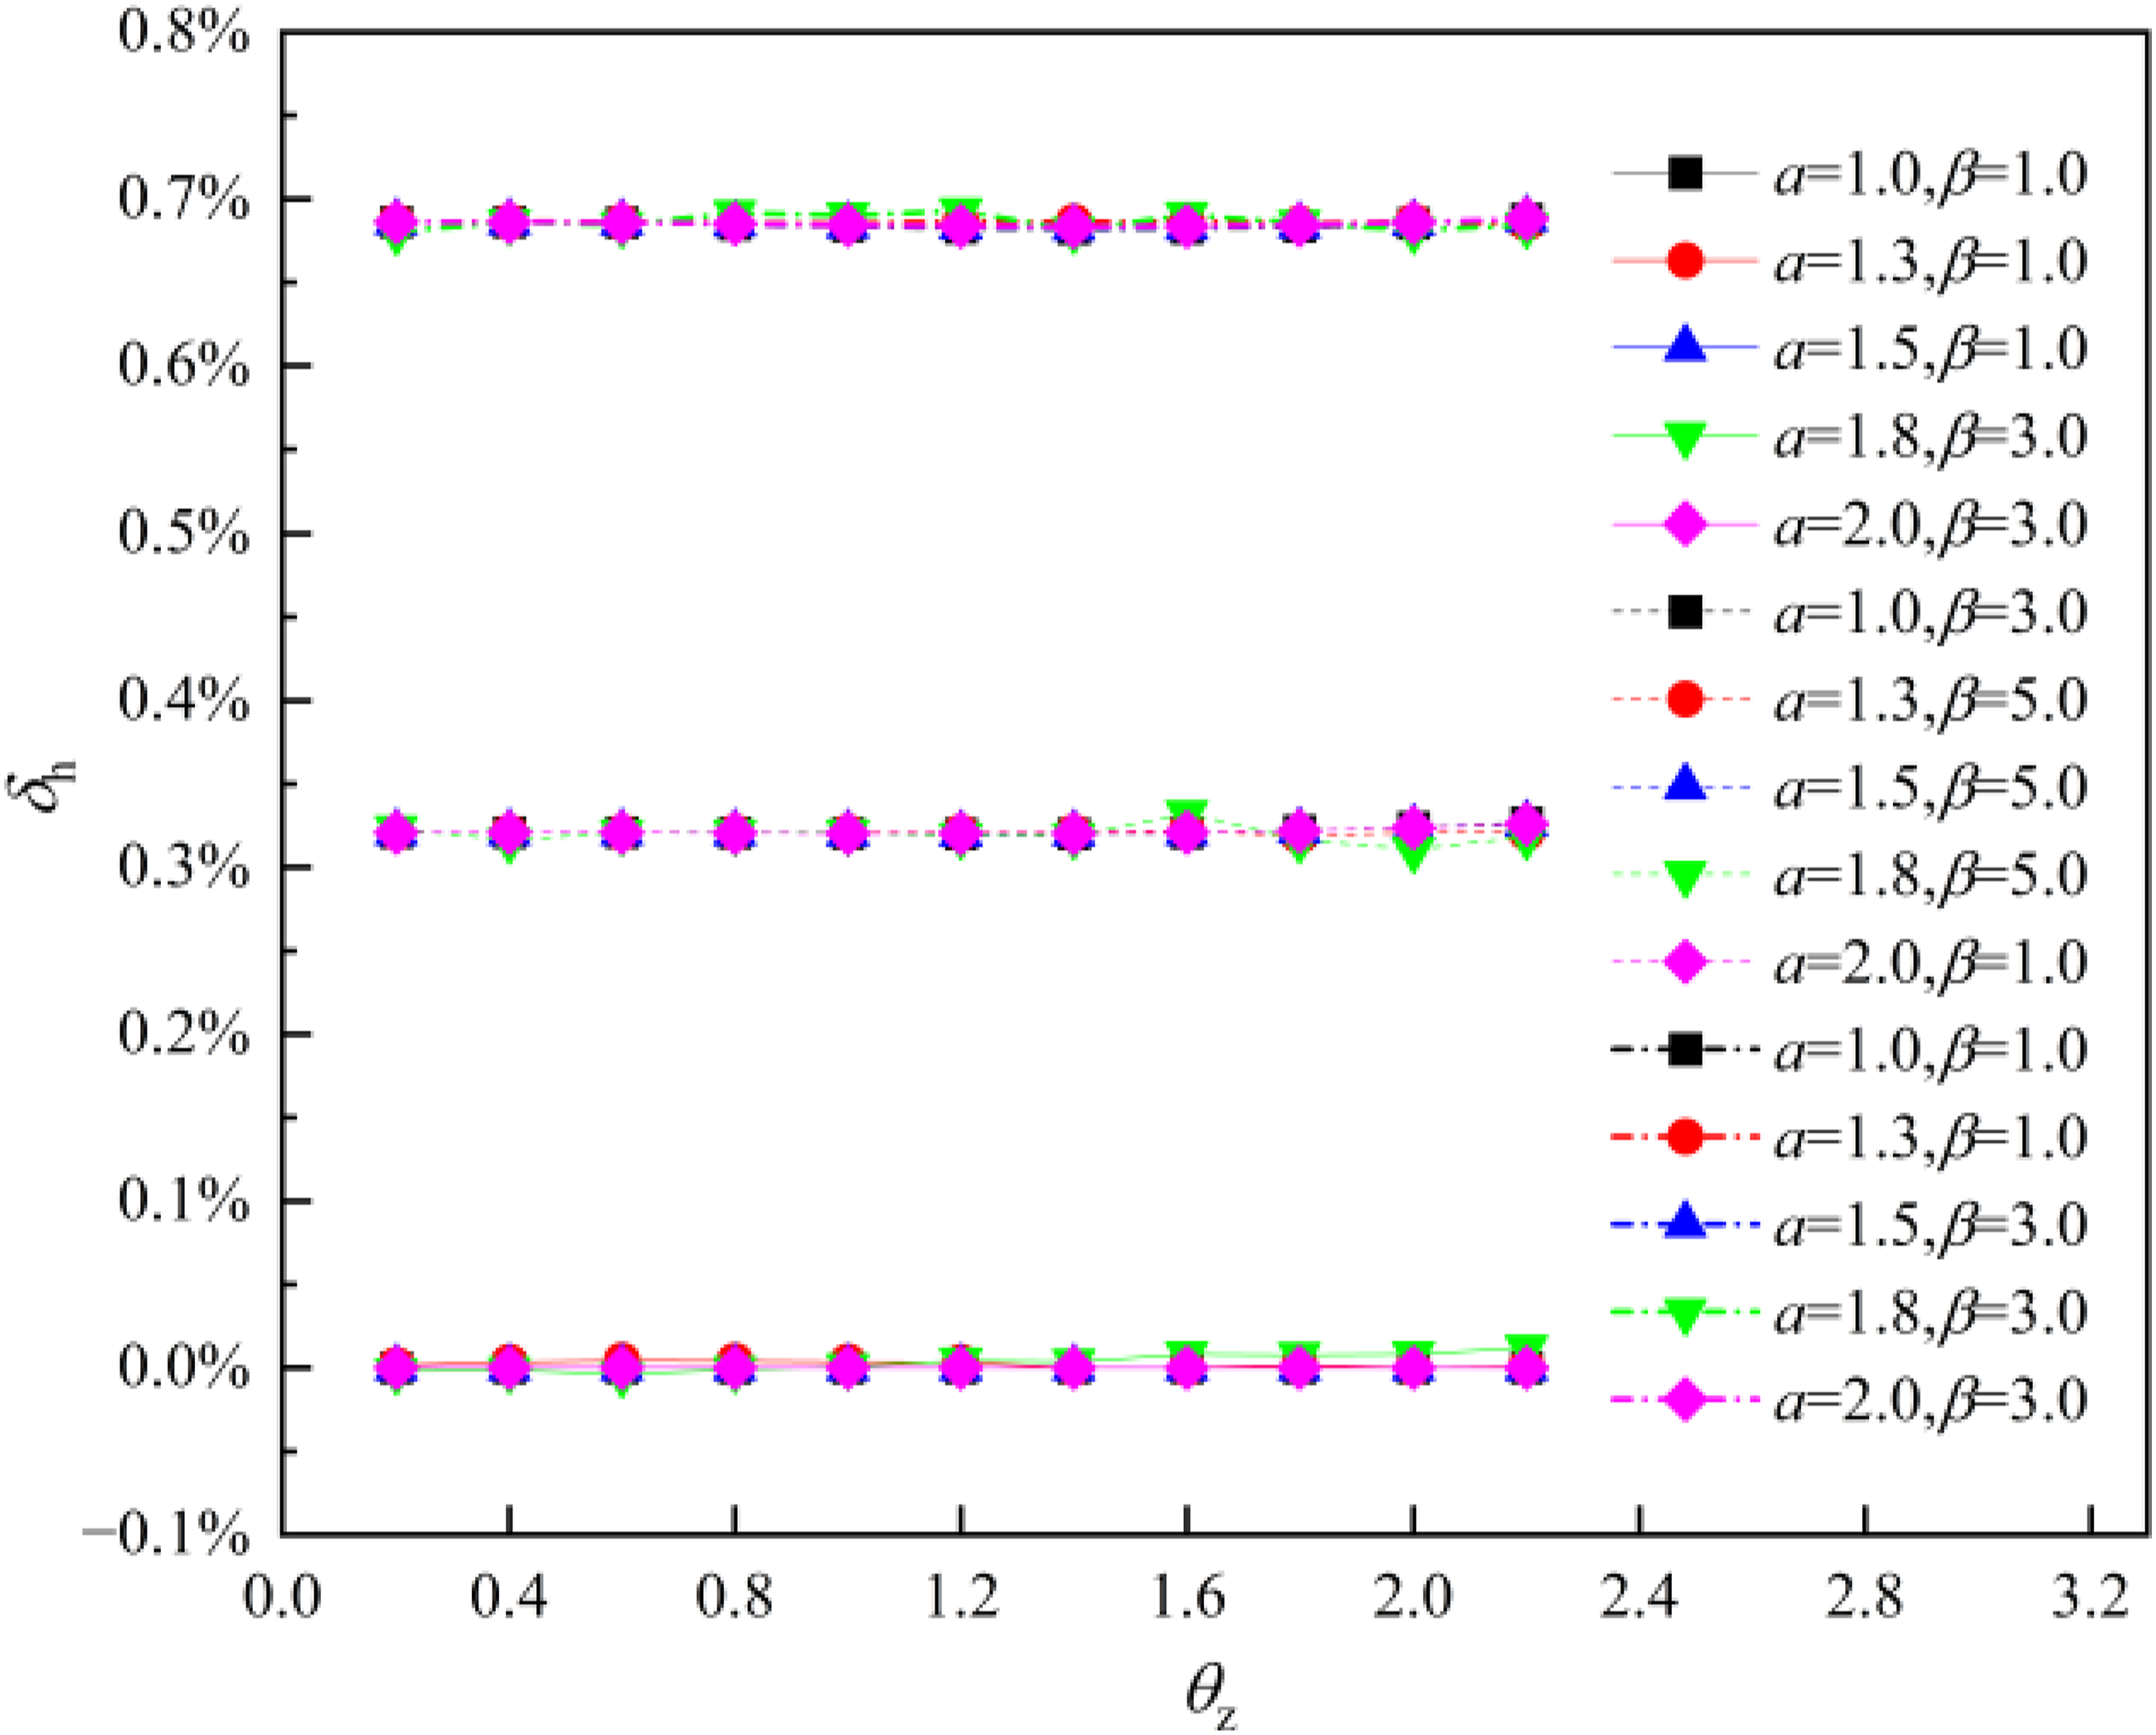
Conclusions
This paper theoretically derives the analytical expressions for the dynamic coefficients of beam components under the influence of Friedlander-type blast loading and the plastic resistance enhancement model based on the SDOF system. The results are compared and verified against finite element simulation results and current design code calculations. The influence of shape parameters and resistance enhancement coefficients on the dynamic coefficient is analyzed, leading to the following conclusions: (1) Under identical parameters related to blast loading, increasing the shape parameter a of the Friedlander-type blast loading consistently reduces the dynamic coefficient k
h
. Compared to the baseline case with a = 1.0, the value of kh decreases by 7.31%–7.91% when a = 1.3, by 11.68%–12.63% when a = 1.5, by 17.62%–20.60% when a = 1.8, and reaches a maximum reduction of 22.83% when a = 2.0. These results highlight the significant influence of the shape parameter on the dynamic response of beams, indicating that the mathematical expressions of blast loading should be carefully considered in blast-resistant design. (2) The effect of the resistance enhancement coefficient α on the dynamic coefficient kh becomes more pronounced as α increases. When α ≤ 0.01, the plastic resistance enhancement effect is negligible, and the beam component behaves nearly as an ideal elasto-plastic system. In this case, the reduction in kh does not exceed 0.69%, suggesting that the use of ideal elasto-plastic assumptions offers both computational efficiency and sufficient accuracy. When α > 0.01, the reduction in kh becomes significant; for instance, when α = 0.1, kh decreases by 6.83%, demonstrating a notable influence of resistance enhancement. However, comparative analysis indicates that the influence of the shape parameter a on kh is still more significant than that of α. (3) The ductility ratio β, which characterizes the allowable extent of plastic deformation in beam components, also markedly affects the dynamic coefficient kh. When β = 1, the maximum deviation between the present theoretical kh and the code-recommended value is 13.36%. Under high ductility conditions with β = 5, the beam enters a stage characterized by a high degree of plasticity, where the code predictions of kh become overly conservative, with a maximum deviation reaching 26.75%. These findings suggest that current design codes are more suitable for low-ductility beam components in blast-resistant applications. For detailed designs involving high-ductility elements, a multi-parameter model such as the one developed in this study should be adopted to achieve greater accuracy and reliability.
Footnotes
Author Contributions
Funding
The authors disclosed receipt of the following financial support for the research, authorship, and/or publication of this article: The authors would like to acknowledge the Fundamental Research Program of Shanxi Province (Grant No. 202203021211099), the National Natural Science Foundation of China (Grant No. 51408558), the Fundamental Research Funds for the Central Universities, CHD (Grant No. 300102215519, 300102212907), and the Hunan Traffic Science and Technology Project (No. 202510) to provide fund for conducting experiments.
Declaration of conflicting interests
The authors declared no potential conflicts of interest with respect to the research, authorship, and/or publication of this article.
Data Availability Statement
Data is available and will be shared upon request.